Article

Blockchain-Based Design of a Government Incentive Mechanism for Manufacturing Supply Chain Data Governance

1
School of Management, Tianjin University of Technology, No. 391, Binshui West Road, Tianjin 300384, China
2
School of Economics and Management, Tianjin Agricultural College, Tianjin 300384, China
*
Author to whom correspondence should be addressed.
Sustainability 2023, 15(8), 6968; https://doi.org/10.3390/su15086968
Submission received: 24 February 2023 / Revised: 31 March 2023 / Accepted: 10 April 2023 / Published: 21 April 2023

Abstract

:
In the context of “double carbon”, constructing green supply chains is the only way to implement sustainable development strategies in the manufacturing industry. This paper, therefore, examines the manufacturing supply chain for low-carbon products. More recently, the lack of technical information flow due to data barriers up and down the supply chain has led to high energy consumption, the serious waste of raw materials, and the substandard production of green products. Therefore, the level of supply chain data governance must be improved to enhance the sustainability of the supply chain. By studying blockchain-based data governance and government policy incentives for manufacturing supply chains, this study constructed an evolutionary game model based on prospect theory for the tripartite relation of government, manufacturers, and retailers. The difference between the perceived and actual value was introduced into a three-way evolutionary game model based on prospect theory to optimize the practical implications of the model. The model was then simulated using system dynamics. Through the simulation, it could be concluded that the ability of the three-way evolutionary game to reach the optimal stability point is only related to the sensitivity of the retailer’s perceived value. Additionally, the outcome of the three-way evolutionary game can be unstable, with changes in perceived value sensitivity. Finally, relevant policy recommendations are made. The innovation of this study is establishing a data governance platform that uses data governance to build green supply chains. Additionally, the government was added to the subjects of the game to explore the role of government policy in data governance and sustainable development. In addition, the evolutionary game model was incorporated with prospect theory and traditional expected utility theory, and the rational deficits and preferences of decision makers were taken into account, which brings the results closer to the reality of the situation.

1. Introduction

Recent data barriers upstream and downstream in the supply chain of low-carbon products have led to high energy consumption and a severe waste of raw materials. These have caused serious environmental damage and are detrimental to the overall sustainable development of society. Effective data governance can break down data barriers upstream and downstream in the supply chain. It facilitates data integration, supply and demand matching, value creation, and the global mastery of supply chain data resources in manufacturing supply chains [1,2,3]. Although the waste of resources and environmental degradation caused by supply chain data barriers have attracted some positive responses from the manufacturing industry, most manufacturing supply chains lack a focus on data governance. Each enterprise in the supply chain still aims to maximize its interests, ignoring coordination and communication with upstream and downstream enterprises. In addition, traditional manufacturing supply chain systems lack a platform for sharing information, which prevents the timely transmission of logistics, business flows, information flows, and capital flows. These factors have led to distorted data transfers and “data silos”, allowing for the inefficient integration of supply chain resources [4,5]. Therefore, it is urgent to accelerate the construction of a manufacturing supply chain data governance platform. However, most current manufacturing supply chains are not aware of the importance of data governance. Furthermore, market volatility, chain disruptions, and cost increases have left supply chains too precarious to care about anything else [6,7]. At this point, the government needs to play a role in order to better guide manufacturing supply chain data governance. On the one hand, the call of the government can draw the attention of the manufacturing supply chain to data governance. On the other hand, government policy incentives can drive the supply chain to actively engage in data governance.
To solve the above problems, promote the sustainable development of the manufacturing supply chain, and protect the ecological environment, this paper uses data governance to build a green supply chain. A manufacturing supply chain data governance platform, which utilizes secure and reliable blockchain technology for data governance, is established. The supply chain’s environmental, economic, and social benefits are optimized through close cooperation between companies in the supply chain and the more efficient use of resources. On this basis, we establish government incentives and construct a tripartite evolutionary game mode for the government, the manufacturer, and the retailer that incorporates prospect theory. Additionally, the difference between perceived and actual value is brought into the tripartite evolutionary game model according to prospect theory to optimize the practical meaning of the model.

2. Literature Review

“Dual carbon” and the sustainability of the supply chain, data governance, and government incentives have been the subject of extensive academic research. For example, in the area of “dual carbon” and supply chain sustainability, to achieve the “double carbon” goal as soon as possible and to promote the sustainable development of the construction supply chain, Zhu and Liu (2023) [8] investigated the risk management of the assembly building supply chain, providing new research for the sustainable development of the assembly building supply chain. To achieve the worldwide “double carbon” goal and seek the low-carbon sustainable development of the economy and society, Wang et al. (2022) [9] proposed a more appropriate and efficient method for green supplier selection. They offered an online multi-source multi-attribute reverse auction (OMSMARA) decision-making framework under mixed uncertainty from the buyer’s perspective, effectively improving procurement efficiency and reducing procurement costs and risks. In the area of data governance, Al-Ruithe et al. (2019) [10] suggested that implementing effective data governance is the only way to solve data problems. Moreover, they provided a structured, organized, and rigorous approach to understanding the latest research in data governance—a systematic literature review (SLR). Their research provided a solid guide for future data governance researchers, which helped these researchers to identify areas of data governance research that could have the most significant impact. To fully exploit the potential value of big data distributed on the Internet, Liu et al. (2020) [11] rethought a new way of data governance built on a blockchain-based paradigm of decentralized service computing. To solve the problems of centralized management, opaque information, unreliable data, and information silos in traditional traceability systems for agricultural supply chains, Yang et al. (2021) [12] further developed a blockchain-based product information storage and query system for the agricultural supply chain to establish a reliable data-sharing process. To create a more trustworthy data-sharing process, Urovi et al. (2022) [13] proposed a LUCE (License accoUntability and CompliancE) architecture. LUCE serves as a decentralized blockchain-based platform that provides transparency in data-sharing practices and enables data reuse and supports regulatory requirements. On this basis, Sheng (2021) [14] applied blockchain technology to supply chain data to build a resilient and portable information-sharing platform shared and maintained by multiple parties. Supply chain enterprises effectively reduce information asymmetry through the information-sharing platform, thus improving the efficiency of supply chain operations.
In examining government incentives, Li et al. (2022) [15] studied the impact of considering different government subsidies on production, transportation, and demand uncertainty in the vaccine supply chain. They focused on whether different government subsidies can improve the profitability of vaccine manufacturers and retailers according to the uncertain characteristics of the vaccine supply chain. To address the issue of environmental and energy independence, Yu et al. (2022) [16] examined ways in which government subsidies for electric vehicles could be used to minimize subsidy expenditure or maximize the level of adoption of electric vehicles. Jiao et al. (2022) [17] added game theory to this foundation. They studied the diffusion of new energy vehicles under Chinese incentives and developed a two-step Stackelberg game model. They focused on the impact of four key policies on the proliferation of new energy vehicles: subsidies, double points, fuel vehicle regulation, and charging piles. Additionally, Kumi et al. (2022) [18], to promote the better development of the eco-labeling system, described the interaction between government agencies, eco-labeling companies, and consumers and proposed a dynamic incentive–disincentive mechanism using the most effective and authoritative eco-labeling system in China as an example. Shen et al. (2022) [19] studied the incentive mechanism of blockchain-based information sharing in Chinese port cold chain logistics enterprises. They used evolutionary game theory to explore the evolutionary path of port cold chain logistics enterprises’ participation in information sharing by analyzing evolutionarily stable strategies. Moreover, they set up an incentive mechanism based on blockchain smart contracts to encourage cold chain logistics companies to actively participate in information sharing within the chain.
The above studies do not use data governance to achieve “dual carbon” and supply chain sustainability goals and do not consider the role of government policy incentives. Therefore, this paper uses blockchain technology for the data governance of the manufacturing supply chain by establishing a blockchain-based manufacturing supply chain data governance platform. Blockchain’s innovative technology of distributed decentralization enables the interconnection and information sharing of supply chain resources, enhancing coordination and communication between upstream and downstream enterprises. The platform builds green supply chains through data governance to achieve the goal of “double carbon” and sustainable supply chain development. This paper adds government subjects, constructs a tripartite evolutionary game model utilizing game theory, focuses on the role of government incentives in data governance, and proposes policy recommendations for data governance and the sustainable development of manufacturing supply chains.

3. Hypothesis Formulation and Model-Building

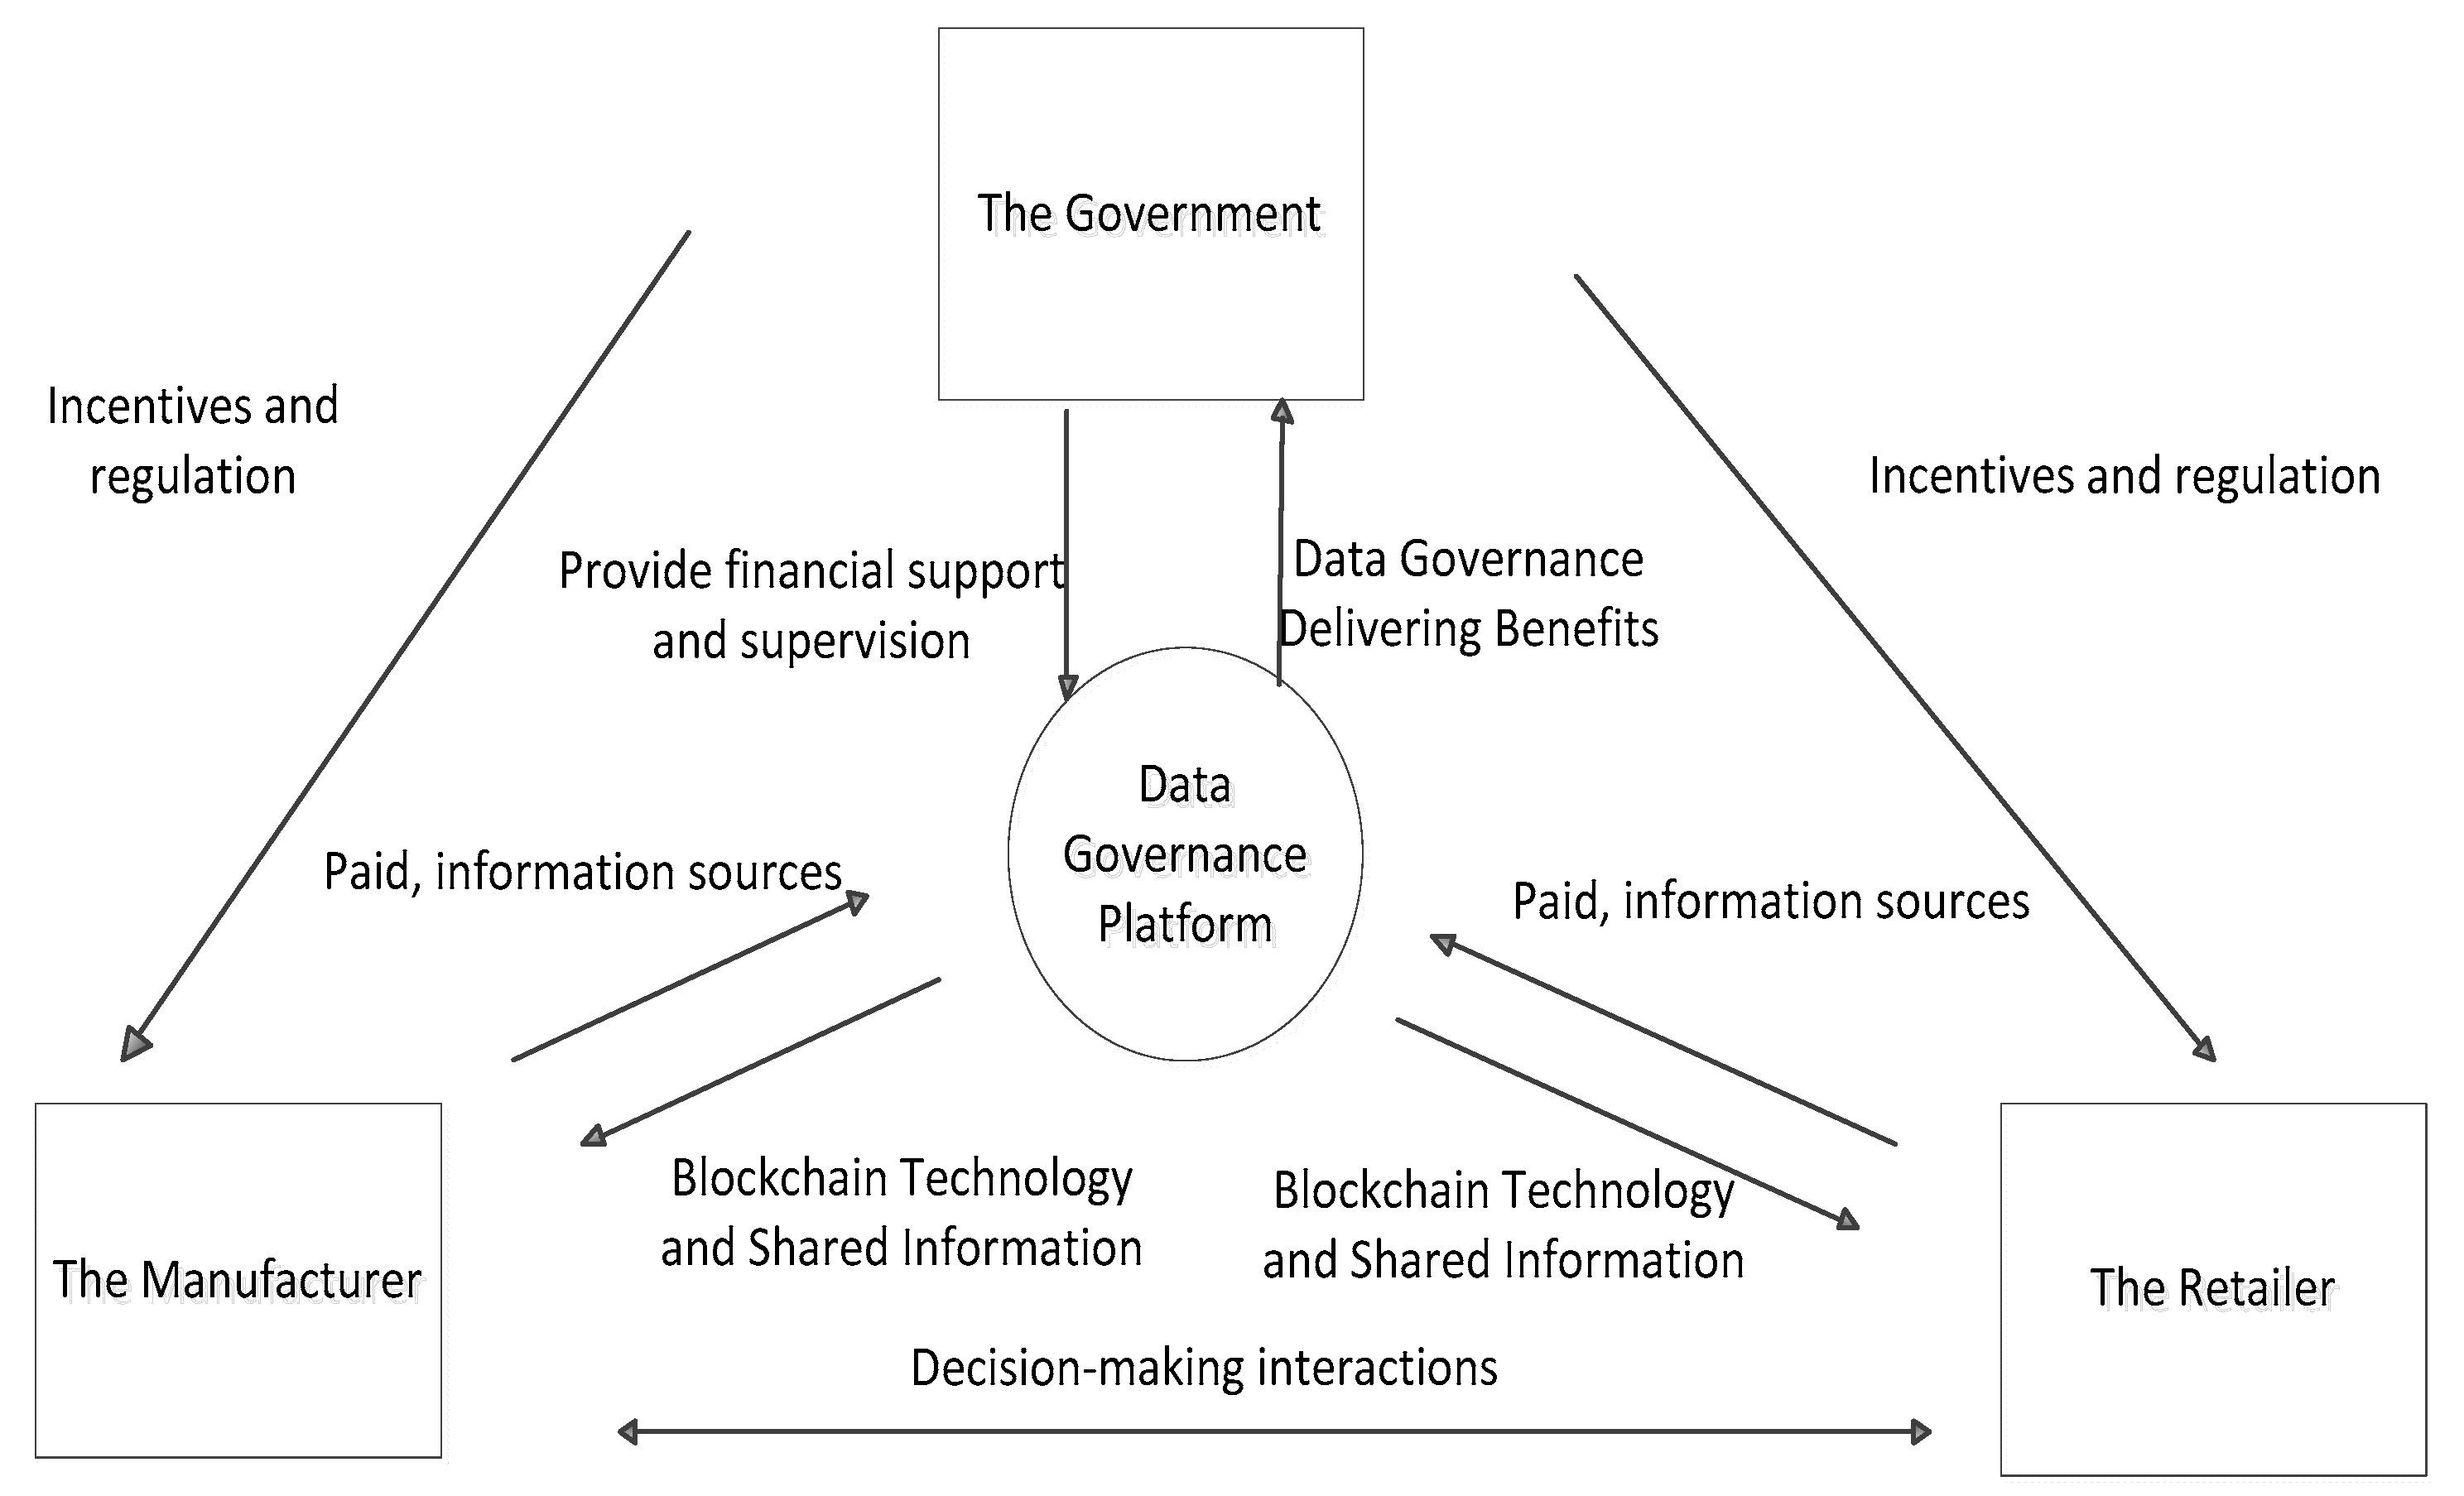
3.1. Problem Hypothesis

In this paper, a three-way evolutionary game model is developed. The model includes three stakeholders: the government, the manufacturer, and the retailer of a secondary supply chain. A government-funded data governance platform for green supply chains has been built. At the same time, the government has created incentives for the manufacturer and retailer to join the platform for data governance in the supply chain. As participants in data governance, the secondary supply chain’s manufacturer and retailer can only make the platform work if they participate. The platform utilizes blockchain technology to manage the supply chain’s data. The government uses the platform to monitor and control low-carbon green manufacturing in the supply chain. Manufacturers can use the platform to make optimal production decisions and improve technology. The platform is also helpful for retailers to keep track of the various channels of purchase and to rationalize the purchase of goods to avoid shortages and backlogs. Through this platform, the supply chain can reduce energy consumption and waste of resources and produce better green and low-carbon products. The game relationship between the government, the manufacturer, and the retailer is shown in Figure 1.

3.2. Model Hypothesis

Based on the above analysis, this paper constructs a tripartite evolutionary game model involving the government, the manufacturer, and the retailer and proposes the following hypotheses. All parameters in the model are given in Table 1.
Assumption 1.
The government, the retailer, and the manufacturer have an economic interest in each other and are economic agents who seek to maximize their interests and are entirely rational [20].
Assumption 2.
The platform provides the manufacturer and the retailer with full access to the data.
Assumption 3.
There are two strategic options for the government sector: “intervention” and “non-intervention”. The probability of the government department picking “intervention” is x, and the probability of choosing “non-intervention” is 1 − x. Two strategic options are available to the manufacturer and retailer: “joining” and “not joining”. The probability of the manufacturer and the retailer choosing “joining” is y, z, and the probability of choosing “not joining” is 1 − y and 1 − z, respectively. In this game system, x, y, z ∈ [0,1] varies with time [21].
Assumption 4.
The government can benefit economically from this data governance platform by intervening in the platform. When the government chooses to intervene in the platform, the government will provide corresponding corporate financial subsidies and financial reductions to companies that join the data governance platform [22]. On the other hand, it will not provide financial subsidies or tax breaks to companies as long as the government does not interfere with the platform. It will regulate only the platform and companies.
Assumption 5.
When the government intervenes in the platform, the benefits of the manufacturer joining the platform include financial subsidies, tax breaks, and revenues earned through the platform. In addition, the manufacturer can benefit from information gaps when it does not join the platform. At this point, if the manufacturer is not compliant with data governance, resulting in wasted resources and non-conforming green and low-carbon products, the government will issue a fine. Let the probability of the manufacturer and the retailer data governance non-compliance be  m  and  m [ 0,1 ] . Without government intervention, the manufacturer’s income will be derived only from the platform’s revenue. Additionally, when the manufacturer chooses to join the platform and the retailer does not, the manufacturer will lose money because of the lack of information about the retailer. Additionally, the manufacturer will be required to pay a fee to become a platform member.
Assumption 6.
When the government intervenes in the platform, the benefits for the retailer to join the platform include financial subsidies, tax breaks, and revenues earned through the platform. The retailer can benefit from information gaps when not joining the platform. At this point, if the retailer is not compliant with data governance, resulting in wasted resources, the government will issue a fine. Moreover, when the retailer joins and the manufacturer does not, the retailer will incur losses due to the lack of information about the manufacturer. Additionally, the retailer will be required to pay a fee to become a platform member.

3.3. Model Construction

According to the above assumptions, Table 2 and Table 3 show the payoff matrices for the manufacturer, the retailer, and the government. PX represents the government revenue, PY is the manufacturer’s revenue, and PZ is the retailer’s revenue.
(1) The government: The expected return on the government intervention platform is U x 1 , the expected return on the government non-intervention platform is U x 2 , and the average expected return is U x . Based on Table 2 and Table 3, it can be seen that
U x 1 = y z ( E x C x 2 a b r E y b r E z ) + z ( 1 y ) ( E x C x a b r E z + m T ) + y ( 1 z ) ( E x C x a b r E y + m J ) + ( 1 y ) ( 1 z ) [ E x C x + m ( T + J ) ]
U x 1 = y z ( C x ) + z ( 1 y ) ( C x ) + y ( 1 z ) ( C x ) + ( 1 y ) ( 1 z ) ( C x )
U x = x U x 1 + ( 1 x ) U x 2
The replication dynamics equation for the government is obtained from the above analysis, as follows:
F x = d x d t = x U x 1 U x 2 = x ( 1 x ) ( U x 1 U x 2 ) = x ( 1 x ) [ z ( a b r E z m J ) + y a b r E y m T + E x + m ( T + J ) ]
(2) The manufacturer: The expected return of the manufacturer joining the platform is U y 1 , the expected return of the manufacturer not joining the platform is U y 2 , and the average expected return is U y . Based on Table 2 and Table 3, it can be seen that
U y 1 = x z [ E y ( 1 r ) + b r E y ( C y a ) ] + x ( 1 z ) [ E y ( 1 r ) + b r E y ( C y a ) G ] + z ( 1 x ) [ E y ( 1 r ) C y ] + ( 1 x ) ( 1 z ) [ E y ( 1 r ) C y G ]
U y 2 = x z ( Q y m T ) + x ( 1 z ) ( Q y m T ) + z ( 1 x ) Q y + ( 1 x ) ( 1 z ) Q y
U y = y U y 1 + ( 1 y ) U y 2
The replication dynamics equation for the manufacturer is obtained from the above analysis, as follows:
F ( y ) = d y d t = y ( U y 1 U y 2 ) = y ( 1 y ) ( U y 1 U y 2 ) = y ( 1 y ) [ x ( a + b r E z + m T ) + E y ( 1 r ) C y G Q y + z G ]
(3) The retailer: The expected return of the retailer joining the platform is U z 1 , the expected return of the retailer not joining the platform is U z 2 , and the average expected return is U z . Based on Table 2 and Table 3, it can be seen that
U z 1 = x y [ E z ( 1 r ) + b r E z ( C z a ) ] + x ( 1 y ) [ E z ( 1 r ) + b r E z ( C z a ) L ] + y ( 1 x ) [ E z ( 1 r ) C z ] + ( 1 x ) ( 1 y ) [ E z ( 1 r ) C z L ]
U z 2 = x y ( Q z m J ) + x ( 1 y ) ( Q z m J ) + y ( 1 x ) Q z + ( 1 x ) ( 1 y ) Q z
U z = z U z 1 + ( 1 z ) U z 2
The replication dynamics equation for the retailer is obtained from the above analysis, as follows:
F ( z ) = d z d t = z ( U z 1 U z 2 ) = z ( 1 z ) ( U z 1 U z 2 ) = z ( 1 z ) [ x ( a + b r E z + m J ) + E z ( 1 r ) C z L Q z + y L ]
A three-dimensional dynamical system is obtained by combining the differential Equations (10)–(12):
F x = x 1 x z a b r E z m J + y a b r E y m T + E x + m T + J F y = y 1 y x a + b r E y + m T + E y 1 r C y G Q y + z G F ( z ) = z ( 1 z ) [ x ( a + b r E z + m J ) + E z ( 1 r ) C z L Q z + y L ]

4. Analysis of the Evolutionary Game Mode and Numerical Study

4.1. Analysis of Evolutionarily Optimal Stabilization Strategies

The stability of the equilibrium point of the group force system expressed by the differential equation can be obtained by analyzing the local stability of the Jacobi (Jacobian) matrix of this system [23], which is given by
T = F ( x ) x F ( x ) y F ( x ) z F ( y ) x F ( y ) y F ( y ) z F ( z ) x F ( z ) y F ( z ) z = ( 1 2 x ) [ y ( a b r E y m T ) + z ( a b r E z m J ) + E x + m ( T + J ) ] x ( 1 x ) ( a b r E y T ) x ( 1 x ) ( a b r E z m J ) y ( 1 y ) [ b r E y + a + m T ] ( 1 2 y ) [ x ( b r E y + a + m T ) + E y ( 1 r ) C y G Q y + z G ] y ( 1 y ) G z ( 1 z ) ( b r E z + a + m J ) z ( 1 z ) L ( 1 2 z ) [ x ( b r E z + a + m J ) + E z ( 1 r ) C z L Q z + y L ]
Letting F ( x ) = F ( y ) = F ( z ) = 0 , the local equilibrium points of the system can be found as H1 (0, 0, 0), H2 (0, 0, 1), H3 (0, 1, 0), H4 (0, 1, 1), H5 (1, 0, 0), H6 (1, 0, 1), H7 (1, 1, 0), and H8 (1, 1, 0). According to evolutionary game theory, the equilibrium point is the ESS point of the system only when the Jacobi determinant is greater than zero and the eigenvalues (traces) are less than zero. In other words, if an asymmetric game’s equilibrium is a stable evolutionary strategy, it must also be a strict Nash equilibrium, which is a pure strategy equilibrium for an asymmetric game [24].
Stability analysis of equilibrium points:
Situation 1: When, m T + m J + E x < 0 , E y 1 r < G + C y + Q y and E z < L + C z + Q z , the equilibrium point H1 (0, 0, 0) is the system’s evolutionarily stable strategy (ESS). At this point, the benefits to the retailer and the manufacturer of joining the platform are less than the benefits of not joining, so both choose a “no-joining” strategy. Similarly, the benefits to the government of not intervening in the platform are greater than the benefits of intervening in the platform, so they choose not to intervene.
Situation 2: When a + b r E z > m T + E x , E y 1 r C y < Q y and E z 1 r L C z > Q z , the equilibrium point H1 (0, 0, 1) is the system’s evolutionarily stable strategy (ESS). In this case, the manufacturer chooses the “no joining” strategy as the benefits of joining the platform are less than those of not joining. The retailer chooses the “joining” strategy as they benefit more from joining the platform than from not joining. The government decides not to intervene in the platform as the benefits of not intervening outweigh the benefits of intervening in the platform.
Situation 3: When a + b r E y > m J + E x , E y 1 r G C y > Q y and E z 1 r C z < Q z , the equilibrium point H1 (0, 1, 0) is the system’s evolutionarily stable strategy (ESS). In this case, the manufacturer chooses the “joining” strategy because the benefits of joining the platform outweigh those of not joining. The retailer chooses the “no-joining” strategy as they benefit less from joining the platform than from not joining. The government decides not to intervene in the platform because the benefits of not intervening are greater than the benefits of intervening.
Situation 4: When a + b r E y + a + b r E z > E x , E y 1 r C y > Q y and E z 1 r C z > Q z , the equilibrium point H1 (0, 1, 1) is the evolutionarily stable strategy (ESS) of the system. At this point, the manufacturer and the retailer choose the “joining” strategy because the benefits of joining the platform outweigh the benefits of not joining. The benefits of government intervention are smaller than the benefits of not intervening in the platform, so they choose not to intervene in the platform.
Situation 5: When m T + m J + E x > 0 , E y ( 1 r ) + a + b r E y C y G < Q y m T , and E z 1 r + a + b r E y C z L < Q z m J , the equilibrium point H1 (1, 0, 0) is the evolutionarily stable strategy (ESS) of the system. Now, the manufacturer and the retailer have less to gain by joining the platform than by not joining it, so both choose not to join. On the other hand, the government decides to intervene in the platform because it has more to gain than not intervening and can better regulate companies’ data governance practices.
Situation 6: When a + b r E z < m T + E x , E y ( 1 r ) + a + b r E y C y < Q y m T , and E z 1 r + a + b r E z C z L > Q z m J , the equilibrium point H1 (1, 0, 1) is the system’s evolutionarily stable strategy (ESS). At this point, the manufacturer benefits less from joining the platform than from not joining it and therefore chooses not to join it, while the retailer benefits more from joining the platform than from not joining it and therefore decides to join it. On the other hand, the government has more to gain from intervening in the platform and therefore decides to intervene.
Situation 7: When a + b r E z < m J + E x , E y ( 1 r ) + a + b r E y C y G > Q y m T , and E z 1 r + a + b r E z C z < Q z m J , the equilibrium point H1 (1, 1, 0) is the system’s evolutionarily stable strategy (ESS). At this point, the manufacturer benefits more from joining the platform than not and therefore chooses to join the platform. In contrast, the retailer benefits less from joining the platform than not and therefore chooses not to join the platform. Conversely, the government decides to intervene in the platform because the benefits of doing so are greater.
Situation 8: When E x ( a + b r E y + a + b r E z ) > 0 , E y ( 1 r ) + a + b r E y C y > Q y m T , and E z 1 r + a + b r E z C z > Q z m J , the equilibrium point H1 (1, 1, 1) is the system’s evolutionarily stable strategy (ESS). Now, the manufacturer and the retailer benefit more from joining the platform than from not joining it, so both choose to join it. Similarly, the benefits of government intervention in the platform outweigh the benefits of not intervening in the platform. Hence, the government chooses to intervene in the platform.
Although the government invests in building the platform to support the supply chain for data governance, the government should be the guide for data governance. The government should intervene in the platform when it is immature and guide supply chain enterprises to actively join it so the platform can run stably as soon as possible. When the platform can operate steadily and autonomously, the government should not interfere with it. Instead, the government should let the platform and the whole supply chain carry out data governance autonomously.
When the evolutionarily stable point of the local government–manufacturer–retailer game is (1, 1, 1), the government plays a leading intervention role in the data governance efforts of the supply chain. At this point, because the additional benefits of joining the platform outweigh the costs, the manufacturer and the retailer converge and eventually stabilize on the behavioral strategy of “joining” and actively promote supply chain data governance. At the same time, under the premise of (1, 1, 1), the social and individual interests are consistent, and both can reach the maximum. When the evolutionarily stable point of the local government–manufacturer–retailer game is (0, 1, 1), the government does not intervene in the platform. At this point, the additional benefits to the manufacturer and the retailer of joining the platform outweigh the costs and both choose to join. The platform operates autonomously and stably, and the whole supply chain data governance is promoted in an orderly manner.
Therefore, the article only chooses to investigate the evolutionary conditions and evolutionary paths of the tripartite evolutionary game model under (1, 1, 1) and (0, 1, 1) conditions. Bringing (1, 1, 1) into the Jacobian matrix of Equation (14), we obtain
T = 2 a + b r E y + b r E z E x 0 0 0 C y + Q y b r E y a m T E y ( 1 r ) 0 0 0 C z + Q z b r E z a m J E z ( 1 r )
The eigenvalues of this Jacobian matrix are I 1 = 2 a + b r E y + b r E z E x , I 2 = C y + Q y b r E y a m T E y ( 1 r ) , and I 3 = Q z + C z a m J b r E z E z 1 r .
Based on the Lyapunov equilibrium thesis, the system is stable if all eigenvalues have non-positive real parts; otherwise, the system is unstable [25,26]. Therefore, if we want this tripartite evolutionary game model to be stable at the point (1, 1, 1), we need to satisfy the following conditions: 2 a + b r E y + b r E z E x < 0 , C y + Q y b r E y a m T E y ( 1 r ) < 0 , and Q z + C z a m J b r E z E z 1 r < 0 . At this point, the government intervenes in the platform and manages it to ensure that supply data governance is carried out in an orderly and efficient manner. The manufacturer and the retailer choose to join the platform and actively participate in data governance.
Bringing (0, 1, 1) into the Jacobian matrix of Equation (14), we obtain
T = E x 2 a b r E y b r E z 0 0 0 C y + Q y E y ( 1 r ) 0 0 0 C z + Q z E z ( 1 r )
The eigenvalues of this Jacobian matrix are I 1 = E x 2 a b r E y b r E z , I 2 = C y + Q y E y 1 r , and I 3 = Q z + C z E z 1 r . Similarly, if we want this tripartite evolutionary game model to be stable at the point (0, 1, 1), the conditions that need to be satisfied are E x 2 a b r E y b r E z < 0 , C y + Q y E y 1 r < 0 and Q z + C z E z 1 r < 0 . At this point, the government does not interfere with the platform but only regulates it. The platform can operate efficiently on its own. The manufacturer and retailer in the supply chain also choose to join the platform and actively participate in data governance.

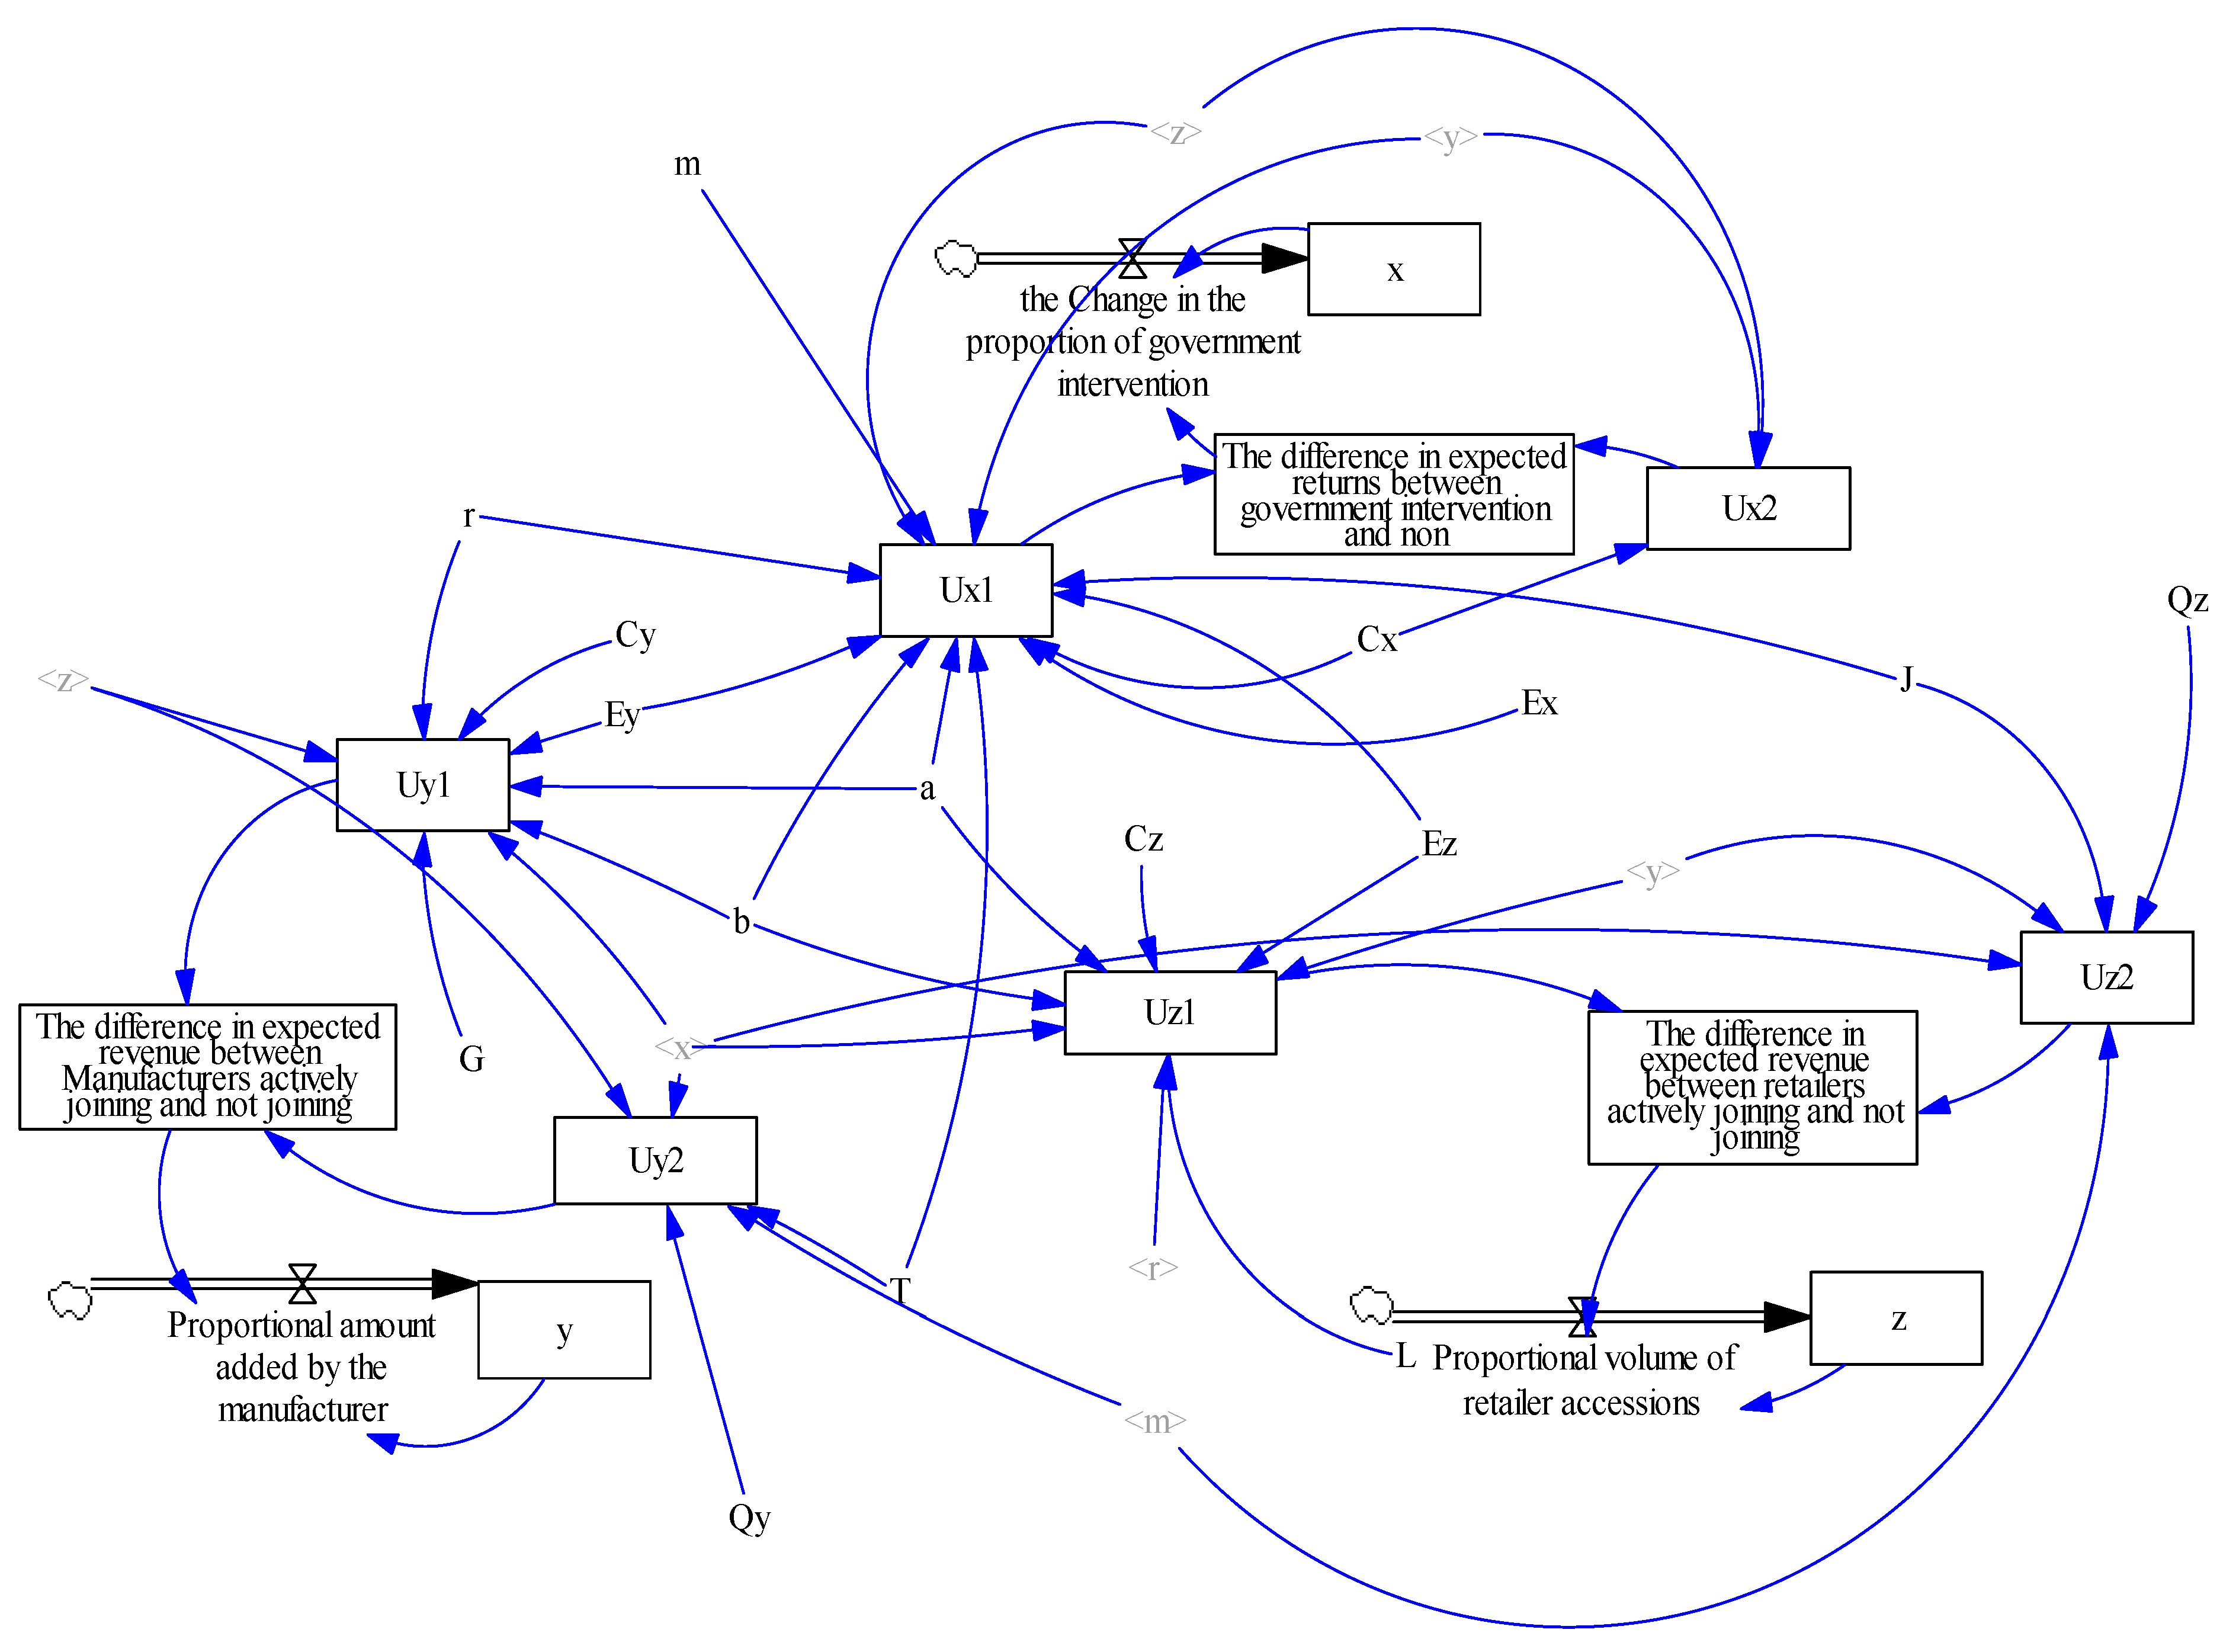
4.2. Model of System Dynamics
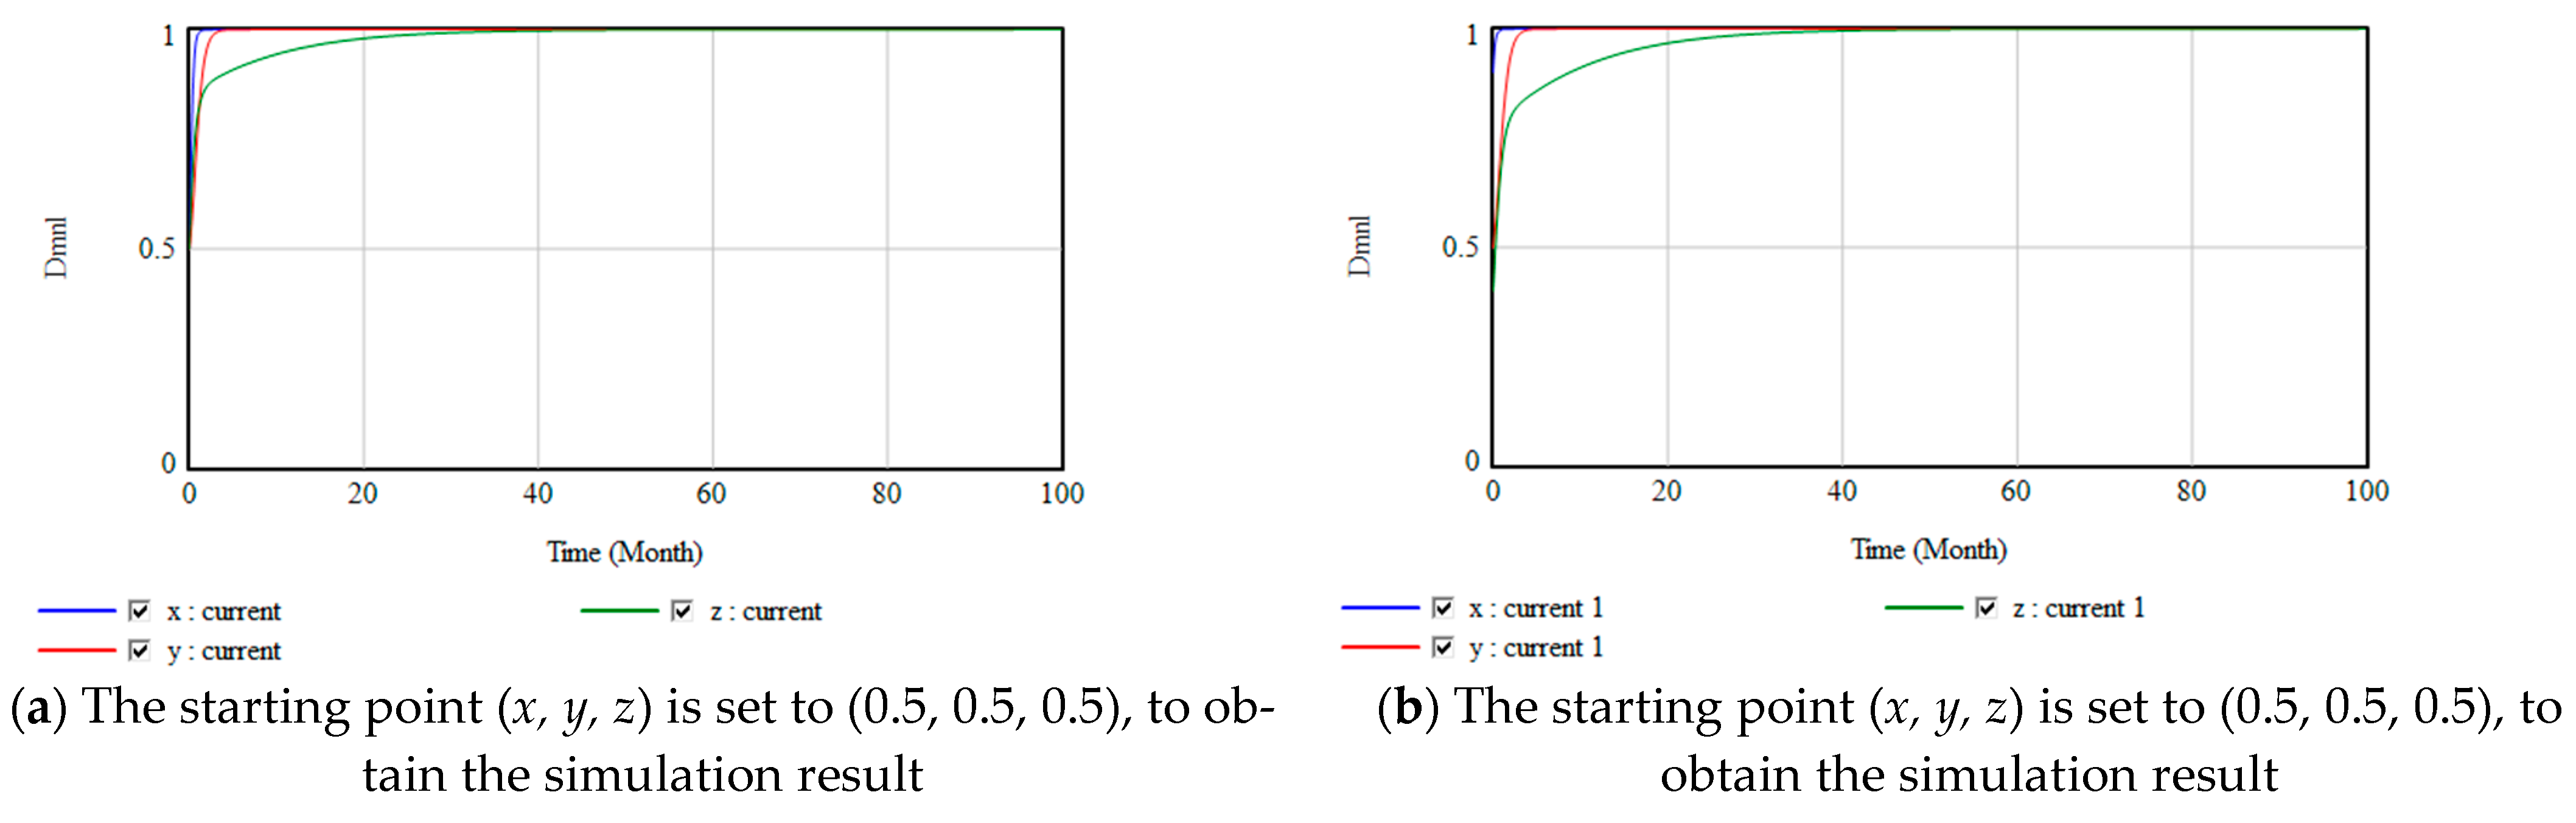
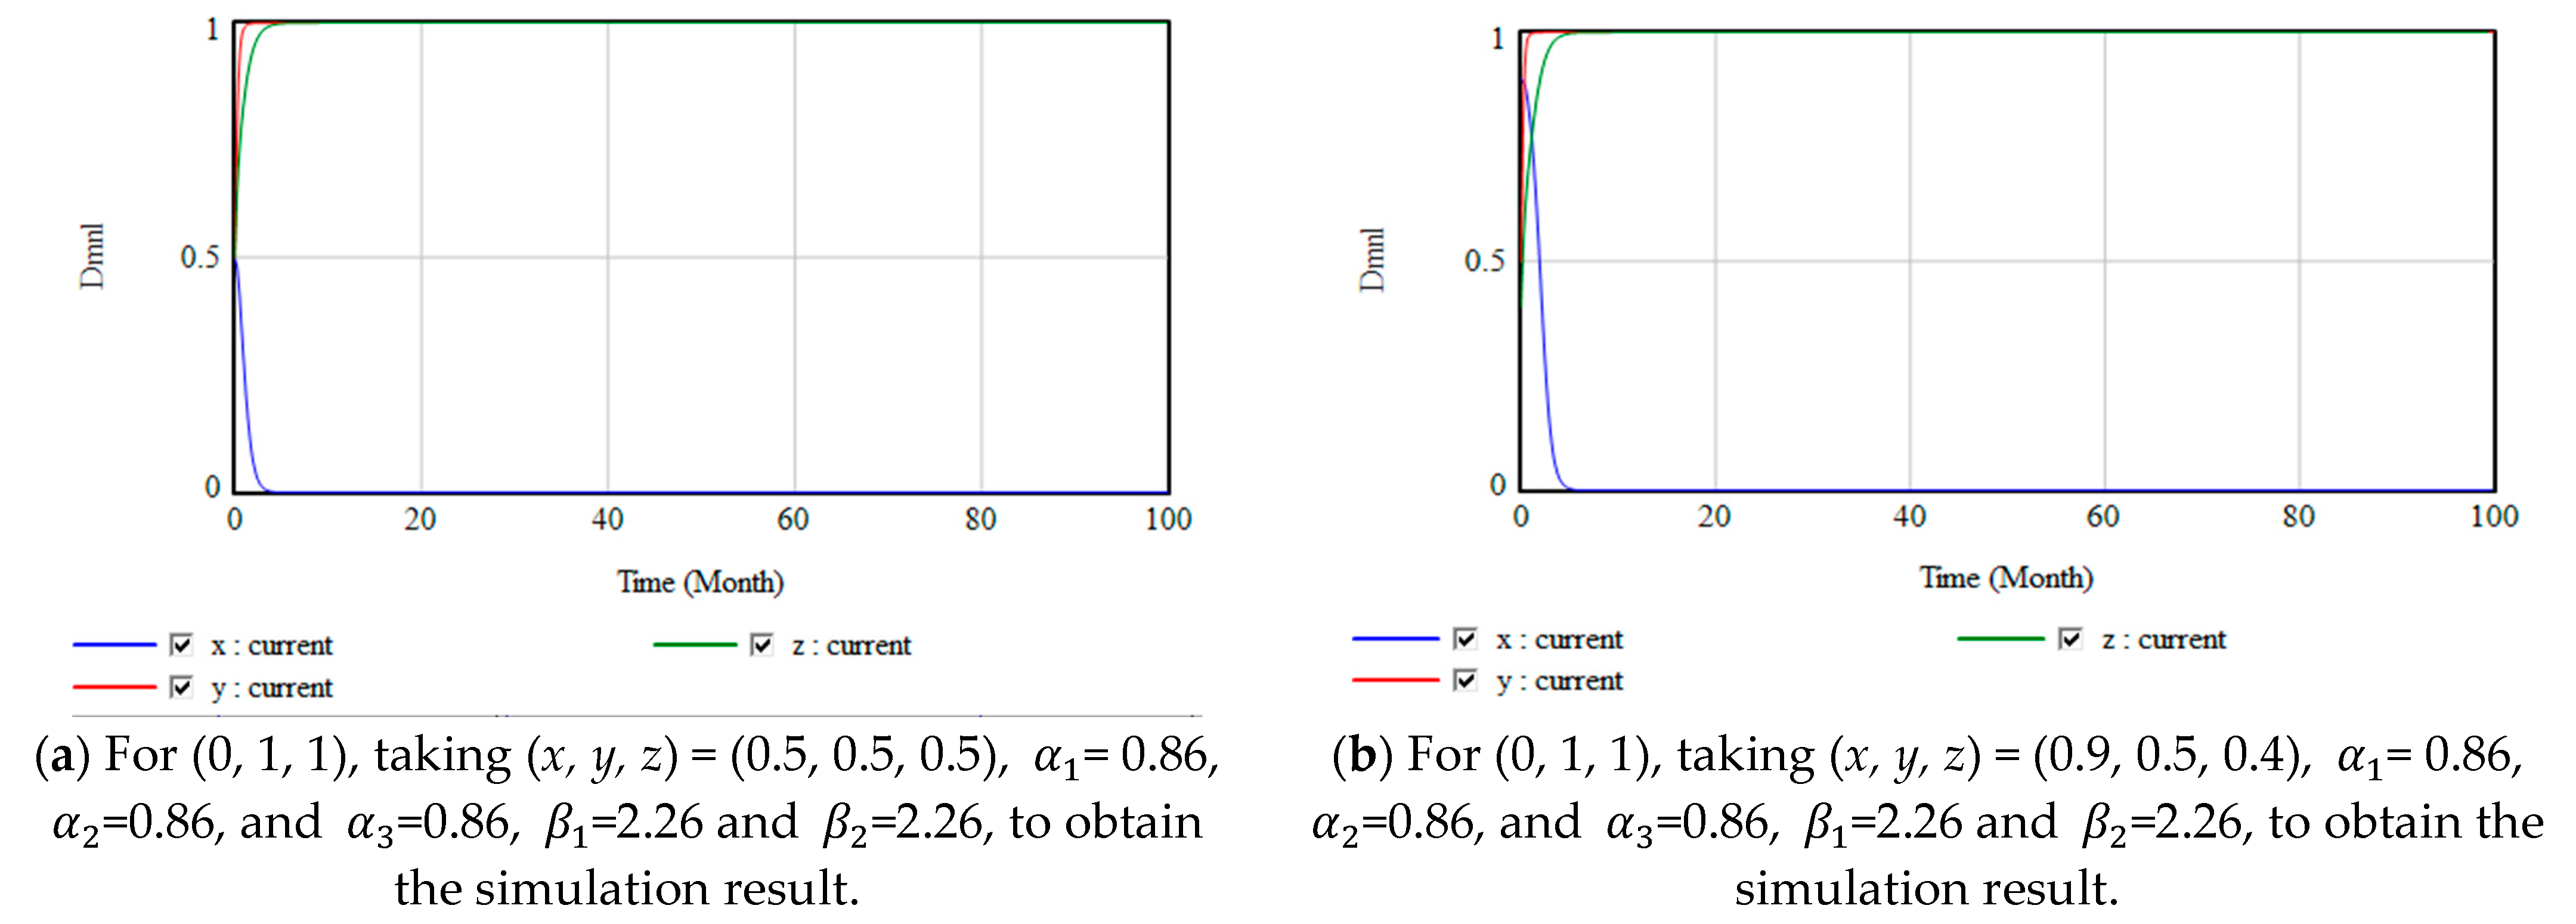
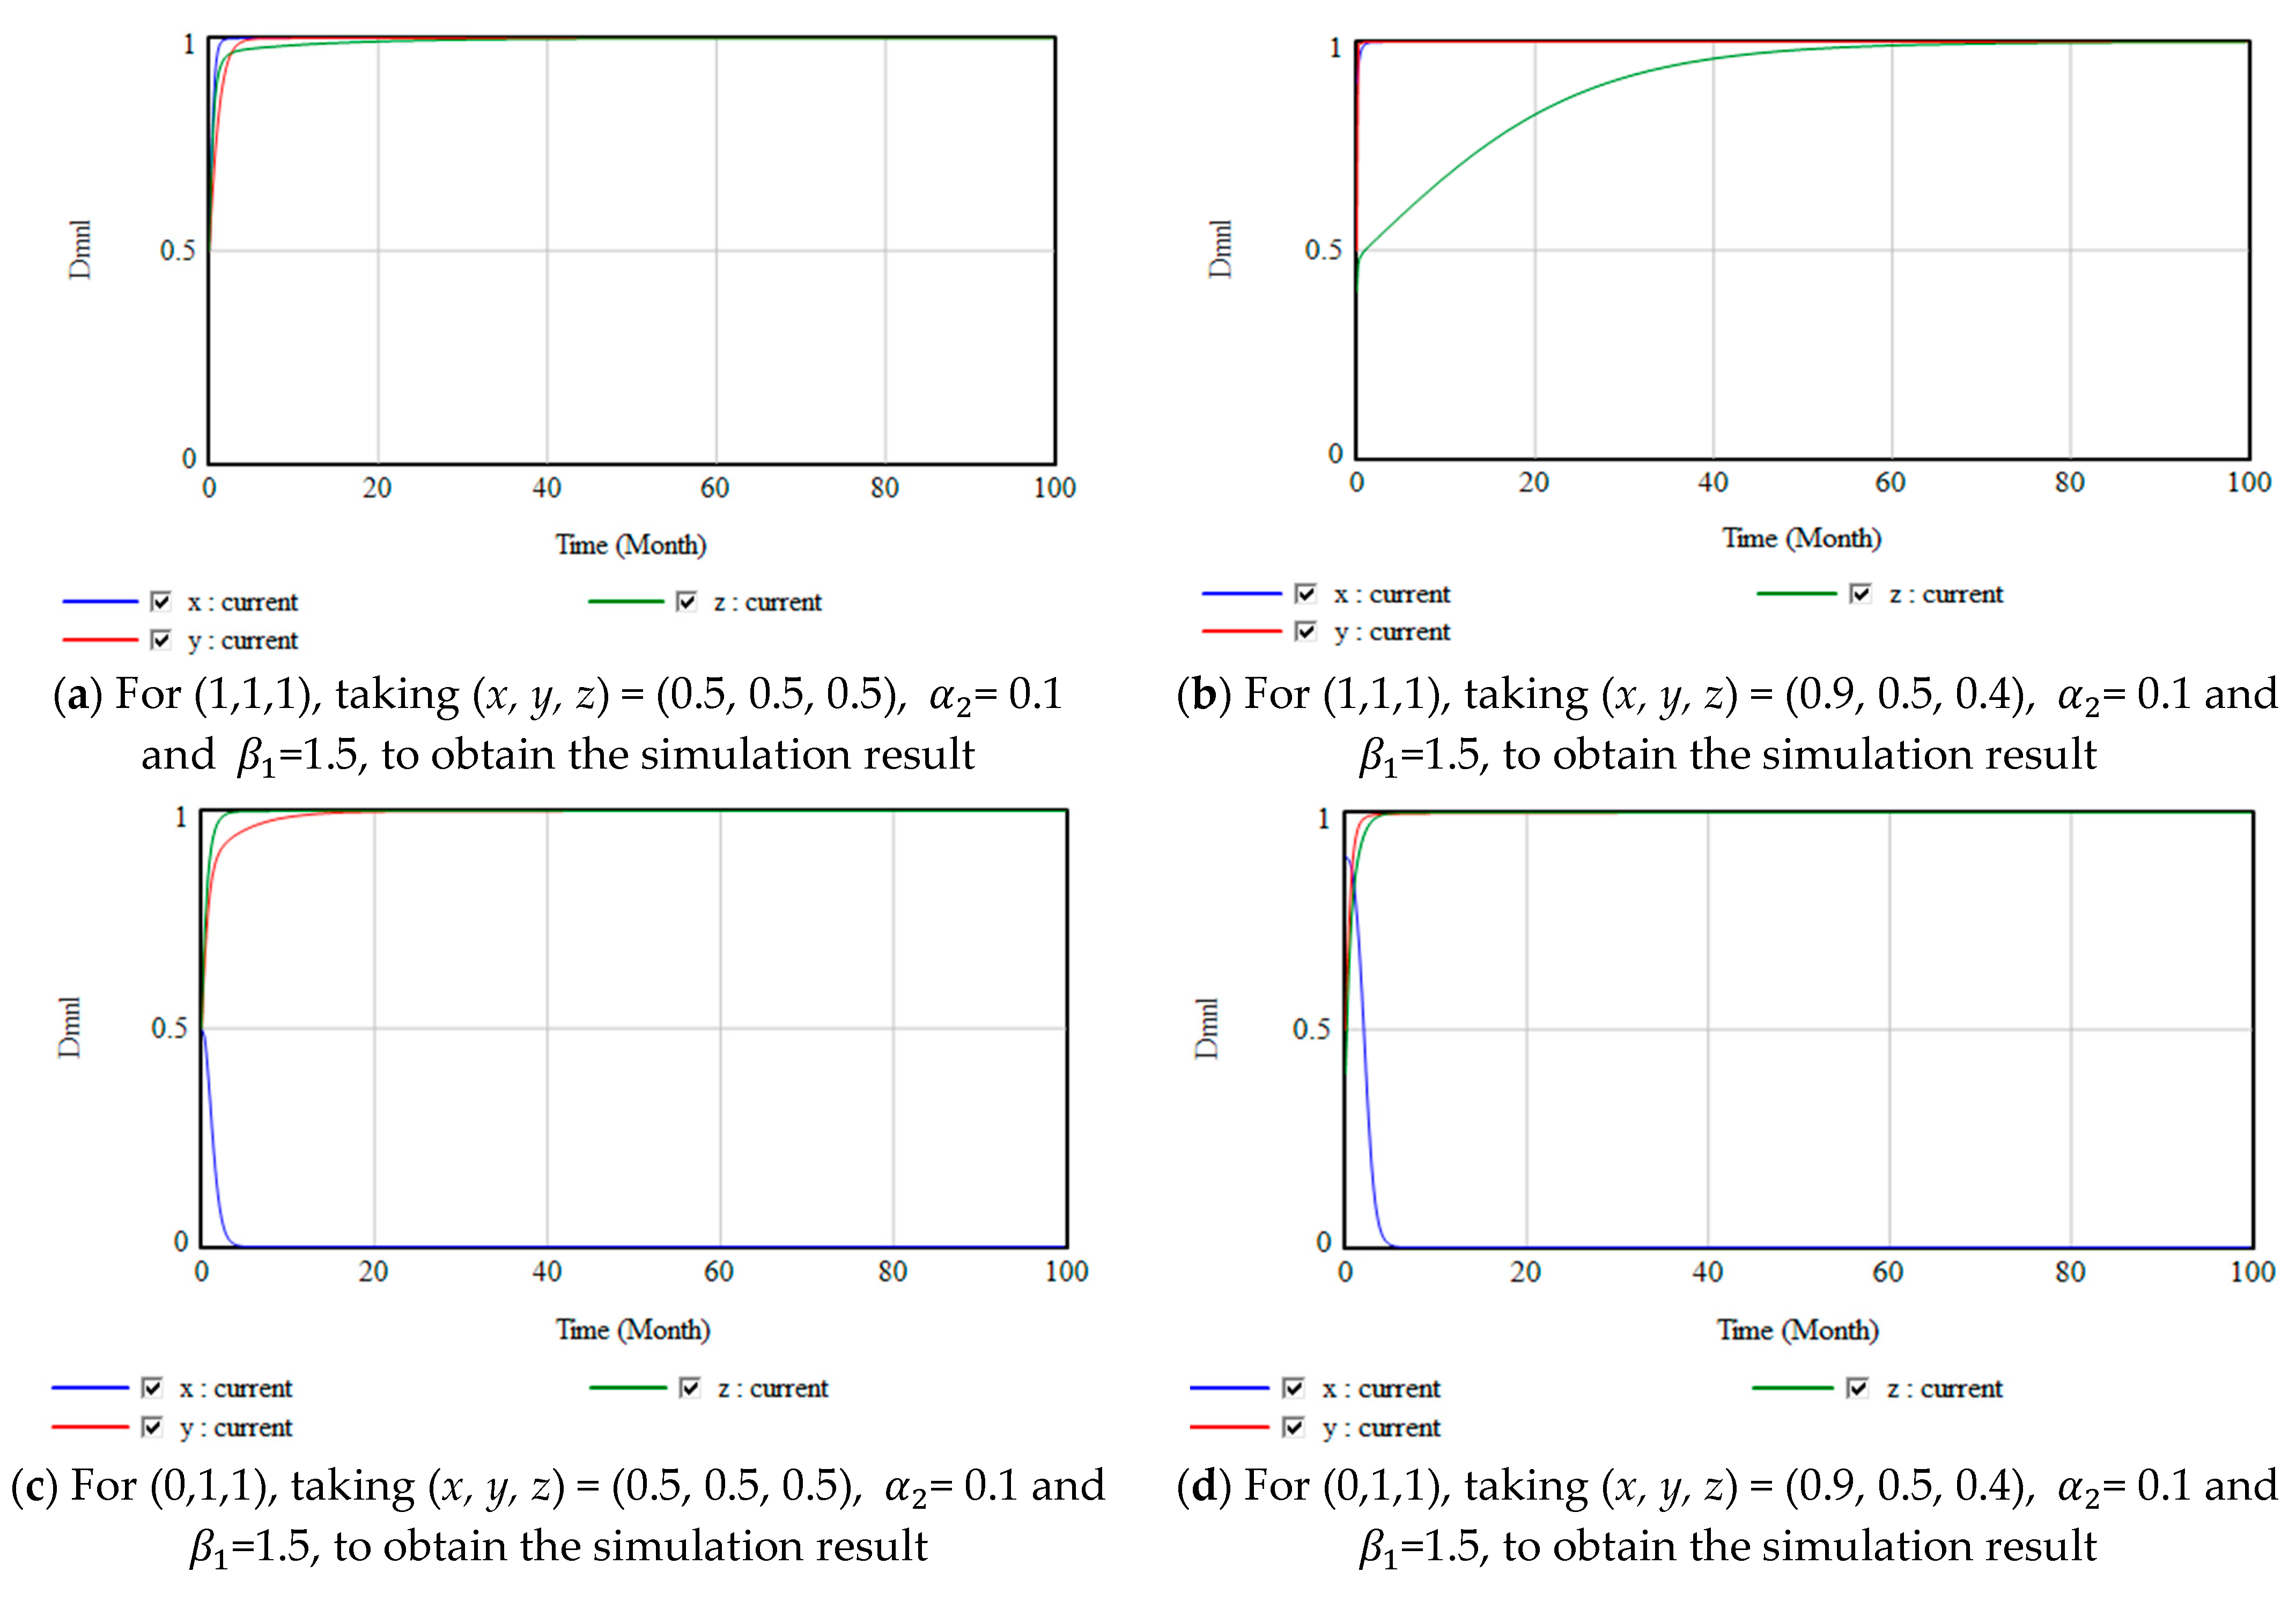
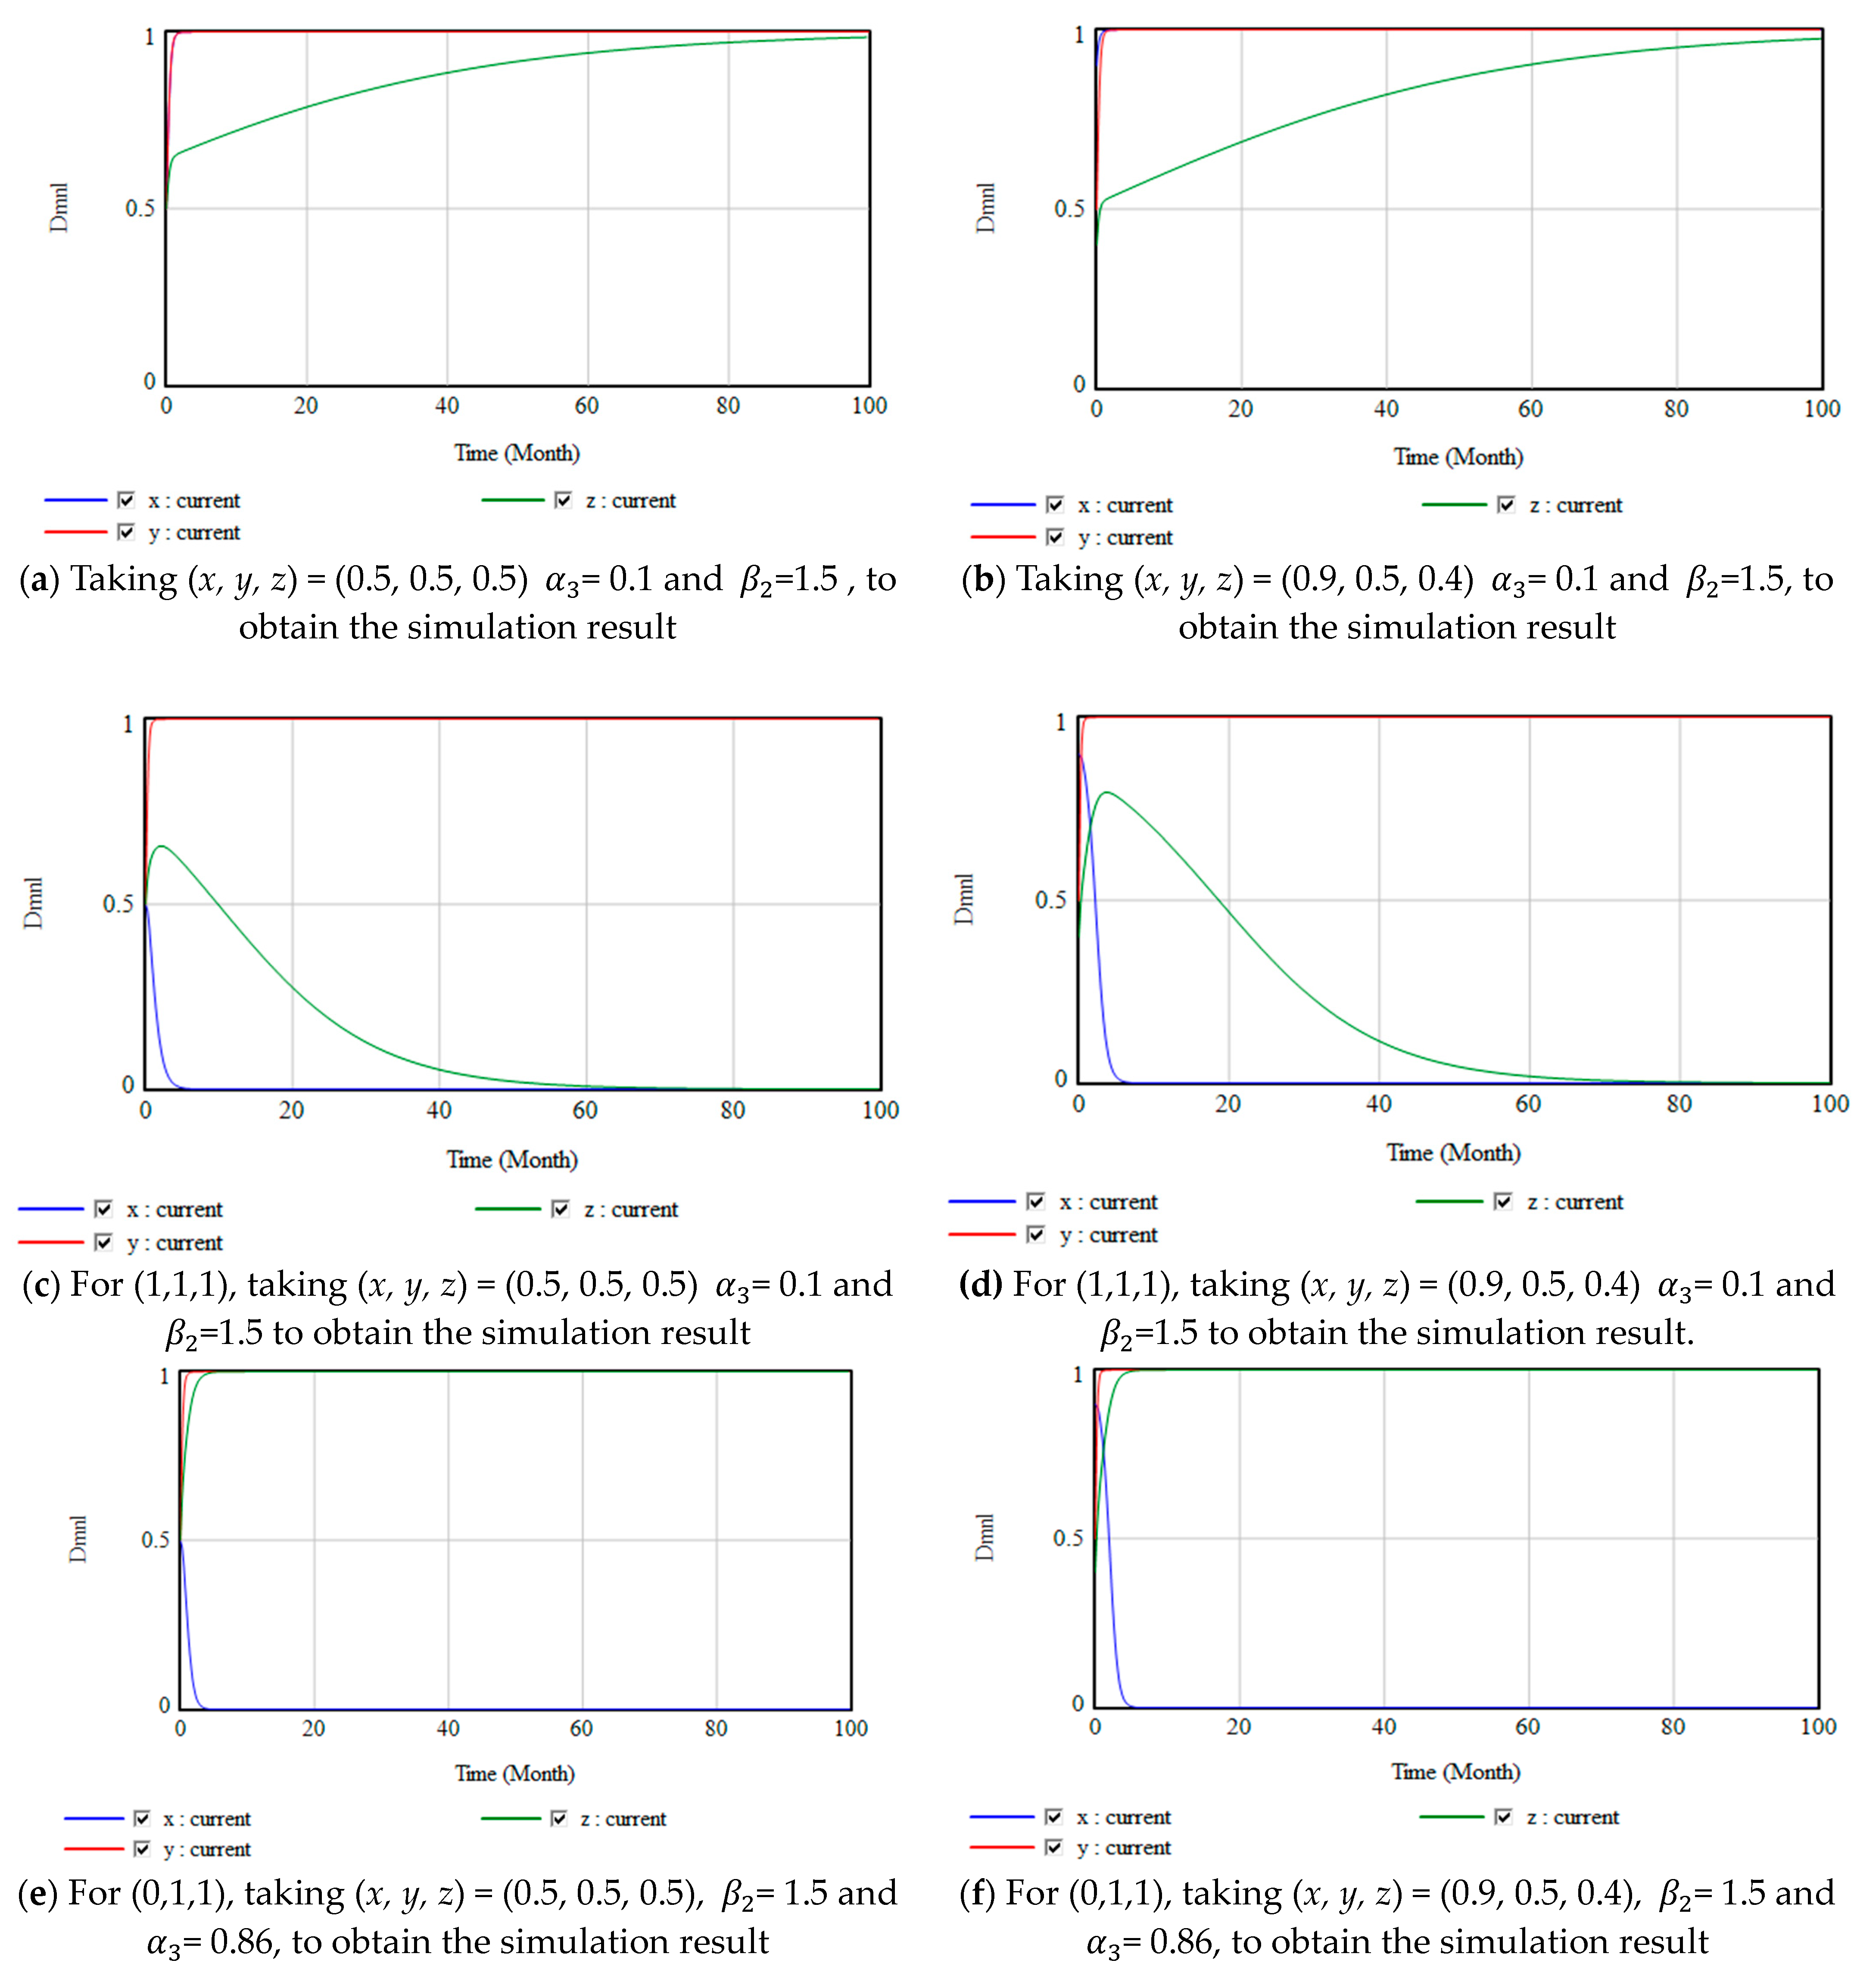
System dynamics is an approach for studying problems dealing with complex systems, which analyzes the dynamic evolution of the system by analyzing the cause–effect relationships within the system. Additionally, the system dynamics approach and the evolutionary game approach have the common features of being more suitable for solving long-term or periodic problems and complex social problems in the presence of insufficient data. Therefore, this paper develops a corresponding system for the tripartite evolutionary game model using the system dynamics method. Furthermore, Vensim software is used to perform numerical simulations to obtain strategy choices. It is also better suited to the complex dynamics of the game between multiple parties. Based on the evolutionary game model, the system dynamics approach is used to study the stability of the equilibrium solution of the evolutionary game with the feedback model of the manufacturer and the retailer incentives. Furthermore, based on the above assumptions and analysis, the data governance incentive tripartite game system consists of three subsystems, i.e., the government, the manufacturer, and the retailer. Figure 2 shows the SD model built by Vensim software for the evolutionary game.

4.3. Simulations

In order to further investigate the impact of the change in the parameters in the model on the choice of the government, the manufacturer, and the retailer, this paper simulates the dynamic evolutionary game process under different initial states of the government, the manufacturer, and the retailer with the software Vensim. Then, according to the dynamic simulation findings, the influential elements, such as the willingness of the partakers to engage, the strength of government regulation and subsidies, tax relief, penalties, and benefits, are discussed.
The stability conditions for the case of satisfying the game stability point (1, 1, 1) are E x ( 2 a + b r E y + a + b r E z ) > 0 , E y ( 1 r ) + a + b r E y C y > Q y m T , and E z 1 r + a + b r E z C z > Q z m J . The relevant parameters are assigned reasonable values according to this stability condition. We set E x = 5, C x = 0.2, b = 0.4, a = 0.6, m = 0.1, r = 0.012, E y = 2, T = 0.4, G = 2, C y = 0.2, Q y = 0.4, E z = 4, J = 0.3, L = 1, C z = 0.3, and Q z = 0.3. Meanwhile x = 0.5, y = 0.5, and z = 0.5 and x = 0.9, y = 0.5, and z = 0.4 are chosen. Simulation analysis is performed according to the SD model in Figure 2, and Figure 3a,b show the simulation results, respectively. In this scenario, the three-way behavioral strategy of the government, the manufacturer, and the retailer can asymptotically converge and finally stabilize at the ideal point (1, 1, 1). Moreover, their choice of behavioral strategies does not change depending on the subject’s initial intentions.
The stability conditions for the case of satisfying the game stability point (0, 1, 1) are 2 a + b r E y + b r E z > E x , E y 1 r C y > Q y , and E z 1 r C z > Q z . Based on this stability condition, the relevant parameters are assigned reasonable values. We set E x = 2, C x = 0.2, b = 0.4, a = 1.8, m = 0.1, r = 0.1, E y = 4, T = 0.4, G = 2, C y = 0.2, Q y = 0.6, E z = 3, J = 0.3, L = 1, C z = 0.3, and Q z = 0.8. Meanwhile x = 0.5, y = 0.5, and z = 0.5 and x = 0.9, y = 0.5, and z = 0.4 are chosen.
Simulation analysis is performed according to the SD model in Figure 2, and Figure 4a,b show the simulation results. In this scenario, the three-way behavioral strategy of the government, the manufacturer, and the retailer can asymptotically converge and eventually stabilize at the ideal point (0, 1, 1). Moreover, their choice of behavioral strategy does not change depending on the subject’s initial intentions.

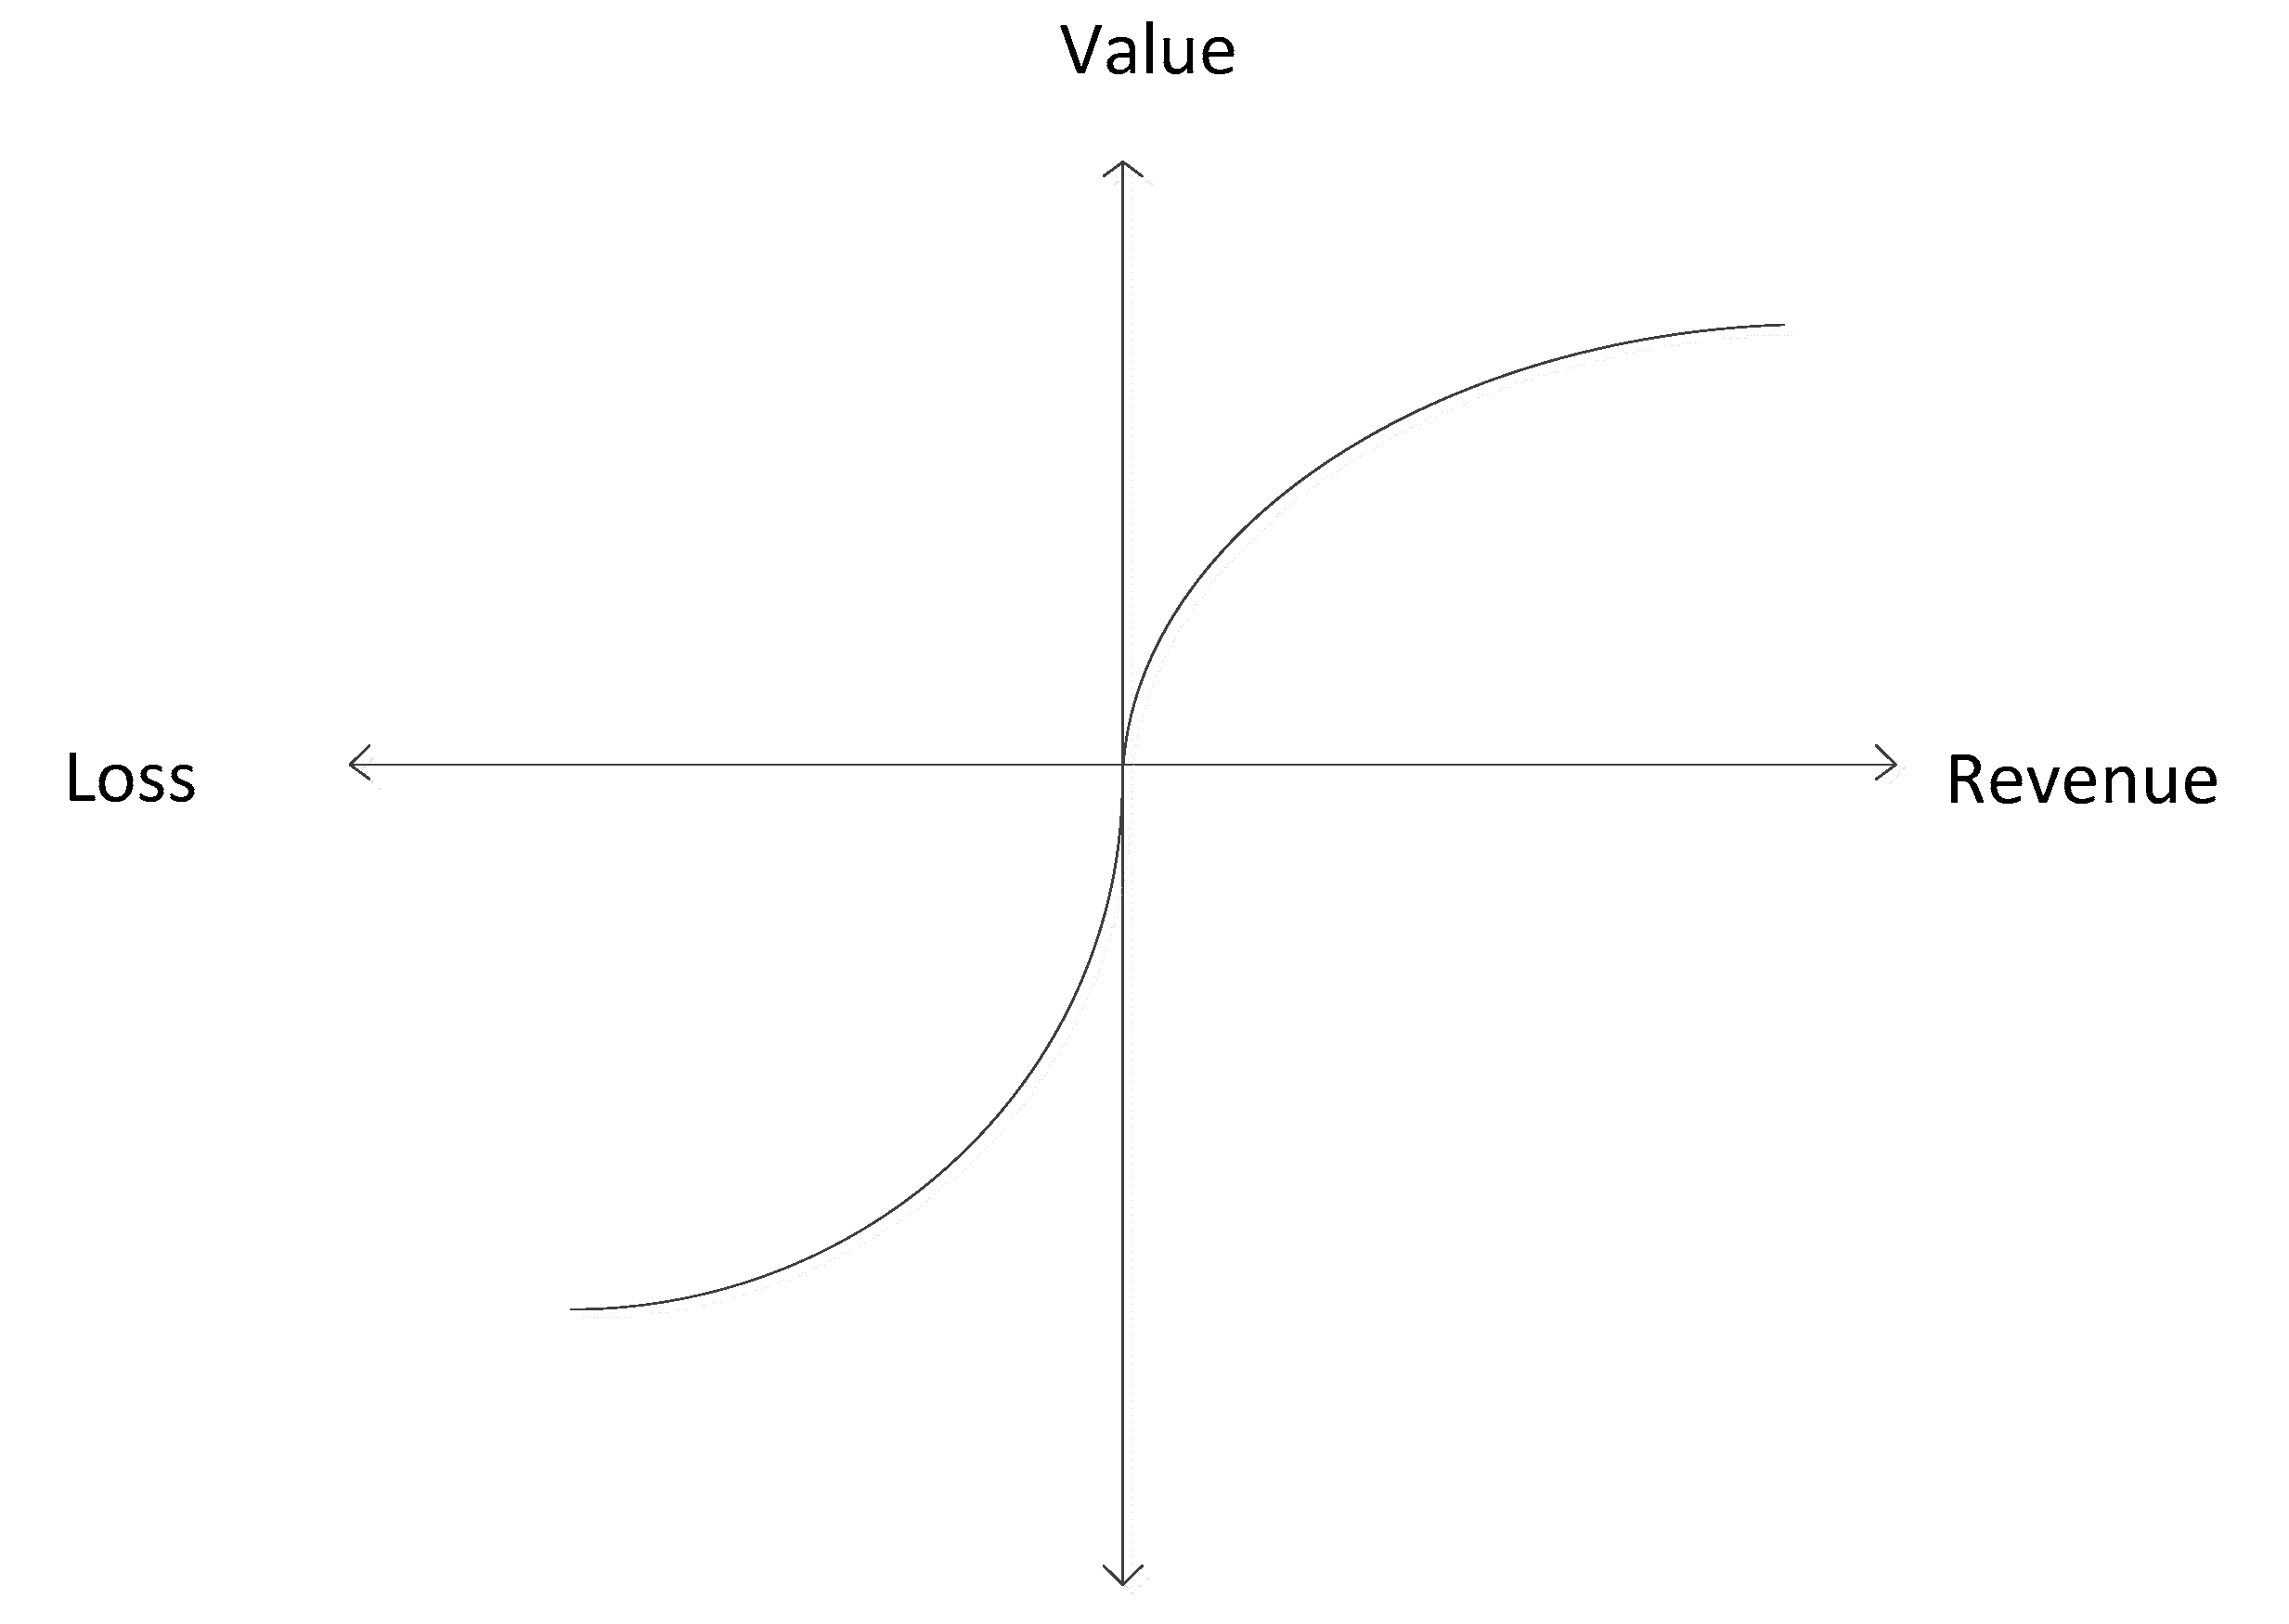
5. Prospect Theory Model Optimization

5.1. Analysis of Evolutionary Game Models under Prospect Theory

In the evolutionary game model above, the gains and losses affecting the subjects of the tripartite evolutionary game model are determined. In addition, the evolutionary game model does not rely on the assumption of complete rationality found in classical game theory but instead analyzes and predicts group behavior based on the limited rationality of human beings so it can capture the diversity and complexity of decision-making processes [27]. Moreover, the traditional payoff matrix does not consider the game subjects’ psychological value. In contrast to traditional expected utility theory, prospect theory considers decision makers’ rational deficiencies and preferences, revealing finite rational people’s psychological and behavioral mechanisms when faced with risky decisions. Therefore, prospect theory more realistically reflects the characteristics and laws of people’s decisions under uncertainty [28,29]. It is known from prospect theory that among the subjects of the evolutionary game, the government, the manufacturer, and the retailer are finite rational beings, and there are deviations in perceived value and actual utility between the two sides of the game when losses and benefits are uncertain. Prospect theory was presented by Kahneman et al. when they introduced relevant concepts from psychology and behavior into the study of risky decision problems [30]. In prospect theory, prospect value V ( x ) replaces the utility model of the expected benefit model to represent an individual’s psychological perception of the utility of a decision. The weight model π ( P i ) converts the probabilities in the expected benefit theory into weights. The expression of the value function is given by
V ( x ) = i = 1 n π ( P i ) ( x i )
U ( x ) = x α x 0 β ( x ) α x < 0
In the formula, w i denotes the distinction between the actual payment worth and the reference point worth of the three-game subjects after the occurrence of scenario i and U ( 0 ) = 0 ; π ( p ) i indicates the possibility of scenario i , and parameter α represents the risk sensitivity coefficient, indicating the extent of the marginally decreasing “gain” and “loss” value functions considered. The larger the value of α ( 0 < α < 1 ), the larger the degree of marginal diminution of the perceived value, which means that the weaker the sensitivity of the game subject to the value, the less likely it is to influence the decision of the value subject. Parameter β ( β > 1 ) indicates the loss prevention elements. The larger value of β indicates that the game subject is more sensitive to the loss of the strategy relative to the gain. As shown in Figure 5, the value curve is more vertical in the loss interval than in the revenue interval.

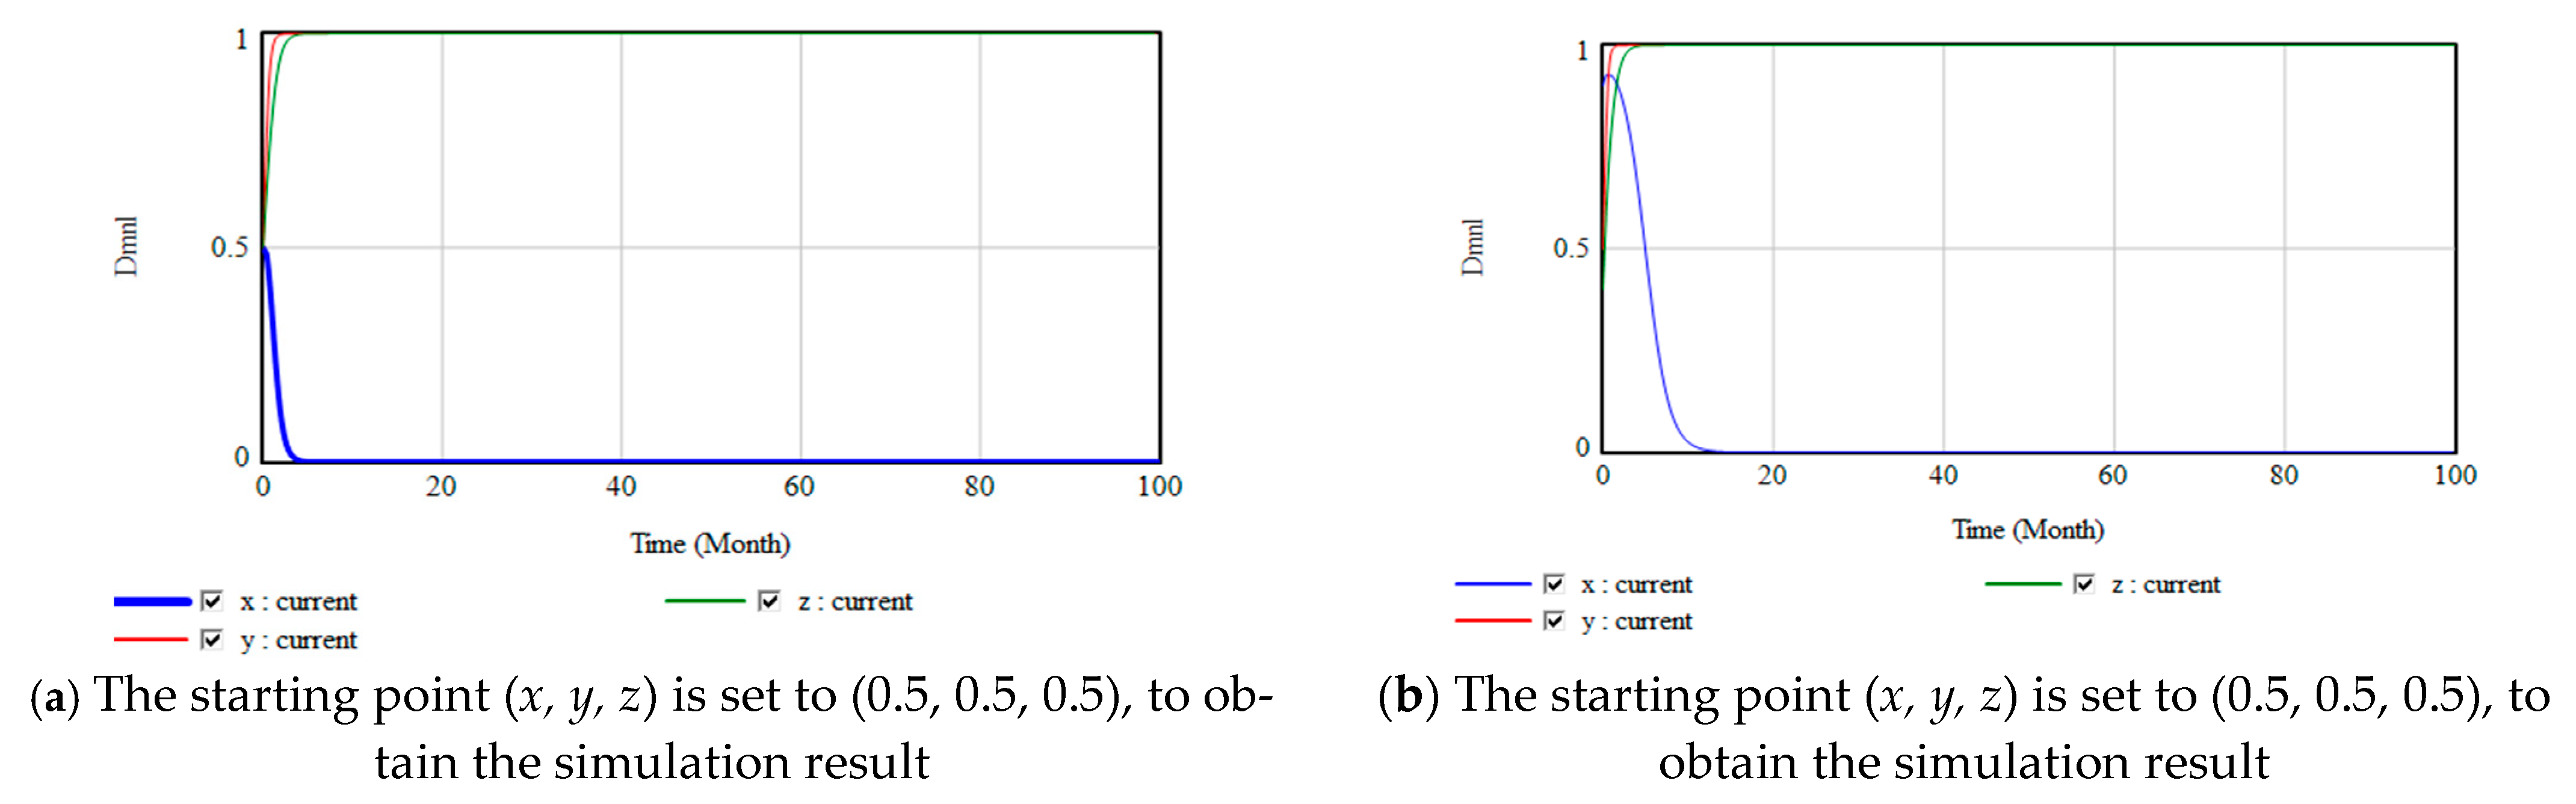
5.2. Simulation Analysis after Optimization

Optimizing the replicated dynamic equations and the system dynamics model through prospect theory, the evolutionary game hypothesis 7 is added. In the prospect theory context, there are different real and perceived values among all three subjects in the tripartite evolutionary game model. In addition, each subject’s perception of value has different sensitivities to both expected gains and perceived losses. Let them be α 1 , α 2 , and α 3 . For the perceived losses existing for the government, the manufacturer, and the retailer, we set the tolerance of the manufacturer and the retailer subjects for the losses as β 1 and β 2 . For determining gains and losses, their relevant parameters are kept constant in Equations (10) to (12) and in the system dynamics model. For uncertain gains and losses, the perceived values of the three parties in the game mentioned in the article are E x , E y , E z , G , and L , respectively.
For the sake of analysis, the value of the reference point in the value function is set to 0. The sensitivity coefficients of perceived gain and perceived loss are brought into Equation (13) according to the difference between gain and loss. Thus, the dynamic replication equation and SD model are derived after introducing prospect theory, as shown in Equation (19) and Figure 6.
F ( x ) = x ( 1 x ) [ z ( a b r E z α 3 m J ) + y ( a b r E y α 2 m T ) + E x α 1 + m ( T + J ) ] F ( y ) = y ( 1 y ) [ x ( a + b r E y α 2 + m T ) + E y α 2 ( 1 r ) C y ( β 1 G α 2 ) Q y + z ( β 1 G α 2 ) ] F ( z ) = z ( 1 z ) [ x ( a + b r E z α 3 + m J ) + E z α 3 ( 1 r ) C z ( β 2 L α 3 ) Q z + y ( β 2 L α 3 ) ]
The simulation results of the game under prospect theory:
Based on the Figure 6 SD model, the initial parameter values of the evolutionary game model are kept constant, and risk sensitivity and loss aversion coefficients are introduced. α 1 , α 2 , and α 3 are chosen as the government, the manufacturer, and the retailer risk sensitivity coefficients, respectively. β 1 and β 2 are chosen as the loss aversion coefficients of the government, the manufacturer, and the retailer. According to Tversky and others, the values of the risk sensitivity coefficients of the gain and loss functions in the value function of prospect theory are set to α 1 = 0.86, α 2 = 0.86, and α 3 = 0.86, and the coefficients of the degree of loss aversion take the values β 1 = 2.26 and β 2 = 2.26. For (1, 1, 1), the simulation results are shown in Figure 7a. Then, the starting point (x, y, z) of the government, the manufacturer, and the retailer strategy choices is changed to (0.9, 0.5, 0.4) to obtain the simulation results. This can be seen in Figure 7b. At this point, the strategies of the three parties of the game do not alter with the introduction of the risk-sensitive strategy and the loss avoidance coefficients but only produce some strategy fluctuations at the beginning of the tripartite evolutionary game when changing the starting point, and finally remain stable at the optimal strategy (1, 1, 1).
For (0, 1, 1), the simulation results are shown in Figure 8a. Then, the starting point (x, y, z) of the government, the manufacturer, and the retailer strategy choices is changed to (0.9, 0.5, 0.4) to obtain the simulation results shown in Figure 8b. At this point, the strategies of the three parties of the game do not alter with the introduction of the risk-sensitive strategy and the loss avoidance coefficients but only produce some strategy fluctuations at the beginning of the tripartite evolutionary game when changing the starting point, and finally remain stable at the optimal strategy (0, 1, 1).
Below, we examine the three parties’ risk sensitivity strategies and loss aversion factors.
(1) The analysis of the government’s risk sensitivity strategy and loss aversion coefficient.
For (1, 1, 1), α 1 = 0.1 is taken for the simulation with the initial parameter values of the evolutionary game model and the risk sensitivity coefficients and loss avoidance coefficients of the manufacturer and the retailer constants, and the results obtained are shown in Figure 9a. Then, the starting point (x, y, z) of the government, the manufacturer, and the retailer strategy choices is changed to (0.9, 0.5, 0.4) to obtain the simulated results. The simulation results are shown in Figure 9b. Based on the simulated results, changing the government’s initial strategy and risk sensitivity coefficients does not affect the tripartite evolutionary game in reaching a stable optimal outcome, and it eventually stabilizes at the optimal strategy of (1, 1, 1).
For (0, 1, 1), α 1 = 0.1 is taken for the simulation with the initial parameter values of the evolutionary game model and the risk sensitivity coefficients and loss avoidance coefficients of the manufacturer and the retailer constant, and the results obtained are shown in Figure 9c. Then, the starting point (x, y, z) of the government, the manufacturer, and the retailer strategy choices is changed to (0.9, 0.5, 0.4) to obtain the simulation results shown in Figure 9d. Based on the simulation results, changing the government’s initial strategy and risk sensitivity coefficients does not affect the tripartite evolutionary game to reach a stable optimal outcome. It eventually stabilizes at the optimal strategy of (0, 1, 1).
(2) The analysis of the manufacturer’s risk sensitivity strategy and loss aversion coefficient.
For (1, 1, 1), α 2 = 0.1 and β 1 = 1.5 are taken for the simulation with the initial parameter values of the evolutionary game model and the risk sensitivity coefficients and loss avoidance coefficients of the government and the retailer constant, and the results obtained are shown in Figure 10a. Then, the starting point (x, y, z) of the government, the manufacturer, and the retailer strategy choices is changed to (0.9, 0.5, 0.4) to obtain the simulated results, as shown in Figure 10b. Based on the simulated results, changing the government’s initial strategy and risk sensitivity coefficients does not affect the tripartite evolutionary game to reach a stable optimal outcome. It eventually stabilizes at the optimal strategy of (1, 1, 1).
For (0, 1, 1), α 2 = 0.1 and β 1 = 1.5 are taken for the simulation with the initial parameter values of the evolutionary game model and the risk sensitivity coefficients and loss avoidance coefficients of the government and the retailer constant, and the results obtained are shown in Figure 10c. Then, the starting point (x, y, z) of the government, the manufacturer, and the retailer strategy choices is changed to (0.9, 0.5, 0.4) to obtain the simulated results shown in Figure 10d. Based on the simulated results, changing the government’s initial strategy and risk sensitivity coefficients does not affect the tripartite evolutionary game to reach a stable optimal outcome. It eventually stabilizes at the optimal strategy of (0, 1, 1).
(3) The analysis of the retailer’s risk sensitivity strategy and loss aversion coefficient.
For (1, 1, 1), α 3 = 0.1 and β 2 = 1.5 are taken for the simulation with the initial parameter values of the evolutionary game model and the risk sensitivity coefficients and loss avoidance coefficients of the government and the manufacturer constant, and the results obtained are shown in Figure 11a. Then, the starting point (x, y, z) of the government, the manufacturer, and the retailer strategy choices is changed to (0.9, 0.5, 0.4) to obtain the simulated results shown in Figure 11b. Based on the simulated results, changing the government’s initial strategy and risk sensitivity coefficients does not affect the tripartite evolutionary game to reach a stable optimal outcome. It eventually stabilizes at the optimal strategy of (1, 1, 1).
For (0, 1, 1), α 3 = 0.1 and β 2 = 1.5 are taken for the simulation with the initial parameter values of the evolutionary game model and the risk sensitivity coefficients and loss avoidance coefficients of the government and the manufacturer constant, and the results obtained are shown in Figure 11c. Then, the starting point (x, y, z) of the government, the manufacturer, and the retailer strategy choices is changed to (0.9, 0.5, 0.4) to obtain the simulation results shown in Figure 11d. According to the simulation results, by decreasing the manufacturer’s risk sensitivity and loss aversion coefficients, the result will be (0, 1, 0). This indicates that the retailer is more sensitive to value or more concerned with losses than gains; at this point, the optimum stable situation cannot be achieved. Based on the results of the above study, we keep β 2 = 1.5 constant and let α 3 = 0.86 on this basis to obtain the results shown in Figure 11e,f. At this point, the optimal result changes back to (0,1,1), so the only influencing factor on whether the optimal stability point can be reached is the retailer’s risk sensitivity coefficient. As can be seen from Figure 11g, the evolutionarily stable case stabilizes at (0, 1, 0) as the initial value of α 3 is changed. From the above simulation results, it is clear that the evolutionary stabilization case will appear unstable when α 3 is changed and is independent of the initial value.
In summary, whether the evolutionary game reaches optimality is related to the risk sensitivity coefficient of the retailer and is independent of both the risk sensitivity coefficient and the loss aversion coefficient of the government and the manufacturer. When the retailer’s risk sensitivity coefficient changes, it affects the retailer’s sensitivity to perceived gains and losses, thus making the evolutionarily stable point of the tripartite evolutionary game non-existent.

6. Conclusions and Recommendations

In this paper, we analyze the evolutionary game between the government, the manufacturer, and the retailer in the context of big data. We analyze the shortcomings of the tripartite evolutionary game model and introduce prospect theory. Moreover, we improve the perceived value of the three parties to the game while introducing the model for the study. Finally, we performed an evolutionary stability analysis with the system dynamics software Vensim and obtained the following results:
(1) In the case of the initial tripartite evolutionary game model, the three parties of the game can reach the optimal stabilization point (1, 1, 1) when the following conditions are satisfied:
The manufacturer and the retailer benefit more from joining the platform than from not joining it.
The benefits of government intervention in the platform outweigh the benefits of not intervening in the platform.
At this time, the government engages in “intervention” behavioral strategies. The manufacturer and the retailer choose to engage in “joining” behavioral strategies. This facilitates the early development of the manufacturing supply chain data platform. In the case of the initial tripartite evolutionary game model, the three parties of the game can reach the optimal stabilization point (0, 1, 1) when the following conditions are satisfied:
The benefits to the manufacturer and the retailer of joining the platform are greater than those of not joining.
The benefits of government intervention are smaller than the benefits of not intervening in the platform.
At this point, both the manufacturer and the retailer choose the behavioral strategy of joining. At the same time, the government takes the behavioral strategy of not interfering with the platform as its optimal behavioral strategy choice, which facilitates the construction of an autonomous and stable data governance platform.
(2) For cases (1, 1, 1), after we introduce prospect theory to optimize the tripartite evolutionary game model, we set the initial risk sensitivity and loss aversion degree coefficients according to previous studies on prospect theory. Because the introduction of correlation coefficients does not change the optimal stable outcome of the tripartite evolutionary game simultaneously, we do not need to consider the three parties’ risk sensitivity and loss aversion degree coefficients. However, for cases (0, 1, 1), in the beginning, the introduction of the correlation coefficient does not change the optimal stable outcome of the tripartite evolutionary game. However, as the retailer’s risk sensitivity coefficient decreases and loss sensitivity increases, the stable outcome of the tripartite incentive game will not stabilize at the optimal strategy. The behavior of the retailer joining the data governance platform is proven to affect whether the platform is stable and orderly enough to optimally meet the supply chain’s overall demand.
According to the above conclusions, for the government incentive mechanism of blockchain-based supply chain data governance, first of all, the government must drive this mechanism through the development of incentive policies, financial subsidies, tax breaks, penalties and other measures to incentivize supply chain enterprises to join the data governance platform, while these enterprises mainly decide whether to join based on the ultimate benefits. This article, therefore, provides recommendations from the perspectives of three separate entities: the government, the manufacturer, and the retailer. In the context of big data, it is important to enable the manufacturing of comprehensive data governance that is guided by government incentives in the early stages, supervised by the government in the later stages, joined by multiple actors such as supply chains, the manufacturer, and retail enterprises, and combined with economic, policy, and technical means. The following recommendations are made:
(3) From the government’s perspective, in the early or unstable stage of the development of the supply chain data governance platform, the government should take the lead to intervene in the platform and provide incentives to supply chain enterprises: positive incentives in the form of financial subsidies and tax breaks, and negative incentives in the form of control and penalties. The government can guide the manufacturer and the retailer to actively join the platform by adjusting the number of financial subsidies, tax relief coefficients, and control penalties so that the supply chain data governance platform can enter a stable stage of development. When the supply chain data governance platform is in a stable stage of development, the government should no longer interfere with the platform but only supervise it. This will facilitate the autonomous and stable operation of the platform.
Financial subsidies can increase business returns by directly increasing business revenues and reducing business investment costs. For example, the state can allocate funds to subsidize upfront input costs, such as construction costs for manufacturers and retailers to join data governance, as well as costs incurred in the data governance process, such as machine damage costs, labor costs, information maintenance costs, etc. This can further reduce the financial pressure on businesses. Tax incentives serve to increase the expected revenue of the company. Additionally, regulatory penalties are the government’s way of monitoring companies’ data governance practices.
Therefore, the government should set reasonable subsidies and tax breaks and make timely adjustments to the subsidy strategy according to the development of data governance platforms to ensure that manufacturers and retailers join data governance platforms at minimal cost, thereby improving the level of supply chain data governance. At the same time, the government should establish appropriate rules and penalties to punish companies for wasting resources and producing substandard green products due to poor data governance. The government should allow both positive and negative incentives in order to improve production, sell green and low-carbon products, and protect the ecological environment.
(4) From the perspective of supply chain manufacturers and retailers, they, as the main body of supply chain data governance, should pay close attention to the government’s policy guidance and actively respond to the government’s recommendations. They should use data governance platforms to gather information on the supply chain’s overall resources, improve production techniques, and make optimal decisions. In this way, companies can achieve the goal of improving supply chain data governance and sustainability while reducing costs and increasing efficiency in the company itself through the data governance platform.

Author Contributions

J.W. was responsible for the conception and design of the paper. X.Y. (Xiuping Yi) was responsible for model building and paper writing. Y.L. and X.Y. (Xin Yang) were responsible for paper adjustments. All authors have read and agreed to the published version of the manuscript.

Funding

This research was funded by the National Social Science Fund of China (grant no. 21AGL001).

Institutional Review Board Statement

Not applicable.

Informed Consent Statement

Not applicable.

Data Availability Statement

The data presented in this study are available on request from the corresponding author.

Conflicts of Interest

The authors declare no conflict of interest.

References

  1. Addo-Tenkorang, R.; Helo, P.T. Big data applications in operations/supply-chain management: A literature review. Comput. Ind. Eng. 2016, 101, 528–543. [Google Scholar] [CrossRef]
  2. Baihaqi, I.; Sohal, A.S. The impact of information sharing in supply chains on organisational performance: An empirical study. Prod. Plan. Control. 2013, 24, 743–758. [Google Scholar] [CrossRef]
  3. Sanders, N.R.; Ganeshan, R. Big Data in Supply Chain Management. Prod. Oper. Manag. 2018, 27, 1745–1748. [Google Scholar] [CrossRef]
  4. Müller, J.M.; Veile, J.W.; Voigt, K.-I. Prerequisites and incentives for digital information sharing in Industry 4.0—An international comparison across data types. Comput. Ind. Eng. 2020, 148, 106733. [Google Scholar] [CrossRef]
  5. Zhang, Y.J.; Sun, H.Y. Research on Blockchain Technology Based Manufacturing Supply Chain Management. West. Financ. Account. 2022, 733, 77–79. [Google Scholar] [CrossRef]
  6. Farooq, M.U.; Hussain, A.; Masood, T.; Habib, M.S. Supply Chain Operations Management in Pandemics: A State-of-the-Art Review Inspired by COVID-19. Sustainability 2021, 13, 2504. [Google Scholar] [CrossRef]
  7. Xu, X.Y.; Sethi, S.P.; Chung, S.H.; Choi, T.M. Reforming global supply chain management under pandemics: The GREAT-3Rs framework. Prod. Oper. Manag. 2023, 32, 524–546. [Google Scholar] [CrossRef]
  8. Zhu, T.; Liu, G.C. A Novel Hybrid Methodology to Study the Risk Management of Prefabricated Building Supply Chains: An Outlook for Sustainability. Sustainability 2023, 15, 361. [Google Scholar] [CrossRef]
  9. Wang, S.L.; Ji, Y.; Wahab, M.I.M.; Xu, D.; Zhou, C.B. A New Decision Framework of Online Multi-Attribute Reverse Auctions for Green Supplier Selection under Mixed Uncertainty. Sustainability 2022, 14, 16879. [Google Scholar] [CrossRef]
  10. Al-Ruithe, M.; Benkhelifa, E.; Hameed, K. A systematic literature review of data governance and cloud data governance. Pers. Ubiquitous Comput. 2019, 23, 839–859. [Google Scholar] [CrossRef]
  11. Liu, X.Z.; Sun, S.X.; Huang, G. Decentralized Services Computing Paradigm for Blockchain-Based Data Governance: Programmability, Interoperability, and Intelligence. IEEE Trans. Serv. Comput. 2020, 13, 343–355. [Google Scholar] [CrossRef]
  12. Yang, X.T.; Li, M.Q.; Yu, H.J.; Wang, M.T.; Xu, D.M.; Sun, C.H. A Trusted Blockchain-Based Traceability System for Fruit and Vegetable Agricultural Products. IEEE Access 2021, 9, 36282–36293. [Google Scholar] [CrossRef]
  13. Urovi, V.; Jaiman, V.; Angerer, A.; Dumontier, M. LUCE: A blockchain-based data sharing platform for monitoring data license accoUntability and CompliancE. Blockchain Res. Appl. 2022, 3, 100102. [Google Scholar] [CrossRef]
  14. Sheng, S.Y. Information Sharing Model Construction of Supply Chain Based on Blockchain Technology. Inf. Sci. 2021, 39, 162–168. [Google Scholar] [CrossRef]
  15. Li, B.; Guo, H.; Peng, S. Impacts of production, transportation and demand uncertainties in the vaccine supply chain considering different government subsidies. Comput. Ind. Eng. 2022, 169, 108169. [Google Scholar] [CrossRef]
  16. Yu, J.J.; Tang, C.S.; Li, M.K.; Shen, Z.J.M. Coordinating Installation of Electric Vehicle Charging Stations between Governments and Automakers. Prod. Oper. Manag. 2022, 31, 681–696. [Google Scholar] [CrossRef]
  17. Jiao, Y.; Yu, L.; Wang, J.; Wu, D.; Tang, Y. Diffusion of new energy vehicles under incentive policies of China: Moderating role of market characteristic. J. Clean. Prod. 2022, 353, 131660. [Google Scholar] [CrossRef]
  18. Kumi, S.; Lomotey, R.K.; Deters, R. A Blockchain-based platform for data management and sharing. Procedia Comput. Sci. 2022, 203, 95–102. [Google Scholar] [CrossRef]
  19. Shen, L.; Yang, Q.; Hou, Y.; Lin, J. Research on information sharing incentive mechanism of China’s port cold chain logistics enterprises based on blockchain. Ocean Coast. Manag. 2022, 225, 106229. [Google Scholar] [CrossRef]
  20. Luo, X.G.; Zhang, Z.L.; He, J.H.; Hu, S.N. Strategic Analysis of the Parameter Servers and Participants in Federated Learning: An Evolutionary Game Perspective. IEEE Trans. Comput. Soc. Syst. 2022, 1–12. [Google Scholar] [CrossRef]
  21. Li, K.; Dong, F. Government strategy for banning gasoline vehicles: Evidence from tripartite evolutionary game. Energy 2022, 254, 124158. [Google Scholar] [CrossRef]
  22. Yuan, S.J.; Li, J.; Su, X. Impact of Government Subsidy Strategies on Supply Chains Considering Carbon Emission Reduction and Marketing Efforts. Sustainability 2022, 14, 3111. [Google Scholar] [CrossRef]
  23. Zhang, M.; Kong, Z. A tripartite evolutionary game model of emergency supplies joint reserve among the government, enterprise and society. Comput. Ind. Eng. 2022, 169, 108132. [Google Scholar] [CrossRef]
  24. Yang, Z.; Shi, Y.; Li, Y. Analysis of intellectual property cooperation behavior and its simulation under two types of scenarios using evolutionary game theory. Comput. Ind. Eng. 2018, 125, 739–750. [Google Scholar] [CrossRef]
  25. Göksu, A.; Kocamaz, U.E.; Uyaroğlu, Y. Synchronization and control of chaos in supply chain management. Comput. Ind. Eng. 2015, 86, 107–115. [Google Scholar] [CrossRef]
  26. Liu, X.; Zhou, W.; Xie, L. Dynamic competitive game study of a green supply chain with R&D level. Comput. Ind. Eng. 2022, 163, 107785. [Google Scholar] [CrossRef]
  27. Wang, T.; Li, C.; Yuan, Y.; Liu, J.; Adeleke, I.B. An evolutionary game approach for manufacturing service allocation management in cloud manufacturing. Comput. Ind. Eng. 2019, 133, 231–240. [Google Scholar] [CrossRef]
  28. He, S.-F.; Wang, Y.-M.; Martínez, L. Gaussian IT2FSs-based prospect theory method with application to the evaluation of renewable energy sources. Comput. Ind. Eng. 2022, 169, 108266. [Google Scholar] [CrossRef]
  29. Xue, W.; Xu, Z.; Mi, X. Solving hesitant fuzzy linguistic matrix game problems for multiple attribute decision making with prospect theory. Comput. Ind. Eng. 2021, 161, 107619. [Google Scholar] [CrossRef]
  30. Liang, W.; Goh, M.; Wang, Y.-M. Multi-attribute group decision making method based on prospect theory under hesitant probabilistic fuzzy environment. Comput. Ind. Eng. 2020, 149, 106804. [Google Scholar] [CrossRef]
Figure 1. Sketch of government incentives.
Sustainability 15 06968 g001
Figure 2. System dynamics model of government incentives.
Sustainability 15 06968 g002
Figure 3. The evolutionary path of ESS (1, 1, 1).
Sustainability 15 06968 g003
Figure 4. The evolutionary path of ESS (0, 1, 1).
Sustainability 15 06968 g004
Figure 5. Value curve.
Sustainability 15 06968 g005
Figure 6. Optimized system dynamics model of the government incentive mechanism.
Sustainability 15 06968 g006
Figure 7. The evolutionary path of ESS (1, 1, 1) in prospect theory.
Sustainability 15 06968 g007
Figure 8. The evolutionary path of ESS (0, 1, 1) in prospect theory.
Sustainability 15 06968 g008
Figure 9. The impacts of the government’s risk-sensitive strategy on the choice of behavioral strategies of the three stakeholders.
Sustainability 15 06968 g009
Figure 10. The impacts of the manufacturer’s risk sensitivity strategy and loss aversion coefficient on the choice of behavioral strategies of the three stakeholders.
Sustainability 15 06968 g010
Figure 11. The impacts of the retailer’s risk sensitivity strategy and loss aversion coefficient on the choice of behavioral strategies of the three stakeholders.
Sustainability 15 06968 g011aSustainability 15 06968 g011b
Table 1. Parameter setting.
ParametersDescription
E x The revenue to the government from the platform when the government intervenes in the platform.
a The government’s monetary support factor for the manufacturer and the retailer.
b The government tax credit factor for the manufacturer and the retailer.
r The government tax factor for the manufacturer and the retailer.
C x The cost of the government regulation of the platform.
E y The revenue gained by the manufacturer using the platform.
Q y The revenue gained by the manufacturer using the information gap when the manufacturer does not join the platform.
T The amount of government penalty for non-compliance with data governance when the manufacturer does not join.
G The loss to the manufacturer caused by the lack of data from the retailer when the manufacturer joins the platform.
C y The fee the manufacturer has to pay to join the platform.
E z The revenue gained by the retailer using the platform.
Q z The revenue gained by the retailer using the information gap when the retailer does not join the platform.
J The amount of government penalty for non-compliance with data governance when the retailer does not join
L The loss to the retailer caused by the lack of data from the manufacturer when the retailer joins the platform.
C z The fee the retailer has to pay to join the platform.
m The probability of data governance non-compliance for the manufacturer and the retailer.
x The government’s probability of adopting the “intervention” tactic.
1 x The government’s probability of adopting the “non-intervention”tactic.
y The manufacturer’s probability of adopting the “joining”tactic.
1 y The manufacturer’s probability of adopting the “not joining”tactic.
z The retailer’s probability of adopting the “joining” tactic.
1 z The retailer’s probability of adopting the “not joining” tactic.
Table 2. A payoff matrix for the government’s “intervention” strategy (x).
The Manufacturer
not   joining ( y ) joining   ( 1 y )
The retailer“joining”
(z)
P X : C x
P Y : E y ( 1 r ) C y
P Z : E z ( 1 r ) C z
P X : C x
P Y : Q y
P Z : E z ( 1 r ) C z L
“not joining”
(1 − z)
P X : C x
P Y : E y ( 1 r ) C y G
P Z : Q z
P X : C x
P Y : Q y
P Z : Q z
Table 3. A payoff matrix for the government’s “non-intervention” strategy ( 1 x ).
The Manufacturer
joining   ( y ) not   joining   ( 1 y )
The retailer“joining”
(z)
P X : E x C x 2 a b r E y b r E z
P Y : E y ( 1 r ) + b r E y ( C y a )
P Z : E z ( 1 r ) + b r E z ( C z a )
P X : E x C x a b r E z + m T
P Y : Q y m T
P Z : E z ( 1 r ) + b r E z ( C z a ) L
“not joining”
(1 − z)
P X : E x C x a b r E y + m J
P Y : E y ( 1 r ) + b r E y ( C y a ) G
P Z : Q z m J
P X : E x C x + m ( T + J )
P Y : Q y m T
P Z : Q z m J
Disclaimer/Publisher’s Note: The statements, opinions and data contained in all publications are solely those of the individual author(s) and contributor(s) and not of MDPI and/or the editor(s). MDPI and/or the editor(s) disclaim responsibility for any injury to people or property resulting from any ideas, methods, instructions or products referred to in the content.

