Article

Methane Anaerobic Oxidation Potential and Microbial Community Response to Sulfate Input in Coastal Wetlands of the Yellow River Delta

1
Shandong Analysis and Test Center, Qilu University of Technology (Shandong Academy of Sciences), Jinan 250014, China
2
College of Geography and Environment, Shandong Normal University, Jinan 250300, China
*
Author to whom correspondence should be addressed.
Sustainability 2023, 15(9), 7053; https://doi.org/10.3390/su15097053
Submission received: 18 March 2023 / Revised: 12 April 2023 / Accepted: 20 April 2023 / Published: 23 April 2023
(This article belongs to the Special Issue Soil Carbon Sequestration and Greenhouse Gas Emission)

Abstract

:
In the context of global warming and carbon neutrality, reducing greenhouse gas emissions is fundamental to achieving sustainable development. As an important greenhouse gas, methane has a much stronger warming effect than CO2, and studies have demonstrated that anaerobic oxidation of methane (AOM) is important for global methane emissions. This paper systematically investigated the AOM potential and microbial community response to the input of SO42− in the three typical salt marsh soils of the Yellow River Delta: Reed, Suaeda salsa, and Tamarisk, using SO42− as the electron acceptor and a combination of indoor anaerobic culture and high-throughput sequencing. The results showed that after adding an appropriate concentration of SO42−, the AOM potential was significantly promoted in Tamarix soil (p < 0.05) and significantly inhibited in Reed and Suaeda salsa soil (p < 0.05); soil AOM potential and SO42− input concentration and background values were correlated. At the microbial level, SO42− input affected the abundance of some microorganisms. At the phylum level, the relative abundance of Proteobacteria was increased in Suaeda salsa soil, decreased in Tamarisk soil, and did not change significantly in Reed soil; that of Crenarchaeota and Desulfobacterota was significantly increased in Tamarisk soil. At the genus level, Methylophaga, Methylotenera, and Methylomonaceae became the dominant populations, and it can be inferred that these bacteria are involved in the anaerobic oxidation of methane after the input of SO42−. This study will be of great significance to the mechanistic study of AOM and the conservation of microbial diversity in the Yellow River Delta Coastal Wetland, as well as provide a scientific basis for CH4 reduction in coastal wetlands.

1. Introduction

The sixth assessment report of the Intergovernmental Panel on Climate Change (IPCC) of the United Nations pointed out that from 2010 to 2019, although the global growth rate of greenhouse gases slowed down, the total emissions continued to increase. In the context of today’s global sustainable development, it is crucial to achieve temperature rise control. For the purpose of the experiment, the target year of global emission peak and carbon neutrality should be advanced, as should the control of methane (CH4) emissions [1]. In order to meet the needs of sustainable development and climate change mitigation, the international community is now paying more attention to reducing carbon emissions and improving environmental quality [2,3]. Promoting carbon neutrality is the key to sustainable development, while reducing greenhouse gas emissions is fundamental to promoting carbon neutrality. Methane accounts for 16% of the total greenhouse gases. It has a warming effect on a hundred-year scale that is about 28 times that of carbon dioxide and significantly impacts global climate change [4]. According to the data released by the United States Department of Environmental Protection, the contribution of CH4 emissions to global warming is about 20–30% [5,6]. Wetlands are a unique ecosystem formed as a result of land-water interactions and are one of many natural ecosystems that produce CH4. Although the total surface area of natural wetlands is only a small part of the land area, they are the largest source of global CH4 emissions. Global wetland CH4 emissions are approximately 116.99–124.74 Tg∙yr−1, which has a huge impact on global climate change according to the latest estimation models [7]. CH4 produced in nature will reduce its emissions due to the oxidation-reduction reaction between microorganisms and various electron receptors under aerobic or anaerobic conditions before being discharged into the atmosphere [8]. The process of CH4 reduction by microbial redox reactions in an anaerobic environment is called anaerobic oxidation of methane (AOM).
Coastal wetlands have good conditions for AOM due to the fact that the soil is in an intermittent flooding state and contains multiple electron acceptors. Segarra et al. [9] found that AOM exists in coastal wetlands with comparable activity to that in the ocean and that it can reduce wetland CH4 emissions by 50%. The annual CH4 removal by the AOM reaction is approximately 0.3 × 10¹² T, which reduces atmospheric CH4 levels by 10–60% [10,11]. Therefore, the AOM process driven by different electron acceptors in coastal wetlands is an important way to reduce CH4 emissions from wetlands and mitigate the greenhouse effect [12,13].
Through studying soil microorganisms in wetland ecosystems, it was found that the microbial community structure in soil changes with the content of soil physicochemical factors because different microorganisms in the soil have different response mechanisms to changes in the living environment [14]. Research has found that there are differences in the structure, diversity, and activity of microbial communities in soil under different salinities and depths [15,16]. Liu et al. [17] found that because wetlands are characterized by intermittent flooding, they provide both aerobic and anaerobic environments so that soil microorganisms can use electron acceptors such as NO3, Fe3+, SO42−, and CO2 during respiration and reduce CH4 production through oxidation-reduction reactions of Nitratireductor, Sulfate-reducing bacteria, Fermentation bacteria, and Methanogenic archaea. Previous studies have shown that the AOM process involves several different electron acceptors, including sulfate (SO42−), nitrate/nitrite (NO3/NO2), and metal ions (Mn4+, Fe3+), called sulfate-based methane anaerobic oxidation (SAMO), nitrate-based methane anaerobic oxidation (n-DAMO), metal-ionic methane anaerobic oxidation (Metal-AOM), and direct interspecies electron transfer (DIET), respectively. Current domestic and international studies on AOM processes in natural wetlands have mostly focused on peatlands [18,19,20], mangrove wetlands [21], rice fields [7,22,23,24], Yangtze River crossing wetlands [25,26], and the Minjiang River estuary wetlands [27,28]. In contrast, the Yellow River Delta is the youngest and most complex coastal wetland in the warm temperate zone of China. This area has received fewer studies, and most of them are on n-DAMO [29] and metal-AOM. The sea-land interaction in the coastal wetlands of the Yellow River Delta is very significant, and the soils in such coastal wetlands are sulfate rich. CH4 can be oxidized by sulfate-reducing bacteria (SRB) through the methyl generation pathway. The oxidation process is affected to different degrees by the combined effects of different soil physicochemical properties or different vegetation cover and other conditions, leading to a high degree of spatial and temporal heterogeneity in CH4 production [30,31,32,33].
In this study, the soils of three typical vegetation covers, Reed, Suaeda salsa, and Tamarisk, were collected under natural conditions. The changes in soil AOM potential and microbial community structure of three typical vegetation zones in the coastal wetland of the Yellow River Delta after SO42− input were investigated by combining indoor incubation and high-throughput sequencing methods. Whether there was some connection between the two changes. This has important implications for exploring the SAMO process mediated by SRB functional flora [34]. This can reveal the mechanism of microbial action in the highly spatial and temporal heterogeneity of CH4 emission from coastal wetlands. It can more accurately assess the changes in CH4 metabolism and fluxes and lay a scientific foundation for the ultimate reduction of CH4 emission fluxes.

2. Materials and Methods

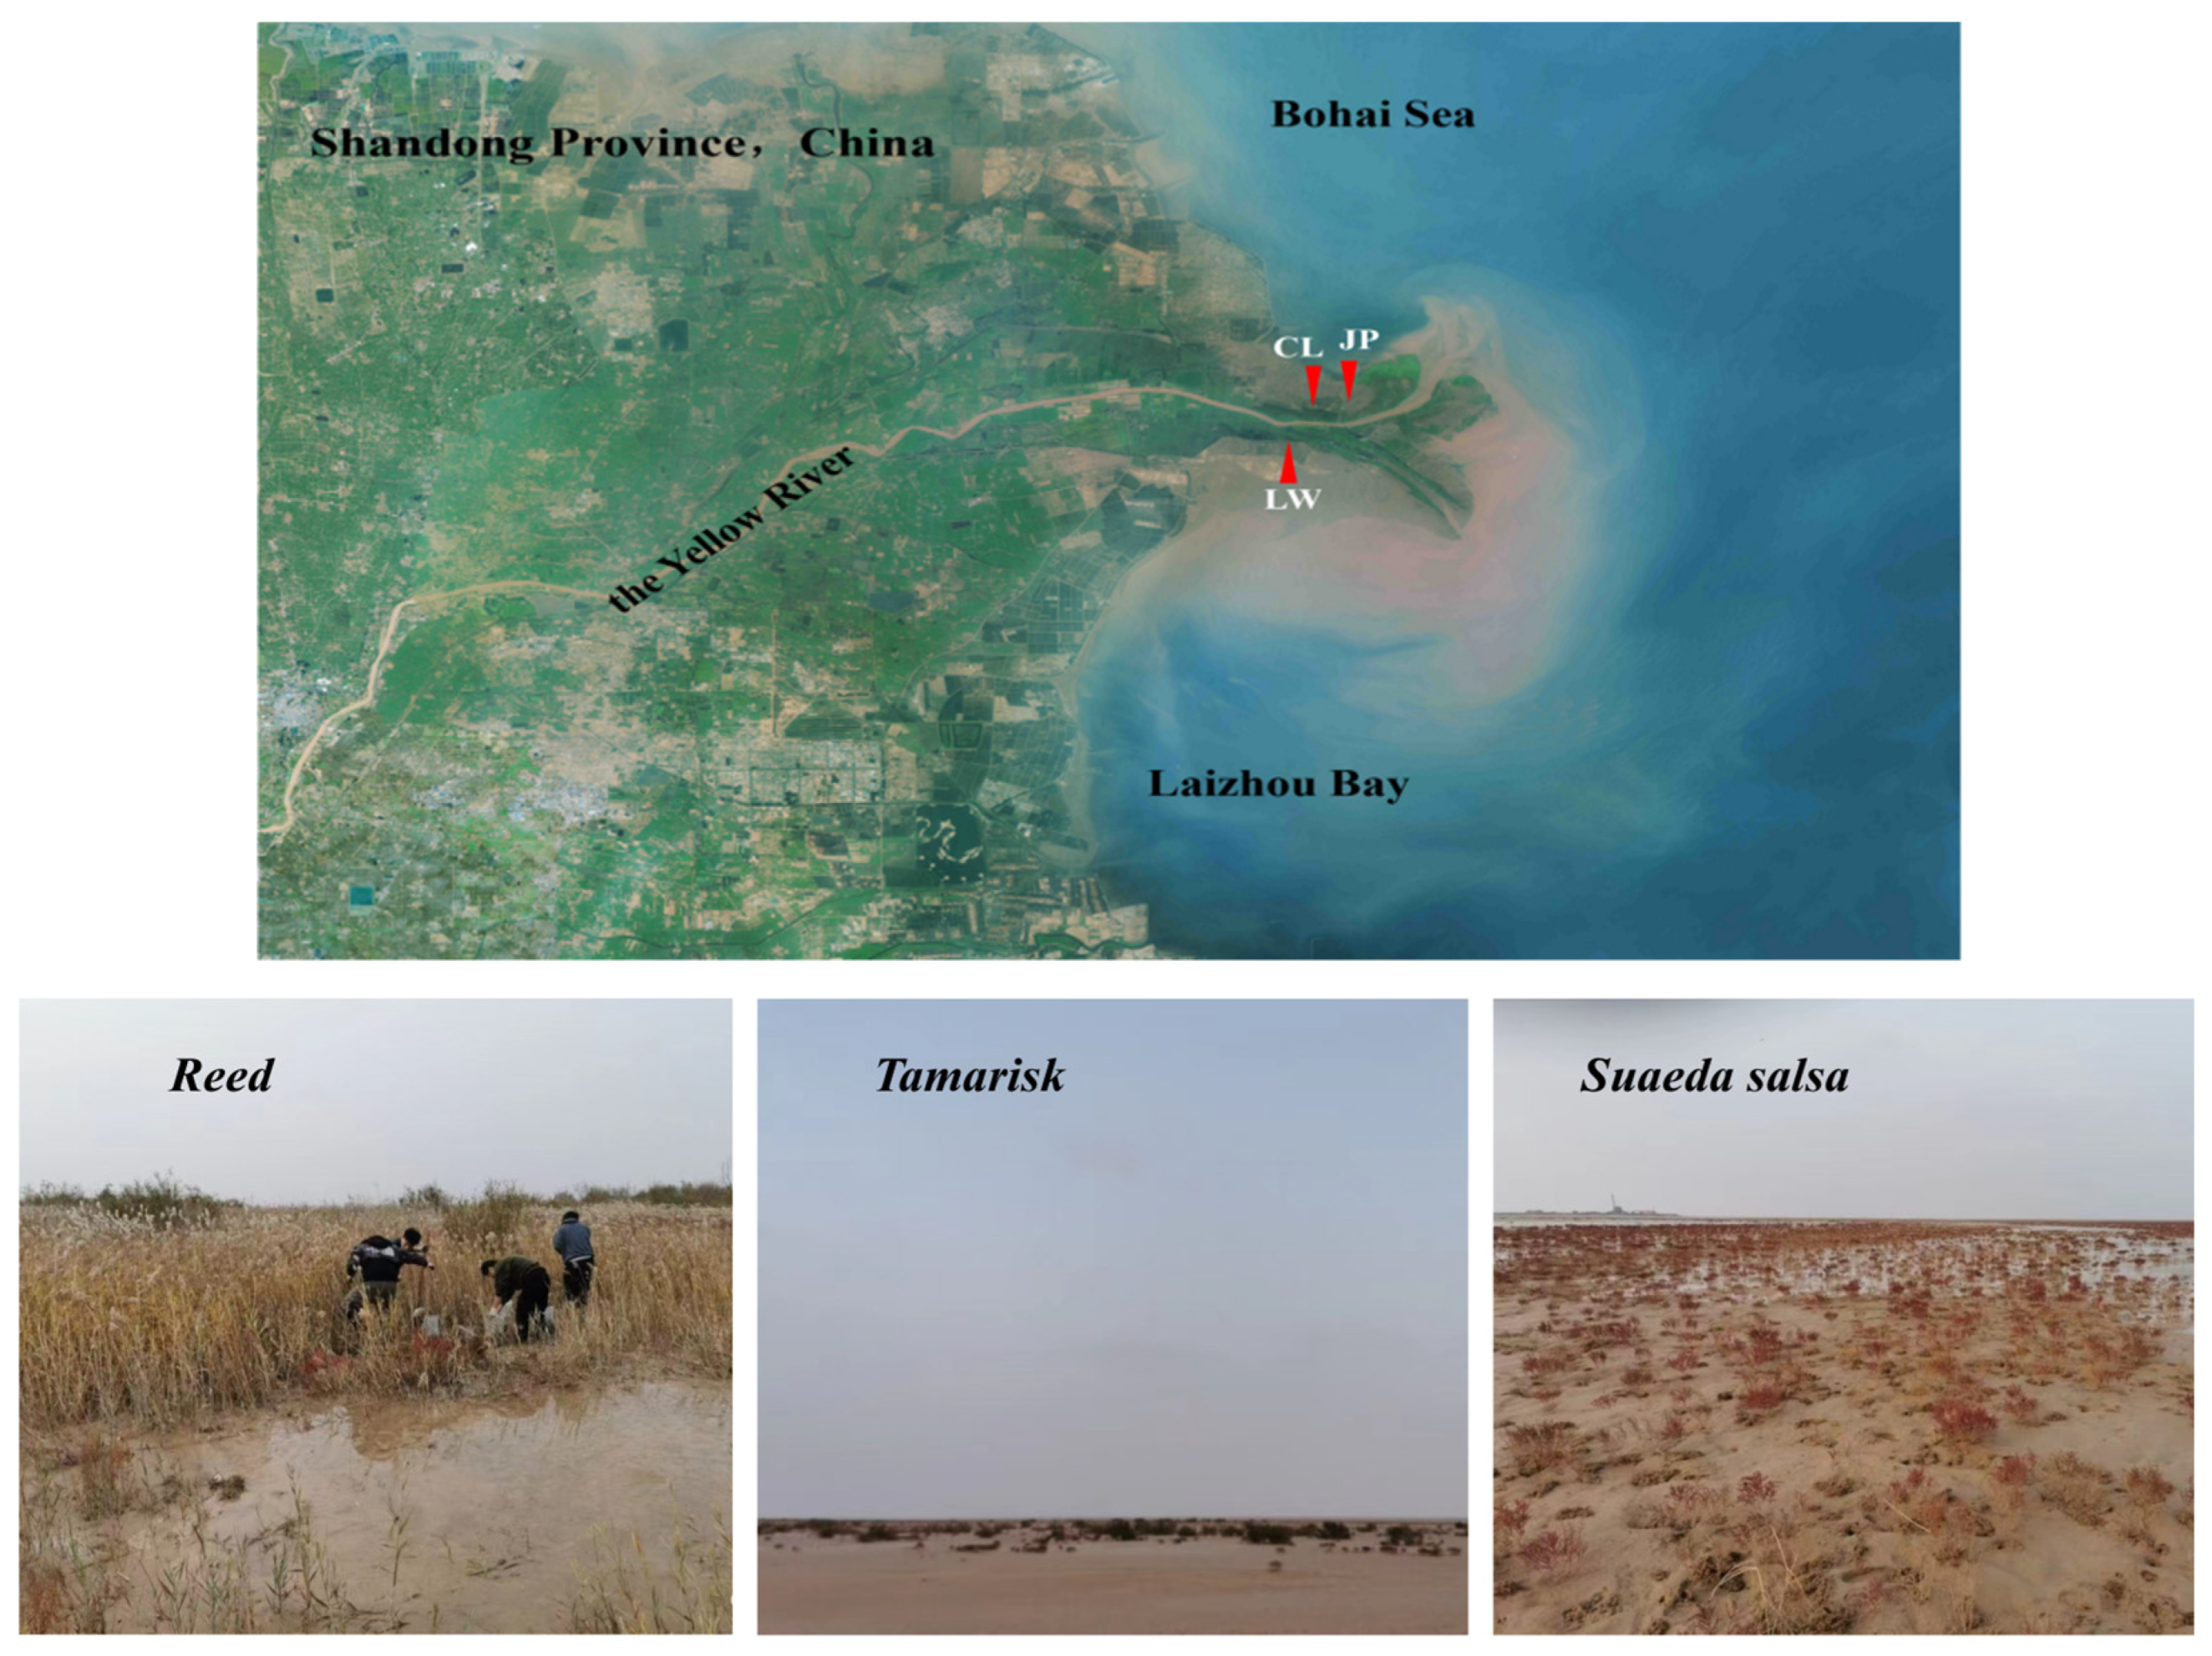
2.1. Study Area Overview

The Yellow River Delta coastal wetland located in the northeast of Dongying City, Shandong Province (China), on the coast of the Bohai Sea (Figure 1), with a mild and humid climate, an annual average temperature of 9.7–17.9 (±0.3) °C, rainfall of about 540–850 mm, and rainfall concentrated in the summer, is one of the most important wetland ecosystems in the world. The Yellow River Delta coastal wetland has two characteristics: it is easy to destroy and difficult to restore. A coastal wetland is an intermediate medium in the transition from the sea to the land. Its basic ecological functions include “maintaining the ecological balance between land and sea”, “regulating the circulation of elements and materials” and “controlling global climate change”. The Yellow River Delta wetland is a sedimentary plain formed by the large amount of sediment carried by the Yellow River over the past hundred years to fill the depressed area in the Bohai Sea. It has a flat and wide terrain, an east-west ratio of approximately 1:10,000, a shallow water level of below 2 m, a mineralization of 10–20 mL∙L−1, a precipitation of 551.6 mm, an evaporation of 1928.2 mm, and a distinct continental monsoon climate. The area is rich in wetland types and diverse landscape types, with 68.4% of it representing natural wetlands. The ecosystem of the Yellow River Delta wetlands is very unique and has significant special characteristics and complexity due to the multiple influences of the saline environment, freshwater environment, and tidal action.

2.2. Sample Collection and Culture Methods

2.2.1. Sample Collection

In this study, three typical vegetation zones of Reed (37°74′35.17′′ N, 119°1′43.75′′ E), Tamarisk (37°77′24.76′′ N, 119°16′08.26′′ E), and Suaeda salsa (37°78′56.89′′ N, 119°18′54.53′′ E) were selected for collection in the autumn of October 2021 near the coastal wetlands of the Yellow River Delta. A total of 5 randomly selected 3 m × 3 m survey samples of uniform texture were taken from each vegetation zone cover soil, and the plants above the ground were cut along the soil surface and the surface soil was removed before collection. Then, shallow soil samples of 0–20 cm and deep soil samples of 20–60 cm were taken using column samplers, and the soil was mixed evenly with the five-point sampling method and divided into two parts into collection bags and returned to the laboratory using an insulated box with a biological ice bag. Some will be used for the determination of physical and chemical properties in the laboratory and indoor culture experiments, and the rest will be used for high-throughput sequencing after ultra-low temperature freezing (−81 °C).

2.2.2. Determination of Physical and Chemical Factors

The soil samples used for physicochemical property determination were air-dried, ground, and sieved to prepare dry soil. The determination of each physicochemical factor was carried out according to the Soil Environmental Quality Standard (GB 15618-2018) [35]. The results are shown in Section 3.1.

2.2.3. Indoor Culture Experiments

Fresh soil samples equivalent to 30 g dry weight were placed in 150 mL culture flasks and treated with SO42− additive according to the SO42− content in the determination of soil physical and chemical properties (Section 3.1.), and the amount of Na2SO4 additive was about 0.5/1/1.5 times the average value of SO42− in the deep and shallow soil layers [36]: (1) Deionized water as CK (B); (2) Reed: 15/30/60 mg/kg (A1/A2/A3); (3) Suaeda salsa: 50/100/200 mg/kg (B1/B2/B3); (4) Tamarisk: 50/100/200 mg/kg (C1/C2/C3); Na2SO4 solution was added to the culture device instead of distilled water to ensure that both had a water content between 30% and 40%. Two glass tubes (one long and one short) were inserted in the rubber stopper. The longer tube was inserted into the slurry as the N2 inlet, while the short tube was slightly inserted into the culture bottle as the gas outlet and gas sampling port. The culture bottle was flushed with high purity nitrogen (N2) at a flow rate of 500 mL·min−1 for 5 min to remove all the oxygen (O2) in the bottle and form an anaerobic environment and seal it with a reverse rubber plug. The bottles were incubated for one week at 30 °C in the dark to consume as much of the remaining O2 in the soil slurry as possible. After 1 week, take out and replace 10 mL of high-purity CH4 (99.99%) with the top gas in the bottle with a microinjector [37,38]. The culture flasks were placed in a constant temperature incubator at 25 °C under dark conditions [39]. Every 24 h, 2 mL of gas was withdrawn at the same time to detect the change in CH4 concentration, and 2 mL of N2 was passed after each withdrawal of gas to maintain the pressure equilibrium inside and outside the culture flasks. 3 replicates for each concentration group.

2.2.4. Methane Concentration Analysis Method

Gas samples were taken from incubation bottles, and their CH4 concentrations were determined by gas chromatography (Agilent 7890/5975C inert MSD; Santa Clara, CA, USA). The CH4 detector was a hydrogen flame ionization detector with a detector temperature of 300 °C and a separation column temperature of 80 °C. The AOM potential was calculated using Equation (1).
P = d c d t · V W · M W M V · 273 T
P—AOM potential (μg·g−1·d−1); dc/dt—variation of CH4 gas concentration in the incubation flask with time (μmol·g−1·d−1); V—volume of gas in the culture flask (L); W—dry soil weight (g); MW—molecular weight of CH4 (g); MV—volume of 1 mol of gas in the standard state (L); T—incubation temperature (K).

2.3. DNA Extraction and PCR Amplification

DNA extraction was performed according to the instructions of the Magnetic Soil and Stool DNA Kit (Qiagen, Valencia, CA, USA), DNA concentration and purity were measured using a Nanodrop 2000 spectrophotometer, and the quality of DNA extraction was detected by 1% agarose gel electrophoresis. DNA was extracted using PCR amplification of the V4 variable region, which was performed with primers 515FmodF (5′-GTGYCAGCMGCCGCGGTAA-3′) and 806RmodR (5′-GGACTACNVGGGTWTCTAAT-3′) and the amplification system was 30 μL, 15 μL Phusion Master Mix (2×) buffer, 3 μL 2 μmol·L−1 primer, 4 μL FastPfu polymerase, 10 ng gDNA template, and 2 μL H2O. The amplification procedure included 98 °C pre-denaturation for 1 min, 30 cycles (98 °C denaturation for 10 s, 50 °C annealing for 30 s, 72 °C extension for 30 s), and a final extension step at 72 °C extension for 5 min (Bio-Rad T100 gradient PCR instrument, Hercules, CA, USA).

2.4. PCR Products Quantification and Qualification

Mix equal volumes of 1× loading buffer (containing SYB green) with PCR products and operate electrophoresis on 2% agarose gel for detection. PCR products were mixed in equidensity ratios. Then, the mixture of PCR products was purified with a Qiagen Gel Extraction Kit (Qiagen, Hilden, Germany).

2.5. Library Construction and Illumina Miseq Sequencing

The library was constructed using the Illumina TruSeq DNA PCR-Free Library Preparation Kit, and the constructed library was quantified and tested by Qubit and then sequenced using NovaSeq6000 (the whole process of this work is entrusted to Tianjin Novogen Co., Ltd., Tianjin, China).

2.6. Data Analysis

The experimental data were statistically analyzed using SPSS 25.0, and the least significant difference (LSD) method was used to test for significant differences between AOM potentials after different input concentrations of SO42− at the level of 0.05 and plotted using Origin Pro 2021. The diversity matrix was calculated using the QIIME2 core-diversity plug-in. The determination of the alpha diversity index at the feature sequence level and β-diversity analysis were performed using QIIME2 core-diversity to assess the differences between samples in terms of species complexity. A correlation heat map was plotted using R language.

3. Results

3.1. Physicochemical Properties Determination Results

The physical and chemical properties of each original soil sample are determined in Table 1.

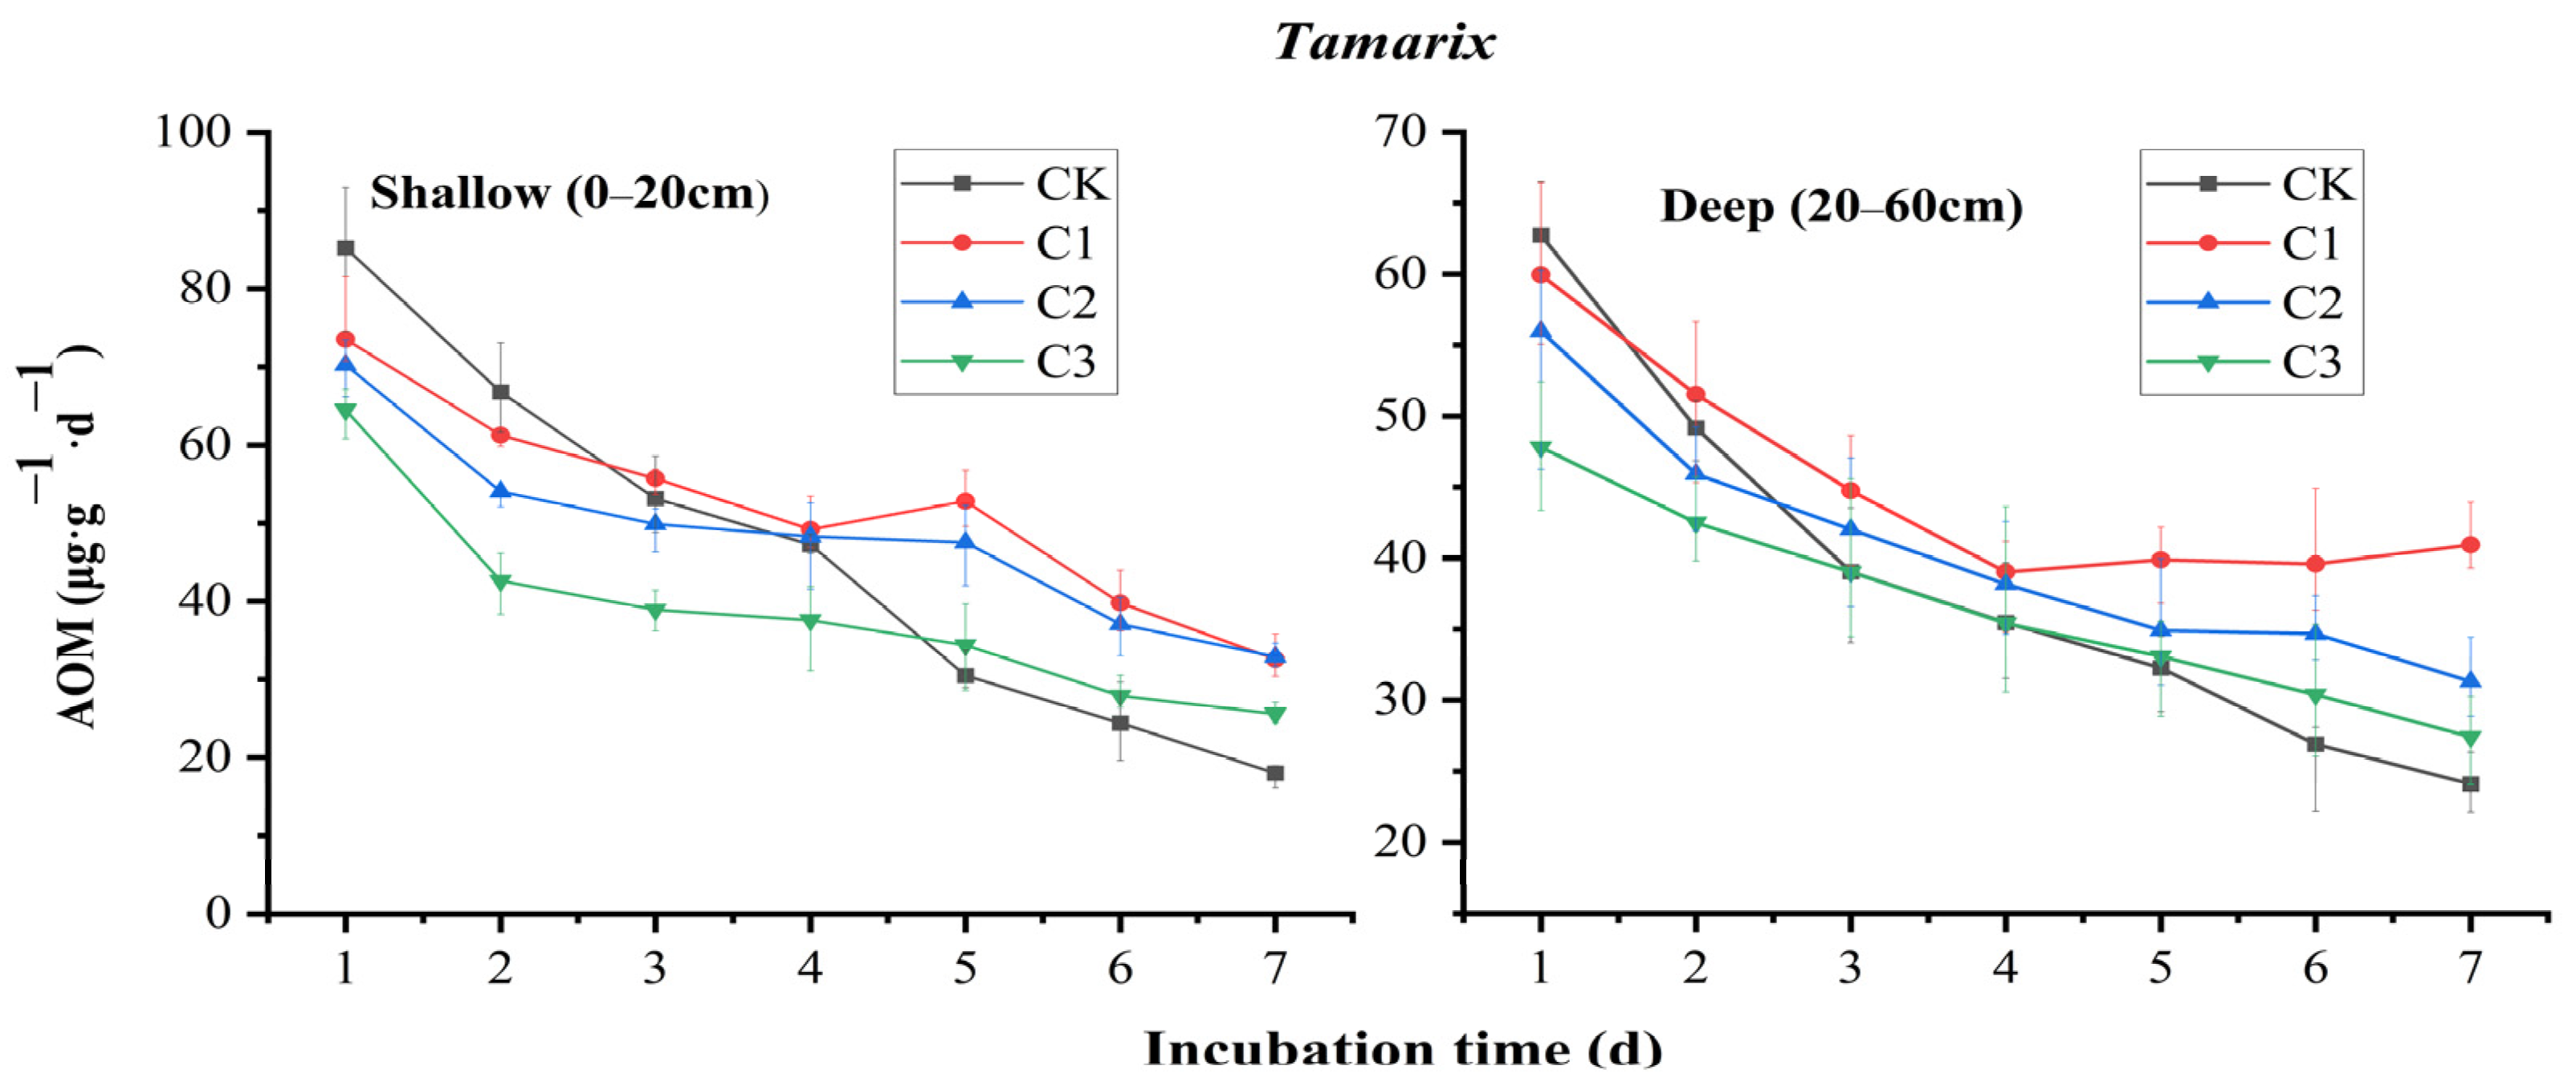
3.2. Effect of SO42− Input on AOM Potential

The AOM potential of the shallow soil layer under Reed vegetation (Figure 2, detailed data in Supplementary Materials) was lower in the added group (A1/A2/A3) than in the blank group B from the first day to the third day. During the third to seventh days, the AOM potential of blank group B decreased first and then increased, while the AOM potential of the three additive groups decreased first and then stabilized, and the AOM potential was lower than that of blank group B. The Reed deep soil showed that the AOM potential of blank group B was lower than that of blank group B from the first to the fourth day. After the fourth day, the AOM potentials of A1, A2 concentration group, and blank group B tended to be the same, and only the AOM potential of A3 concentration group decreased significantly. This phenomenon may be due to the low amounts of A1 and A2 concentrations, and the small gap between the SO42− content and background value.
Under the cover of Tamarix (Figure 3, detailed data in Supplementary Materials), the AOM potential of the shallow layer of soil in blank group B was slightly higher than that of the other three additive groups (C1/C2/C3) from the first day to the third day, and the AOM potential of blank group B decreased faster than that of the other three additive groups from the fourth day to the seventh day. During the whole process, the potential change rate of the three additive groups is relatively slow, and the change trend among the three groups is relatively similar. It can be seen that the AOM potential is C1 > C2 > C3 in the whole process. The change in AOM potential of deep soil is similar to that of shallow soil. The decline rate of blank group B is the fastest. Group C1 shows a trend of first decline and then rise. Groups C2 and C3 slowly decline, and the rate is lower than that of group B.
Under Suaeda salsa vegetation cover (Figure 4, detailed data in Supplementary Materials), the AOM potential of blank group B in the shallow soil layer from the first day to the third day is higher than that of the added group (B1/B2/B3), and the AOM potential of B2 and B3 groups is significantly lower than that of blank group B. On the fourth day of the experiment, it was found that the content of CH4 in blank group B and C1 groups is almost exhausted. After adding CH4 to these two groups, the AOM potential first rises rapidly and then decreases gradually. In the deep soil of Suaeda salsa, on the third day, the blank groups B and B1 had already experienced a phenomenon of depletion of CH4, and after supplementing them with CH4, a phenomenon similar to that in the shallow soil occurred, which first rapidly increased and then decreased. The AOM potential of the B3 group continued to decrease from beginning to end and was significantly lower than that of other groups. It can be seen that the change rate of AOM in Suaeda salsa soil has a certain relationship with the input concentration of SO42−.
From the overall level (Figure 5), it can be seen that after SO42− is input into Reed soil, the inhibition effect is produced in both shallow and deep layers of soil, and the inhibition effect increases with the increase in SO42− concentration. When the maximum input concentration of 60 mg/kg is reached in shallow soil, the inhibition effect is significant compared with blank group B (p < 0.05), and the final potential is 40.44 μg.g−1·d−1 (−10.29%). The deeper soils also showed insignificant inhibition in the first two smaller input concentrations and a significant inhibition compared to the blank group B (p < 0.05) at 60 mg/kg SO42−, with a final potential of 48.44 μg.g−1·d−1 (−9.74%). After SO42− was input into Tamarix soil, the AOM potential of adding groups C1 and C2 showed a significant promoting effect compared with that of blank group B. The AOM potential of the C2 group increased more than that of the C1 group, and the final concentration was 52.15 (12.20%). After reaching the maximum input concentration, the AOM potential of the C3 group was lower than that of blank group B, and the final AOM potential was 43.04 μg.g−1·d−1 (−7.99%). The change in the AOM potential of the deep soil of Tamarix after SO42− input is consistent with that of the shallow soil. The AOM potential is 42.55 μg.g−1·d−1 (10.52%) in the C2 group and 31.68 μg.g−1·d−1 (−17.74%) in the C3 group. The shallow soil AOM potential showed significant inhibition after SO42− input in the Suaeda salsa, and the B2 and B3 groups showed significant inhibition compared to the blank group B (p < 0.05). The shallow soil AOM potential showed an overall inhibition of B1: 41.59 μg.g−1·d−1 (−14.23%), B2: 27.51 μg.g−1·d−1 (−43.27%), and B3: 23.77 μg.g−1·d−1 (−50.98%), and all three concentration groups showed inhibition in Suaeda salsa deep soil, although only B3 was significantly inhibited (p < 0.05). The following AOM potentials were determined: B1: 23.79 μg.g−1·d−1 (−14.49%), B2: 22.29 μg.g−1·d−1 (−22.21%), and B3: 15.36 μg.g−1·d−1 (−77.34%). Overall, in Suaeda salsa soil, the inhibition of AOM potential increases with the increase in input SO42− concentration.

3.3. Effect of SO42− Input on Microorganisms

3.3.1. Changes in Microbial Diversity

A total of 1,434,864 effective sequences (Effective Tags) were obtained from 24 soil samples after sequencing and quality control by the Illumina Nova sequencing platform, and the average length of Effective Tags was concentrated between 418 and 424 bp, accounting for 78.07% of PE reads sequences, and clips with quality values ≥30 accounted for about 92.35~94.45% of total bases. Notably, for the scientific and realistic analysis of microbial community diversity, the quality of sequences is an important guarantee for gene annotation. The microorganisms in the soil samples selected for this experiment were derived from 34 phyla, 70 orders, 126 orders, 136 families, 128 genera, and 40 species. The Blank group B of four soils: Reed shallow, Reed deep, Suaeda salsa shallow, and Suaeda salsa deep, had higher operational taxonomy units (OTUs) than those of the remaining treated sample based on alpha diversity index analysis (Table 2). This indicated that the blank groups had the highest microbial richness. Meanwhile, the OTU numbers of blank group B of Tamarix shallow and Tamarix deep were lower than other samples after treatment, indicating that the microbial richness in the blank samples of Tamarix soil was the lowest.
The Alpha diversity index is an important expression of the microbial richness and diversity of the samples. From the table, it can be seen that in the Reed and Suaeda salsa land, the diversity index of all samples with SO42− input was lower than that of the blank group, and the OTU number also decreased to a certain extent. This proves that the richness and evenness of microorganisms in the soil have decreased due to the influence of SO42− during the cultivation of soil samples after input of SO42−, and some dominant species were enriched, while the diversity of microorganisms generally decreased with increasing SO42− input concentration. However, in Tamarix soil, the Alpha index of the three added groups is higher than that of the blank group B, indicating that in Tamarix soil, the input of SO42− can increase the uniformity and richness of microorganisms to a certain extent, and the overall trend shows an inverted “V” shape, and the peak value is higher than that of the current C1 group, indicating that the increase of microbial diversity in Tamarix soil will decrease with the increase of SO42− input concentration.

3.3.2. Changes in the Structural Composition of Microbial Communities

Microbial richness analysis of all soil samples yielded the following two histograms of the top 10 relative abundances of species at the phylum level and genus level, respectively. First, the top 10 species in terms of relative abundance at the phylum level (Figure 6A) are: Proteobacteria, Chloroflexi, Bacteroidetes, Acidobacteria, Gemmatimonadetes, Desulfobacterota, Firmicutes, Crenarchaeota, Gracilibacteria, and unidentified_bacteria. Among them, the relative abundance of Proteobacteria is very high (≥30.33%). After indoor cultivation, it was found that in Reed soil, Proteus had no significant change in other soil samples except in the A2 group. On the whole, Proteobacteria showed an upward trend in the deep and shallow soil samples of Suaeda salsa after cultivation and a downward trend in the soil samples except for C3 in Tamarix soil. In the shallow soil of Tamarix soil, the relative abundance of Desulfobacterota (SRB) in C1 and C2 groups increased significantly (25.08~52.54%), and the relative abundance of Crenarchaeota in C1 and C2 groups of Tamarix chinensis increased to (21.15~133.2%). No similar phenomenon was observed in other soil environments.
At the genus level, four methylotrophic bacteria genera were enriched after SO42− concentration: Methylophaga, Methylomonas, Methylotenera, and Methylobacter, all of which use CH4 as a carbon source, occupied a large relative abundance and became the dominant species in the soil samples (Figure 6B). Methylomonas occupied a larger relative abundance in Reed soil and decreased with increasing SO42− concentration in shallow soils (between −3.87% and −87.11% decrease compared to the blank group B); in the deep soil, the abundance of the bacteria did not change significantly in the A1 and A2 groups but increased significantly in the A3 group (38.11%). In the shallow soil of Tamarix and Suaeda salsa, it was observed that the abundance of Methalophaga increased with the increase in the concentration of SO42− (23.76~189.50% and 16.61~44.85%, respectively). In the deep soil of Suaeda salsa, the relative abundance of Methalophaga in the B1 and B2 concentration groups gradually increased, and there was no significant difference between the B3 group and the blank group. In the deep soil of Tamarix, the relative abundance of Methalophaga in blank group B is significantly higher than that of the three added groups (36.59~70.35%), and the potential of AOM shows B > C3 > C2 > C1, indicating that the input of SO42− will have different effects on Methylomonas and Methalophaga, two species that use CH4 as a carbon source.
The heat map of the clusters (Figure 7) obtained after normalization based on the raw data of soil samples. The horizontal coordinates are the sample names, and each small grid represents a species. The closer the color is to red, the higher the relative abundance of the species; the closer it is to blue, the lower it is. The closer the samples in the clustering tree are to each other, the shorter the branch lengths are, and the more similar the microbial community composition is between the samples.
RS.S, RS.B, RD.B, and RD.S form a branch that is independent from TS.B to SS.S at the phylum level (Figure 7A). RS.S and RS.B, RD.B, and RD.S do not belong to the same branch, which proves that SO42− addition in the shallow layer of Reed soil significantly changed the population structure of microorganisms. Meanwhile, TS.S and TS.B form a small branch, and the remaining six soil samples (TD.(B,S), SS.(B,S), and SD.(B,S)) form another branch. The clustering of microorganisms at the genus level (Figure 7B) was again different from that at the phylum level, with TD.B and TD.S acting independently as one large branch and the remaining 10 soil samples as one large branch. Although CS. B and CS. S are on the same branch, there are significant differences in the abundance of the four genera Alcanivorax, Methylophaga, Methylomicrobium, and Marinnobacter, which prove that the input of SO42− leads to the decline of the relative abundance of these four genera. In another big branch at the genus level, RD. B and RD. S became a small branch independently of the other eight soil samples. In the branches composed of these eight soil samples, SS. B and SS. S were found to belong to two different branches, respectively, and the relative abundance of three genera of Methylotenera, Methylobacter, and Methylomonas in SS.S was significantly decreased compared with that in SS.B. In addition, changes in the relative abundance of some specific species were observed in both TS.B and TS.S. These phenomena are due to some effects on the microbial community structure in the soil after the input of SO42− and incubation for seven days.

4. Discussion

4.1. Response of Soil AOM Potential to SO42− Input

The results showed that the addition of SO42− in Reed soil can make the shallow soil have a certain AOM inhibition effect, but no matter whether the soil is shallow or deep, only the experimental group with the maximum amount of SO42− has a significant inhibition effect, and the AOM inhibition effect is not significant under the other amounts of concentration. The phenomenon of a gradual increase in inhibition is positively correlated with the change in abundance of Methylomonas in Reed soil, indicating that there is a certain relationship between the change in soil AOM potential and the change in abundance of Methylomonas after adding SO42− in Reed soil. Wang Fangyuan’s study showed that adding SO42− to Reed soil in Chongming Dongtan did not have a significant impact on AOM potential, which was partially the same as the results of this study [40]. The results showed that only when the input concentration of SO42− in Reed soil reached more than 2 times the background concentration could it have a significant inhibitory effect.
The experimental results showed (Figure 5) that in Tamarisk soils, the AOM potential of deep and shallow soils was similar in the response mechanism to SO42− input, and the AOM potential showed a trend of increasing and then decreasing with the increase of SO42− added concentration, and the overall AOM potential of the C3 group in both shallow and deep soils is lower than that of blank group B. Studies have shown that methanogens and SRB can coexist in any sulfate concentration environment, and methanogenic reactions and SAMO reactions can occur simultaneously [41]. According to Figure 3, the AOM potential decline rate of blank group B without adding SO42− is evidently higher than that of the other SO42− added groups, indicating that adding SO42− in Tamarix soil can make the activity of SRB bacteria stronger than methanogens, thereby making the SAMO reaction stronger than the methanogenic reaction, reducing the decline rate of AOM potential, and enhancing the overall AOM potential of soil. At the same time, with the increase in the concentration of SO42− added, the soil AOM potential shows a downward trend, indicating that anexcessive concentration of SO42− in Tamarix soil will weaken the SAMO reaction. This proves that there is a certain threshold value for the SO42− concentration that enhances SAMO in Tamarix soil, and only when this threshold value is reached can the SAMO reaction be promoted to the maximum extent.
Alperin and Reeburgh showed that the AOM rate of wetland sediments varied little from 0 to 15 cm and sharply decreased from 15 to 30 cm, which is the same as the Suaeda salsa soil treatment in this study. The experimental results show (Figure 4) that in Suaeda salsa soil, whether in the shallow or deep layers, the AOM potential of blank group B and added group B1 increased significantly and then decreased rapidly by the third day of the experiment. This phenomenon is due to the low concentration of SO42− in groups B and B1, so the consumption of CH4 as the main carbon source is large. As the main carbon source, CH4 in the culture bottle is rapidly consumed, the nutrient supply is insufficient, and the microbial activity is reduced. Therefore, after the supplementation of CH4, the AOM potential is significantly increased in the short term due to the increase in microbial activity. When the microorganism gradually adapts, the AOM potential is rapidly reduced to the normal range. The CH4 content in group B2 was exhausted on the fourth day. After a certain amount of CH4 was added to group B2, the same phenomenon occurred in group B2 as in group B1 after CH4 was added, but the range of change was smaller than that in group B1, indicating that the activity of microorganisms in group B2 was weaker than that in group B1. In addition, there was no phenomenon of CH4 depletion in Group B3, which proves that in Suaeda salsa soil, as the concentration of input SO42− increases, the overall activity of microorganisms decreases and the oxidation ability of CH4 decreases accordingly. According to the change in overall AOM potential response of Suaeda salsa soil after SO42− addition in Figure 5, it can be seen that in the shallow soil of Suaeda salsa, after SO42− addition, the AOM potential of groups B1, B2, and B3 decreased significantly compared with blank group B (p < 0.05), and in the deep soil, the AOM potential of group B3 decreased significantly (p < 0.05). According to the change rules in Figure 4 and Figure 5, in Suaeda salsa, input SO42− can inhibit the AOM potential of the soil, and the inhibition effect will be stronger with the increase in input concentration.
Wang and Zeng found that adding SO42− to the soil in the Minjiang River estuary has no significant impact on the AOM potential in the soil, which is the same as the conclusion of this study. The difference may be due to the heterogeneity of soil habitats in different wetlands and the fact that only a single concentration of SO42− was added in the experiment [42,43].
The results show that not all concentrations of SO42− addition increase or decrease the soil AOM potential, indicating that whether SO42− addition can promote or inhibit soil AOM potential depends not only on the concentration of SO42− addition but also on the background value concentration in the soil environment. For example, SO42− has no significant effect on CH4 oxidation in paddy soils and wetland environments with low SO42− concentrations [26,44,45]. Therefore, it is speculated that SO42− addition should be based on the soil background values and that the AOM potential can only be maximally promoted or inhibited by bringing the SO42− in the environment to a certain concentration threshold or range.

4.2. Microbial Response to SO42− Input

The results of this experiment showed that SO42− input caused a decrease in all four alpha diversity indices of soil microorganisms, resulting in a decrease in the abundance and evenness of soil microorganisms in Reed soil and Suaeda salsa soil, indicating that the addition of SO42− in these two vegetation soils would have an inhibitory effect on microbial activity. However, in tamarisk soils, the Shannon and Simpson indices showed some increase, and the homogeneity of soil microorganisms increased, indicating the successful enrichment of some dominant flora, while the AOM potential was enhanced by the addition of SO42− in Tamarisk soils, demonstrating the enrichment of microorganisms involved in the SAMO process. In addition, observing the relative abundance of bacteria at the microbial phylum and genus levels, it was found that the changes in the relative abundance of bacteria in different vegetation soils after adding SO42− were different, which might be caused by the obvious heterogeneity of the composition and quantity of microorganisms in the wetland of the Yellow River Delta in different vegetation soils [46,47].
The research results indicate that at the phylum level, Proteobacteria is the dominant microbiota, which often participates in the decomposition of organic matter and the processes of microbial nitrogen fixation and desulfurization. δ- Proteobacteria have been shown to participate in sulfur cycling in saline environments [48]. Desulfovibrio, Desulfobacter, Desulfococcus, etc. belong to δ-Proteobacteria and play an important role in the anaerobic oxidation of methane [49,50,51]. In addition, research shows that Bacillus and Clostridium in Firmicutes also play an important role in the carbon cycle [52], and Chloroflexi viridis has been confirmed by a large number of studies to participate in the cycle processes of C, N, and S [53]. In this study, the average relative abundance of Proteobacteria was as high as 51.75%, occupying a dominant position in all dominant bacteria, which is the same as that of Proteus in long-term flooded soil, as confirmed by the research [54,55]. Among them, the relative abundance of Proteobacteria is relatively low in Reed soil and has certain vertical differences; in the soil of Suaeda salsa and Tamarix, due to the closer proximity of the sampling points to the ocean, the relative abundance of Proteobacteria is significantly higher than that of Reed soil, and the content of Suaeda salsa soil is higher than that of Tamarix soil. It was observed that the relative abundance of Proteobacteria and Firmicutes varied in each soil sample after SO42− of different concentrations was introduced into the soil, which may be due to the diversity of Proteus species and the different structural composition in different vegetation-covered soils. It also indicated that the content of SO42− was not a decisive factor affecting the relative abundance of Proteobacteria and Firmicutes. Although the relative abundance of Chloroflexi accounted for only 0.9–1.5% in Tamarix soil, the relative abundance of all the addition groups showed an increase in varying degrees, indicating that Chloroflexi participated in the SAMO process in Tamarix soil.
In Tamarix soil, the relative abundance of Desulfobacterota (SRB) and Crenarchaeota increased significantly in C1 and C2 groups, and the increase of the relative abundance of these two types of bacteria was positively correlated with the increase of the microbial Alpha diversity index and soil AOM potential. The change trend for the three groups of data was the same. It can be considered that the diversity and abundance of microorganisms in soil increased due to the post-input of SO42−. The relative abundance of Desulfobacterota (SRB) and Crenarchaeota increased, which promoted the occurrence of the oxidation and reduction reactions of CH4 and increased the potential of soil AOM.
At the genus level, the relative abundance of Methylomonas in Reed soils increased after SO42− was input and increased with the increase in SO42− concentration, which is consistent with the results of Liu et al. [39]. The relative abundance of Methylophaga decreased with increasing SO42− concentration in shallow soils of Suaeda salsa and increased with rising SO42− concentration in deeper layers, and only in the B3 group in the deep layer of Suaeda salsa with the maximum added amount did the rising range decrease. Meanwhile, it showed a decrease in Tamarisk soil and the decrease decreased with the increase in SO42− concentration.
After the addition of SO42−, the microorganisms in each addition group enriched four kinds of methyltrophic bacteria, Methylophaga, Methylomonas, Methylotenera, and Methylobater, which can use CH4 as a carbon and energy source at the genus level, and made them the dominant bacteria. This indicates that there is a close relationship between the increase of SO42− concentration in the environment and the enrichment of methyltrophic bacteria, which indicates that these bacteria enhance their activity in some ways after SO42− input so that the bacteria are enriched, which also indicates that these bacteria may be coupled with the CH4 consumption and sulfur cycling process in the natural environment and participate in the SAMO to a certain extent. At the same time, this result proves that there must be methane oxidizing bacteria in the methane oxidation system with sulfate as the electron acceptor, but not necessarily sulfate-reducing bacteria [56].

5. Conclusions

(1)
The response of AOM potential to SO42− input was somewhat different in different vegetation types and soils at different depths. Only significant SAMO processes were found in Tamarix soil, indicating that not all types of soil can undergo significant SAMO reactions after SO42− input. This may be due to the significant differences in soil microorganisms caused by different soil vegetation types; this can also better explain why the AOM potential changes vary after inputting SO42− in different wetland types;
(2)
SO42− input caused changes in the abundance and homogeneity of soil microorganisms, and the relationship between the changes and their input concentrations was correlated. Moreover, a peak in the increase of AOM potential was found in tamarisk soils, indicating that there is a certain threshold of SO42− addition in tamarisk soils to make the SAMO effect strongest;
(3)
The relative abundance of Methylophaga, Methylomonas, Methylotenera, Methylobcater, Desulfobacterota, and Crenarchaeota showed significant changes after the input of SO42−, indicating that these bacteria may be involved in the process of methane consumption and sulfur cycling in the soil.
This study shows that there is a certain SAMO effect in the Yellow River Delta, and the strength of the SAMO effect is influenced by soil vegetation type, soil depth, and soil microbial composition. In addition, it was found that the change in soil AOM potential after SO42− input may also be closely related to soil physicochemical factors. In the future, it will be very important to study the effect of vegetation type on soil physicochemical factors and the mechanism of soil physicochemical factors on the soil microbial community and to identify the SO42− concentration threshold that maximizes the effect of SAMO in Tamarix soil. It can further improve the research on the AOM mechanism in the Yellow River Delta, which will provide a scientific basis for the CH4 emission reduction process of coastal wetlands, play an important role in mitigating the greenhouse effect and the global carbon emission reduction process, and contribute to the theoretical basis for global sustainable development.

Supplementary Materials

The following supporting information can be downloaded at: https://www.mdpi.com/article/10.3390/su15097053/s1.

Author Contributions

Investigation, X.W., Y.T., L.L. and B.Z.; Data curation, J.L.; Writing—original draft, J.L.; Writing—review & editing, Q.C.; Supervision, C.Z.; Project administration, Q.C. and B.G.; Funding acquisition, Q.C. All authors have read and agreed to the published version of the manuscript.

Funding

This research was funded by [National Natural Science Foundation of China] grant number [41877041] and [National Natural Science Foundation of China] grant number [42077051], and [Qilu University of Technology (Shandong Academy of Sciences) science, education, and industry integration innovation pilot project] grant number [2020KJC-ZD13], and [Natural Science Foundation of Shandong Province] grant number [ZR2022MC204].

Institutional Review Board Statement

Not applicable.

Informed Consent Statement

Not applicable.

Data Availability Statement

The dataset used in this research is available upon request from the corresponding author.

Acknowledgments

We sincerely appreciate the technical support of chemical analysis provided by Shandong Academy of Sciences, the cooperation and assistance provided by the scientific research team of Shandong Normal University led by Chen Qingfeng, and the high-throughput detection and analysis of microorganisms provided by Novogene Company. We thank the anonymous reviewers for their helpful comments.

Conflicts of Interest

The authors declare that they have no conflict of interest regarding the publication of this paper.

Abbreviations

AOM—anaerobic oxidation of methane; DIET—direct interspecies electron transfer; metal-AOM—metal ionic methane anaerobic oxidation; LSD—least significant difference; n-DAMO—nitrate-based methane anaerobic oxidation; out—operational taxonomy unit; SAMO—sulfate-based methane anaerobic oxidation; SRB—sulfate-reducing bacteria.

References

  1. Shukla, P.R.; Skea, J.; Slade, R. IPCC, 2022: Climate Change 2022: Mitigation of Climate Change. Contribution of Working Group III to the Sixth Assessment Report of the Intergovernmental Panel on Climate Change; IPCC: Cambridge, UK; New York, NY, USA, 2022. [Google Scholar]
  2. Islam, M.M.; Chowdhury, M.A.M.; Begum, R.A.; Amir, A.A. A bibliometric analysis on the research trends of climate change effects on economic vulnerability. Environ. Sci. Pollut. Res. Int. 2022, 29, 59300–59315. [Google Scholar] [CrossRef]
  3. Raihan, A.; Tuspekova, A. The nexus between economic growth, renewable energy use, agricultural land expansion, and carbon emissions: New insights from Peru. Energy Nexus 2022, 6, 100067. [Google Scholar] [CrossRef]
  4. Whiticar, M.J. The Biogeochemical Methane Cycle. In Hydrocarbons, Oils and Lipids Diversity, Origin, Chemistry and Fate; Springer: Cham, Switzerland, 2020; pp. 669–746. [Google Scholar]
  5. IPCC. Climate Change 2013: The Physical Science Basis. Contribution of Working Group I to the Fifth Assessment Report of the Intergovern-Mental Panel on Climate Change; Cambridge University Press: Cambridge, UK, 2013. [Google Scholar]
  6. Zeng, L.-L.; Tian, J.-Q.; Chen, H.; Wu, N.; Yan, Z.-Y.; Du, L.-F.; Shen, Y.; Wang, X. Changes in methane oxidation ability and methanotrophic community composition across different climatic zones. J. Soils Sediments 2018, 19, 533–543. [Google Scholar] [CrossRef]
  7. Li, T.; Lu, Y.; Yu, L.; Sun, W.; Zhang, R. Evaluation of CH4MODwetland and Terrestrial Ecosystem Model (TEM) used to estimate global CH4 emissions from natural wetlands. Geosci. Model Dev. 2020, 13, 3769–3788. [Google Scholar] [CrossRef]
  8. Liu, J.-X.; Chen, H.; Xue, D.; Gao, Y.-H.; Liu, J.-L.; Yang, J. Advances in microbial mediated anaerobic oxidation of methane and its influencing factors. Chin. J. Ecol. 2020, 39, 1033–1044. [Google Scholar] [CrossRef]
  9. Segarra, K.-E.-A.; Schubotz, F.; Samarkin, V.; Yoshinaga, M.-Y.; Hinrichs, K.-U.; Joye, S.-B. High rates of anaerobic methane oxidation in freshwater wetlands reduce potential atmospheric methane emissions. Nat. Commun. 2015, 6, 7477. [Google Scholar] [CrossRef]
  10. Conrad, R. The global methane cycle: Recent advances in understanding the microbial processes involved. Environ. Microbiol. Rep. 2009, 1, 285–292. [Google Scholar] [CrossRef]
  11. Hu, S.; Zeng, R.-J.; Keller, J.; Lant, P.-A.; Yuan, Z. Effect of nitrate and nitrite on the selection of microorganisms in the denitrifying anaerobic methane oxidation process. Environ. Microbiol. Rep. 2011, 3, 315–319. [Google Scholar] [CrossRef]
  12. Sheng, L.-D.; Jin, J.-H.; Jin, X. Research progreess on anaerobic methanotrophs in inland wetlands and freshwater aquatic systems. Acta Ecol. Sin. 2022, 53, 3842–3855. [Google Scholar] [CrossRef]
  13. Buckley, D.H.; Baumgartner, L.K.; Visscher, P.T. Vertical distribution of methane metabolism in microbial mats of the Great Sippewissett Salt Marsh. Environ. Microbiol. 2008, 10, 967–977. [Google Scholar] [CrossRef]
  14. Huang, S.R. Study on the Characteristics of Rhizospheric Microbial Communities in the Heterogeneous Habitats of Coastal Wetlands in the Yellow River Delta. Master’s Thesis, Shandong University, Jinan, China, 2020. [Google Scholar]
  15. Wang, Z.Y.; Xin, Y.Z.; Li, F.M.; Gao, D.M. Microbial Community Characteristics in a Degraded Wetland of the Yellow River Delta. Period. Ocean. Univ. China 2009, 39, 1005–1012. [Google Scholar] [CrossRef]
  16. Douterelo, I.; Goulder, R.; Lillie, M. Soil microbial community response to land-management and depth, related to the degradation of organic matter in English wetlands: Implications for the in situ preservation of archaeological remains. Appl. Soil Ecol. 2010, 44, 219–227. [Google Scholar] [CrossRef]
  17. Liu, F.; Ye, S.Y.; Tang, Y.Q. Analysis of Microbial Community Structure in Coastal Wetland Soil of the Yellow River Delta. Chin. J. Appl. Environ. Biol. 2007, 13, 691–696. [Google Scholar]
  18. Shi, Y.; Wang, Z.-Q.; He, C.-G.; Zhang, X.-Y.; Sheng, L.-X.; Ren, X.-D. Using (13)C isotopes to explore denitrification-dependent anaerobic methane oxidation in a paddy-peatland. Sci. Rep. 2017, 7, 40848. [Google Scholar] [CrossRef]
  19. Zhu, B.; Van, D.-G.; Fritz, C.; Smolders, A.-J.; Pol, A.; Jetten, M.-S.; Ettwig, K.-F. Anaerobic oxidization of methane in a minerotrophic peatland: Enrichment of nitrite-dependent methane-oxidizing bacteria. Appl. Environ. Microbiol. 2012, 78, 8657–8665. [Google Scholar] [CrossRef]
  20. McCullough, L.L. Examining Anaerobic Oxidation of Methane in a Northern Peat Bog. Ph.D. Thesis, University of Oregon, Eugene, OR, USA, 2019. [Google Scholar]
  21. Zhang, M.; Dai, Y.; Dai, P.; Sun, Z.; Lin, X.; He, Z.; Tian, Y. Finding the pieces for the anaerobic methane oxidation jigsaw puzzle in mangrove wetlands. Int. Biodeterior. Biodegrad. 2022, 168, 105375. [Google Scholar] [CrossRef]
  22. Fan, L.-C.; Dippold, M.-A.; Ge, T.; Wu, J.; Thiel, V.; Kuzyakov, Y.; Dorodnikov, M. Anaerobic oxidation of methane in paddy soil: Role of electron acceptors and fertilization in mitigating CH4 fluxes. Soil Biol. Biochem. 2020, 141, 107685. [Google Scholar] [CrossRef]
  23. Luo, D.; Meng, X.; Zheng, N.; Li, Y.; Yao, H.; Chapman, S.-J. The anaerobic oxidation of methane in paddy soil by ferric iron and nitrate, and the microbial communities involved. Sci. Total Environ. 2021, 788, 147773. [Google Scholar] [CrossRef]
  24. Zhou, L.; Wang, Y.; Long, X.-E.; Guo, J.; Zhu, G. High abundance and diversity of nitrite-dependent anaerobic methane-oxidizing bacteria in a paddy field profile. FEMS Microbiol. Lett. 2014, 360, 33–41. [Google Scholar] [CrossRef]
  25. Li, X.-F.; Lin, X.-B.; Cheng, L.; Hou, L.-J.; Liu, J.; Hu, X.-T. Extracellular Enzyme Activity and Greenhouse Gases Emisssion Potential in Sediments of Chongming Dongtan Wetland and Their Influencing Factors. J. Soil Water Conserv. 2017, 29, 202–207. [Google Scholar] [CrossRef]
  26. Zhou, J.-Y. Effect of different plant communities on anaerobic methantrophic oxidation and the functonal microbes in Chongxi wetland. Master’s Thesis, Shanghai University, Shanghai, China, 2014. [Google Scholar]
  27. Wang, W.-Q.; Zeng, C.-S.; Tong, C. Methane Production and Oxidation Capacities of Soil from the Reed Marsh of the Min jiang River Estuary. Wetl. Sci. 2008, 6, 9. [Google Scholar] [CrossRef]
  28. Gao, J.-Y.; Wang, W.-Q.; Yan, E.; Liao, J.; Yao, S. Influences of Tide on Physical and Chemical Properties of Soil in the Estuarine Wetland of Minjiang River. Wetl. Sci. Manag. 2012, 7, 48–52. [Google Scholar]
  29. Li, J.Y.; Chen, Q.F.; Li, Q.; Zhao, C.S.; Feng, Y.; Li, L. Analysis of microbial diversity and driving factors in coastal wetlands of the Yellow River Delta. Acta Ecol. Sin. 2021, 41, 12. [Google Scholar] [CrossRef]
  30. Moran, J.-J.; Beal, E.-J.; Vrentas, J.-M.; Orphan, V.-J.; Freeman, K.-H.; House, C.-H. Methyl sulfides as intermediates in the anaerobic oxidation of methane. Environ. Microbiol. 2008, 10, 162–173. [Google Scholar] [CrossRef]
  31. Tu, C.-X. Community Structure and Abundance of Methanogens, Sulfate-Reducing Bacteria in Tidal Maresh Soil in the Min River Estuary. Ph.D. Thesis, Fujian Normal University, Fujian, China, 2014. [Google Scholar]
  32. Lin, L.; Song, X.; Xi, J. Anaerobic oxidation of methane coupled to sulfate reduction: Consortium characteristics and application in co-removal of H2S and methane. J. Environ. Sci. 2019, 76, 238–248. [Google Scholar]
  33. Yavitt, J.B.; Burtis, J.C.; Smemo, K.A.; Welsch, M. Plot-scale spatial variability of methane, respiration, and net nitrogen mineralization in muck-soil wetlands across a land use gradient. Geoderma 2018, 315, 11–19. [Google Scholar] [CrossRef]
  34. Wang, Y.-N.; Wang, Y.; Zhang, Z.-M. Effcets of tidal creek morphology on succession of wetland plant communities in the Yellow River Delta. Ecol. Sci. 2019, 39, 33–41. [Google Scholar] [CrossRef]
  35. GB 15618-2018; Soil Environment Quality Risk Control Standard for Soilcontamination of Agriculture Land. Ministry of Ecology and Environment: Beijing, China, 2018.
  36. Wang, Z.-H.; Chen, Q.-F.; Li, J.-Y.; Si, G.-R.; Zhao, W.-Y.; Liu, T. Methane anaerobic oxidation potential and microbial community response to Fe and Mn input in a salt marsh wetland of the Yellow River Delta. Acta Sci. Circumstantiae 2022, 42, 452–461. [Google Scholar] [CrossRef]
  37. Hu, W.F.; Zeng, C.S.; Gao, J.Y.; Zhang, W.L.; Zhang, L.H.; Wang, W.Q.; Huang, J.F.; Yan, Y.Y. Response of methane production and oxidation potential to exogenous substances in the Phragmites australis marsh sediments of Shanyutan wetland in the Min River estuary. Acta Sci. Circumstantiae 2015, 35, 1116–1124. [Google Scholar] [CrossRef]
  38. Wang, J.-J. Study on Influence Factors on Methane Emission Flux and Methane Production Capacity in Poyang Lake Wetland. Master’s Thesis, Nanchang University, Nanchang, China, 2016. [Google Scholar]
  39. Liu, D.; Mo, Y.-L.; Peng, C.; Wang, B.-Z.; Wang, J.-J.; Tang, Y.; Lu, L. The impact of different electron acceptors on methane oxidation and the key microbial players in the soil of the Jialing River riparian wetland. Resour. Environ. Yangtze Basin 2022, 3, 2230–2245. [Google Scholar]
  40. Wang, D.; White, J.-R.; Delaune, R.-D.; Yu, Z.; Hu, Y. Peripheral freshwater deltaic wetlands are hotspots of methane flux in the coastal zone. Sci. Total Environ. 2021, 775, 145784. [Google Scholar] [CrossRef]
  41. Weber, H.S.; Thamdrup, B.; Habicht, K.S. High sulfur isotope fractionation associated with anaerobic oxidation of methane in a low-sulfate, iron-rich environment. Front. Earth Sci. 2016, 4, 61. [Google Scholar] [CrossRef]
  42. Wang, W.-Q. Anaerobic Oxidation of Methane and Its Mechanism in the Minjiang River Estuarine Wetland. Ph.D. Thesis, Fujian Normal University, Fuzhou, China, 2014. [Google Scholar]
  43. Zeng, C.-S.; Wang, W.-Q.; Tong, C. Effects of different exogenous electron acceptors and salt import on methane production potential of estuarine marsh soil. Geograp. Hical. Res. 2008, 27, 1321–1330. [Google Scholar]
  44. Gupta, V.; Smemo, K.-A.; Yavitt, J.-B.; Fowle, D.; Branfireun, B.; Basiliko, N. Stable isotopes reveal widespread anaerobic methane oxidation across latitude and peatland type. Environ. Sci. Technol. 2013, 47, 8273–8279. [Google Scholar] [CrossRef]
  45. Hu, B.L.; Shen, L.D.; Lian, X.; Zhu, Q.; Liu, S.; Huang, Q.; He, Z.F.; Geng, S.; Cheng, D.Q.; Lou, L.P.; et al. Evidence for nitrite-dependent anaerobic methane oxidation as a previously overlooked microbial methane sink in wetlands. Proc. Natl. Acad. Sci. USA 2014, 111, 4495–4500. [Google Scholar] [CrossRef]
  46. Zhao, Y.; Liu, B.; Zhang, W.; Hu, C.; An, S. Effects of plant and influent C:N:P ratio on microbial diversity in pilot-scale constructed wetlands. Ecol. Eng. 2010, 36, 441–449. [Google Scholar] [CrossRef]
  47. Chen, W.F.; Shi, Y.X. Distribution Characteristics of Microbes in New-born Wetlands of the Yellow River Delta. Acta Agrestia Sin. 2010, 18, 860–864. [Google Scholar]
  48. Zheng, M.; Tian, Y.; Liu, T.; Ma, T.; Li, L.; Li, C.; Ahmad, M.; Chen, Q.; Ni, J. Minimization of nitrous oxide emission in a pilot-scale oxidation ditch: Generation, spatial variation and microbial interpretation. Bioresour. Technol. 2015, 179, 510–517. [Google Scholar] [CrossRef]
  49. Vigneron, A.; Cruaud, P.; Alsop, E.; de Rezende, J.R.; Head, I.M.; Tsesmetzis, N. Beyond the tip of the iceberg; a new view of the diversity of sulfite-and sulfate-reducing microorganisms. ISME J. 2018, 12, 2096–2099. [Google Scholar] [CrossRef]
  50. Zhang, X.; Zhang, L.; Zhang, L.; Ji, Z.; Shao, Y.; Zhou, H.; Bao, Y.; Qu, Y.; Liu, L. Comparison of rhizosphere bacterial communities of reed and Suaeda in Shuangtaizi River Estuary, Northeast China. Mar. Pollut. Bull. 2019, 140, 171–178. [Google Scholar] [CrossRef]
  51. Zhu, P.; Wang, Y.; Shi, T.; Zhang, X.; Huang, G.; Gong, J. Intertidal zonation affects diversity and functional potentials of bacteria in surface sediments: A case study of the Golden Bay mangrove, China. Appl. Soil Ecol. 2018, 130, 159–168. [Google Scholar] [CrossRef]
  52. Zhang, B.; Wu, X.; Zhang, G.; Li, S.; Zhang, W.; Chen, X.; Sun, L.; Zhang, B.; Liu, G.; Chen, T. The diversity and biogeography of the communities of Actinobacteria in the forelands of glaciers at a continental scale. Environ. Res. Lett. 2016, 11, 054012. [Google Scholar] [CrossRef]
  53. Xian, W.D.; Zhang, X.T.; Li, W.J. Research status and prospect on bacterial phylum Chloroflexi. Acta Microbiol. Sin. 2020, 60, 1801–1820. [Google Scholar]
  54. Li, Y.; Lei, W.; Zhang, W.; Fu, X.; Le, Y. The variability of soil microbial community composition of different types of tidal wetland in Chongming Dongtan and its effect on soil microbial respiration. Ecol. Eng. 2011, 37, 1276–1282. [Google Scholar] [CrossRef]
  55. Arunrat, N.; Sansupa, C.; Kongsurakan, P.; Sereenonchai, S.; Hatano, R. Soil Microbial Diversity and Community Composition in Rice–Fish Co-Culture and Rice Monoculture Farming System. Biology 2022, 11, 1242. [Google Scholar] [CrossRef]
  56. Zhang, M.Z.; Li, L.; Liu, J.X. The parth way and methanotroph of anaerobic methane oxidation driven by nitrate or sulfate. Microbiol. China 2012, 39, 702–710. [Google Scholar] [CrossRef]
Figure 1. Sampling points of wetland in the Yellow River Delta (JP: Suaeda salsa sampling site; CL: Tamarisk sampling site; LW: Reed sampling site).
Sustainability 15 07053 g001
Figure 2. Changes in the AOM potential after SO42− input in Reed fields.
Sustainability 15 07053 g002
Figure 3. Changes in the AOM potential after SO42− input in Tamarisk fields.
Sustainability 15 07053 g003
Figure 4. Changes in AOM potential after SO42− input in Suaeda salsa fileds.
Sustainability 15 07053 g004
Figure 5. Overall change in the AOM potential after adding different SO42− concentrations. (If two columns do not contain the same letter, it indicates a significant correlation).
Sustainability 15 07053 g005
Figure 6. Histogram of relative abundance of microorganisms. (RS—Reed shallow soil; RD—Reed deep soil; TS—Tamarix shallow soil; TD—Tamarix deep soil; SS—Suaeda salsa shallow soil; SD—Suaeda salsa deep soil).
Sustainability 15 07053 g006
Figure 7. Microbial clustering heat map. (RS.B—Reed shallow soil blanket group; RS.S—Reed shallow soil addition group; RD.B—Reed deep soil blank group; RD.S—Reed deep soil addition group; SS.B—Suaeda salsa shallow soil blank group; SS.S—Suaeda salsa shallow soil addition group; SD.B—Suaeda salsa deep soil blank group; SD.S—Suaeda salsa deep soil addition group; TS.B—Tamarisk shallow soil blank group; TS.S—Tamarisk shallow soil addition group; TD.B—Tamarisk deep soil blank group; TD.S—Tamarisk deep soil addition group).
Sustainability 15 07053 g007
Table 1. Physical and chemical properties of the soils.
Depth
(cm)
pHEC
(mS·m−1)
NO3
(g·kg−1)
SO42−
(g·kg−1)
TK
(g·kg−1)
Na
(g·kg−1)
TP
(g·kg−1)
Reed0~208.08 ± 0.0149.63 ± 0.50.0018 ± 0.00050.025 ± 0.00113.74 ± 217.98 ± 40.48 ± 0.02
20~608.05 ± 0.0399.27 ± 0.30.0015 ± 0.000050.042 ± 0.00214.74 ± 125.02 ± 30.40 ± 0.04
Suaeda salsa0~208.47 ± 0.02143.50 ± 10.0016 ± 0.00030.071 ± 0.00214.18 ± 221.51 ± 20.41 ± 0.05
20~608.45 ± 0.01211.00 ± 50.0012 ± 0.00010.140 ± 0.00312.60 ± 218.68 ± 40.47 ± 0.02
Tamarisk0~208.38 ± 0.03120.73 ± 70.0014 ± 0.000030.079 ± 0.00613.50 ± 122.17 ± 10.31 ± 0.04
20~608.43 ± 0.01223.33 ± 50.0020 ± 0.00020.154 ± 0.00115.15 ± 320.34 ± 0.50.47 ± 0.02
Table 2. Microbial Alpha diversity in different samples. (RS—Reed shallow soil; RD—Reed deep soil; TS—Tamarix shallow soil; TD—Tamarix deep soil; SS—Suaeda salsa shallow soil; SD—Suaeda salsa deep soil).
SampleShannonSimpsonChao1ACEOTU
RS-B10.1470.9984254.4634328.0023844
RS-A19.9950.9964183.0454259.3183752
RS-A29.8720.9953769.6773915.4213685
RS-A39.8220.9953187.5563162.0272982
RD-B9.7160.9954170.8154240.9723904
RD-A19.2760.9933762.8573984.7513646
RD-A29.4130.9803993.5984034.9763235
RD-A39.2220.9953794.0233813.6403815
SS-B9.0460.9884206.1064369.9643686
SS-B16.6690.9332569.2342749.5482265
SS-B26.5340.9323192.5533209.6253149
SS-B36.4420.9253114.8813238.8522664
SD-B7.7310.9643342.8783602.4312887
SD-B17.6350.9583276.6993308.5902763
SD-B27.4140.9722804.4962855.1202563
SD-B36.6510.9372606.6572654.1312060
TS-B8.1720.9823434.3523602.2982817
TS-C18.6650.9863772.3553941.1363340
TS-C28.3520.9823721.1204007.1823210
TS-C38.2640.9833574.6353727.0443023
TD-B6.7410.9623361.1343387.7502106
TD-C18.5890.9853490.3333570.6623170
TD-C27.4740.9653214.2663286.9212910
TD-C37.4140.9722804.4962855.1202563
Disclaimer/Publisher’s Note: The statements, opinions and data contained in all publications are solely those of the individual author(s) and contributor(s) and not of MDPI and/or the editor(s). MDPI and/or the editor(s) disclaim responsibility for any injury to people or property resulting from any ideas, methods, instructions or products referred to in the content.

