Abstract
Few researchers have looked at the mechanical characteristics of rocks that are composed of numerous layers of various kinds of rock. Most strata in practical engineering are composite strata, and fracture propagation is frequently to blame for engineering mishaps. The digital image correlation method (DIC) and acoustic emission (AE) equipment were used to observe the crack strike and strain field changes of specimens that resemble rocks with a constructed joint under uniaxial compression in order to study the crack growth process and failure mode in composite rock strata under uniaxial compression. The research focus of this paper is to conduct a quantitative and qualitative analysis of crack types based on the data obtained from the DIC test. The covariance matrix was introduced to quantify the strain field dispersion of samples with joint dip angles α = 0°, 15°, 30°, 45°, 60°, and 75°. The outcomes of the analysis were as follows: the displacement data of the two crack sides were quantified using the novel method, and the crack types were determined to be tensile crack (type I), shear crack (type II), and composite tension–shear crack (type I–II); the covariance matrix-based parameter V can be used to describe the crack creation and spread process; and according to the growth rate of V, the crack types were identified as tensile crack (0.12 × 10⁻⁴–0.49 × 10⁻⁴), shear crack (1.17 × 10⁻⁴–4.5 × 10⁻⁴), and composite tension–shear crack (0.72 × 10⁻⁴–0.99 × 10⁻⁴).
1. Introduction
Composite layers are made up of two or more types of rock material and account for 75 percent of the Earth’s crust (Figure 1). During the mining process, many projects would appear with two kinds of contact rock with exceptions. Underground mine production roadways must pass through the mineral–rock contact zone. The two sides of the rock mass of the mineral–rock contact zone are significantly different along with their physical and mechanical properties due to diagenetic time, diagenetic environment, and diagenetic composition being different; the physical and mechanical properties are significantly different. Through a case study based on the combination of the shear strength reduction methodology and distinct element method, a new method for finding the factor of safety and the related critical slip surface of a layered rock slope susceptible to seismic excitations is described in this research. The seismic factor of safety and the critical slip surface of the slope are calculated using the suggested method, and the results are compared to those obtained using the pseudostatic approach in conjunction with the limit equilibrium method [1]. The stability of the tunnel face is thoroughly examined using an analytical model that takes the tilt of the rock layer and the weak interlayer into account. The virtual sustaining force is then calculated using the nonlinear Hoek–Brown yield criterion and the upper limit theorem of kinematic limit analysis. The Genetic Algorithm examines the best upper-bound answer. The effects of the tunnel diameter, inclination angle, and weak interlayer on the stability of a tunnel face are examined using a number of design charts. The obtained results demonstrate that the container of the weak interlayer greatly worsens the stability of the tunnel face [2]. This article covers the findings of an experimental examination of the transverse isotropic rock’s failure mechanism, including the failure process and failure modes. Reference [3] uses a rotary scanner to capture “unrolled” photographs of rock specimens under various compressive stress conditions. The cylindrical specimen’s circumferential surface is represented by the unrolled image, which makes it easier to investigate failure processes and failure modes. Iron ore–marble composite rock sample uniaxial compression tests were carried out to forecast the overall strength of the composite rock with various contact angles. The findings demonstrated that during compression, composite rock samples with various contact angles failed in two distinct mechanisms. The strengths of the composite rock samples were also correlated with the contact angle and were lower than those of the pure iron ore samples and pure marble samples. A strength model of the composite rock that takes into account the constraint stress on the contact surface was built using the Mohr–Coulomb criterion and could serve as a theoretical foundation for studies on stability and the building of tunnels via contact zones [4]. The stress intensity and peak strain of the compound rock strata rise after the first decreases as the stratum dip angle increases. The rock stratum dip angle has more influence on the rock stratum properties compared to the joint dip angle. It was found that the strength law and crack expansion of layered rock mass under Brazilian splitting, bedding inclination angle, and material strength ratio all have a great influence on it [5]. Reference [6] used the digital image correlation method (DIC) to measure the cracking point of the composite strata and verified that the maximum value of the flow intensity was the cracking position through the parameter flow intensity. The Brazilian test was used on disc-shaped isotropic sandstone samples to gauge the rock’s tensile resistance. The dynamic fracturing process was obtained while high-speed photography equipment continued to take pictures for the digital imaging correlation (DIC). The cuttings were examined using a scanning electron microscope (SEM) and an electron-dispersive system (EDS) for a micro-level inspection after the specimen failed and was divided. Grain fracturing and pore-filling fracturing are two different categories of fracturing mechanisms. A novel metric known as the angularity factor can be used to distinguish between the three fundamental fracture modes (Mode I/II/III) based on (1) the grain size and (2) the grain uniformity and shape [7]. When Nguyen et al. utilized DIC to examine the progression of preexisting fractures in soft rock, they discovered that the technique may be used to find and map fissures that are invisible to the unaided eye. They also suggested a fresh, DIC-based technique for automatically identifying and quantifying cracks. The key to this strategy was breaking down the displacement into its normal and tangential components in the local fracture in the coordinate system. This method, which enables a better understanding of the crack evolution process, is easy to apply because it is a post-processing method based on the typical DIC output and can be applied to any material, image, and resolution [8]. A cylinder wore down sandstones until they failed. The full-field displacements on the surfaces of the sandstones were measured by the nondestructive optical approach of digital image correlation while the force–penetration curve was indented (DIC). The splitting fracture mechanism may be the primary one in the failure of sandstones under indentation, according to investigations and adaptations of the splitting fracture model for the current indentation [9]. The mechanical behavior and energy-releasing properties of bedded sandstone with bedding layers in various orientations under uniaxial compression are examined in this research. Uniaxial Compressive Strength (UCS) tests were conducted on cylindrical sandstone specimens (54 mm in diameter and 108 mm in height) with bedding layers inclined at angles of 10°, 20°, 35°, 55°, and 83° in the minor–major stress direction. The findings support the hypothesis that the failure of rock with bedding layers inclined at shallow angles may be more severe and destructive than failures of rock with bedding layers inclined strongly [10]. Reference [11] found that the stress of composite rock strata would jump at the interface and proposed the calculation process of contact conditions between the platen and piecewise homogeneous rock block under uniaxial compression. This method makes it easy to calculate the contact conditions of composite rock strata and identify the contact conditions between different rock strata and can more accurately evaluate the stress mutation at the interface of rock properties. Reference [12] studied the influence of crack spacing and the rock layer thickness ratio on crack saturation in composite rock strata and found that with the increase in applied stress, normal stress between these cracks experienced a transition from tension to compression, indicating the cause of crack saturation and the deficiency of the stress transfer theory. Reference [13] established the thermoelastoplastic damage coupling model of concrete under dynamic load based on the boundary surface plasticity theory. The model was verified by uniaxial/triaxial tests and SHPB tests at different loading rates and temperatures, indicating that the model can be used to describe the mechanical response of concrete under various loads. Reference [14] proposed a plastic damage model, which was verified by triaxial tests under different confining pressures. In this paper, the cavity expansion solutions obtained by the Modified Cam-Clay (MCC) model and plastic damage models are compared, and it is emphasized that the model has better applicability to spherical cavity expansion problems. Reference [15] built a new Johnson–Holmquist–Beissel (JHB) model on the basis of the four-dimensional lattice spring model. Through simulating the Brazil test, dynamic spalling test, and projectile penetration test, it was found that the accuracy of this model is better than other models.
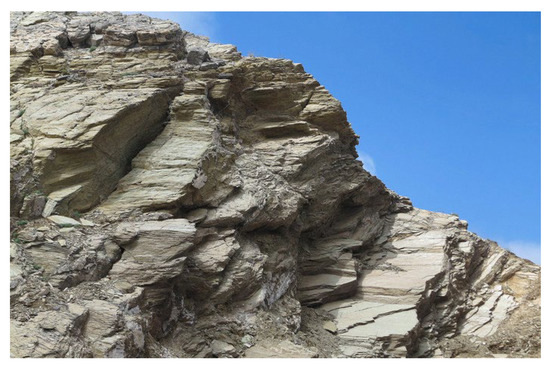
Figure 1.
Composite rock strata with multiple fractures.
Other studies have simply described crack growth in composite strata based on experimental data but have not studied the crack growth process and the discrimination of crack types quantitatively. In this work, a new method based on DIC data was developed to quantitatively characterize cracks in composite strata with joints, which can provide new insight for further understanding crack propagation in composite strata.
2. Materials and Methods
Using two layers of rock-like materials with different mechanical properties to study the composite rock, the material ratio of hard rock A was set at 1:1:0.4 (cement:quartz sand:water), and the material ratio of soft rock B was 1:0.8:0.3:0.55 (cement:quartz sand:gypsum:water). To effectively reduce the error, three groups of parallel control tests were designed. The final mechanical properties of the materials are shown in Table 1. According to the Engineering Rock Classification Standard, materials A and B are, respectively, hard rock and soft rock, which represent two types of rock materials. The upper layer of the standard cube specimen containing joints was made of material B, and the lower layer was made of material A. The joint angles of the specimen were α = 0°, 15°, 30°, 45°, 60°, and 75° (Figure 2, Figure 3).

Table 1.
Mechanical characteristics of two types of rock materials.
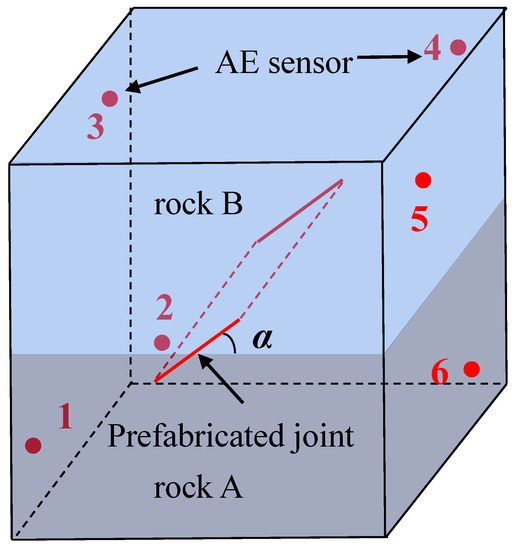
Figure 2.
Test specimen model.
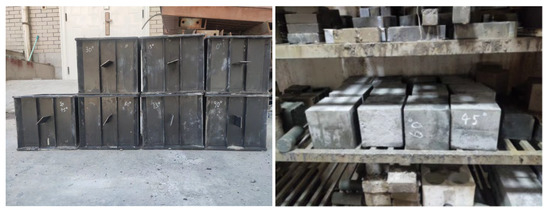
Figure 3.
Test pieces with different angles.
3. Uniaxial Compression Test Based on DIC
3.1. Experimental Equipment
Uniaxial compression was performed using a YAD-2000 microcomputer control automatic pressure testing machine (maximum test force 2000 kN) and GTC350 full digital electro-hydraulic servo controller. The displacement was taken as the control mode and the loading rate was set to 0.05 mm/min. The acoustic emission (AE) test was performed using the PCI-2 AE instrument from PAC (West Windsor Township, NJ, USA). The pre-value gain of the AE system in this test was 40 dB. The threshold was 40 dB, and the sampling rate was 10 Msps. The acoustic emission sensor arrangement is shown in Figure 4. In the digital image correlation (DIC) method, the VIC-Snap photogrammetric system was used for the non-contact monitoring of samples [16]. At the sampling site, two cameras were symmetrically centered on a pedestal and profiler rod. The camera was equipped with a telephoto lens with a focal length of 28 mm and a relative aperture of 2 mm (Figure 4).
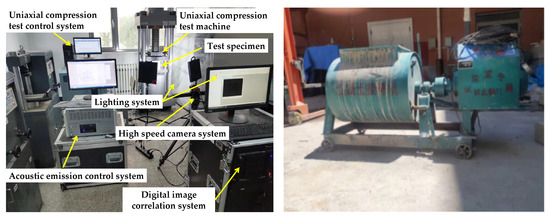
Figure 4.
Testing equipment.
To choose the right distance, the angle of incidence was approximately 30°. The mode was validated to meet the requirement of 2–30 pixels per speckle after the DIC system was configured, and extra LED (cold source) light was employed to retain the pattern’s full contrast. The image acquisition interval was 200 ms, which was sufficient to note the beginning and spread of the sample crack. To calculate the subsequent relative specimen deformation, reference images were obtained before loading. The test process is shown in Figure 5.

Figure 5.
Test process.
3.2. Principle of DIC Technology
Using traditional digital photography combined with civil engineering survey techniques, DIC can be used to accurately measure structural surface changes. By capturing precisely positioned and aligned images, the differences between measurements can be determined, whose point changes are shown in Figure 6. The region f0 centered at A (x0, y0) of the point is tracked to f1 centered at B (x1, y1) by a high-speed camera. The point C (x, y) in the f0 region becomes the point C′ (x′, y′) in the f1 region, and the relationship between the two points is shown as follows:

Figure 6.
Analysis domain of the digital image correlation method (DIC).
4. Study on Crack Propagation and Mechanical Properties of Three Kinds of Rock Specimens
4.1. Identification of Crack Types
Multiple groups of symmetric points H0 and H1 were selected around the crack on both edges, and the displacement of symmetric points in the u–v coordinate framework was transformed into the u′–v′ coordinate framework (Figure 7).
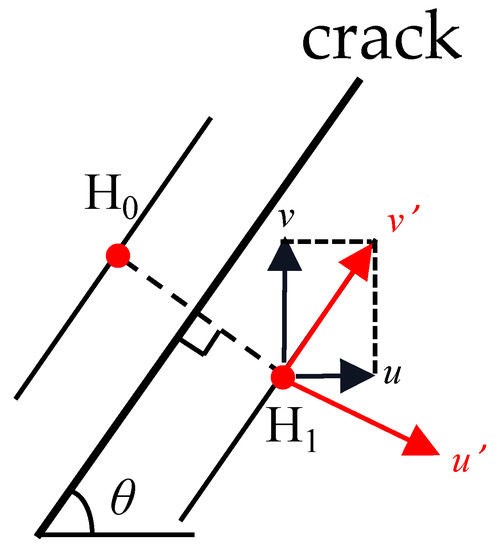
Figure 7.
Mechanical analysis of the points on both sides of the crack.
According to the u′ and v′ of points H0 and H1, cracks were divided into three categories (Figure 8): when the u′ of the only symmetric points is one positive and one negative, the crack’s tips on either edge are moving away from the crack in the vertical direction, and a tensile crack (type I) is what is present; when the difference between the v′ of the symmetric points H0 and H1 is greater than 0.15, it indicates that the points on both sides of the crack are moving in a direction parallel to the crack, and the crack is a shear crack (type II). When the u′ of two symmetric points H0 and H1 are positive and negative, respectively, and the difference of v′ is greater than 0.15, the crack is a composite tension–shear crack (type I–II).
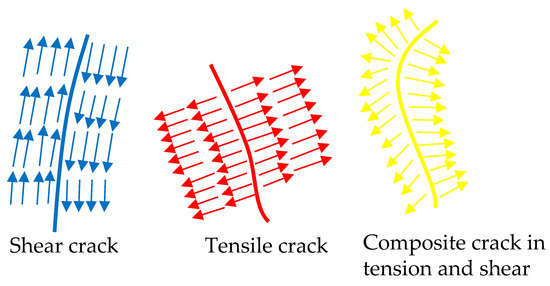
Figure 8.
Mechanical models of different types of cracks.
The image of crack growth when the joint dip angle α = 30° is seen in Figure 9.
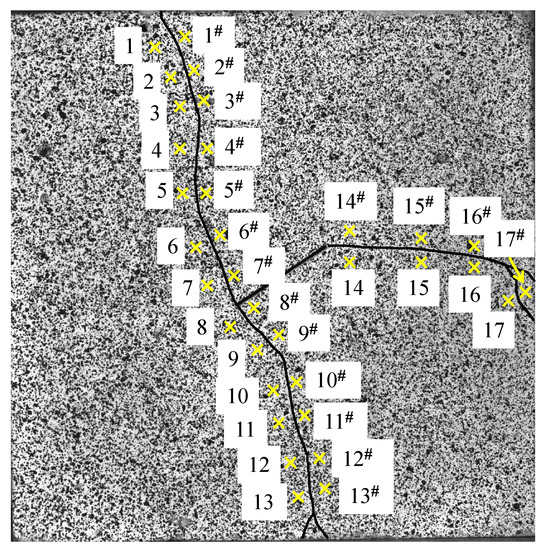
Figure 9.
Location of crack analysis point.
On each of the three cracks’ opposite sides, 17 groupings of symmetric spots were chosen. Considering the u′ and v′ values in Table 2, the cracks are classified by different colors as shown in Figure 10 in which the tensile cracks are depicted in red (type I), the shear cracks are blue (type II), and tension–shear composite cracks are in yellow (types I–II).
Table 2.
Displacement data of analysis points.
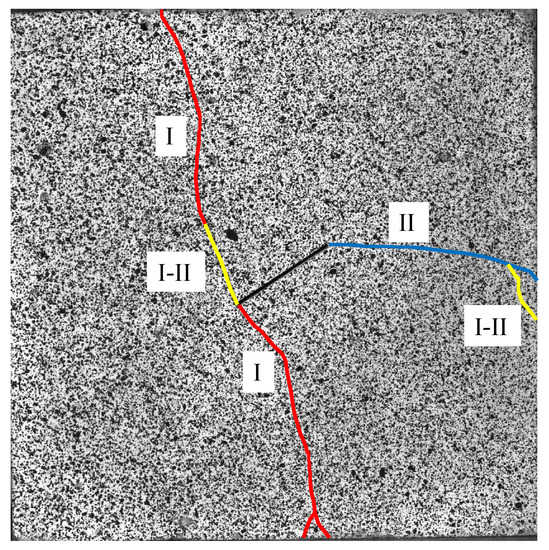
Figure 10.
Different types of crack propagation modes when α = 30°.
According to the classification method, the crack growth images of specimens featuring several joint inclination angles α are depicted in Figure 11. When α equals 0° and 15°, beginning at the tip and spreading to the left and right interfaces is the type II fracture. When the crack approaches the two boundaries, the type II crack is gradually transformed into a type I–II crack due to the boundary effect; when α = 45°, 60°, 75°, the crack initiation position is happening at the joint tip. At the joint tip in the B rock layer, type I and type II cracks occur. The path of the greatest primary stress is where the type I crack expands, while the type II crack expands toward the right boundary for a certain distance and generates the secondary type I–II crack. At the joint tip in the A rock layer, there was one type I crack, and it extended towards the lower boundary until reaching the interface.
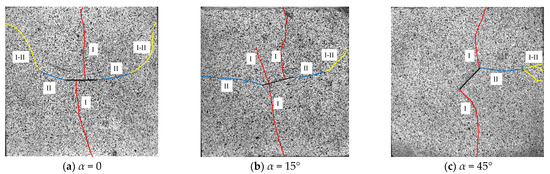
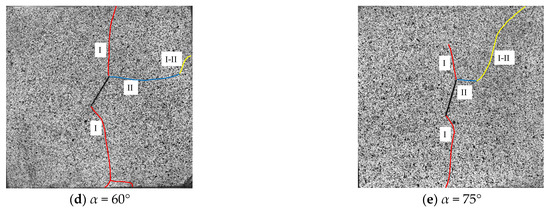
Figure 11.
Different types of crack propagation modes.
4.2. Quantitative Characterization of Crack Propagation
Dispersion is a useful tool for quantifying variability in many statistics, but dispersion is usually measured in terms of standard deviation. Standard deviation is often used to represent scalar and vector data. Currently, there is no accurate method to calculate the deviation of the stress datum. This is due to stress’s tensor character, which makes classical statistics inapplicable. To fix this flaw and enhance the current issues with rock engineering related to it, Gao proposed a stress covariance method for stress variability characterization [17]. This method is analogously applied to the strain representation of joint composite rock strata.
where Si is the strain tensor and εxx, εxy, and εyy are horizontal strain components, shear strain components, and vertical strain components, respectively.
where n represents the number of strain components.; Si is the vector of strain data of group i; and vec(·) is a vectorization feature that superimposes all the sections together to transform a tensor into a strain vector sc. E represents the average vector.
where ∑ is the covariance matrix of the strain field; cov(·) represents the covariance function; |·| is the determinant of a matrix; V is the covariance parameter; and p is the tensor dimension, and since the strain is a two-dimensional tensor, p = 2.
A large number of calculation points are selected on the surface of the specimen so that the calculation points can be spread throughout the whole field. The covariance parameter V can be obtained by calculating the above equation. V obtained in the process of specimen failure is plotted as shown in Figure 12.
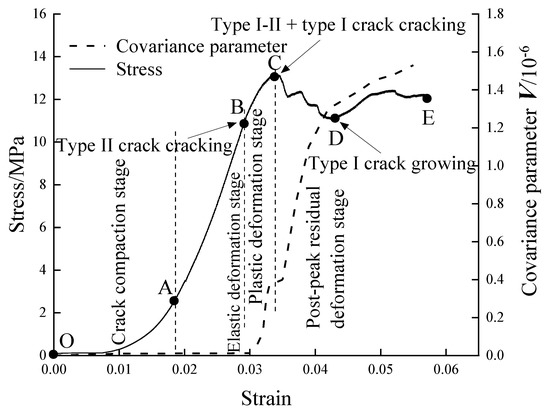
Figure 12.
Curves of covariance parameters V–strain and stress–strain when α = 0°.
Three stages can be identified in the stress–strain curve by marking points O, A, B, C, D, and E: the stage of crack compaction (OA), the stage of elastic deformation (AB), the stage of plastic deformation (BC), and the stage of residual deformation (CE). Since there is no crack before point B (Figure 13) and the strain field differentiation is not obvious, the covariance parameter V of the stress–strain curve is almost 0 before point A (33.57% of the axial strain). At point B (49.18% of axial strain), the shear crack (II) begins to crack. Both the strains at the joint tip and the strain dispersion start to increase and the covariance parameter V increases at a rate of 1.2 × 10⁻⁴. The loading continues to reach peak point C (57.87% of the axial strain). Type II cracks start to grow into type I–II cracks and rapidly expand through the boundary, while a few tensile cracks appear near the joint tip (type I). Simultaneously, the strain field becomes increasingly distinct, which leads to the V curve showing a steep rise (with a rate of 2.01 × 10⁻⁴). After point D (74.98% of the axial strain) in the stage of residual deformation after the peak, the bearing capacity of the specimen increases slightly. The type I crack propagates slowly upward and downward. The rate of increase of the V curve is slow due to the decrease in the strain differentiation rate.
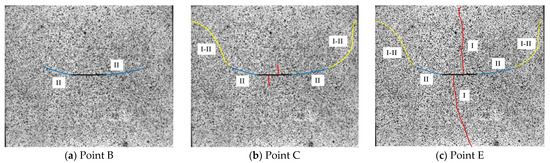
Figure 13.
Crack propagation at different labeled points when α = 0°.
When α = 45°, the stress–strain curve of the test piece reached point B (46.28% of the axial strain), and the specimen’s crack at the joint apex exacerbated the strain field’s dispersion (Figure 14 and Figure 15). Since the crack growth area is small, the V curve will rise slowly at a rate of 0.5 × 10⁻⁴. When the stress reached peak point C (52.52% of the axial strain), the bearing capacity of the specimen reached the maximum. The type I crack began to expand rapidly and penetrated the upper and lower boundaries, and the type II crack appeared at the joint tip in the B rock layer. This caused the covariance parameter V (with a rate of 4.33 × 10⁻⁴) to increase sharply and the strain field divergence to rapidly increase. After the stress was released by the crack propagation, the curve showed periodic stability at the late stage of the CD segment. When the stress–strain curve reached point D (76.66% of the axial strain), the type II crack generated a secondary type I–II crack and penetrated the right boundary. The deviation between stress and strain leads to an increase in dispersion, so the covariance parameter V curve will continue to rise.
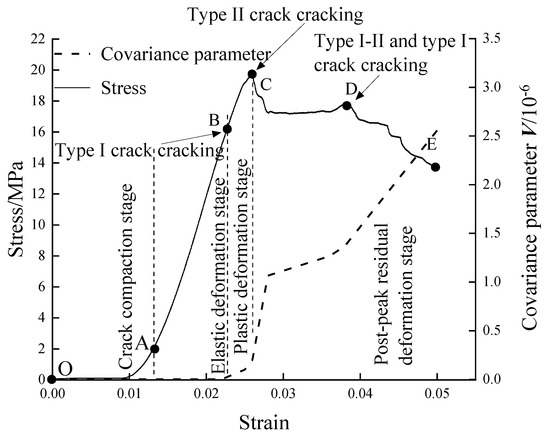
Figure 14.
Curves of covariance parameters V–strain and stress–strain when α = 45°.
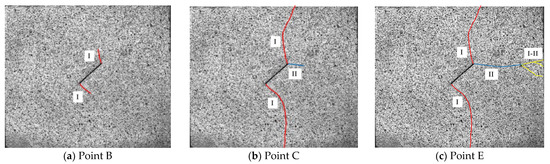
Figure 15.
Crack propagation at different labeled points when α = 45°.
When α = 15°, 30°, 60°, and 75°, respectively, the covariance parameter V is always 0 before point B (cracks cracking) in the stress–strain curve(Figure 16). When the stress–strain curve decreases rapidly after the peak point C, V will increase sharply instead. Due to the sudden shift in the strain field and the increase in strain dispersion caused by crack propagation, the stress–strain curve will decline rapidly after peak point C. On the contrary, the V curve will increase sharply. The growth rate of V is different for various types of cracks such as type I tensile cracks (0.12 × 10⁻⁴–0.49 × 10⁻⁴), type II shear cracks (1.17 × 10⁻⁴–4.5 × 10⁻⁴), and type I–II composite tension–shear cracks (0.72 × 10⁻⁴–0.99 × 10⁻⁴). Therefore, the covariance parameter V has a certain reference role in quantifying crack identification and predicting the trend of the stress–strain curve.
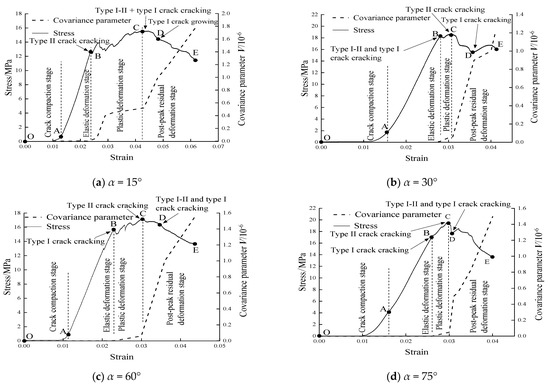
Figure 16.
Curves of covariance parameters V–strain and stress–strain.
4.3. Study on Mechanical Properties
As shown in Table 3, comparing the mechanical characteristics of the entire specimen and the joint specimens with various α, the intact specimens’ compressive strength and modulus of elasticity fell by 15.26–43.32% and 28.11–62.21%, respectively. As a rises, the elastic modulus and compressive strength initially increase, then decline, and then increase again. Among the specimens with a joint, the compressive strength and modulus of elasticity of the specimen with α = 45° were the largest, with increases of 42.03% and 90.24%, respectively. All of the preceding demonstrated the significant influence on the mechanical properties of layered rock specimens.
Table 3.
Fundamental mechanical characteristics of layered rocks with various α.
5. Study on Acoustic Emission Characteristics
Occurrences of a large magnitude are less common in seismology than events of a smaller size. The amplitude–frequency connection can be used to calculate this phenomenon, and Gutenberg and Richter suggest the equation shown below:
where ML is the size of the incident; n is frequency increment; and a and b are the empirical coefficients.
The growth of the frequency range of AE waves created by AE methods can be studied using the same approach during cracking in laboratories or engineering structures. In the above equation, the b-value of the logarithmic AE frequency–amplitude neutral linear relationship is its negative gradient ratio, and it will gradually alter as the crack spreads in various phases. As a result, it can be utilized to predict how fracture processes would evolve. In acoustic emission technology, the above formula is expressed as:
where AdB is the acoustic emission event’s peak amplitude (dB) and Amax is the maximum amplitude.
The acoustic emission (AE) ringing count and acoustic emission b-value can reflect the internal crack growth process and characterize the failure state of rock. The b-value is positively correlated with the number of minor breakage events. Conversely, the more serious the breakage events, the smaller the b-value. The AE ringing count, b-value, and stress–strain curve are plotted in Figure 17. With the increase in strain, the overall trend of the ringing count–time curve and b-value-time curve first increased and then decreased. From point A of the stress–strain curve, the AE ringing count began to increase, with the b-value increasing by 2.4–20.5%. The b-value in the AB section increases continuously because the internal cracks of the rock continue to develop and the small fracture events continue to increase. In the BC section, the rock failure enters the plastic stage. The microcracks begin to coalesce. Small breaks gradually accumulate into large breaking events. The ringing count can reach 43.4–79.6% of the peak value and the b-value begins to decline. The rock in the CD section shows instantaneous failure after reaching the peak value. As the cracks penetrate each other and extend to the boundary, the rock becomes unstable, and the ringing count reaches its peak value. The b-value also showed a rapid decline, with the highest drop of 26.7%.
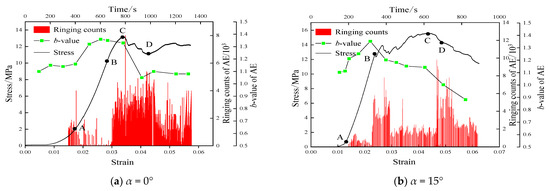
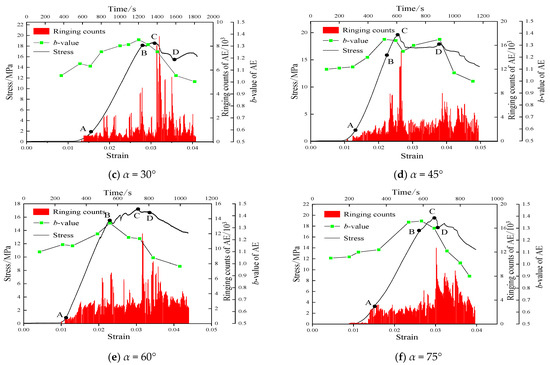
Figure 17.
Variation curves of acoustic emission ringing count, b-value, and stress corresponding to different joint dip angle α.
The overall change trend of the b-value corresponding to different joint dip angles α is consistent with an initial increase and then decrease; the peak value ranged from 1.31 to 1.41 (Figure 18). The b-value is significant (1–1.1) initially in the curve’s development, while in the last stage, the b-value is low (0.8–0.88). This is because there are many irreversible small deformations due to the crack compaction in the early stage. After the peak point, the internal microcracks of the specimen are connected, leading to the instability of the specimen, releasing more energy and leading to a large degree of damage. When α = 30°, the peak value of the curve appeared later (t = 1200 s). However, the peak time of other curves was 304–700 s. This is due to a lengthy preparatory period that resulted from the specimen with α = 30° not being prepressed at the start of the uniaxial compression test.
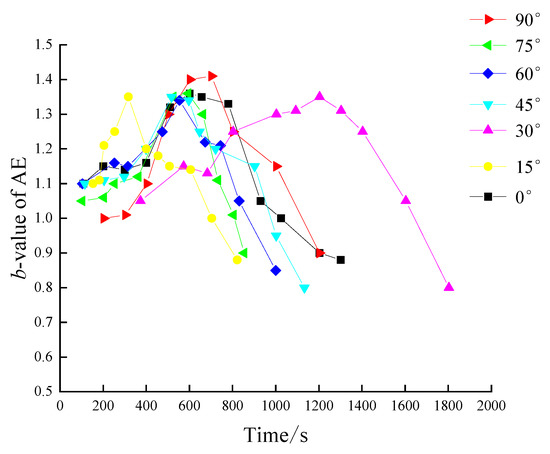
Figure 18.
b-value–time diagram for different joint angles α.
6. Conclusions
The DIC and AE techniques were used to observe the failure process of jointed layered rocks. Based on DIC test data, new methods for the quantitative and qualitative discrimination of crack types were proposed.
- (1)
- A new approach to evaluating crack characteristics is described as follows: the crack is tensile (type I) when the symmetric points have one positive and one negative u′; when the difference between the symmetric points v′ is greater than 0.15, the crack is a shear crack (type II); and when the u′ of the two symmetric points is one positive and one negative and the difference in v′ is greater than 0.15, the crack is a composite tension–shear crack (type I–II). Tensile and shear cracks, a hybrid failure of tensile and shear, are visible in the failure of layered rock specimens.
- (2)
- The covariance parameter V, which is based on the covariance matrix, was used to define the dispersion of the strain field. Under uniaxial compression, specimens with different joint inclination angles obey the same change law: when the crack is not cracked, V remains constant and is almost 0; V rises gradually during the early stages of fracture initiation; when the crack spreads quickly, V rises steeply.
- (3)
- By analyzing the covariance parameter V, a new method for the quantitative identification of different types of cracks was found. Crack types can be identified quantitatively according to the growth rate of V: type I tensile cracks (0.12 × 10⁻⁴~0.49 × 10⁻⁴); type II shear cracks (1.17 × 10⁻⁴~4.5 × 10⁻⁴); and type I–II composite tension–shear crack (0.72 × 10⁻⁴~0.99 × 10⁻⁴).
Author Contributions
Validation, Z.W. (Zhiyuan Wang); Resources, Z.W. (Zhuangzhuang Wang) and B.C.; Data curation, B.X.; Writing—original draft, J.S. and Y.Z. All authors have read and agreed to the published version of the manuscript.
Funding
This research received no external funding.
Institutional Review Board Statement
Not applicable.
Informed Consent Statement
Not applicable.
Data Availability Statement
Not applicable.
Conflicts of Interest
The authors declare no conflict of interest.
References
- Liu, Y.; Li, H.; Xiao, K.; Li, J.; Xia, X.; Liu, B. Seismic stability analysis of a layered rock slope. Comput. Geotech. 2014, 55, 474–481. [Google Scholar] [CrossRef]
- Man, J.; Huang, H.; Ai, Z.; Chen, J. Analytical model for tunnel face stability in longitudinally inclined layered rock masses with weak interlayer. Comput. Geotech. 2022, 143, 104608. [Google Scholar] [CrossRef]
- Tien, Y.M.; Kuo, M.C.; Juang, C.H. An experimental investigation of the failure mechanism of simulated transversely isotropic rocks. Int. J. Rock Mech. Min. Sci. 2006, 43, 1163–1181. [Google Scholar] [CrossRef]
- Wang, Q.; Wang, J.; Ye, Y.; Jiang, W.; Yao, N. Failure characteristics and strength model of composite rock samples in contact zone under compression. Arch. Min. Sci. 2020, 65, 347–361. [Google Scholar] [CrossRef]
- Cho, J.; Kim, H.; Jeon, S.; Min, K. Deformation and strength anisotropy of Asan gneiss, Boryeong shale, and Yeoncheon schist. Int. J. Rock Mech. Min. Sci. 2012, 50, 158–169. [Google Scholar] [CrossRef]
- Aliabadian, Z.; Gaofeng, Z.; Russell, A.R. Failure, crack initiation and the tensile strength of transversely isotropic rock using the Brazilian test. Int. J. Rock Mech. Min. Sci. 2019, 122, 1365–1609. [Google Scholar] [CrossRef]
- He, W.; Hayatdavoudi, A. A comprehensive analysis of fracture initiation and propagation in sandstones based on micro-level observation and digital imaging correlation. J. Pet. Sci. Eng. 2018, 164, 75–86. [Google Scholar] [CrossRef]
- Nguyen, T.L.; Hall, S.A.; Vacher, P.; Viggiani, G. Fracture mechanisms in soft rock: Identification and quantification of evolving displacement discontinuities by extended digital image correlation. Tectonophysics 2011, 503, 117–128. [Google Scholar] [CrossRef]
- Zhang, H.; Huang, G.; Song, H.; Kang, Y. Experimental investigation of deformation and failure mechanisms in rock under indentation by digital image correlation. Eng. Fract. Mech. 2012, 96, 667–675. [Google Scholar] [CrossRef]
- Wasantha, P.L.P.; Ranjith, P.G.; Shao, S.S. Energy monitoring and analysis during deformation of bedded-sandstone: Use of acoustic emission. Ultrasonics 2014, 54, 217–226. [Google Scholar] [CrossRef] [PubMed]
- Krasnovskii, A.A.; Mirenkov, V.E. Determination of boundary conditions in rocks under comperssion. J. Min. Sci. 2009, 45, 315–323. [Google Scholar] [CrossRef]
- Bai, T.; Pollard, D.D.; Gao, H. Explanation for fracture spacing in layered materials. Nature 2000, 403, 753–756. [Google Scholar] [CrossRef] [PubMed]
- Ma, J.; Chen, J.; Chen, W.; Huang, L. A coupled thermal-elastic-plastic-damage model for concrete subjected to dynamic loading. Int. J. Plast. 2022, 153, 103279. [Google Scholar] [CrossRef]
- Huang, L.; Liang, J.; Ma, J.; Yang, H.; Gui, Y. Spherical cavity expansion in porous rock considering plasticity and damage. Int. J. Numer. Anal. Methods Geomech. 2021, 45, 2235–2259. [Google Scholar]
- Ma, J.; Chen, J.; Guan, J.; Lin, Y.; Chen, W.; Huang, L. Implementation of Johnson-Holmquist-Beissel model in four-dimensional lattice spring model and its application in projectile penetration. Int. J. Impact Eng. 2022, 170, 104340. [Google Scholar] [CrossRef]
- Stirling, R.A.; Simpson, D.J.; Davie, C.T. The application of digital image correlation to Brazilian testing of sandstone. Int. J. Rock Mech. Min. Sci. 2012, 60, 1–11. [Google Scholar] [CrossRef]
- Gao, K.; Harrison, J.P. Scalar-valued measures of stress dispersion. Int. J. Rock Mech. Min. Sci. 2018, 106, 234–242. [Google Scholar] [CrossRef]


Disclaimer/Publisher’s Note: The statements, opinions and data contained in all publications are solely those of the individual author(s) and contributor(s) and not of MDPI and/or the editor(s). MDPI and/or the editor(s) disclaim responsibility for any injury to people or property resulting from any ideas, methods, instructions or products referred to in the content. |
© 2023 by the authors. Licensee MDPI, Basel, Switzerland. This article is an open access article distributed under the terms and conditions of the Creative Commons Attribution (CC BY) license (https://creativecommons.org/licenses/by/4.0/).