
Development of Machine Learning Algorithms for Application in Major Performance Enhancement in the Selective Catalytic Reduction (SCR) System


Abstract
:1. Introduction
2. Methodology
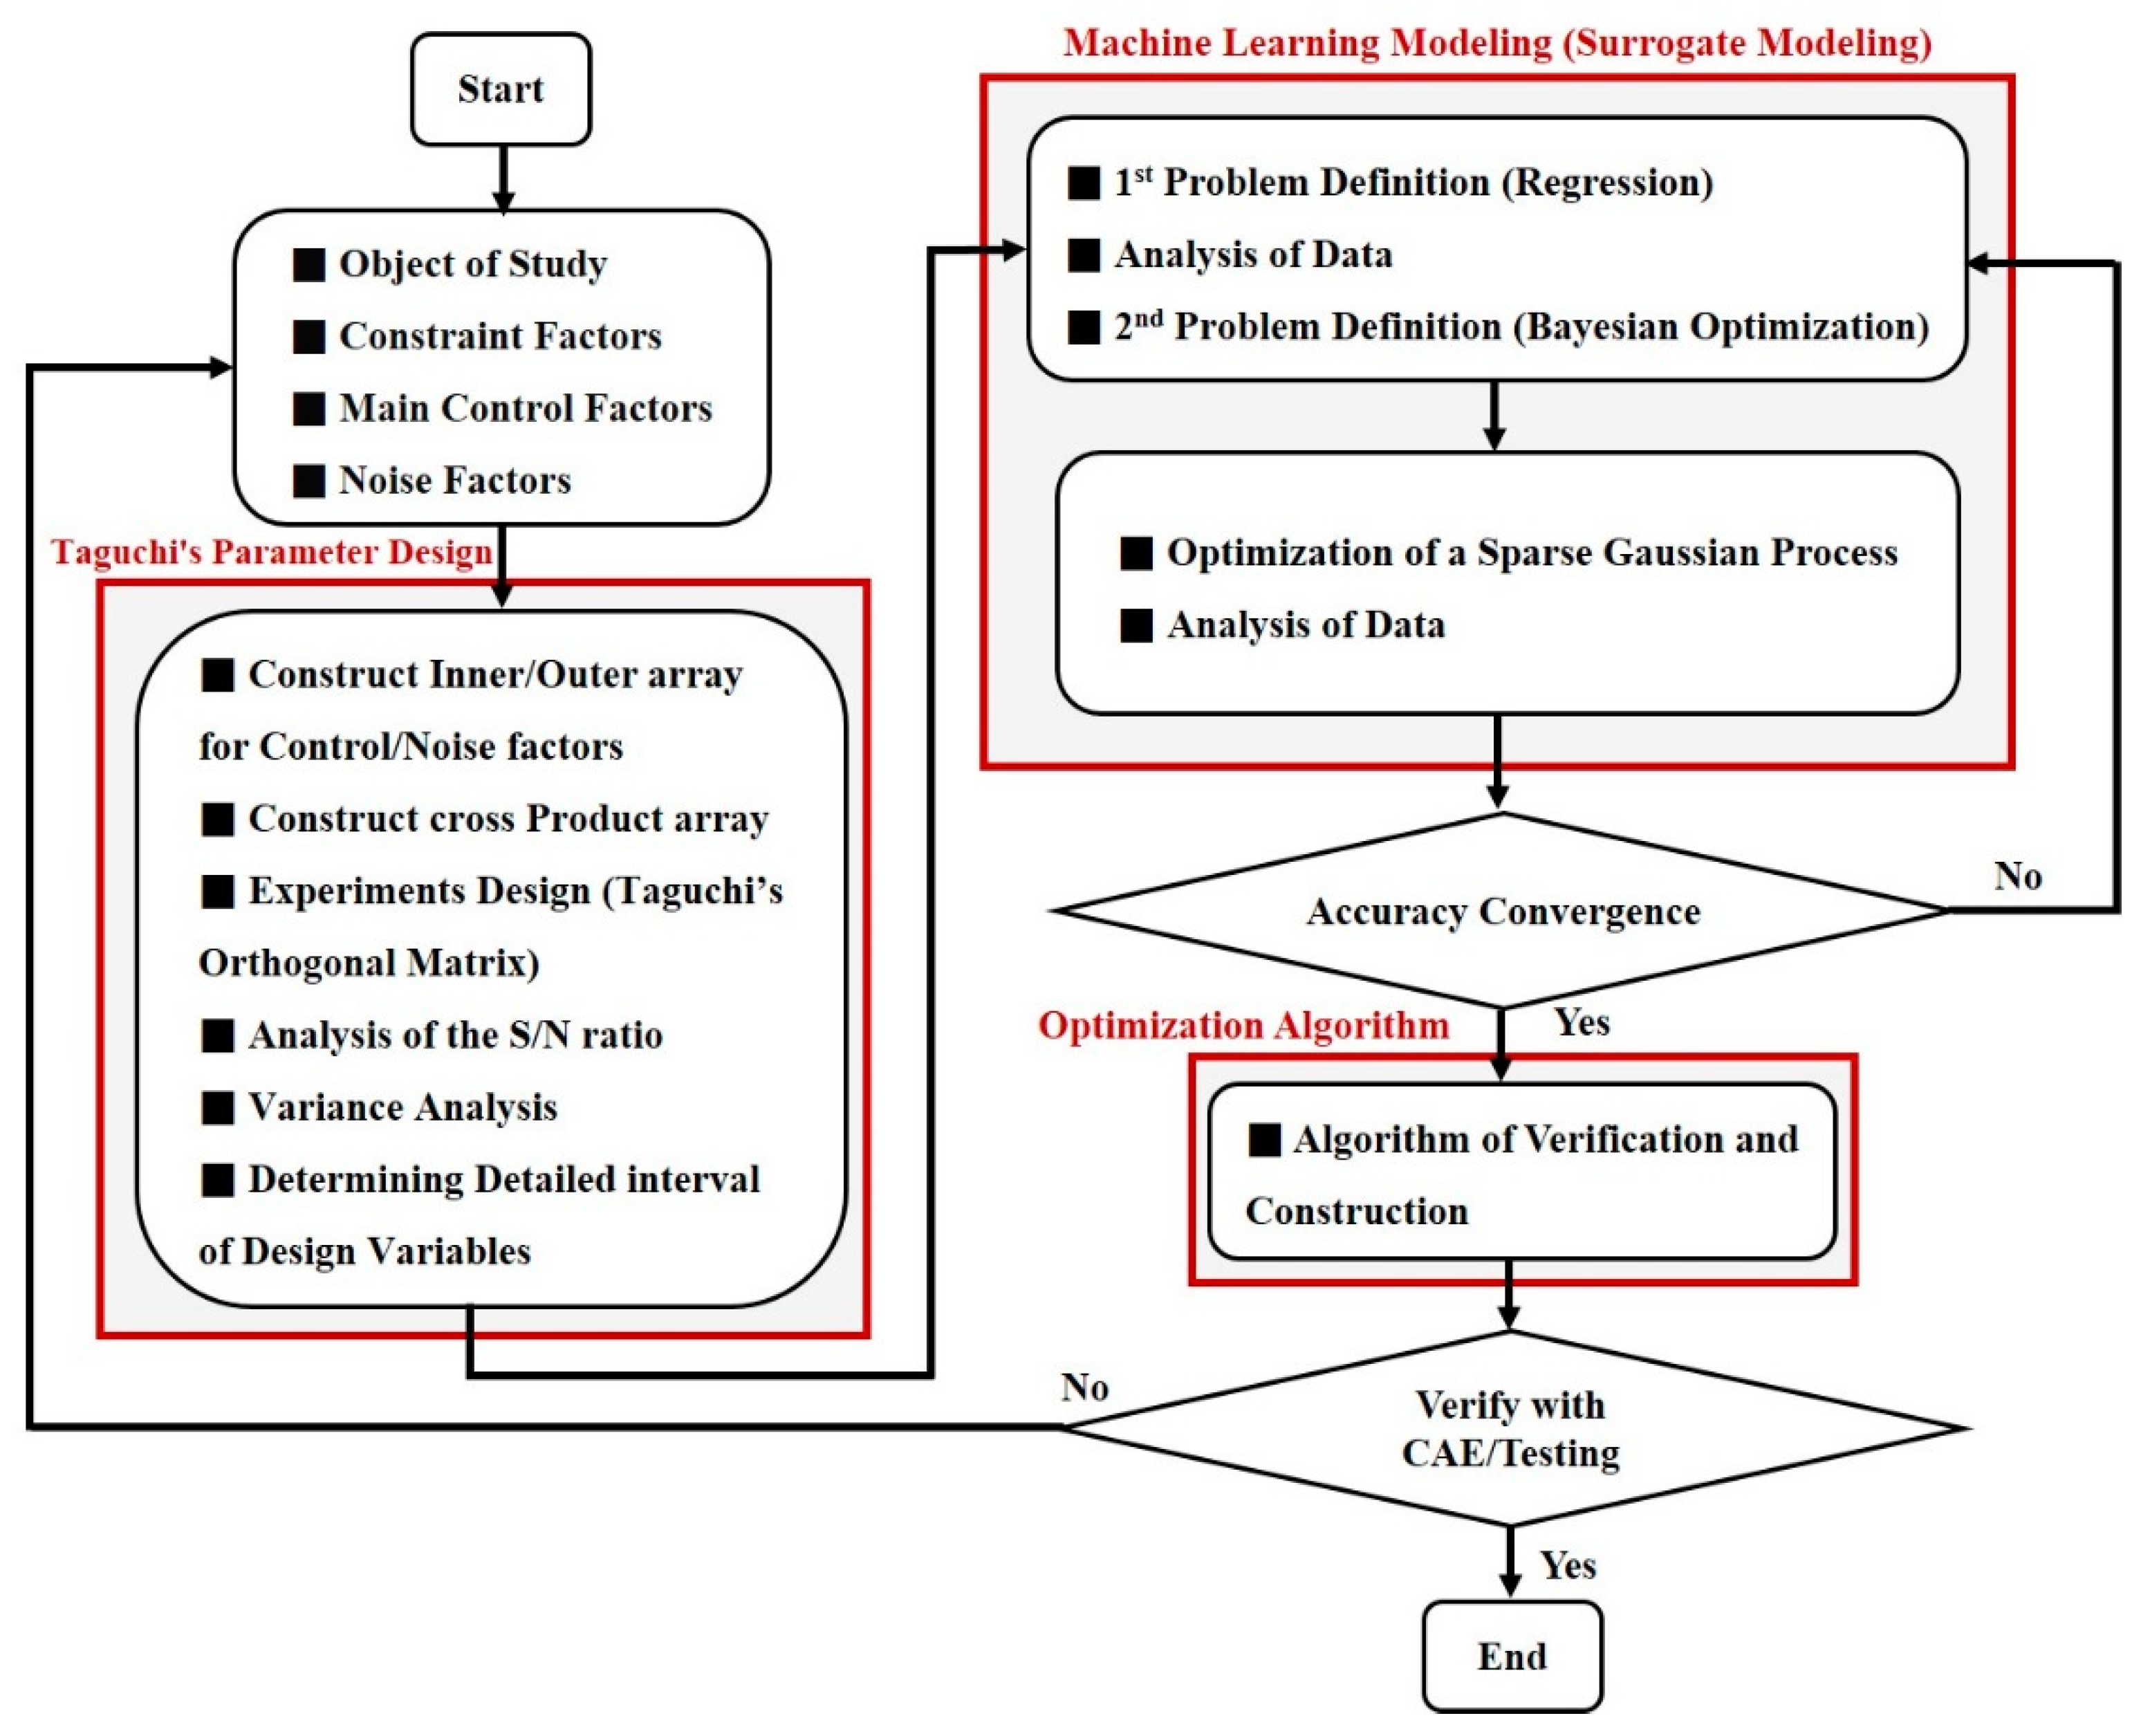
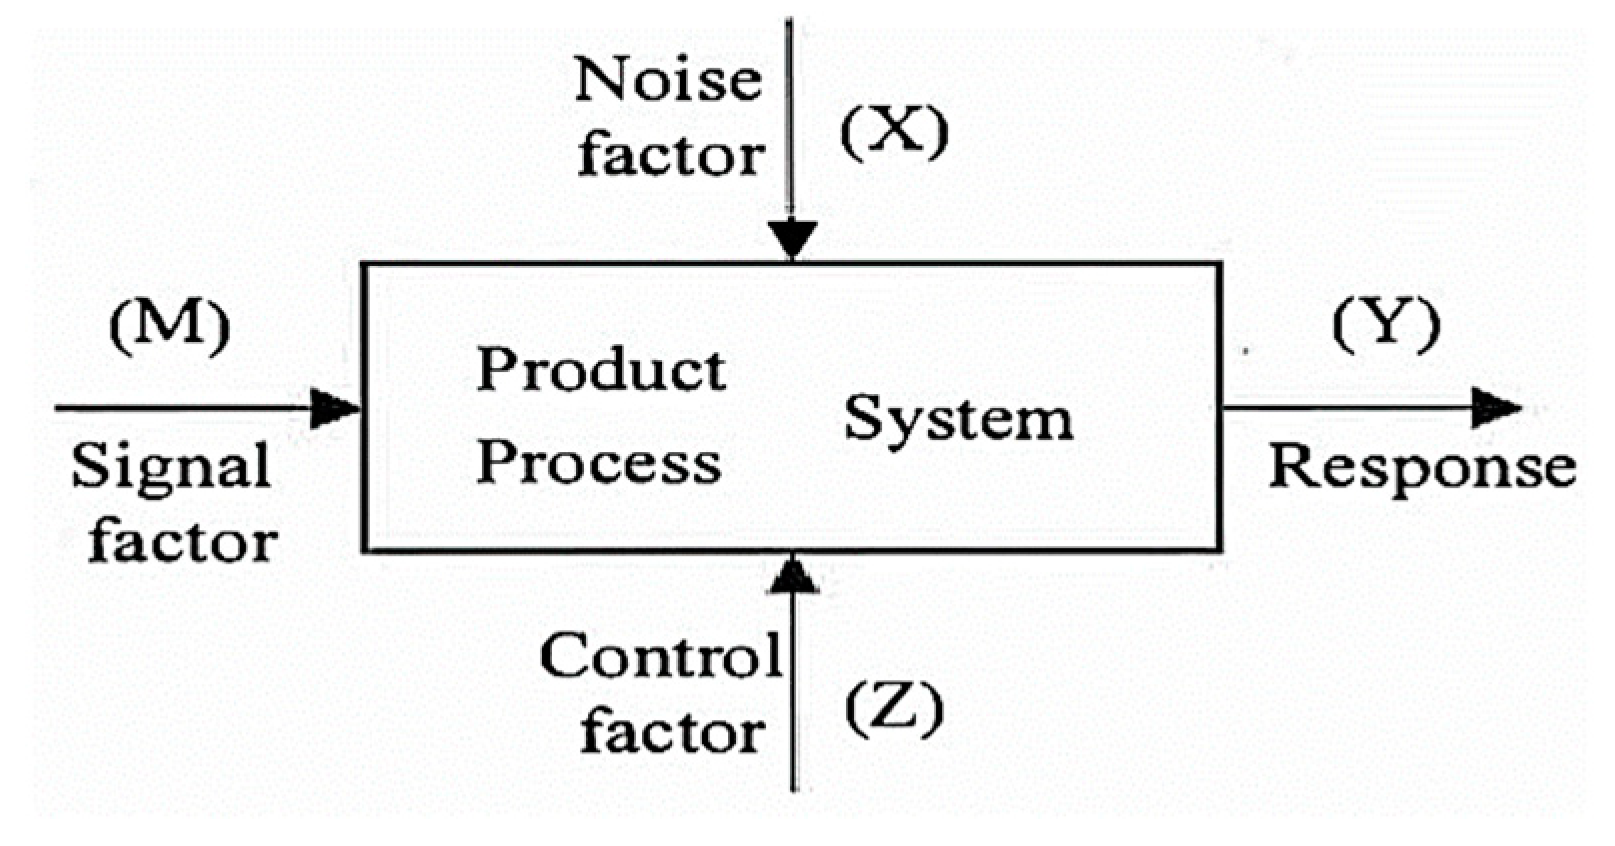
2.1. Configuration of Machine Learning System
2.2. Taguchi Parameter Design
2.3. Machine Learning Modelling
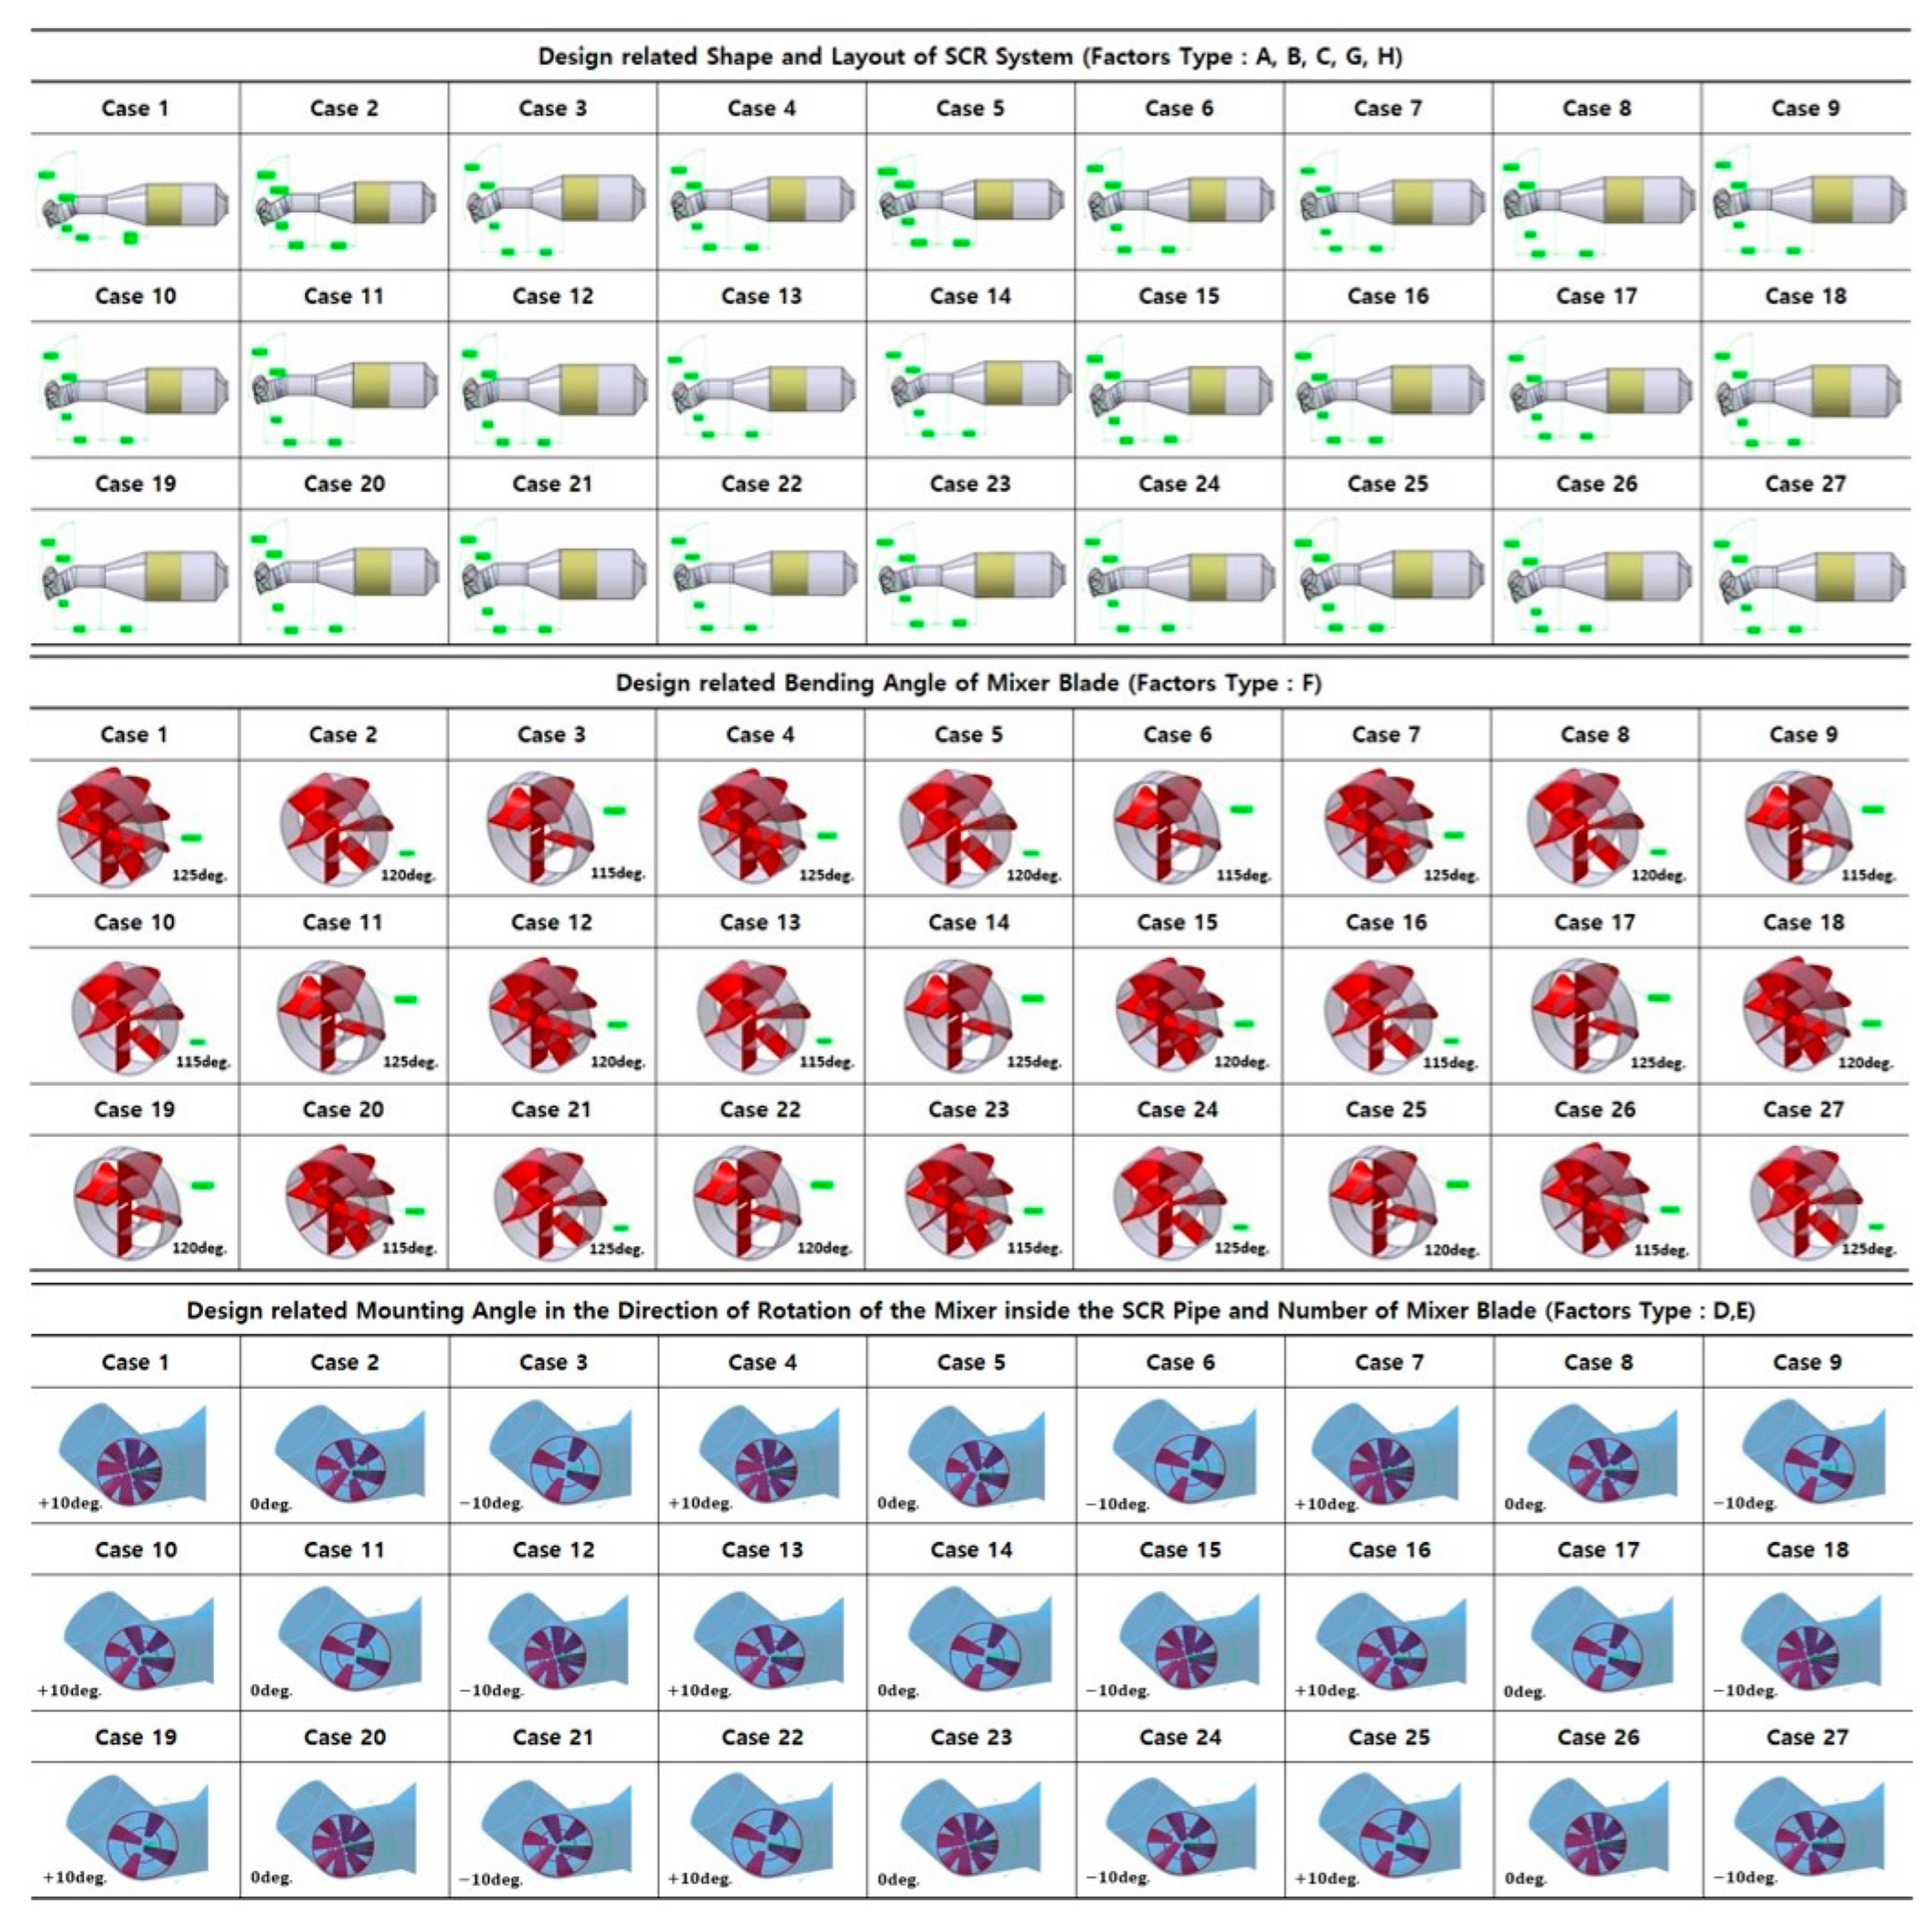
2.4. SCR System Major Design Factors Analysis and Taguchi Orthogonal Array Design
2.5. Application of Taguchi’s Orthogonal Matrix
2.5.1. Composition of Structural Design by Major Design Factors
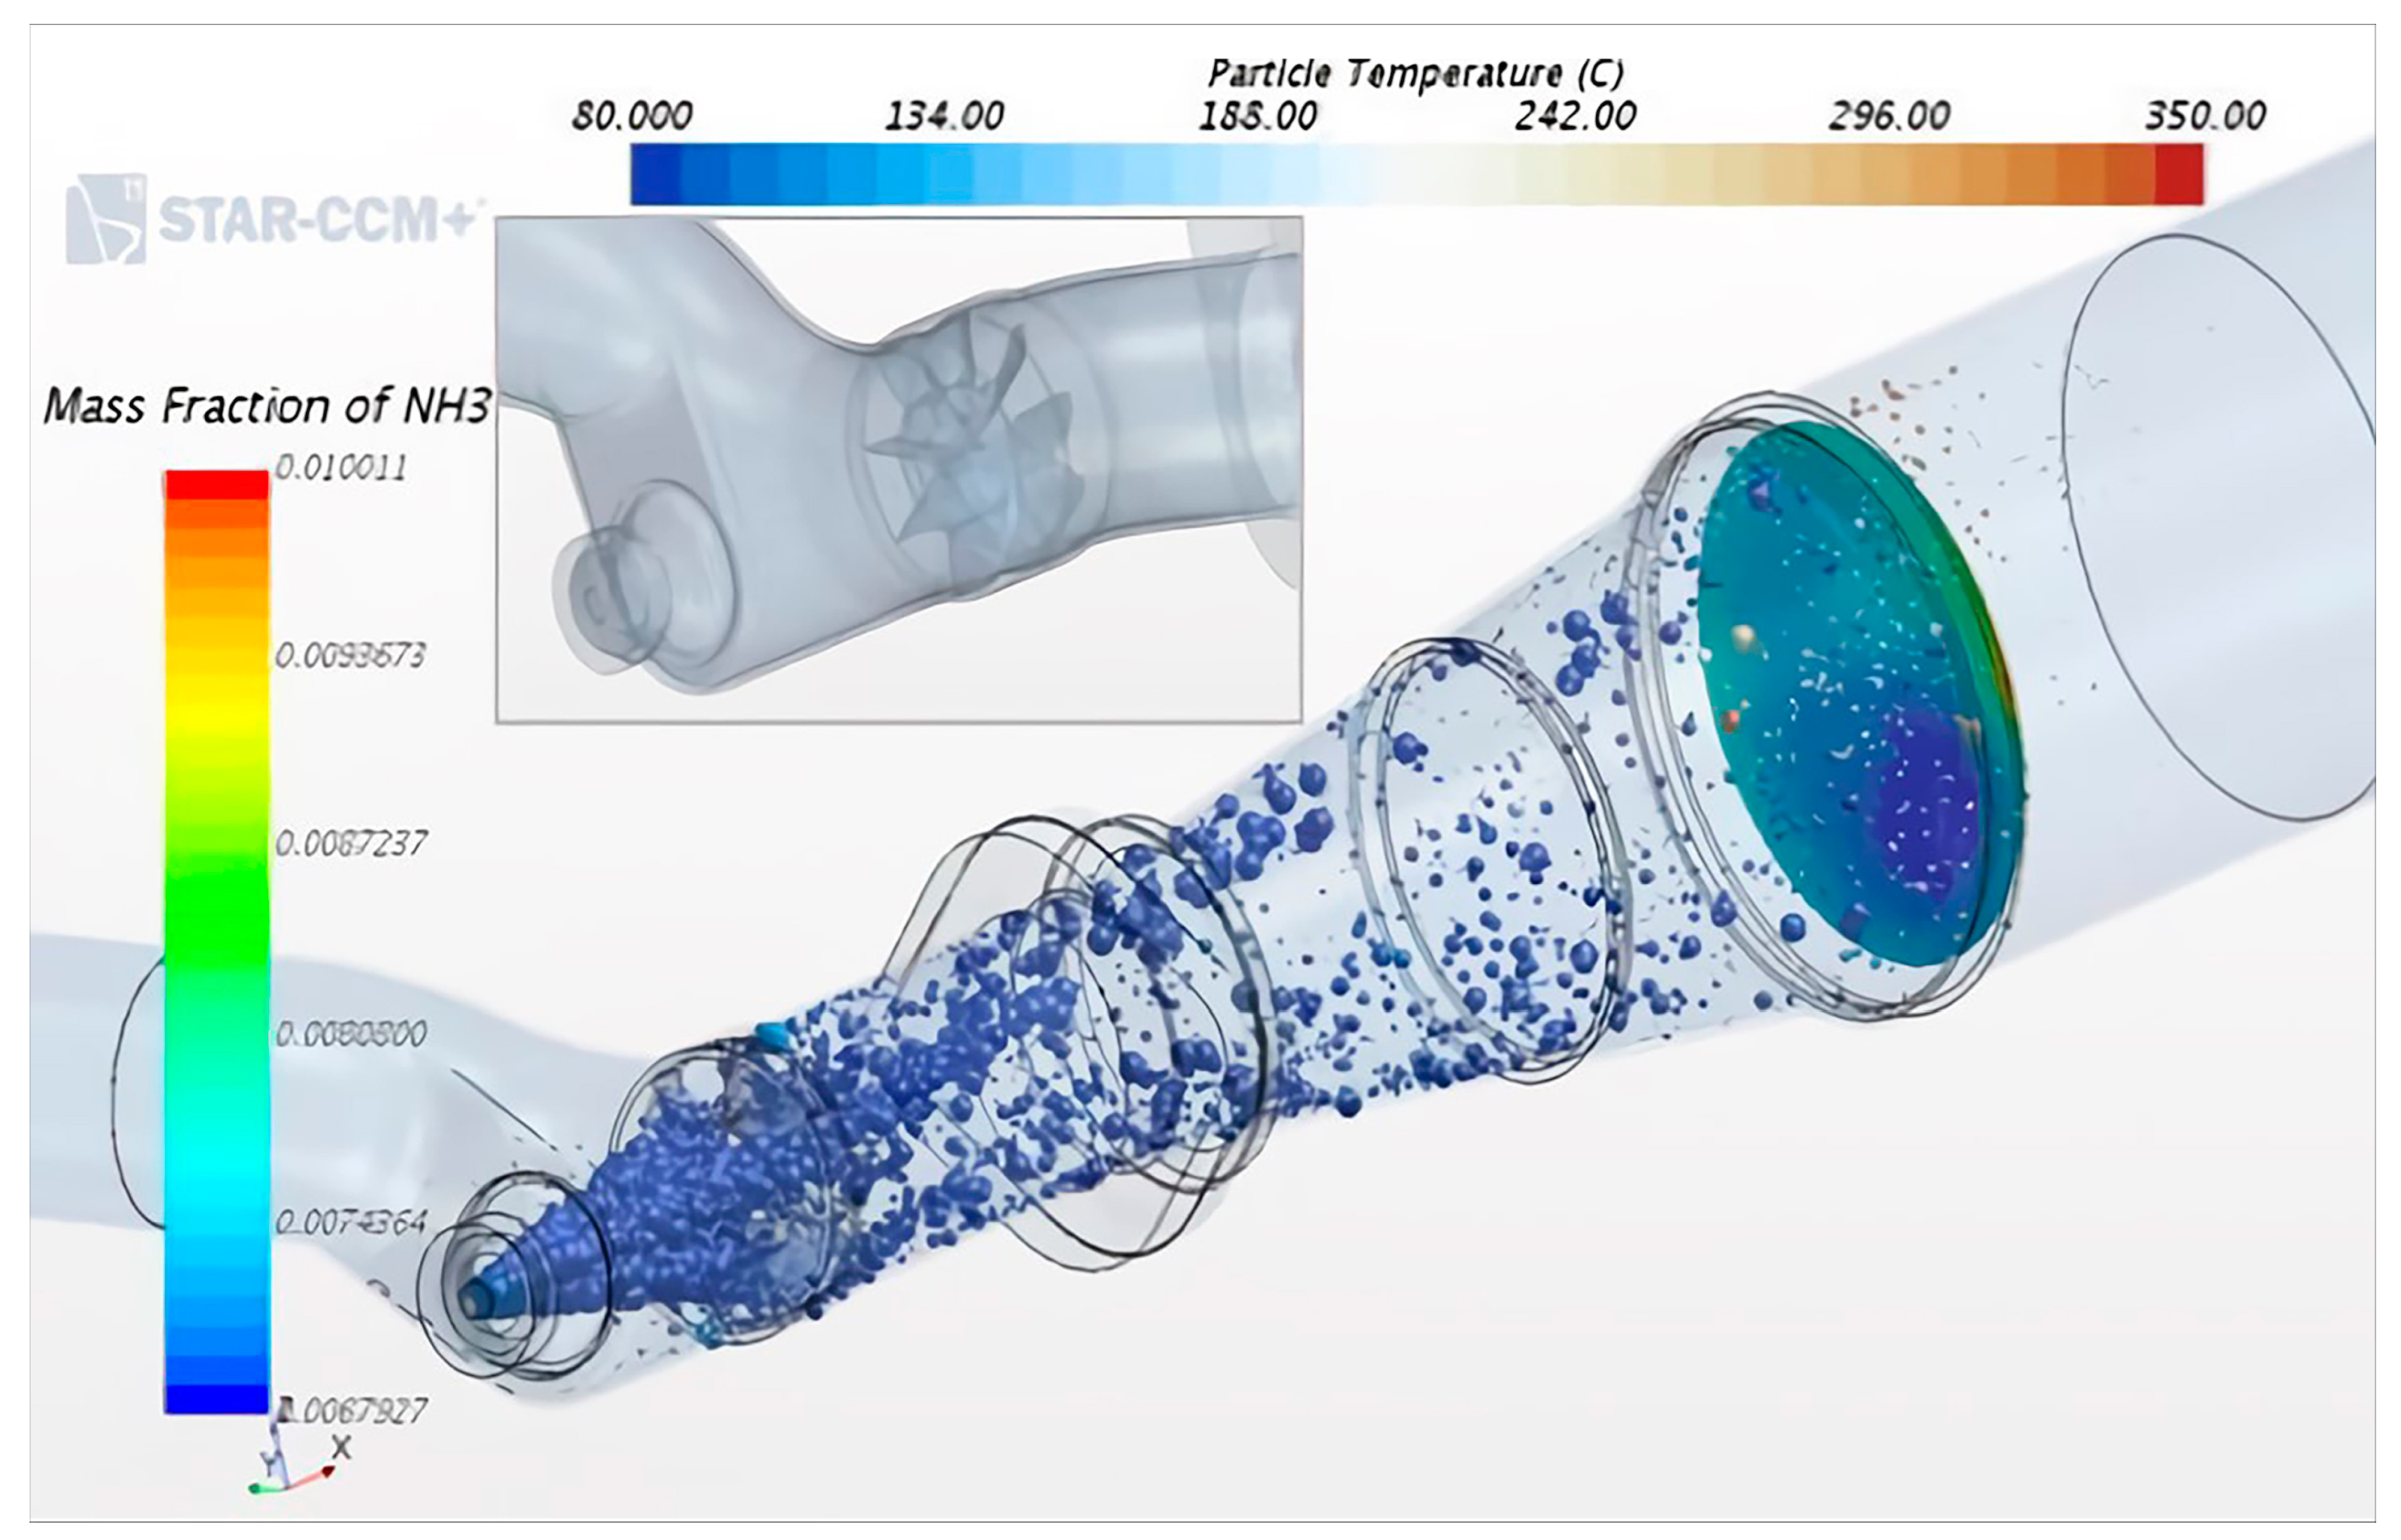
2.5.2. Injection Analysis Model and Boundary Conditions
3. Results and Discussion
3.1. Numerical Analysis and Orthogonal Analysis Results
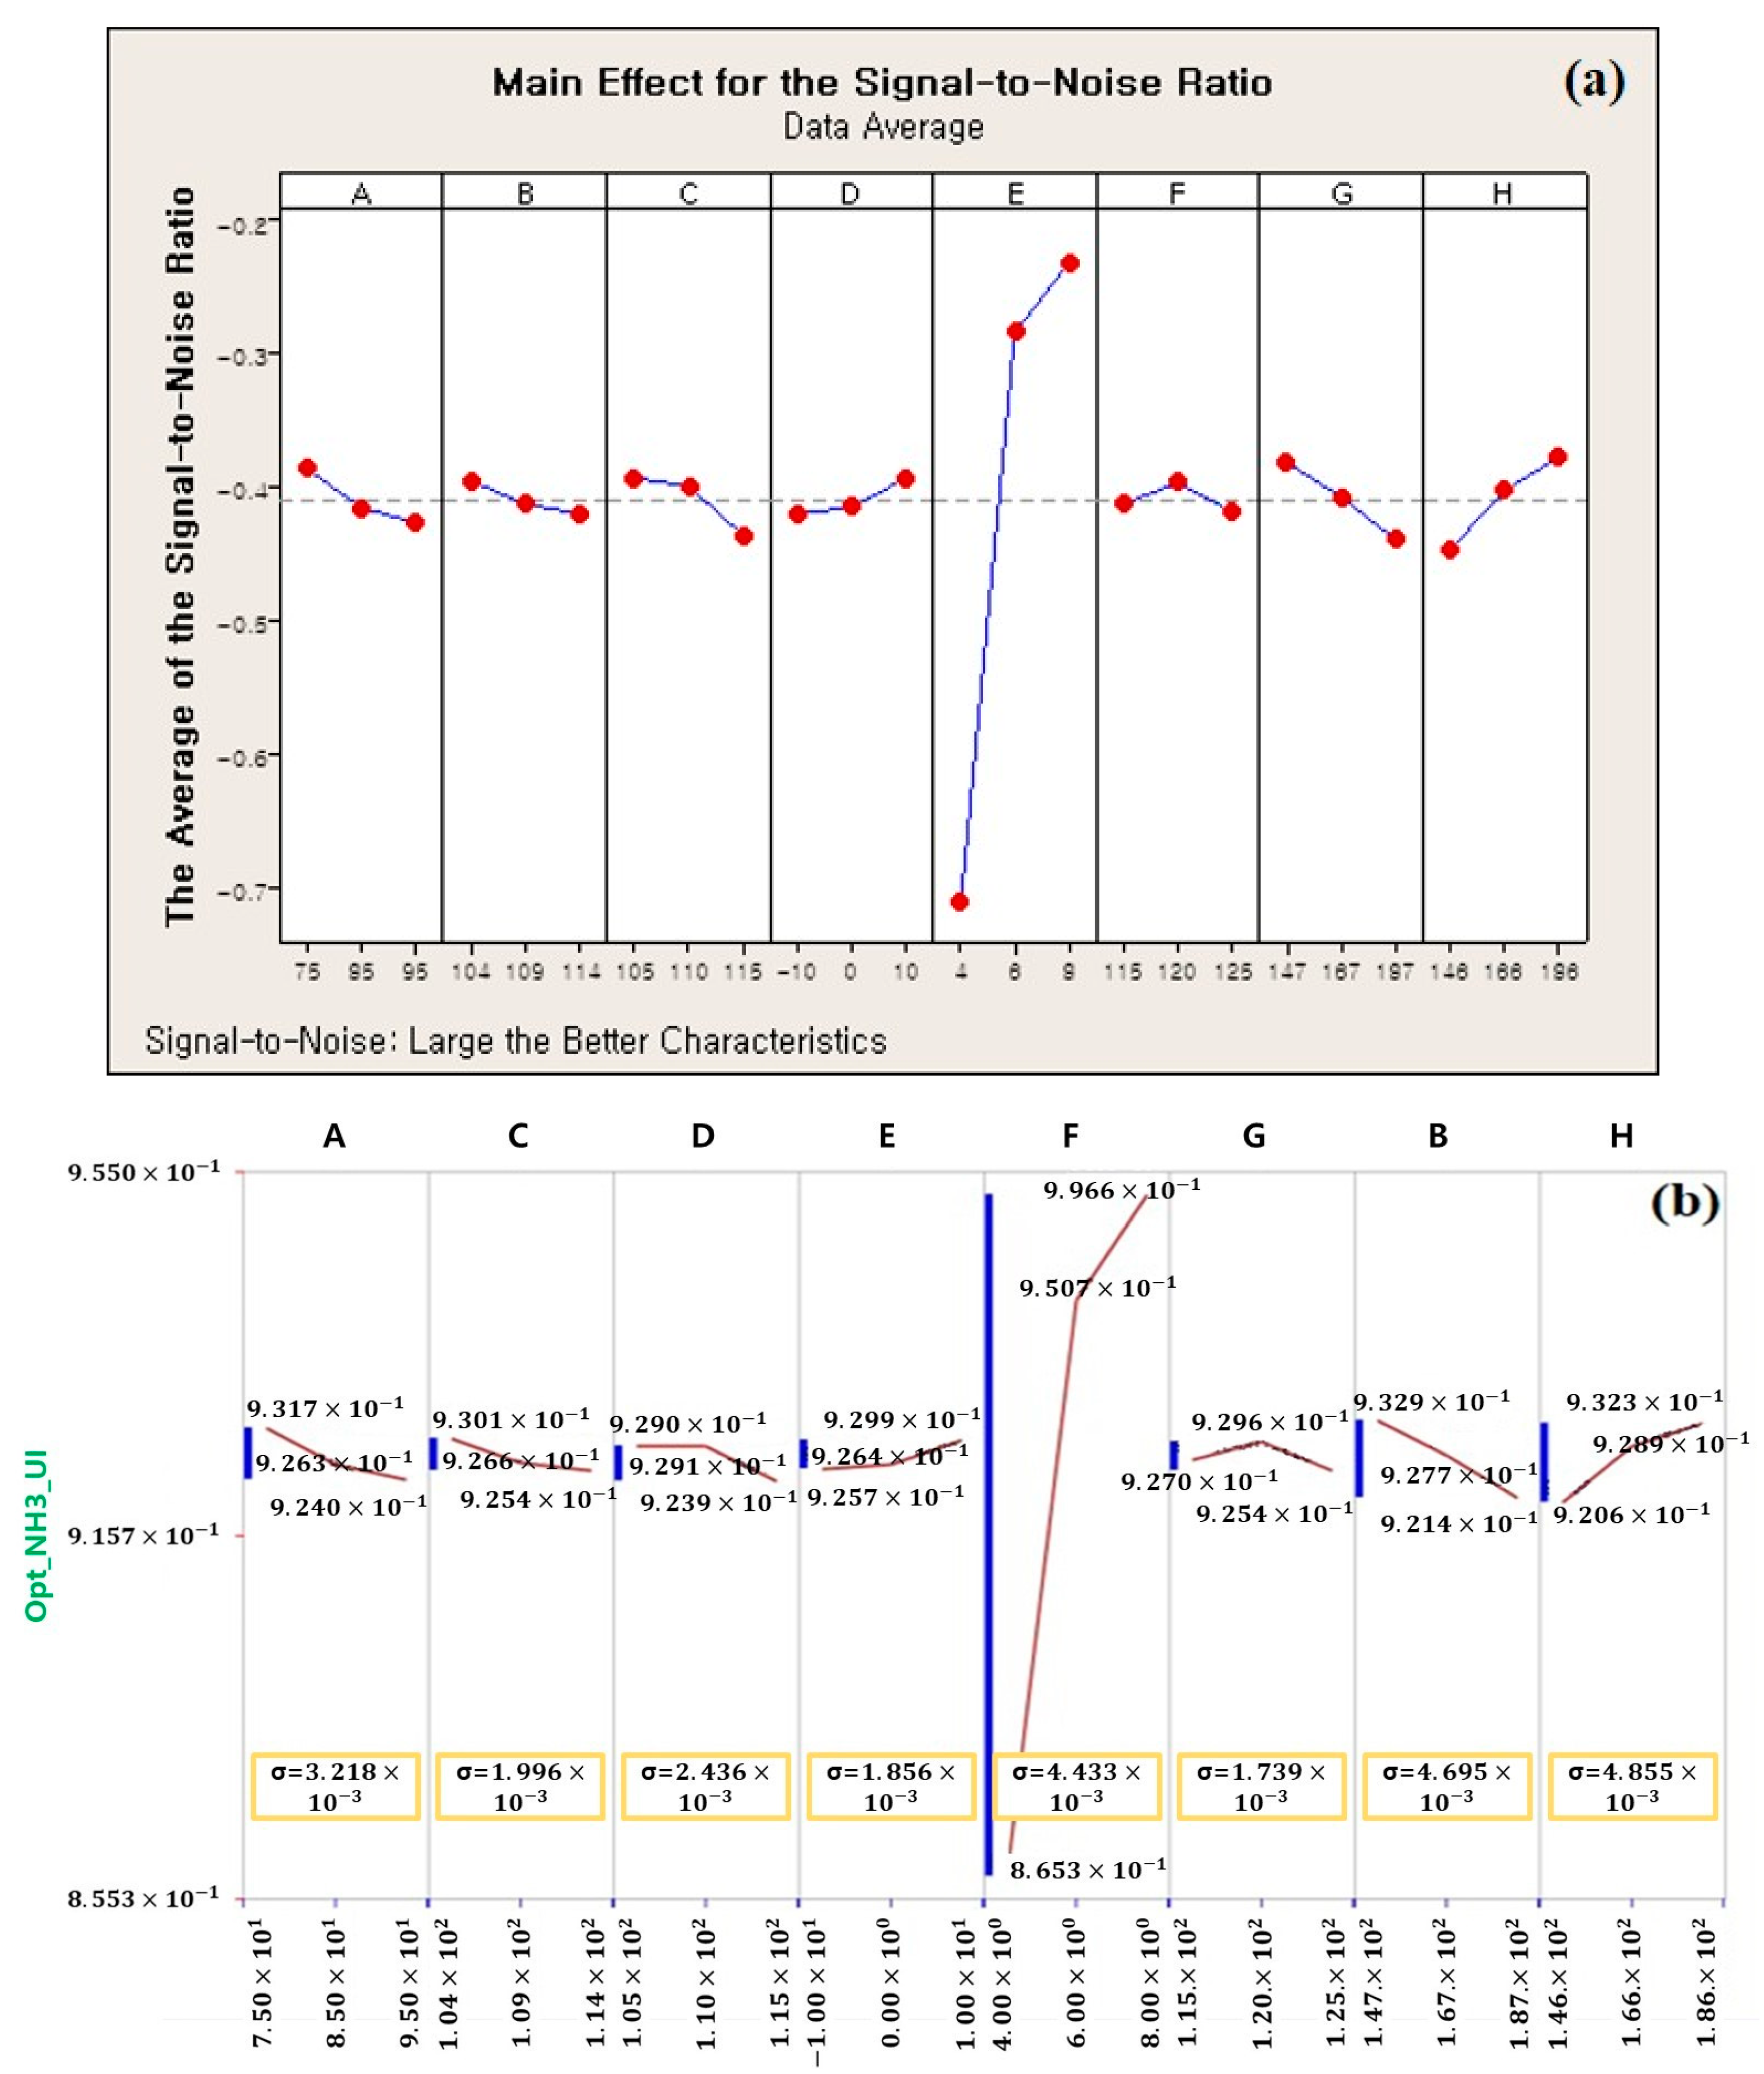
3.2. Cross-Validation of PIAno S/W versus Taguchi Orthogonal Array Design Analysis Results to Verify the Reliability of the Main Effect Diagram of the Signal-to-Noise Ratio for Each Factor
4. Conclusions
Author Contributions
Funding
Institutional Review Board Statement
Informed Consent Statement
Data Availability Statement
Acknowledgments
Conflicts of Interest
References
- Kim, H.-S.; Kasipandi, S.; Kim, J.; Kang, S.-H.; Kim, J.-H.; Ryu, J.-H.; Bae, J.-W. Current Catalyst Technology of Selective Catalytic Reduction (SCR) for NOx Removal in South Korea. Catalysts 2021, 10, 52. [Google Scholar] [CrossRef]
- Jeong, S.; Kim, H.; Kim, H.; Kwon, O.; Park, E.; Kang, J. Optimization of the Urea Injection Angle and Direction: Maximizing the Uniformity Index of a Selective Catalytic Reduction System. Energies 2020, 14, 157. [Google Scholar] [CrossRef]
- Wardana, M.; Oh, K.; Lim, O. Investigation of Urea Uniformity with Different Types of Urea Injectors in an SCR System. Catalysts 2020, 10, 1269. [Google Scholar] [CrossRef]
- Kaźmierski, B.; Kapusta, J. The importance of individual spray properties in performance improvement of a urea-SCR system employing flash-boiling injection. Appl. Energy 2023, 329, 120217. [Google Scholar] [CrossRef]
- Mehdi, G.; Zhou, S.; Zhu, Y.; Shah, A.H.; Chand, K. Numerical Investigation of SCR Mixer Design Optimization for Improved Performance. Processes 2019, 7, 168. [Google Scholar] [CrossRef]
- Park, K.; Hong, C.H.; Oh, S.; Moon, S. Numerical Prediction on the Influence of Mixer on the Per-formance of Urea-SCR System. World Acad. Sci. Eng. Technol. Int. J. Mech. Aerosp. Ind. Mechatron. Eng. 2014, 8, 972–978. [Google Scholar]
- Jiao, Y.; Zheng, Q. Urea Injection and Uniformity of Ammonia Distribution in SCR System of Diesel Engine. Appl. Math. Nonlinear Sci. 2020, 5, 129–142. [Google Scholar] [CrossRef]
- Lee, D.; Jung, I.; Chang, J.; Noh, K. Development and Application of Artificial Intelligence Technology for Diagnose Parts Causing Abnormal Noise in Powertrain; Tran. KSAE: Minato, Tokyo, 2020; pp. 31–32. [Google Scholar]
- Sung, J.; Cho, Y. Machine Learning Approach for Pattern Analysis of Energy Consumption in Factory. KIPS Trans. Comput. Commun. Syst. 2019, 8, 87–92. [Google Scholar] [CrossRef]
- Cioffi, R.; Travaglioni, M.; Piscitelli, G.; Petrillo, A.; De Felice, F. Artificial Intelligence and Machine Learning Applications in Smart Production: Progress, Trends, and Directions. Sustainability 2020, 12, 492. [Google Scholar] [CrossRef]
- Sun, X.; Zhang, F.; Liu, J.; Duan, X. Prediction of gasoline research octane number using multiple feature machine learning models. Fuel 2023, 333, 126510. [Google Scholar] [CrossRef]
- Li, Y.; Wang, S.; Duan, X.; Liu, S.; Liu, J.; Hu, S. Multi-objective energy management for Atkinson cycle engine and series hybrid electric vehicle based on evolutionary NSGA-II algorithm using digital twins. Energy Convers. Manag. 2021, 230, 113788. [Google Scholar] [CrossRef]
- Kueh, A.; Razali, A.; Lee, Y.; Hamdan, S.; Yakub, I.; Suhaili, N. Acoustical and mechanical characteristics of mortars with pineapple leaf fiber and silica aerogel infills—Measurement and modeling. Mater. Today Commun. 2023, 35, 105540. [Google Scholar] [CrossRef]
- Nazar, S.; Yang, J.; Wang, X.-E.; Khan, K.; Amin, M.N.; Javed, M.F.; Althoey, F.; Ali, M. Estimation of strength, rheological parameters, and impact of raw constituents of alkali-activated mortar using machine learning and SHapely Additive exPlanations (SHAP). Constr. Build. Mater. 2023, 377, 131014. [Google Scholar] [CrossRef]
- Wang, X.; Dong, S.; Li, L.; Wang, D.; Zhang, K.; Wang, Y.; Han, B. Evaluating the effect of nanofillers on cement-based composites strength via artificial neural network and genetic algorithm. Mater. Today Commun. 2023, 35, 105761. [Google Scholar] [CrossRef]
- Tang, Y.X.; Lee, Y.H.; Amran, M.; Fediuk, R.; Vatin, N.; Kueh, A.B.H.; Lee, Y.Y. Artificial Neural Network-Forecasted Compression Strength of Alkaline-Activated Slag Concretes. Sustainability 2022, 14, 5214. [Google Scholar] [CrossRef]
- Najigivi, A.; Khaloo, A.; Zad, A.I.; Rashid, S.A. An Artificial Neural Networks Model for Predicting Permeability Properties of Nano Silica–Rice Husk Ash Ternary Blended Concrete. Int. J. Concr. Struct. Mater. 2013, 7, 225–238. [Google Scholar] [CrossRef]
- Ujene, A.O.; Umoh, A.A. Utilizing Site Characteristics in Neural Network Modelling of Percentage Cost-Time Overrun of Building Projects. J. Civ. Eng. Sci. Technol. 2017, 8, 1–15. [Google Scholar] [CrossRef]
- Yakub, I.; Kueh, A.B.H.; De La, O.E.A.P.; Rahman, R.; Barawi, M.H.; Abdullah, M.O.; Amran, M.; Fediuk, R.; Vatin, N.I. Employing an Artificial Neural Network in Correlating a Hydrogen-Selective Catalytic Reduction Performance with Crystallite Sizes of a Biomass-Derived Bimetallic Catalyst. Catalysts 2022, 12, 779. [Google Scholar] [CrossRef]
- Abhyankar, A.; Patwardhan, A.; Paliwal, M.; Inamdar, A. Identification of flooded areas due to severe storm using envisat asar data and neural networks. J. Civ. Eng. Sci. Technol. 2019, 10, 124–131. [Google Scholar] [CrossRef]
- Burns, E. What Is Machine Learning and Why Is It Important? Available online: https://www.techtarget.com/searchenterpriseai/definition/machine-learning-ML (accessed on 15 December 2022).
- Qiu, N.; Jin, Z.; Liu, J.; Fu, L.; Chen, Z.; Kim, N.H. Hybrid multi-objective robust design optimization of a truck cab considering fatigue life. Thin-Walled Struct. 2021, 162, 107545. [Google Scholar] [CrossRef]
- Choi, C.; Sung, Y.; Choi, G.M.; Kim, D.J. Numerical analysis of NOx reduction for compact design in marine urea-SCR system. Int. J. Nav. Arch. Ocean Eng. 2015, 7, 1020–1033. [Google Scholar] [CrossRef]
- Aravind, M.; Periyasamy, D.S. Optimization of surface grinding process parameters by Taguchi method and response surface methodology. Int. J. Eng. Res. 2014, 3, 1721–1727. [Google Scholar]
- Vaziri, R.; Oladipo, A.A.; Sharifpur, M.; Taher, R.; Ahmadi, M.H.; Issakhov, A. Efficiency Enhancement in Double-Pass Perforated Glazed Solar Air Heaters with Porous Beds: Taguchi-Artificial Neural Network Optimization and Cost–Benefit Analysis. Sustainability 2021, 13, 11654. [Google Scholar] [CrossRef]
- Anwar, F.H.; El-Hassan, H.; Hamouda, M.; El-Mir, A.; Mohammed, S.; Mo, K.H. Optimization of Pervious Geopolymer Concrete Using TOPSIS-Based Taguchi Method. Sustainability 2022, 14, 8767. [Google Scholar] [CrossRef]
- Vedagiri, P.; Martin, L.J.; Varuvel, E.G. Characterization of urea SCR using Taguchi technique and computational methods. Environ. Sci. Pollut. Res. 2020, 28, 11988–11999. [Google Scholar] [CrossRef] [PubMed]
- Capetillo, A.J.; Ibarra, F.; Stepniewski, D.; Vankan, J. Multiphase Modelling of SCR Systems: Using the Taguchi Method for Mixer Optimisation. SAE Int. J. Engines 2017, 10, 61–71. [Google Scholar] [CrossRef]
- Noh, H.R.; Kim, C.M.; Kim, K.C. Proposal of Motor Improvement Design Method under Limited Conditions Using Taguchi Method. Math. Stat. Eng. Appl. 2022, 71, 548–554. [Google Scholar]
- Shin, J.; Baek, S.; Rhee, Y. Wind Farm Layout Optimization Using a Metamodel and EA/PSO Algorithm in Korea Offshore. Energies 2020, 14, 146. [Google Scholar] [CrossRef]
- You, Y.-M. Optimal Design of PMSM Based on Automated Finite Element Analysis and Metamodeling. Energies 2019, 12, 4673. [Google Scholar] [CrossRef]
- Um, H.S.; Kim, D.; Kim, K.H. Numerical study on the design of urea decomposition chamber in LP SCR system. Int. J. Nav. Arch. Ocean Eng. 2019, 11, 307–313. [Google Scholar] [CrossRef]
- Mohsin, I.; He, K.; Li, Z.; Zhang, F.; Du, R. Optimization of the Polishing Efficiency and Torque by Using Taguchi Method and ANOVA in Robotic Polishing. Appl. Sci. 2020, 10, 824. [Google Scholar] [CrossRef]
- Weltens, H.; Bressler, H.; Terres, F.; Neumaier, H.; Rammoser, D. Optimisation of Catalytic Converter Gas Flow Distribution by CFD Prediction. SAE Tech. Pap. 1993. [Google Scholar] [CrossRef]
- Wardana, M.; Lim, O. Investigation of Solid Deposit Inside L-Type Urea Injector and NOx Conversion in a Heavy-Duty Diesel Engine. Catalysts 2021, 11, 595. [Google Scholar] [CrossRef]
- Jang, J.; Park, H. Numerical Study on Urea Spraying and Mixing Characteristics with Application of Static Mixer in Marine SCR System. Trans. Korean Soc. Mech. Eng. B 2016, 40, 429–434. [Google Scholar] [CrossRef]
- Ye, J.; Lv, J.; Tan, D.; Ai, Z.; Feng, Z. Numerical Analysis on Enhancing Spray Performance of SCR Mixer Device and Heat Transfer Performance Based on Field Synergy Principle. Processes 2021, 9, 786. [Google Scholar] [CrossRef]
- Başar, C.A.; Korkmaz, A.A.; Önal, Y.; Utku, T. Evaluation of optimum carbonization conditions of the blended domestic polymeric waste, biomass and lignite in the presence of catalyst by Taguchi and ANOVA optimization analysis. J. Hazard. Mater. Adv. 2022, 8, 100164. [Google Scholar] [CrossRef]
- Mustapha, A.N.; Zhang, Y.; Zhang, Z.; Ding, Y.; Yuan, Q.; Li, Y. Taguchi and ANOVA analysis for the optimization of the microencapsulation of a volatile phase change material. J. Mater. Res. Technol. 2021, 11, 667–680. [Google Scholar] [CrossRef]
- Data Analysis, Statistical and Process Improvement Tools. Available online: https://www.minitab.com/ko-kr/ (accessed on 2 February 2023).
- Minitab 20 Support. Available online: https://support.minitab.com/en-us/minitab/20/ (accessed on 30 January 2023).
- Priyanga, R.; Muthadhi, A. Optimization of compressive strength of cementitious matrix composition of Textile Reinforced Concrete–Taguchi approach. Results Control Optim. 2023, 10, 100205. [Google Scholar] [CrossRef]
- Design of Gaskets for Hydrogen Fuel Cells Using Taguchi Method. Korean Soc. Manuf. Process. Eng. 2022, 21, 66–71. [CrossRef]


| No. | Classification | Major Design Factors | Unit | Detailed Description |
|---|---|---|---|---|
| 1 | Inlet of SCR System | Distance between Urea Injector and Mixer | mm |  |
| 2 | Inflow Angle of Exhaust Gas | deg. | ||
| 3 | Angle of Urea Injector and Mixer | deg. | ||
| 4 | Mixer | Mounting Angle in the Direction of Rotation of the Mixer inside the SCR Pipe | deg. |  |
| 5 | Number of Mixer Blade | No. | ||
| 6 | Bending Angle of Mixer Blade | deg. |  | |
| 7 | SCR System | Distance of Mixer and SCR Catalyst | mm |  |
| 8 | Length of SCR Cone | mm |
| No. | Major Design Factors | Unit | Sets | ||
|---|---|---|---|---|---|
| Set 1 | Set 2 | Set 3 | |||
| 1 | A: Distance of Urea Injector and Mixer | mm | 95 | 85 | 75 |
| 2 | B: Inflow Angle of Exhaust Gas | deg. | 114 | 109 | 104 |
| 3 | C: Angle of Urea Injector and Mixer | deg. | 115 | 110 | 105 |
| 4 | D: Mounting Angle in the Direction of Rotation of the Mixer inside the SCR Pipe | deg. | 10 | 0 | −10 |
| 5 | E: Number of Mixer Blade | No. | 8 | 6 | 4 |
| 6 | F: Bending Angle of Mixer Blade | deg. | 125 | 120 | 115 |
| 7 | G: Distance of Mixer and SCR Catalyst | mm | 187 | 167 | 147 |
| 8 | H: Length of SCR Cone | mm | 186 | 166 | 146 |
| Major Design Factors | A | B | C | D | E | F | G | H | |
|---|---|---|---|---|---|---|---|---|---|
| Number of Experiments | |||||||||
| Case 1 | 1 | 1 | 1 | 1 | 1 | 1 | 1 | 1 | |
| Case 2 | 1 | 1 | 1 | 1 | 2 | 2 | 2 | 2 | |
| Case 3 | 1 | 1 | 1 | 1 | 3 | 3 | 3 | 3 | |
| Case 4 | 1 | 2 | 2 | 2 | 1 | 1 | 1 | 2 | |
| Case 5 | 1 | 2 | 2 | 2 | 2 | 2 | 2 | 3 | |
| Case 6 | 1 | 2 | 2 | 2 | 3 | 3 | 3 | 1 | |
| Case 7 | 1 | 3 | 3 | 3 | 1 | 1 | 1 | 3 | |
| Case 8 | 1 | 3 | 3 | 3 | 2 | 2 | 2 | 1 | |
| Case 9 | 1 | 3 | 3 | 3 | 3 | 3 | 3 | 2 | |
| Case 10 | 2 | 1 | 2 | 3 | 1 | 2 | 3 | 1 | |
| Case 11 | 2 | 1 | 2 | 3 | 2 | 3 | 1 | 2 | |
| Case 12 | 2 | 1 | 2 | 3 | 3 | 1 | 2 | 3 | |
| Case 13 | 2 | 2 | 3 | 1 | 1 | 2 | 3 | 2 | |
| Case 14 | 2 | 2 | 3 | 1 | 2 | 3 | 1 | 3 | |
| Case 15 | 2 | 2 | 3 | 1 | 3 | 1 | 2 | 1 | |
| Case 16 | 2 | 3 | 1 | 2 | 1 | 2 | 3 | 3 | |
| Case 17 | 2 | 3 | 1 | 2 | 2 | 3 | 1 | 1 | |
| Case 18 | 2 | 3 | 1 | 2 | 3 | 1 | 2 | 2 | |
| Case 19 | 3 | 1 | 3 | 2 | 1 | 3 | 2 | 1 | |
| Case 20 | 3 | 1 | 3 | 2 | 2 | 1 | 3 | 2 | |
| Case 21 | 3 | 1 | 3 | 2 | 3 | 2 | 1 | 3 | |
| Case 22 | 3 | 2 | 1 | 3 | 1 | 3 | 2 | 2 | |
| Case 23 | 3 | 2 | 1 | 3 | 2 | 1 | 3 | 3 | |
| Case 24 | 3 | 2 | 1 | 3 | 3 | 2 | 1 | 1 | |
| Case 25 | 3 | 3 | 2 | 1 | 1 | 3 | 2 | 3 | |
| Case 26 | 3 | 3 | 2 | 1 | 2 | 1 | 3 | 1 | |
| Case 27 | 3 | 3 | 2 | 1 | 3 | 2 | 1 | 2 | |
| No | Classification | Taguchi | Machine Learning |
|---|---|---|---|
| 1 | Design of Experiments | OA (Orthogonal Array) | OLHD (Optimal Latin Hypercube Design) |
| 2 | Global Metamodel | One-Shot | Sequential Sampling |
| 3 | Number of Experiments | 27 EA | At least 80 EA |
| 4 | Analysis Type | Signal-to-Noise Ratio, ANOVA | EDT (Ensemble of Decision Trees), Kriging |
| 5 | Purpose | Estimation of Probability of Failure | Estimation of Prediction of Success |
| Boundary conditions of CFD in the SCR System | |||||||
| No. | Classification | Design Factors | Unit | Value | |||
| 1 | Material | Shell Material in CFD Modeling | SUS | 436 L | |||
| 2 | SCR Inlet Condition | Mass Flow of Exhaust Gas | kg/h | 316 | |||
| 3 | Exhaust Gas Temp. | Max, °C | 411 | ||||
| 4 | Turbo-Charger | Max, RPM | 203,000 | ||||
| 5 | Engine RPM | RPM | 3000 | ||||
| 6 | Urea Injection | Adblue | mg/s | 105 | |||
| 7 | Urea Injection | mg/Injection | 30.6 | ||||
| 8 | Injection Duration | msec | 81.6 | ||||
| 9 | SCR Outlet Condition | Pressure of Exhaust Gas | kPa | 9.8 | |||
| Geometrical and functional data of urea injector nozzle holes for the dosing of the SCR system | |||||||
| No. | Classification | Unit | Value | ||||
| 1 | Number | No. | 3 | ||||
| 2 | Hole Diameter | μm | 120 | ||||
| 3 | Diameter at Hole Center Positions | mm | 1.9 | ||||
| 4 | Circumferential Distribution | deg. | 120 | ||||
| 5 | Static Mass Flow | Kg/h | 3.2 | ||||
| Parameters for CFD spray initialization | |||||||
| No. | Classification | Unit | Value | ||||
| 1 | Equivalent Spray Type | Type | 3 Hole Full Cone Spray | ||||
| 2 | Cone Angle | deg. | 7 | ||||
| 3 | Spray Angle | deg. | 7 | ||||
| 4 | Estimated Initial Droplet Velocity | m/s | 24 | ||||
| 5 | Droplet Diameter, SMD | μm | 100 | ||||
| Mesh modelling information | |||||||
| Analysis Tool | Mesh Type | Volume (Total Mesh Quantity) | Base Mesh Size | Surface Mesh Size | Number of Prism Layers | Prism Layer Thickness | Fine Mesh |
| Star-CCM + V12.04 | Polyhedral | 1,041,308 | 4 mm | 50~100% (Compared Base Mesh Size) | 3 | 25% (Compared Base Thickness) | Surface: 25% Prism: 12.5% |
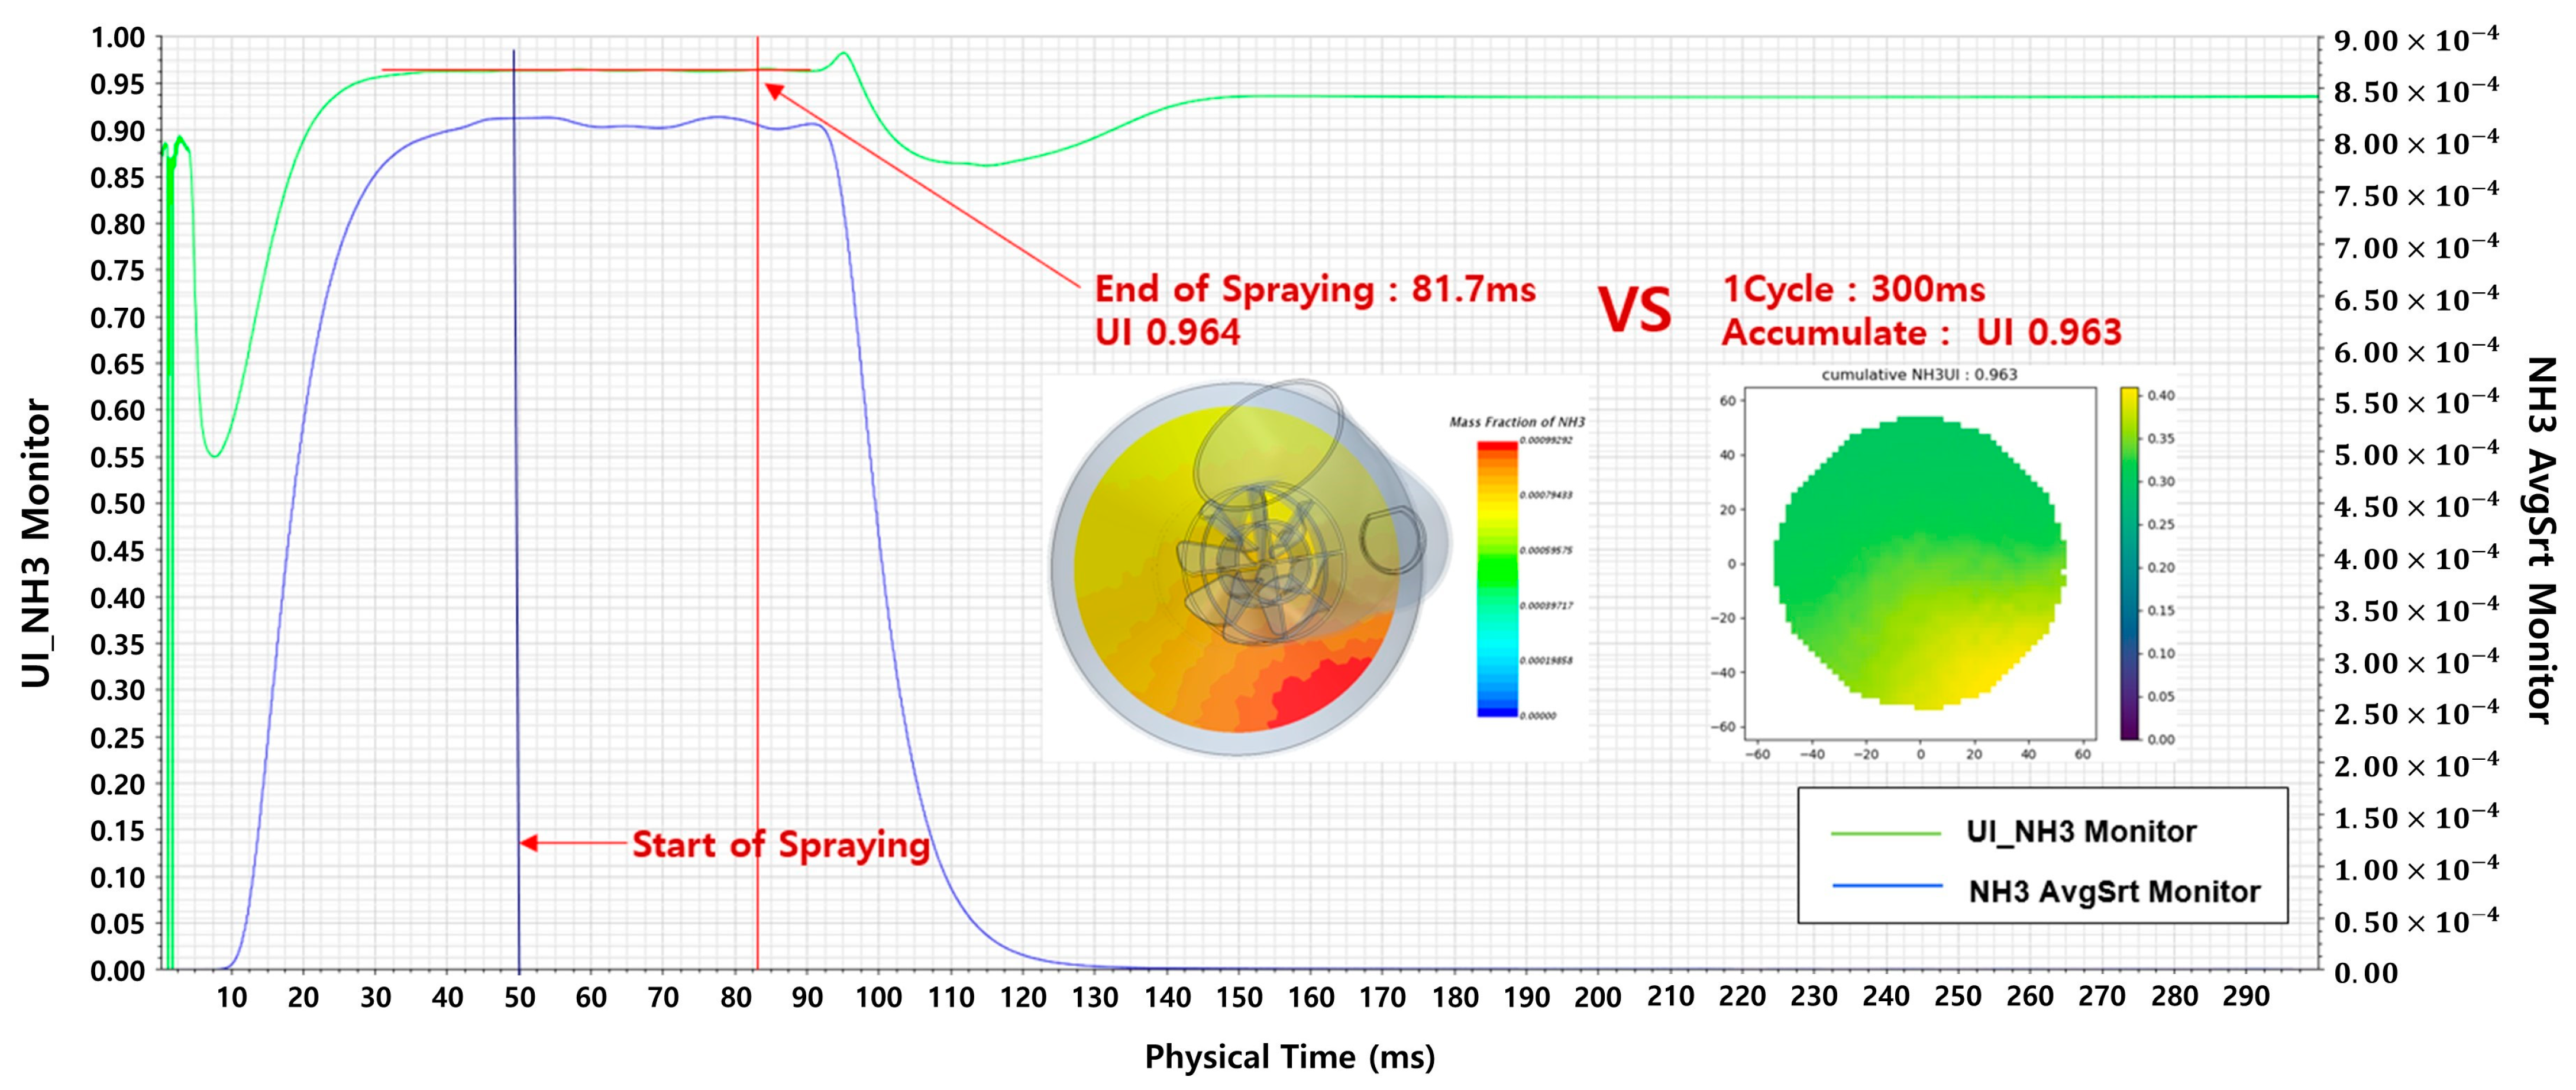
| Spray Time | 81.7 ms | 300 ms | ||
|---|---|---|---|---|
| Simulation Model for Case 01 | 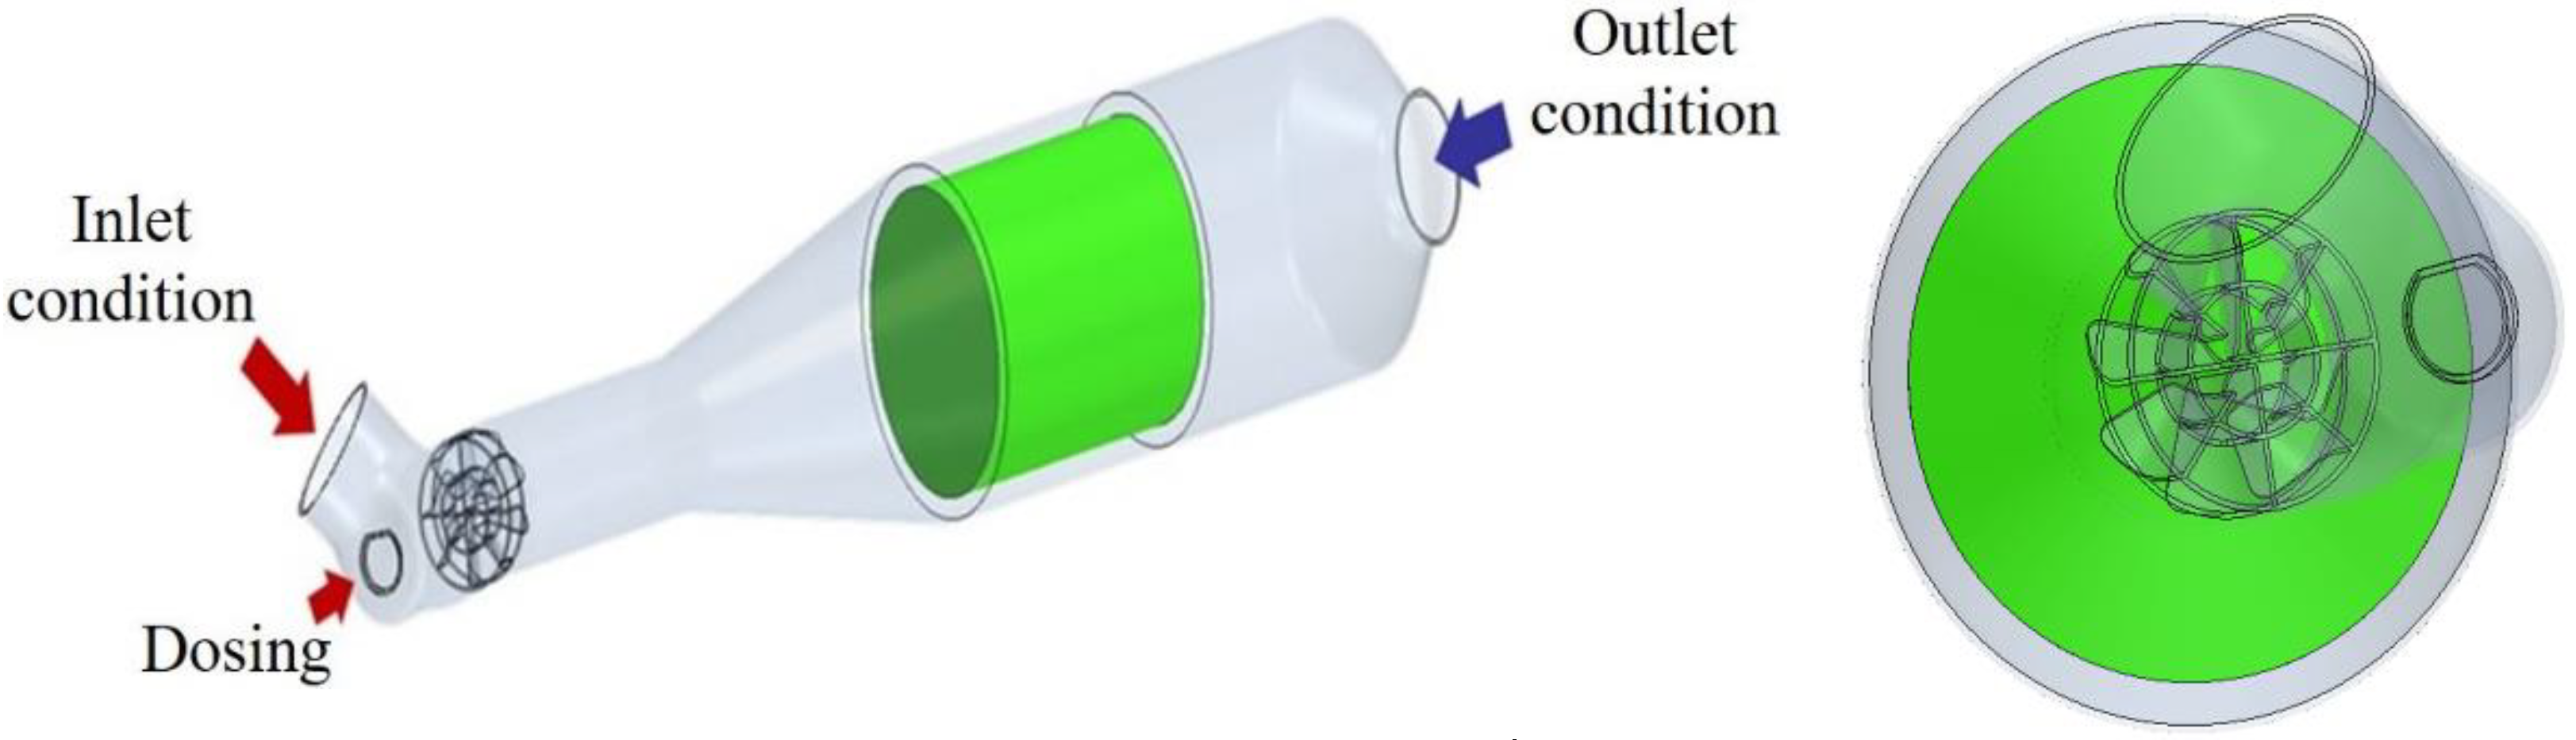 | |||
| CFD Results | 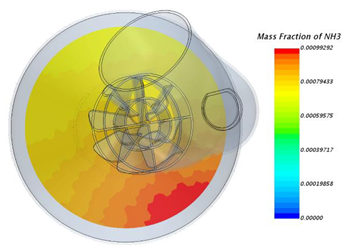 | 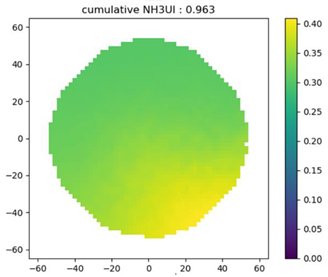 | ||
| Velocity UI: 0.982 | NH3 UI: 0.964 | Velocity UI: 0.982 | NH3 UI: 0.963 | |
| Analysis Time of CFD | 1 day | 2 to 3 days | ||
| Analysis | CFD Results | H | G | F | E | D | C | B | A | No. | |||
|---|---|---|---|---|---|---|---|---|---|---|---|---|---|
| Average | Standard Deviation | Signal-to-Noise Ratio | Velocity UI | NH3 UI | Length of SCR Cone (mm) | Distance of Mixer and SCR Catalyst (mm) | Angle of Mixer and SCR Catalyst (deg.) | Number of Mixer Blade (No.) | Mounting Angle in the Direction of Rotation of the Mixer inside the SCR Pipe (deg.) | Angle of Urea Injector and Mixer (deg.) | Inflow Angle of Exhaust Gas (deg.) | Distance of Urea Injector and Mixer (mm) | |
| 0.97 | 0.01273 | −0.23886 | 0.98 | 0.96 | 186 | 187 | 125 | 8 | 10 | 115 | 114 | 95 | Case 1 |
| 0.96 | 0.03111 | −0.33428 | 0.99 | 0.94 | 166 | 187 | 120 | 6 | 0 | 115 | 114 | 95 | Case 2 |
| 0.91 | 0.11031 | −0.90526 | 0.99 | 0.83 | 146 | 187 | 115 | 4 | −10 | 115 | 114 | 95 | Case 3 |
| 0.97 | 0.01131 | −0.2297 | 0.98 | 0.97 | 166 | 167 | 125 | 8 | 10 | 110 | 109 | 95 | Case 4 |
| 0.96 | 0.02899 | −0.32886 | 0.98 | 0.94 | 146 | 167 | 120 | 6 | 0 | 110 | 109 | 95 | Case 5 |
| 0.93 | 0.08839 | −0.69396 | 0.99 | 0.87 | 186 | 167 | 115 | 4 | −10 | 110 | 109 | 95 | Case 6 |
| 0.97 | 0.01556 | −0.25729 | 0.98 | 0.96 | 146 | 147 | 125 | 8 | 10 | 105 | 104 | 95 | Case 7 |
| 0.98 | 0.01909 | −0.21795 | 0.99 | 0.96 | 186 | 147 | 120 | 6 | 0 | 105 | 104 | 95 | Case 8 |
| 0.94 | 0.07778 | −0.62888 | 0.99 | 0.88 | 166 | 147 | 115 | 4 | −10 | 105 | 104 | 95 | Case 9 |
| 0.97 | 0.02828 | −0.27011 | 0.99 | 0.95 | 186 | 187 | 115 | 6 | 10 | 105 | 109 | 85 | Case 10 |
| 0.92 | 0.0997 | −0.78643 | 0.99 | 0.85 | 166 | 187 | 125 | 4 | 0 | 105 | 109 | 85 | Case 11 |
| 0.97 | 0.01414 | −0.23912 | 0.98 | 0.96 | 146 | 187 | 120 | 8 | −10 | 105 | 109 | 85 | Case 12 |
| 0.97 | 0.02121 | −0.26768 | 0.99 | 0.96 | 166 | 167 | 115 | 6 | 10 | 115 | 104 | 85 | Case 13 |
| 0.92 | 0.09617 | −0.7859 | 0.99 | 0.85 | 146 | 167 | 125 | 4 | 0 | 115 | 104 | 85 | Case 14 |
| 0.98 | 0.00707 | −0.22025 | 0.98 | 0.97 | 186 | 167 | 120 | 8 | −10 | 115 | 104 | 85 | Case 15 |
| 0.97 | 0.02334 | −0.29077 | 0.98 | 0.95 | 146 | 147 | 115 | 6 | 10 | 110 | 114 | 85 | Case 16 |
| 0.94 | 0.07849 | −0.62501 | 0.99 | 0.88 | 186 | 147 | 125 | 4 | 0 | 110 | 114 | 85 | Case 17 |
| 0.97 | 0.01131 | −0.24756 | 0.98 | 0.96 | 166 | 147 | 120 | 8 | −10 | 110 | 114 | 85 | Case 18 |
| 0.93 | 0.08344 | −0.6545 | 0.99 | 0.87 | 186 | 187 | 120 | 4 | 10 | 110 | 104 | 75 | Case 19 |
| 0.98 | 0.00707 | −0.19356 | 0.98 | 0.97 | 166 | 187 | 115 | 8 | 0 | 110 | 104 | 75 | Case 20 |
| 0.96 | 0.0297 | −0.32464 | 0.99 | 0.94 | 146 | 187 | 125 | 6 | −10 | 110 | 104 | 75 | Case 21 |
| 0.93 | 0.08273 | −0.65833 | 0.99 | 0.87 | 166 | 167 | 120 | 4 | 10 | 105 | 114 | 75 | Case 22 |
| 0.97 | 0.01131 | −0.2297 | 0.98 | 0.97 | 146 | 167 | 115 | 8 | 0 | 105 | 114 | 75 | Case 23 |
| 0.97 | 0.02334 | −0.24596 | 0.99 | 0.96 | 186 | 167 | 125 | 6 | −10 | 105 | 114 | 75 | Case 24 |
| 0.93 | 0.0799 | −0.66431 | 0.99 | 0.88 | 146 | 147 | 120 | 4 | 10 | 115 | 109 | 75 | Case 25 |
| 0.97 | 0.00849 | −0.22932 | 0.98 | 0.97 | 186 | 147 | 115 | 8 | 0 | 115 | 109 | 75 | Case 26 |
| 0.97 | 0.01909 | −0.27157 | 0.98 | 0.96 | 166 | 147 | 125 | 6 | −10 | 115 | 109 | 75 | Case 27 |
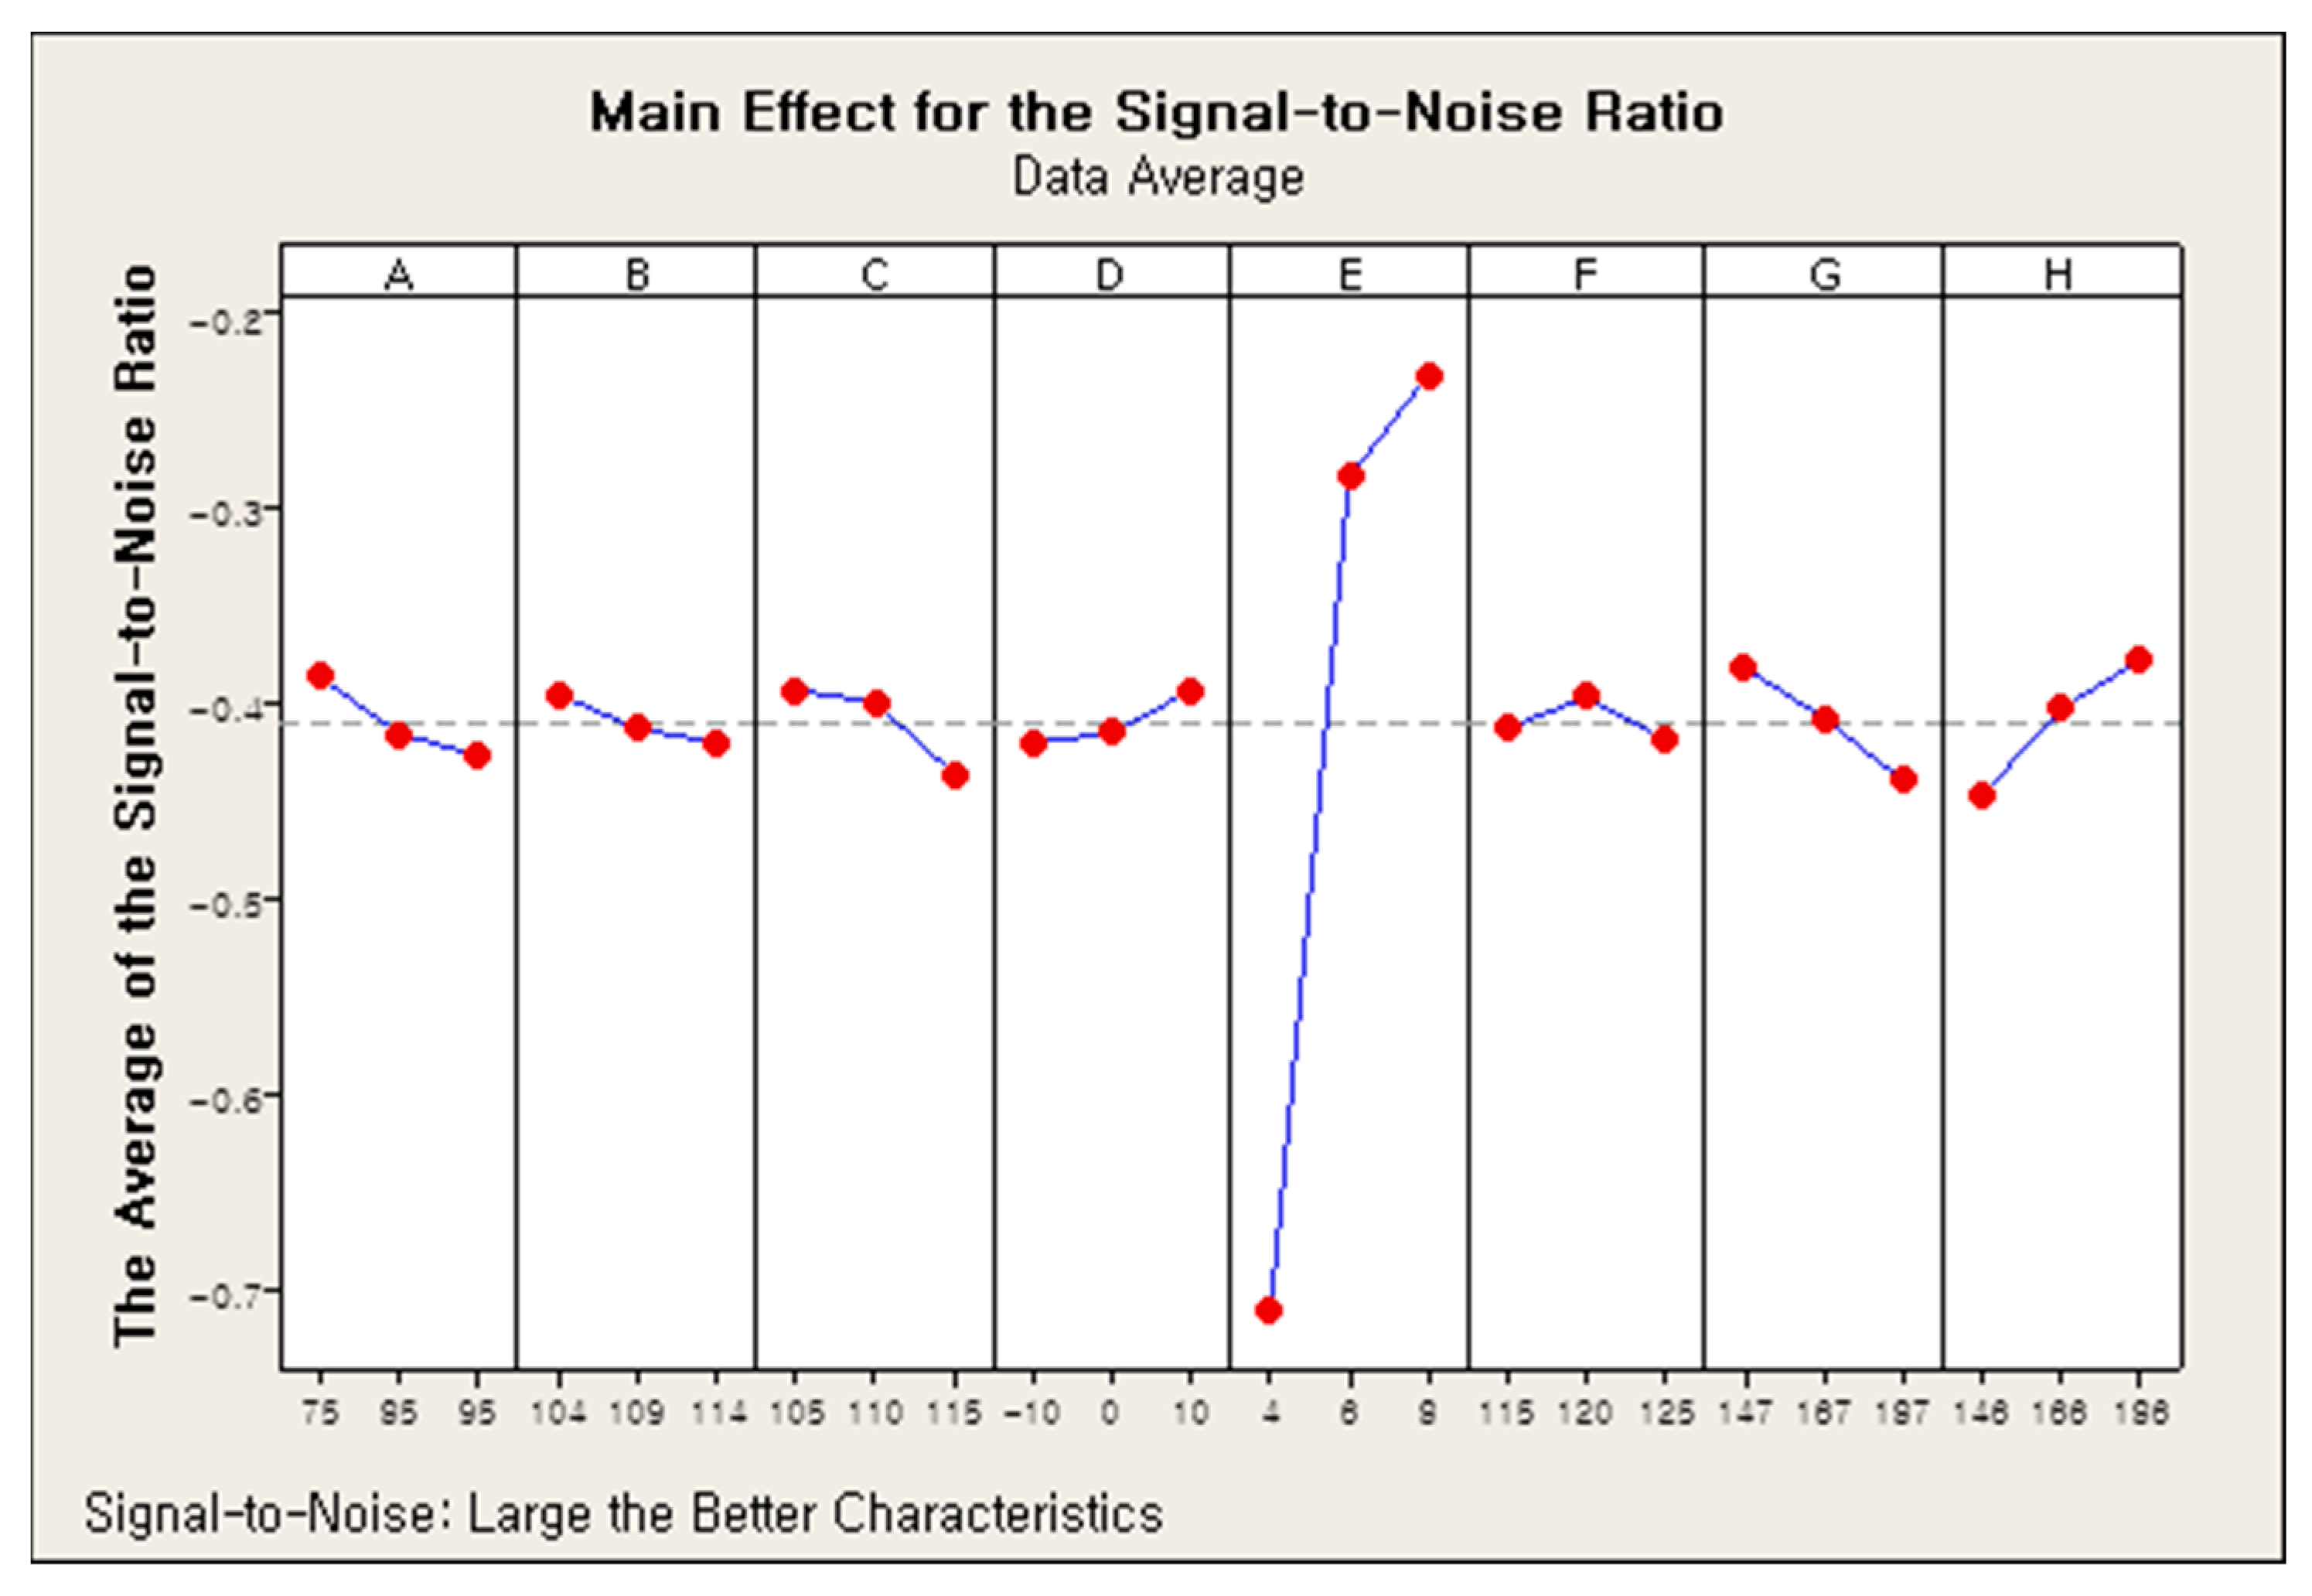
| Level | A | B | C | D | E | F | G | H |
|---|---|---|---|---|---|---|---|---|
| 1 | −0.3858 | −0.3945 | −0.3926 | −0.4197 | −0.7114 | −0.4121 | −0.3814 | −0.4473 |
| 2 | −0.4148 | −0.4126 | −0.3987 | −0.4146 | −0.2835 | −0.3961 | −0.4067 | −0.402 |
| 3 | −0.4261 | −0.4195 | −0.4353 | −0.3924 | −0.2317 | −0.4184 | −0.4385 | −0.3773 |
| Delta | 0.0403 | 0.025 | 0.0426 | 0.0273 | 0.4797 | 0.0222 | 0.0571 | 0.07 |
| Ranking | 5 | 7 | 4 | 6 | 1 | 8 | 3 | 2 |
| Classification | DF | Seq SS | Adj SS | Adj MS | F | p |
|---|---|---|---|---|---|---|
| A | 2 | 0.00779 | 0.00779 | 0.003896 | 1.7 | 0.232 |
| B | 2 | 0.003 | 0.003 | 0.0015 | 0.65 | 0.541 |
| C | 2 | 0.00957 | 0.00957 | 0.004784 | 2.09 | 0.175 |
| D | 2 | 0.00379 | 0.00379 | 0.001894 | 0.83 | 0.466 |
| E | 2 | 1.24757 | 1.24757 | 0.623785 | 272.04 | 0 |
| F | 2 | 0.00237 | 0.00237 | 0.001185 | 0.52 | 0.612 |
| G | 2 | 0.01475 | 0.01475 | 0.007374 | 3.22 | 0.083 |
| H | 2 | 0.02268 | 0.02268 | 0.011342 | 4.95 | 0.032 |
| Residual Error | 10 | 0.02293 | 0.02293 | 0.02293 | ||
| Total | 26 | 1.33445 |
| Level | A | B | C | D | E | F | G | H |
|---|---|---|---|---|---|---|---|---|
| 1 | 0.9588 | 0.9581 | 0.9583 | 0.9557 | 0.9278 | 0.9566 | 0.9591 | 0.9529 |
| 2 | 0.9562 | 0.9563 | 0.9574 | 0.9562 | 0.9684 | 0.9577 | 0.9569 | 0.9573 |
| 3 | 0.9551 | 0.9557 | 0.9542 | 0.9581 | 0.9738 | 0.9558 | 0.9541 | 0.9598 |
| Delta | 0.0037 | 0.0024 | 0.0041 | 0.0023 | 0.0459 | 0.0019 | 0.005 | 0.0068 |
| Ranking | 5 | 6 | 4 | 7 | 1 | 8 | 3 | 2 |
| Classification | DF | Seq SS | Adj SS | Adj MS | F | p |
|---|---|---|---|---|---|---|
| A | 2 | 0.000066 | 0.000066 | 0.000033 | 1.89 | 0.202 |
| B | 2 | 0.000028 | 0.000028 | 0.000014 | 0.8 | 0.478 |
| C | 2 | 0.000084 | 0.000084 | 0.000042 | 2.42 | 0.139 |
| D | 2 | 0.000027 | 0.000027 | 0.000014 | 0.78 | 0.484 |
| E | 2 | 0.011354 | 0.011354 | 0.005677 | 326.16 | 0 |
| F | 2 | 0.000016 | 0.000016 | 0.000008 | 0.47 | 0.64 |
| G | 2 | 0.000113 | 0.000113 | 0.000057 | 3.25 | 0.082 |
| H | 2 | 0.000215 | 0.000215 | 0.000108 | 6.18 | 0.018 |
| Residual Error | 10 | 0.000174 | 0.000174 | 0.000017 | ||
| Total | 26 | 0.012077 |
Disclaimer/Publisher’s Note: The statements, opinions and data contained in all publications are solely those of the individual author(s) and contributor(s) and not of MDPI and/or the editor(s). MDPI and/or the editor(s) disclaim responsibility for any injury to people or property resulting from any ideas, methods, instructions or products referred to in the content. |
© 2023 by the authors. Licensee MDPI, Basel, Switzerland. This article is an open access article distributed under the terms and conditions of the Creative Commons Attribution (CC BY) license (https://creativecommons.org/licenses/by/4.0/).
Share and Cite
Kim, S.; Park, Y.; Yoo, S.; Lim, O.; Samosir, B.F. Development of Machine Learning Algorithms for Application in Major Performance Enhancement in the Selective Catalytic Reduction (SCR) System. Sustainability 2023, 15, 7077. https://doi.org/10.3390/su15097077
Kim S, Park Y, Yoo S, Lim O, Samosir BF. Development of Machine Learning Algorithms for Application in Major Performance Enhancement in the Selective Catalytic Reduction (SCR) System. Sustainability. 2023; 15(9):7077. https://doi.org/10.3390/su15097077
Chicago/Turabian StyleKim, Sunghun, Youngjin Park, Seungbeom Yoo, Ocktaeck Lim, and Bernike Febriana Samosir. 2023. "Development of Machine Learning Algorithms for Application in Major Performance Enhancement in the Selective Catalytic Reduction (SCR) System" Sustainability 15, no. 9: 7077. https://doi.org/10.3390/su15097077