
Effective Deterministic Methodology for Enhanced Distribution Network Performance and Plug-in Electric Vehicles

 ,
,  , and
, and
Abstract
:1. Introduction
1.1. Related Works
1.2. Research Contributions
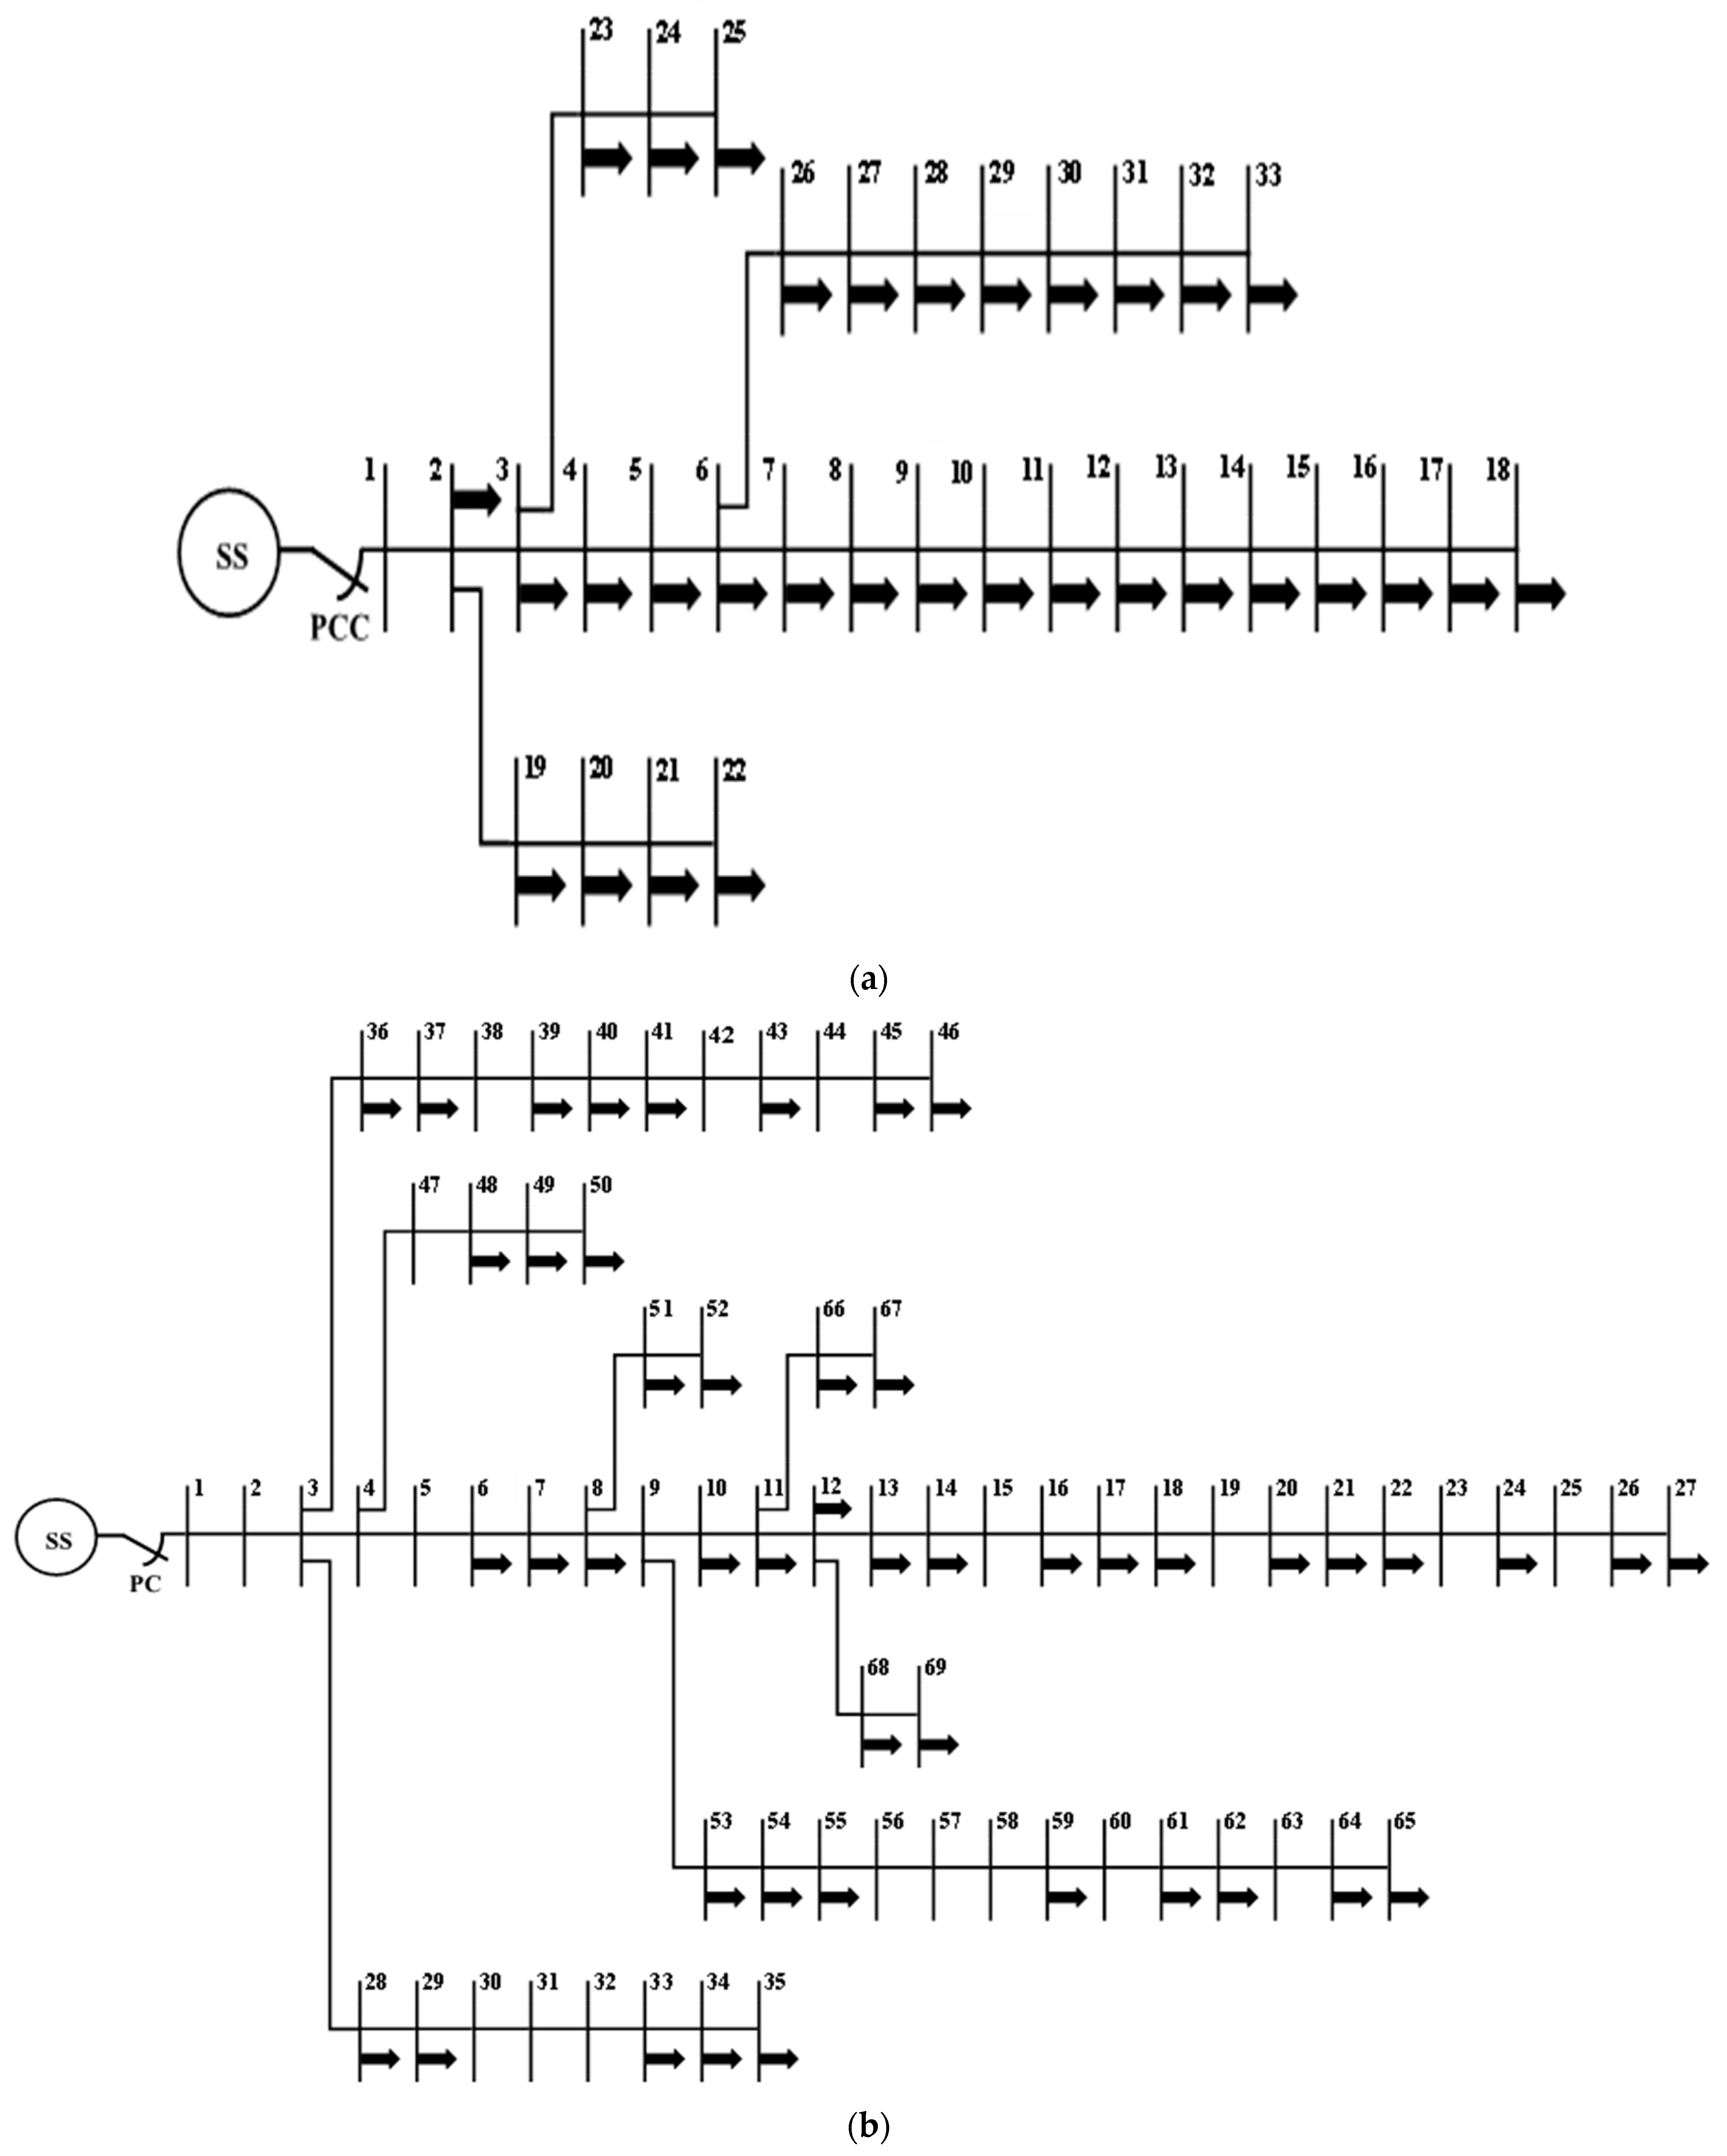
- Development of a deterministic methodology for maximizing the accommodation of PEVs and minimizing power losses in IEEE-33-bus and IEEE-69-bus radial distribution networks;
- Development of a methodology for optimal sizing and location of distributed generation (DG) units with the parallel-operated arithmetic optimization algorithm salp swam algorithm (AOASSA) for minimizing active power losses in PEV integrated IEEE-33-bus and IEEE-69-bus radial distribution networks;
- Development of charging and discharging profiles of PEVs and analysis of optimal charge and discharge ratios of PEVs for achieving the least power losses with different numbers of allocated DG units;
- Comparative analysis of the parallel-operated hybrid arithmetic optimization algorithm salp swam algorithm (AOASSA) against the standard arithmetic optimization algorithm (AOA), the salp swarm optimization algorithm (SSA), the particle swarm optimization algorithm (PSO), and hybrid salp swarm optimization algorithm particle swarm optimization (SSAPSO) on IEEE-33 bus and IEEE-69 bus radial distribution networks (RDNs).
2. Research Methodology
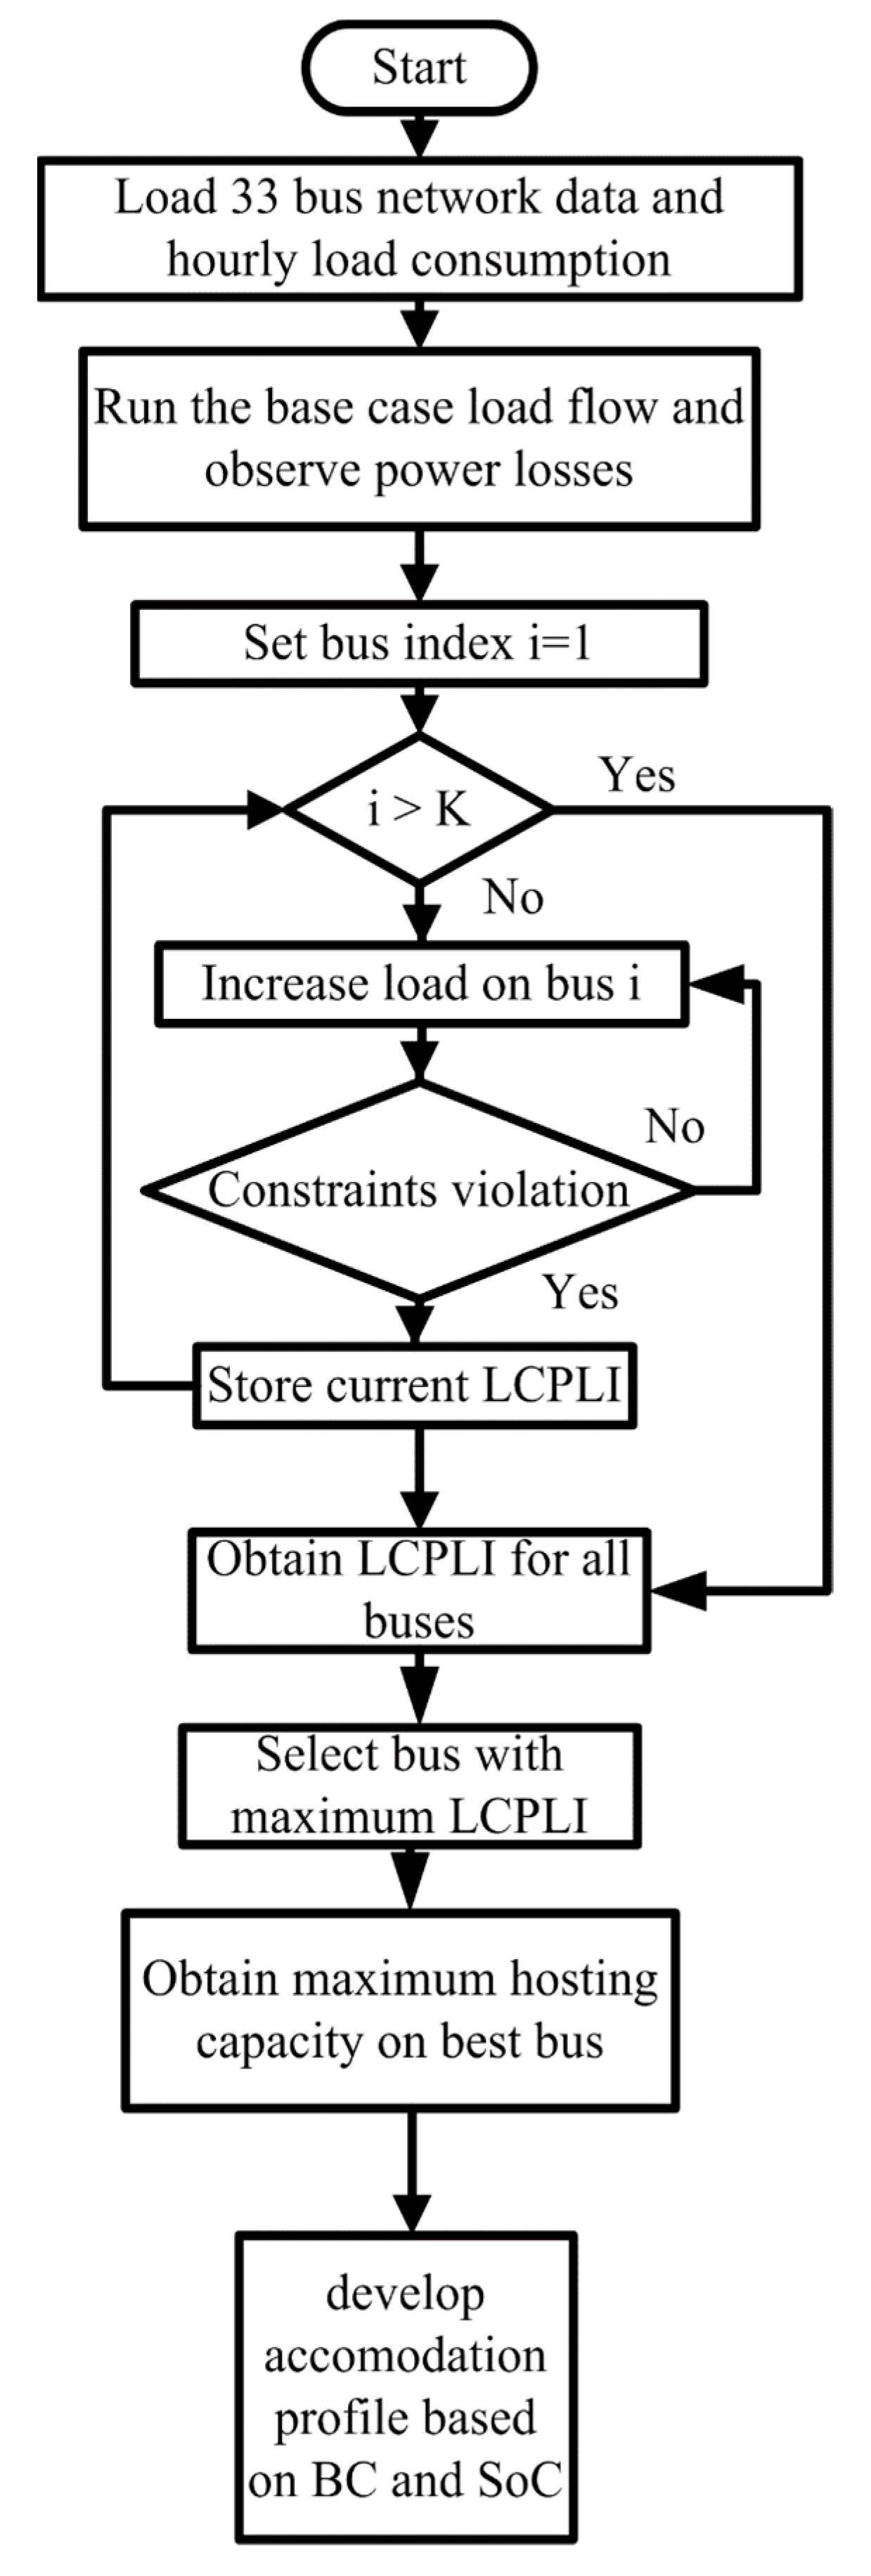
2.1. Stage 1 Maximization of PEV Accommodation on the Best Bus
2.2. Power Loss Minimization with Optimal Allocation of Distributed Generation
2.2.1. Problem Formulation
2.2.2. Network Constraints
2.2.3. Parallel Operated Hybrid Arithmetic Optimization Algorithm Salp Swarm Algorithm
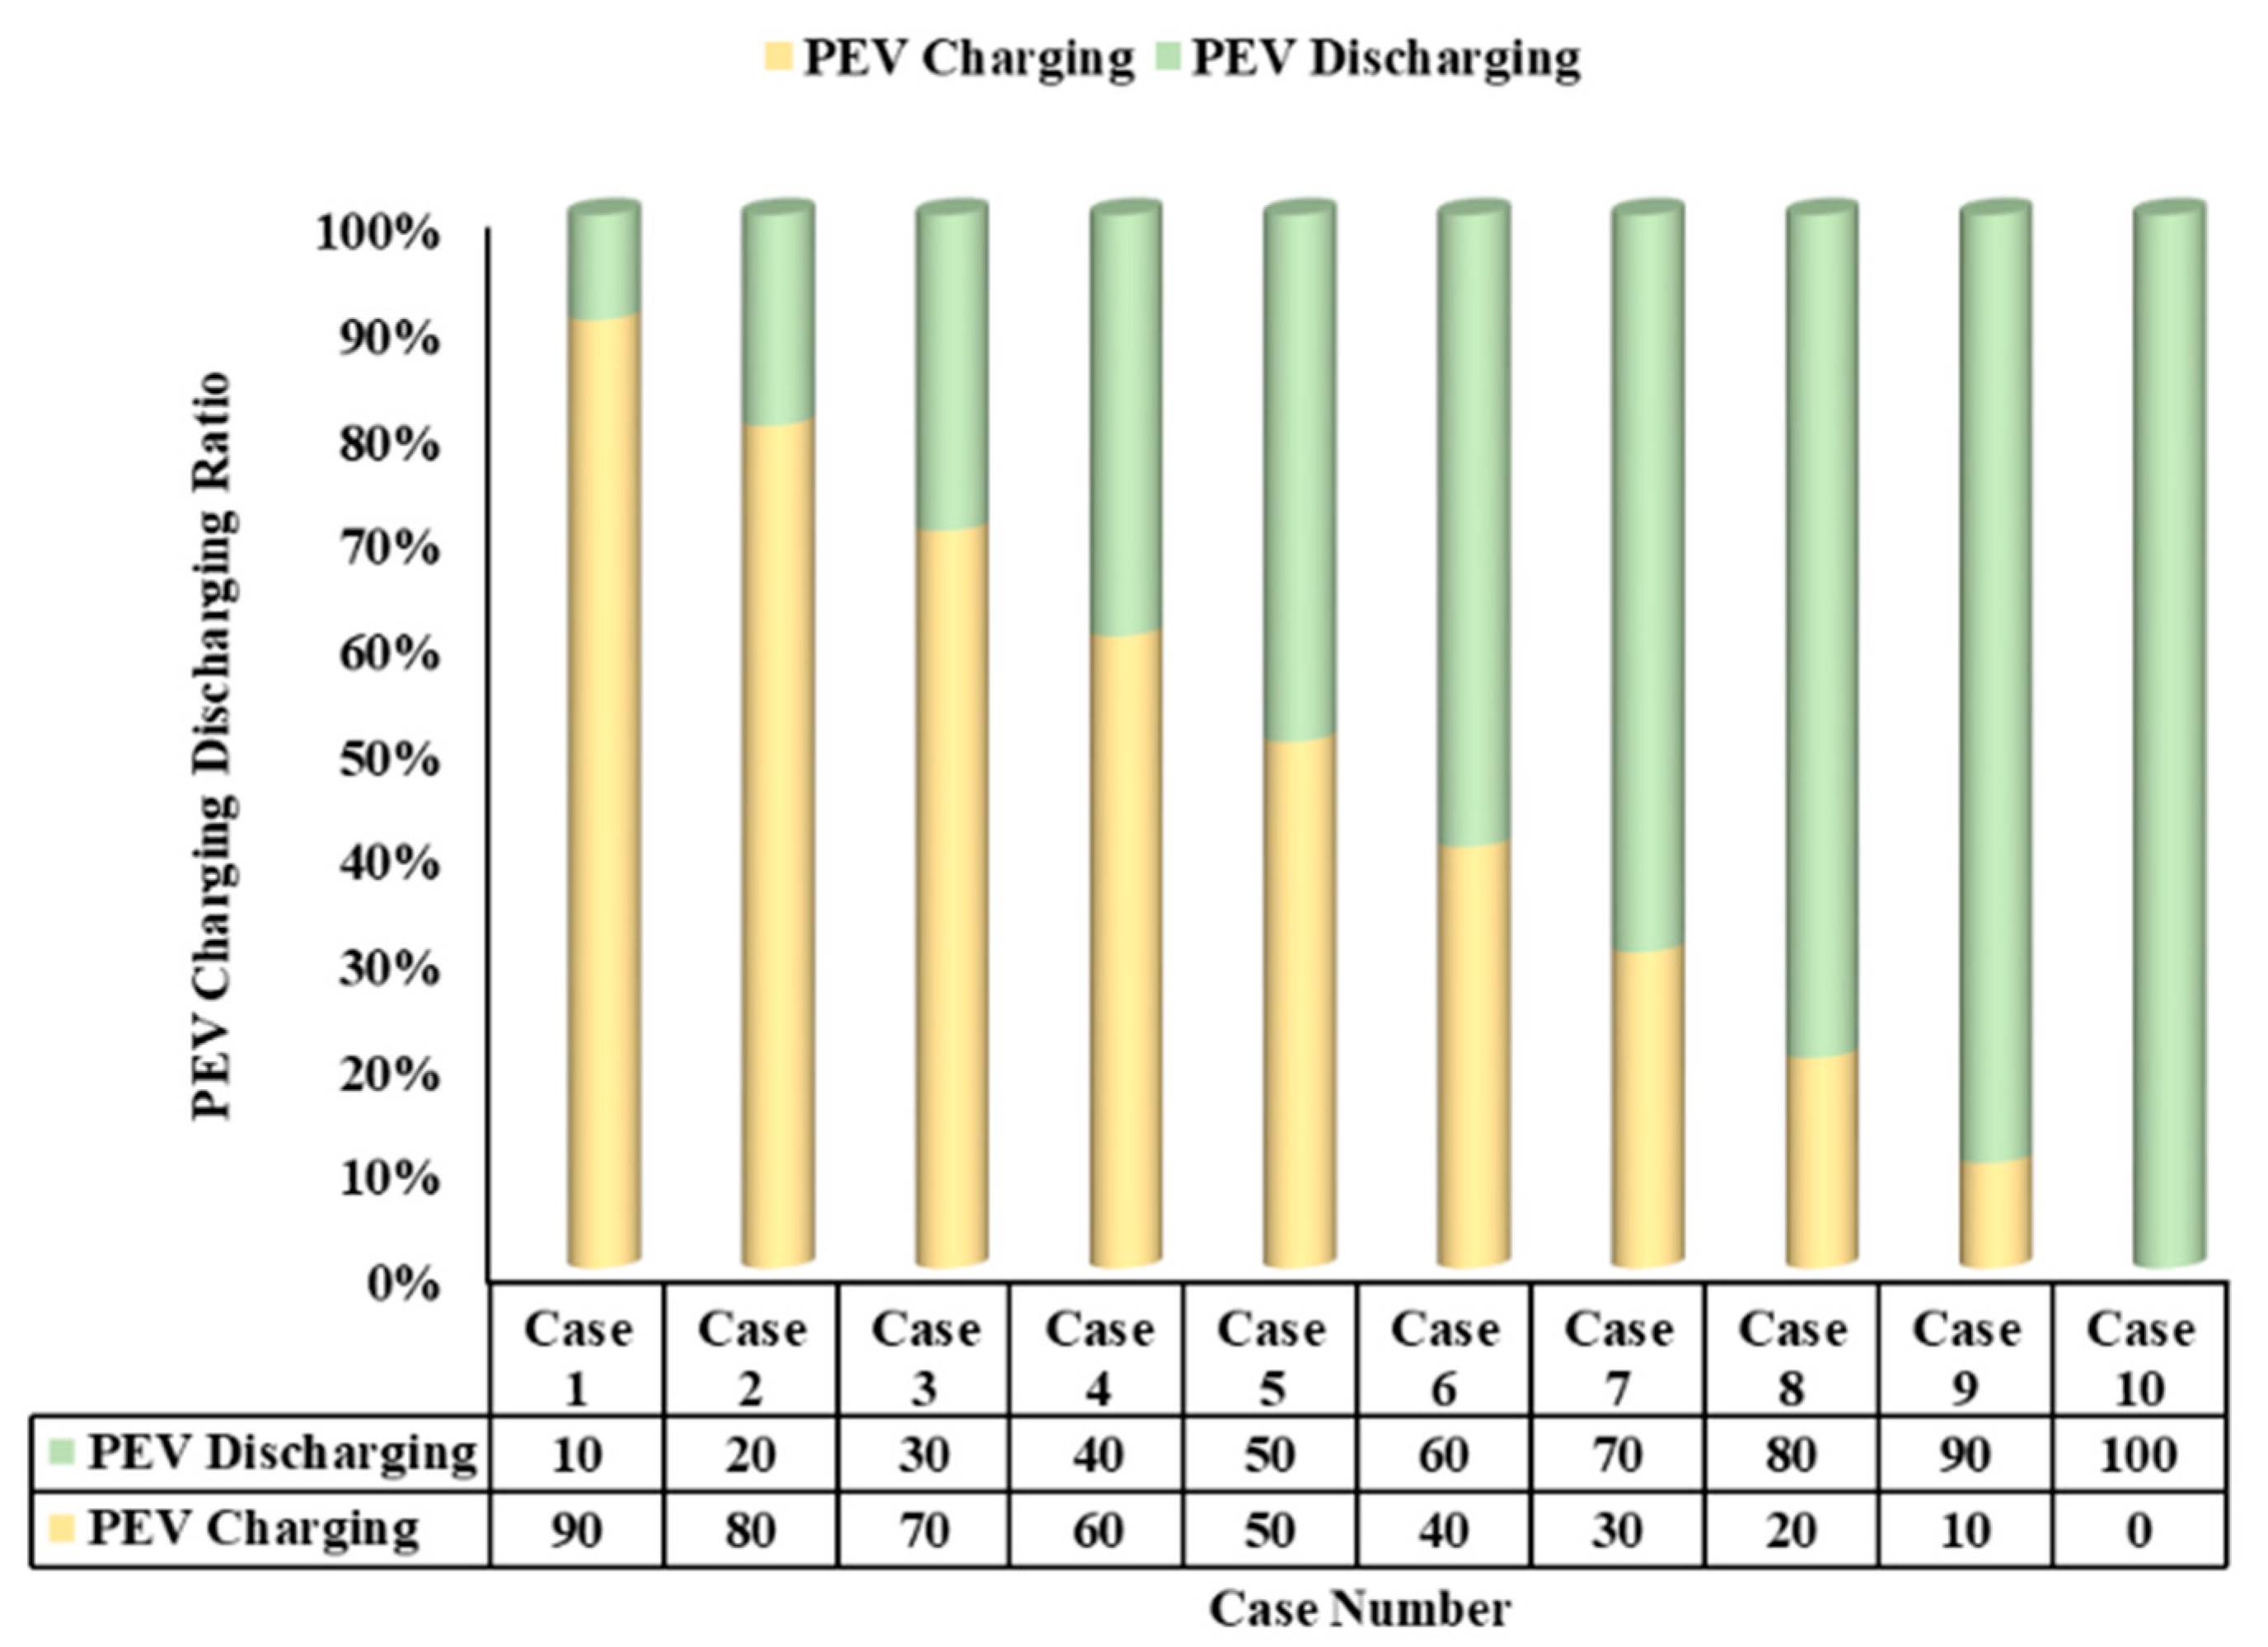
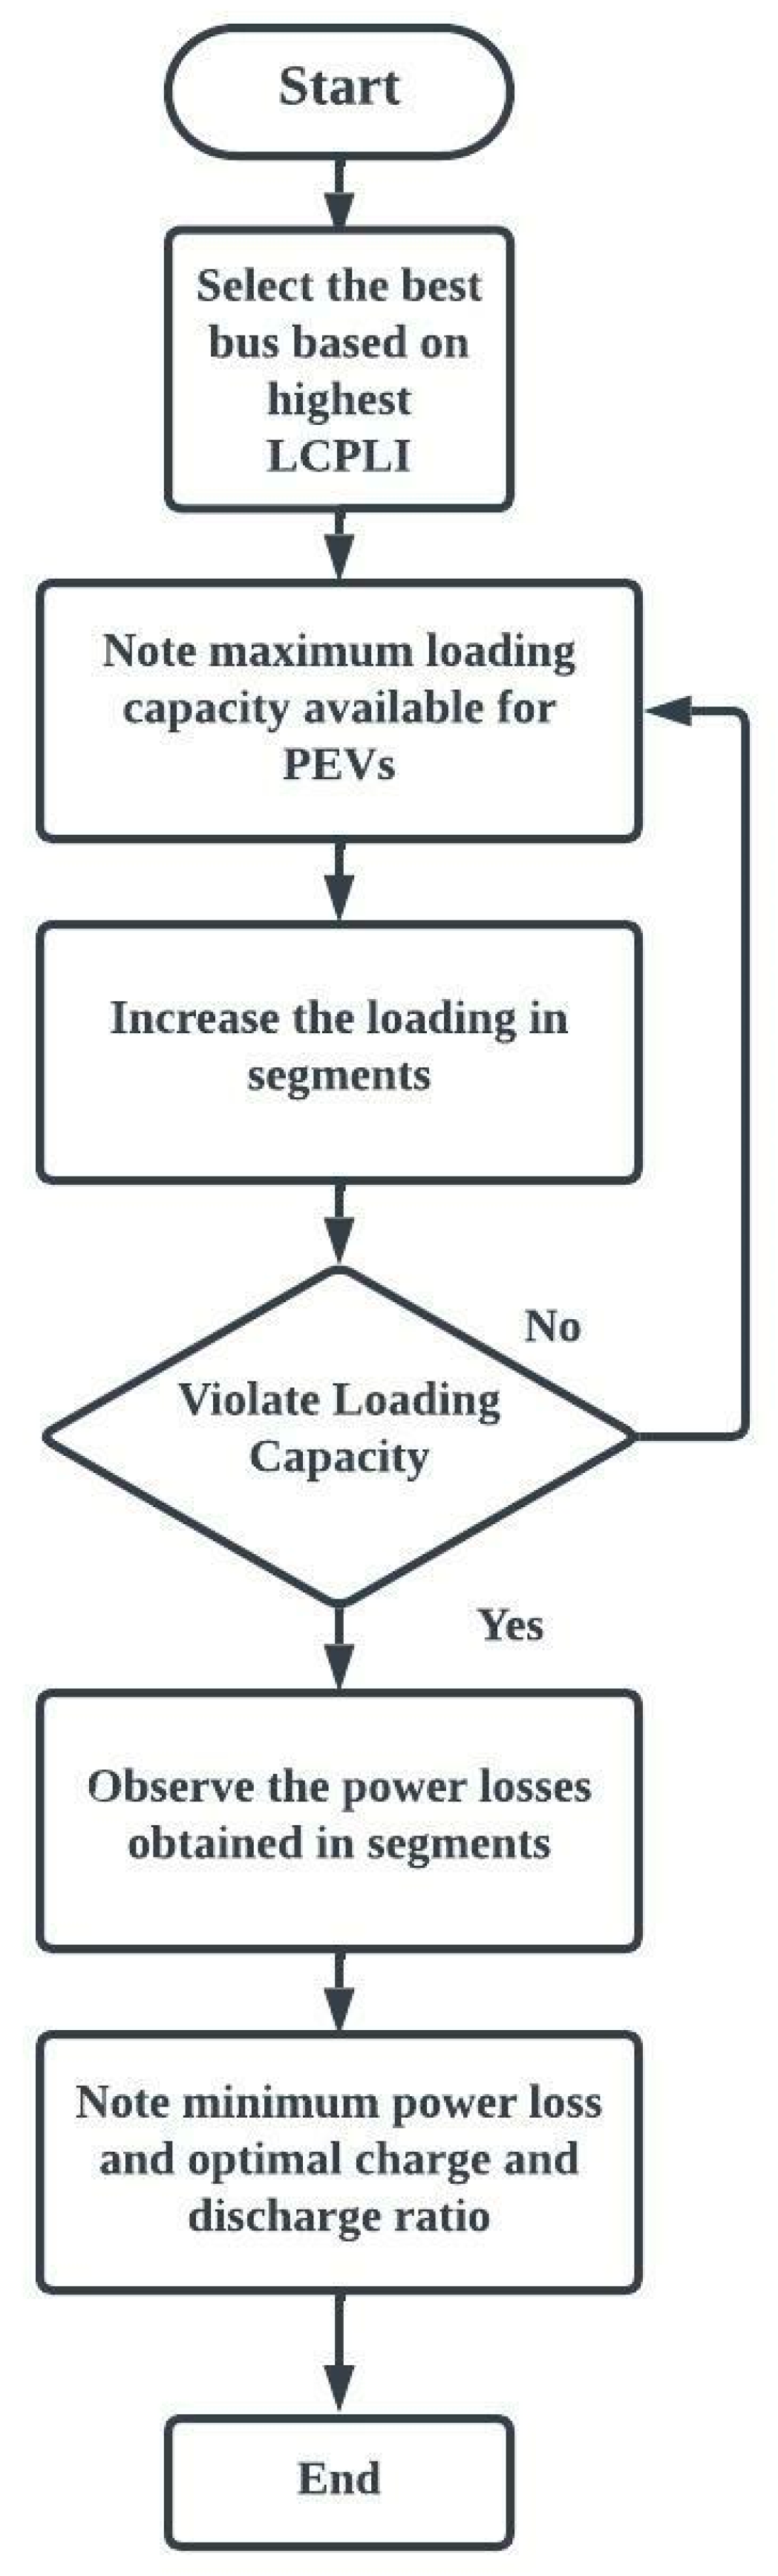
2.3. Stage 3 Optimal Charge and Discharge Ratios for Power Loss Minimization
Proposed Methodology for Optimal Charging and Discharging of PEVs
3. Results and Discussions
3.1. Selection of Best Bus for Accommodating PEVs
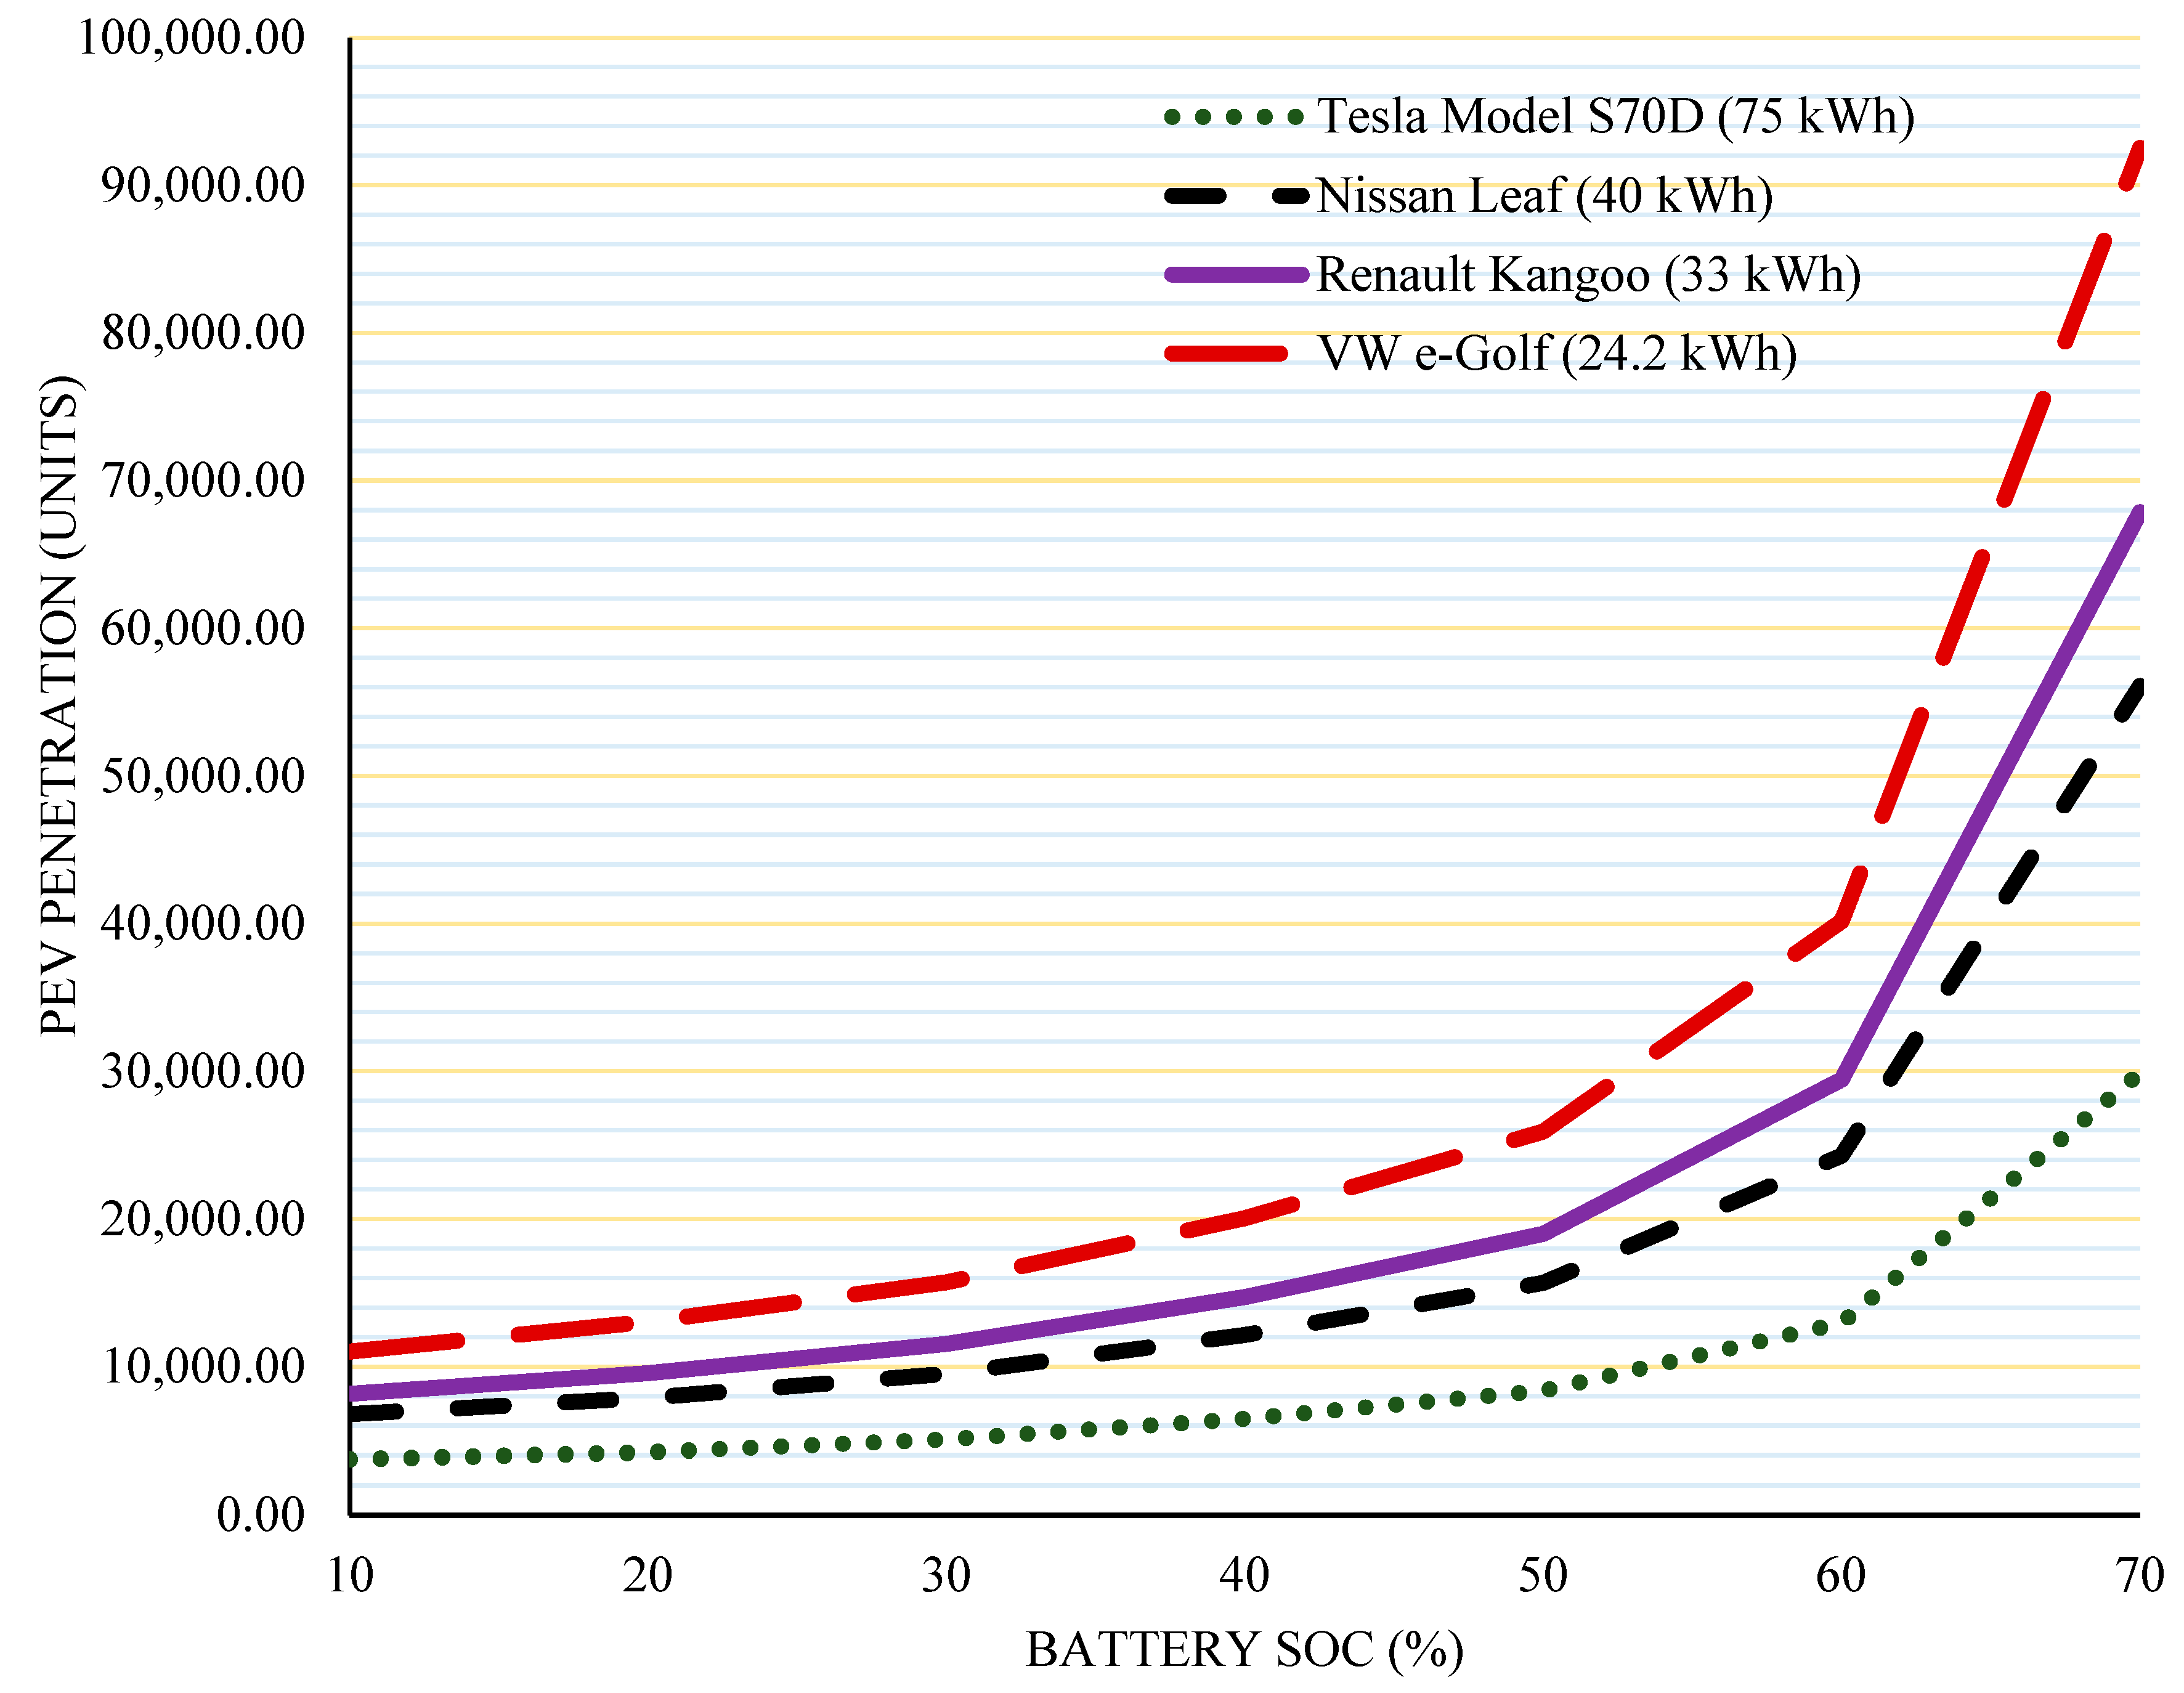
Accommodation Profile of PEVs at Different SoC and Battery Capacity
3.2. Distributed Generation Allocation with Maximum PEV Load on Best Bus Location
3.3. Statistical Characteristics of Proposed AOASSA Algorithm
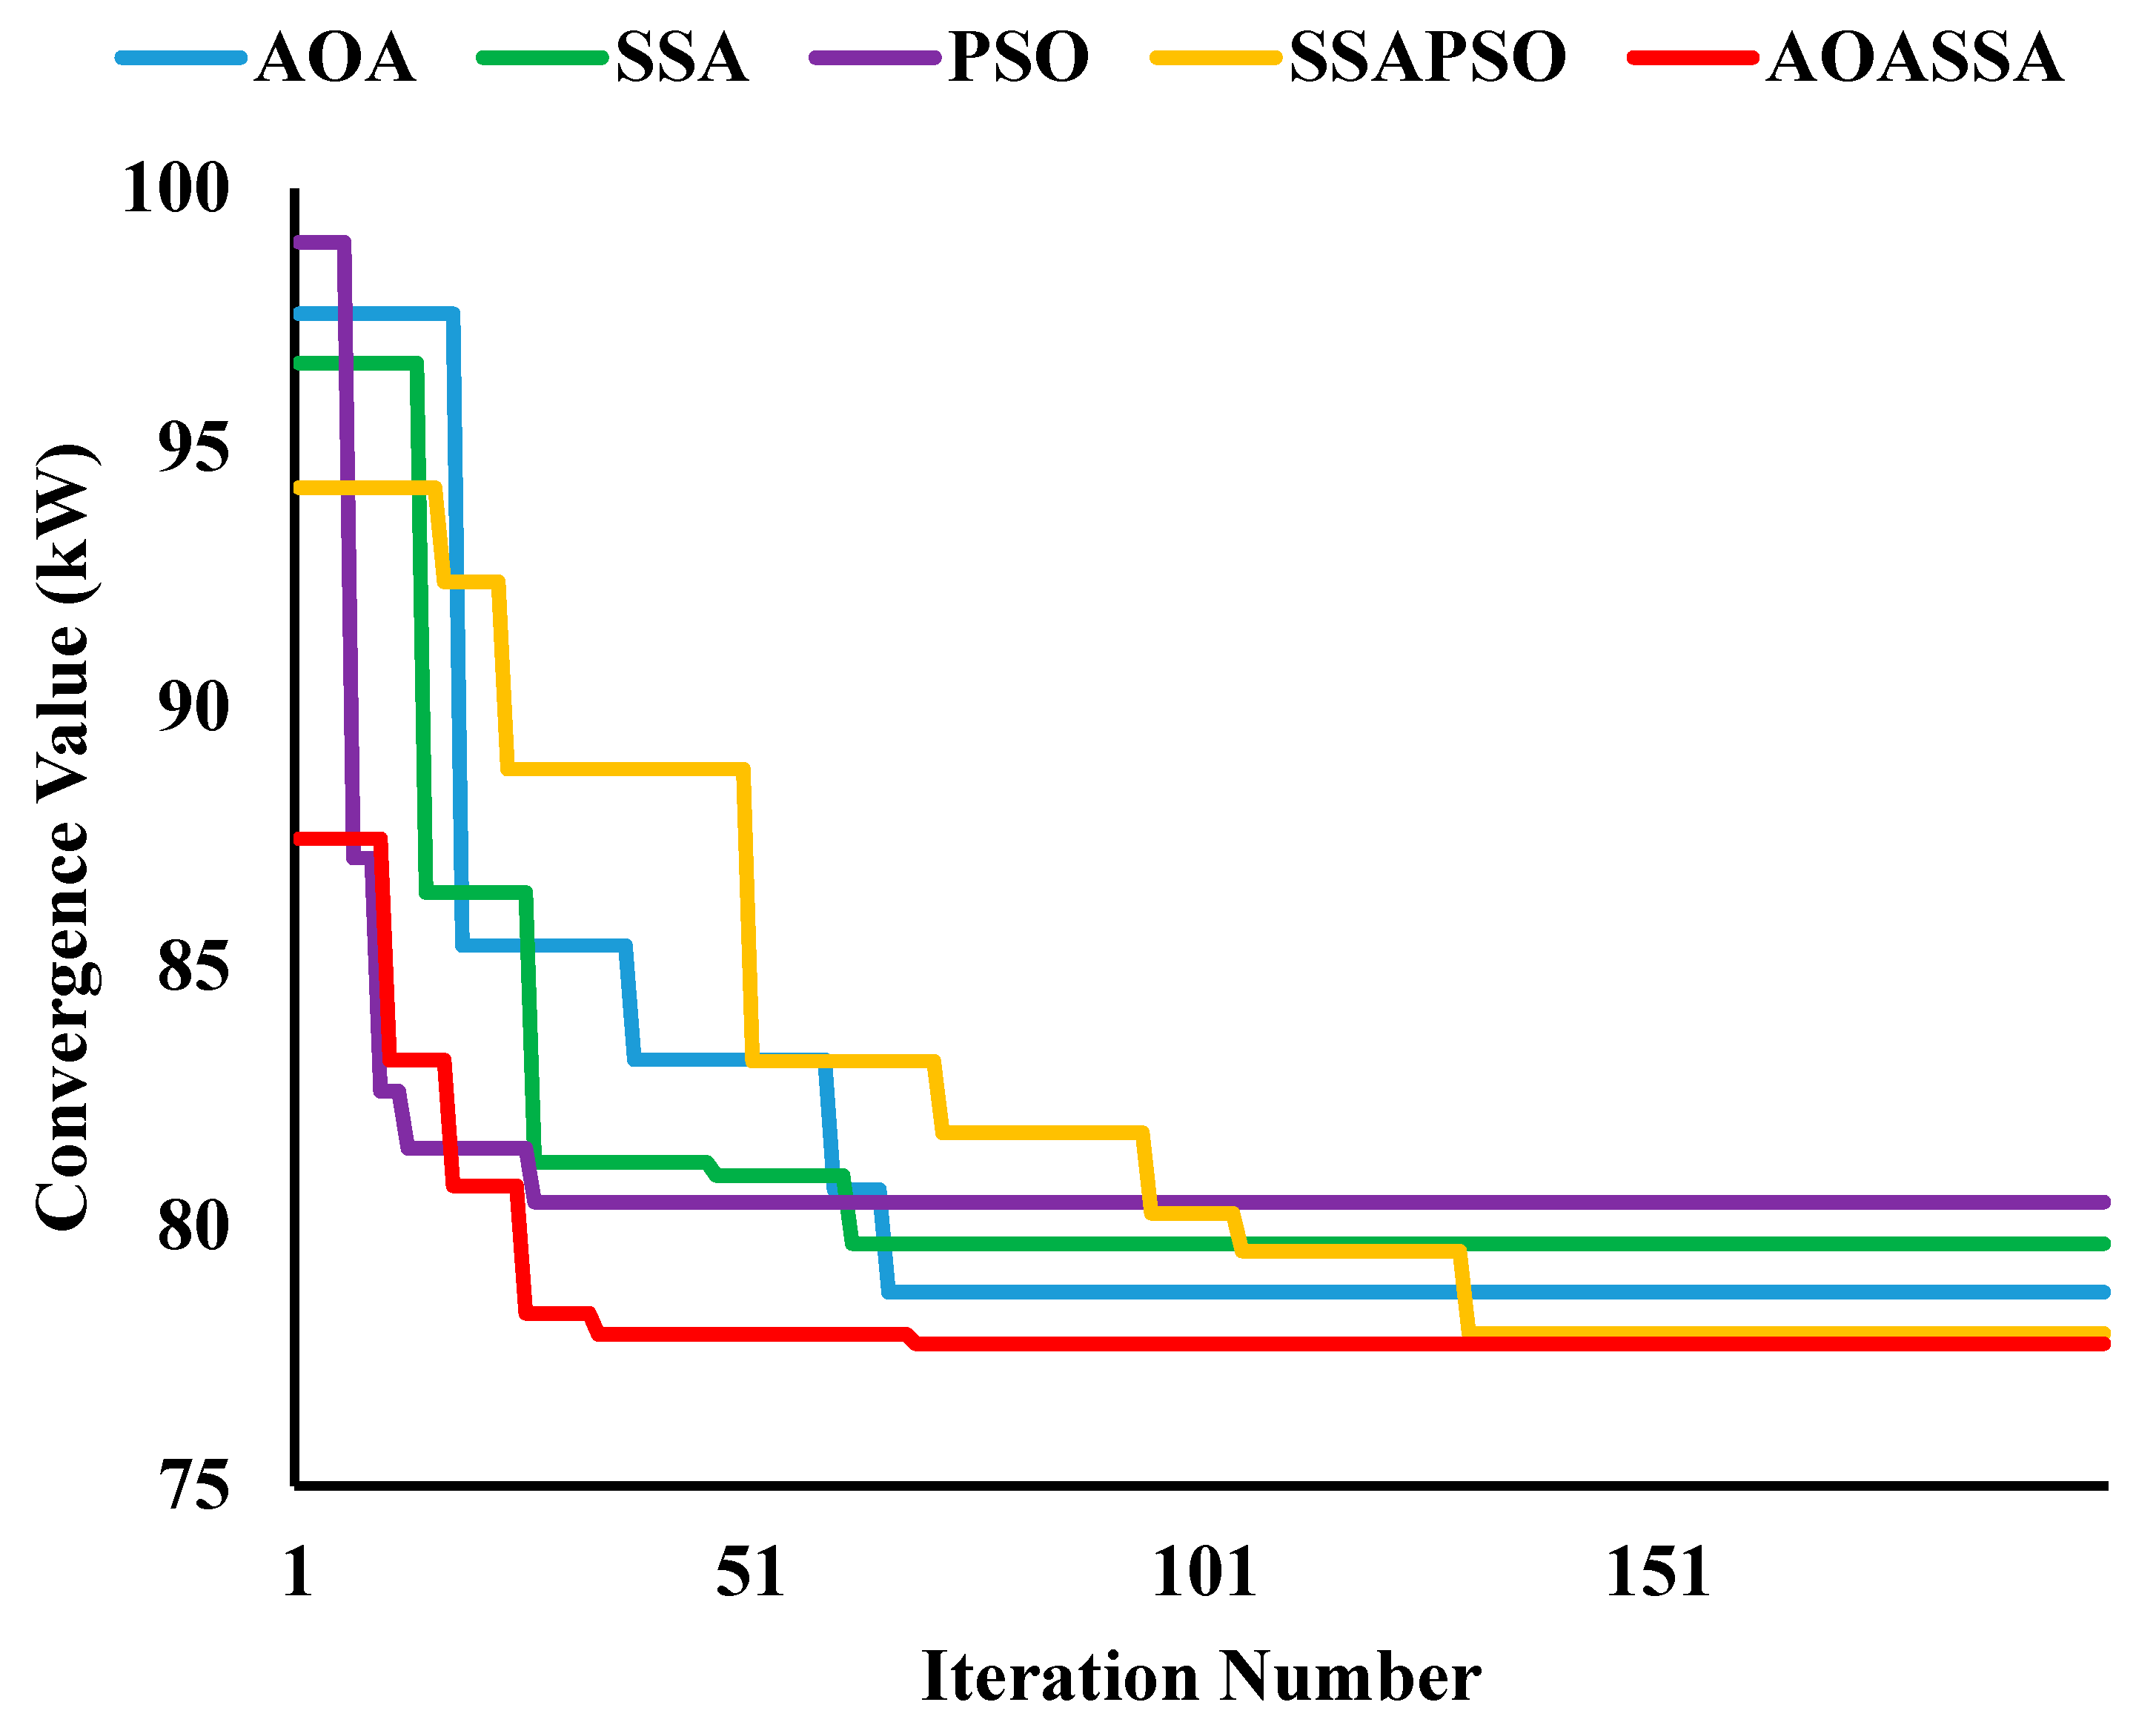
3.4. Convergence Characteristics of Proposed AOASSA Algorithm
3.5. PEV Charge and Discharge Ratio Optimization for Power Loss Reduction
3.5.1. Charge and Discharge Ratio Optimization with One DG Unit Allocation
3.5.2. Charge and Discharge Ratio Optimization with Two DG Unit Allocation
3.5.3. Charge and Discharge Ratio Optimization with Three DG Unit Allocation
3.6. Selection of Best Bus for Accommodating PEVs Based on LCPLI in IEEE69-Bus RDN
Accommodation Profile of PEVs at Different SoC and Battery Capacity in 69-Bus
3.7. Distributed Generation Allocation with Maximum PEV Load on Best Bus Location in IEEE-69-Bus RDN
3.8. Statistical Characteristics of Proposed AOASSA Algorithm
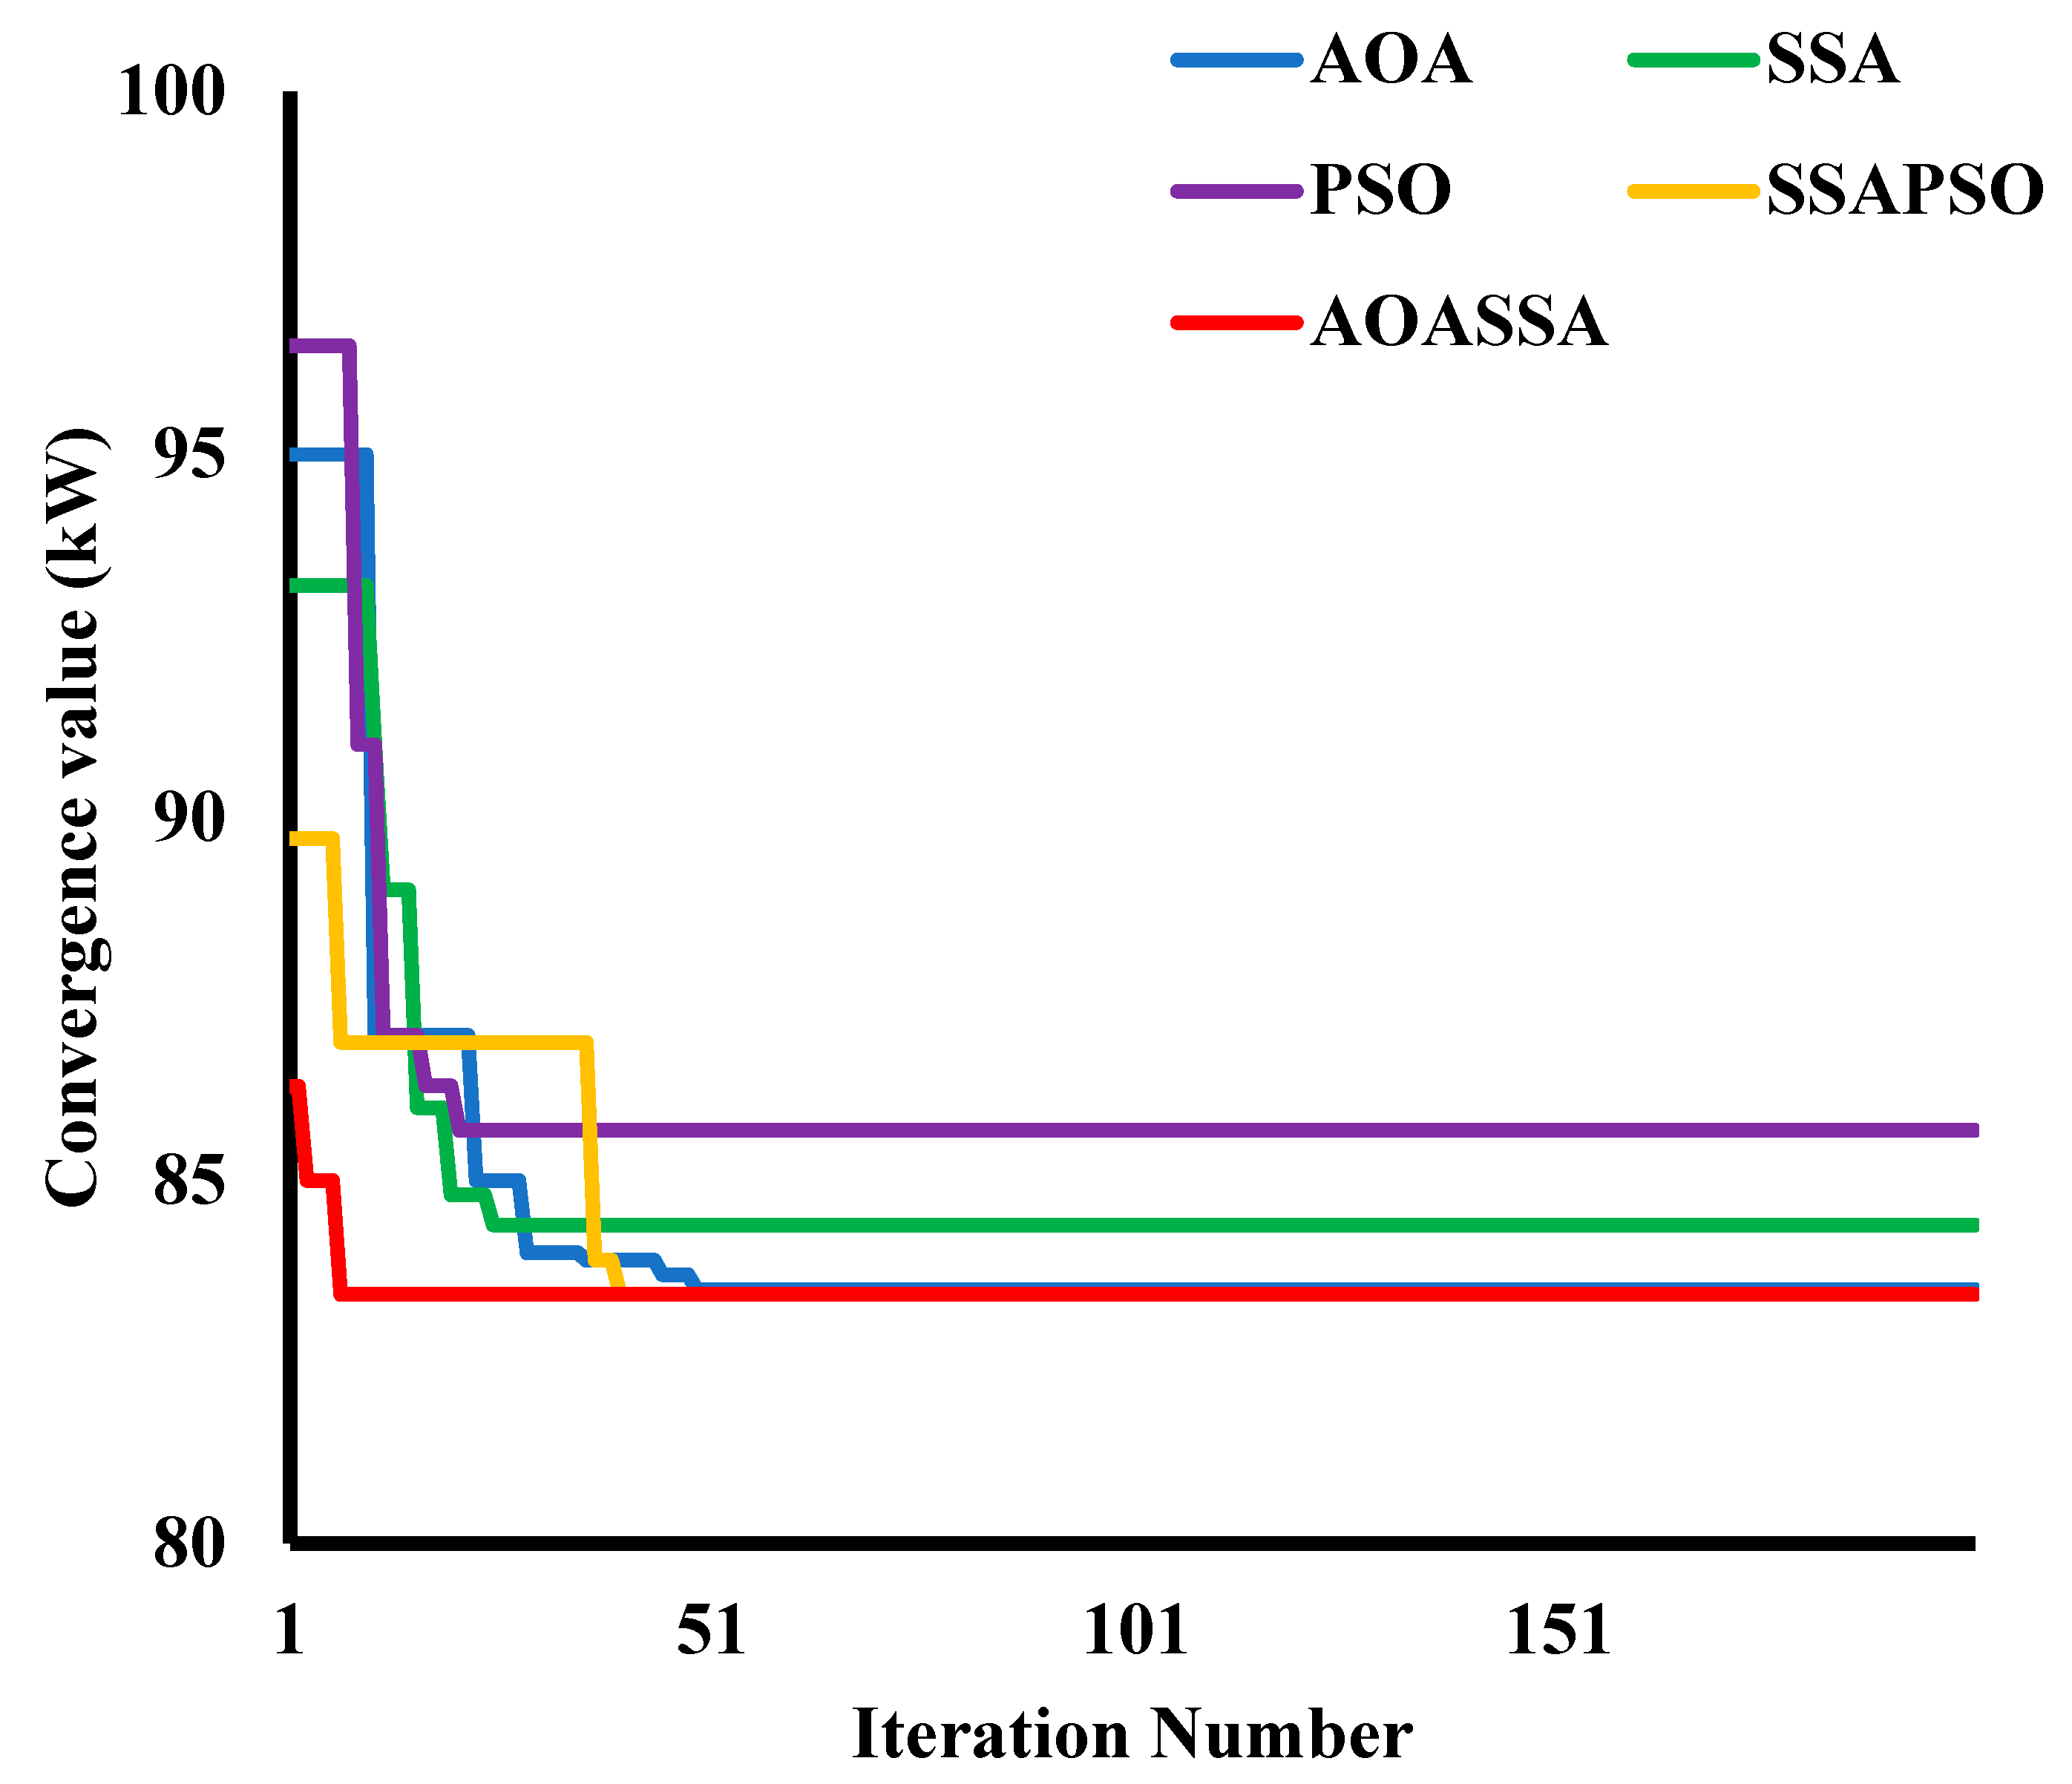
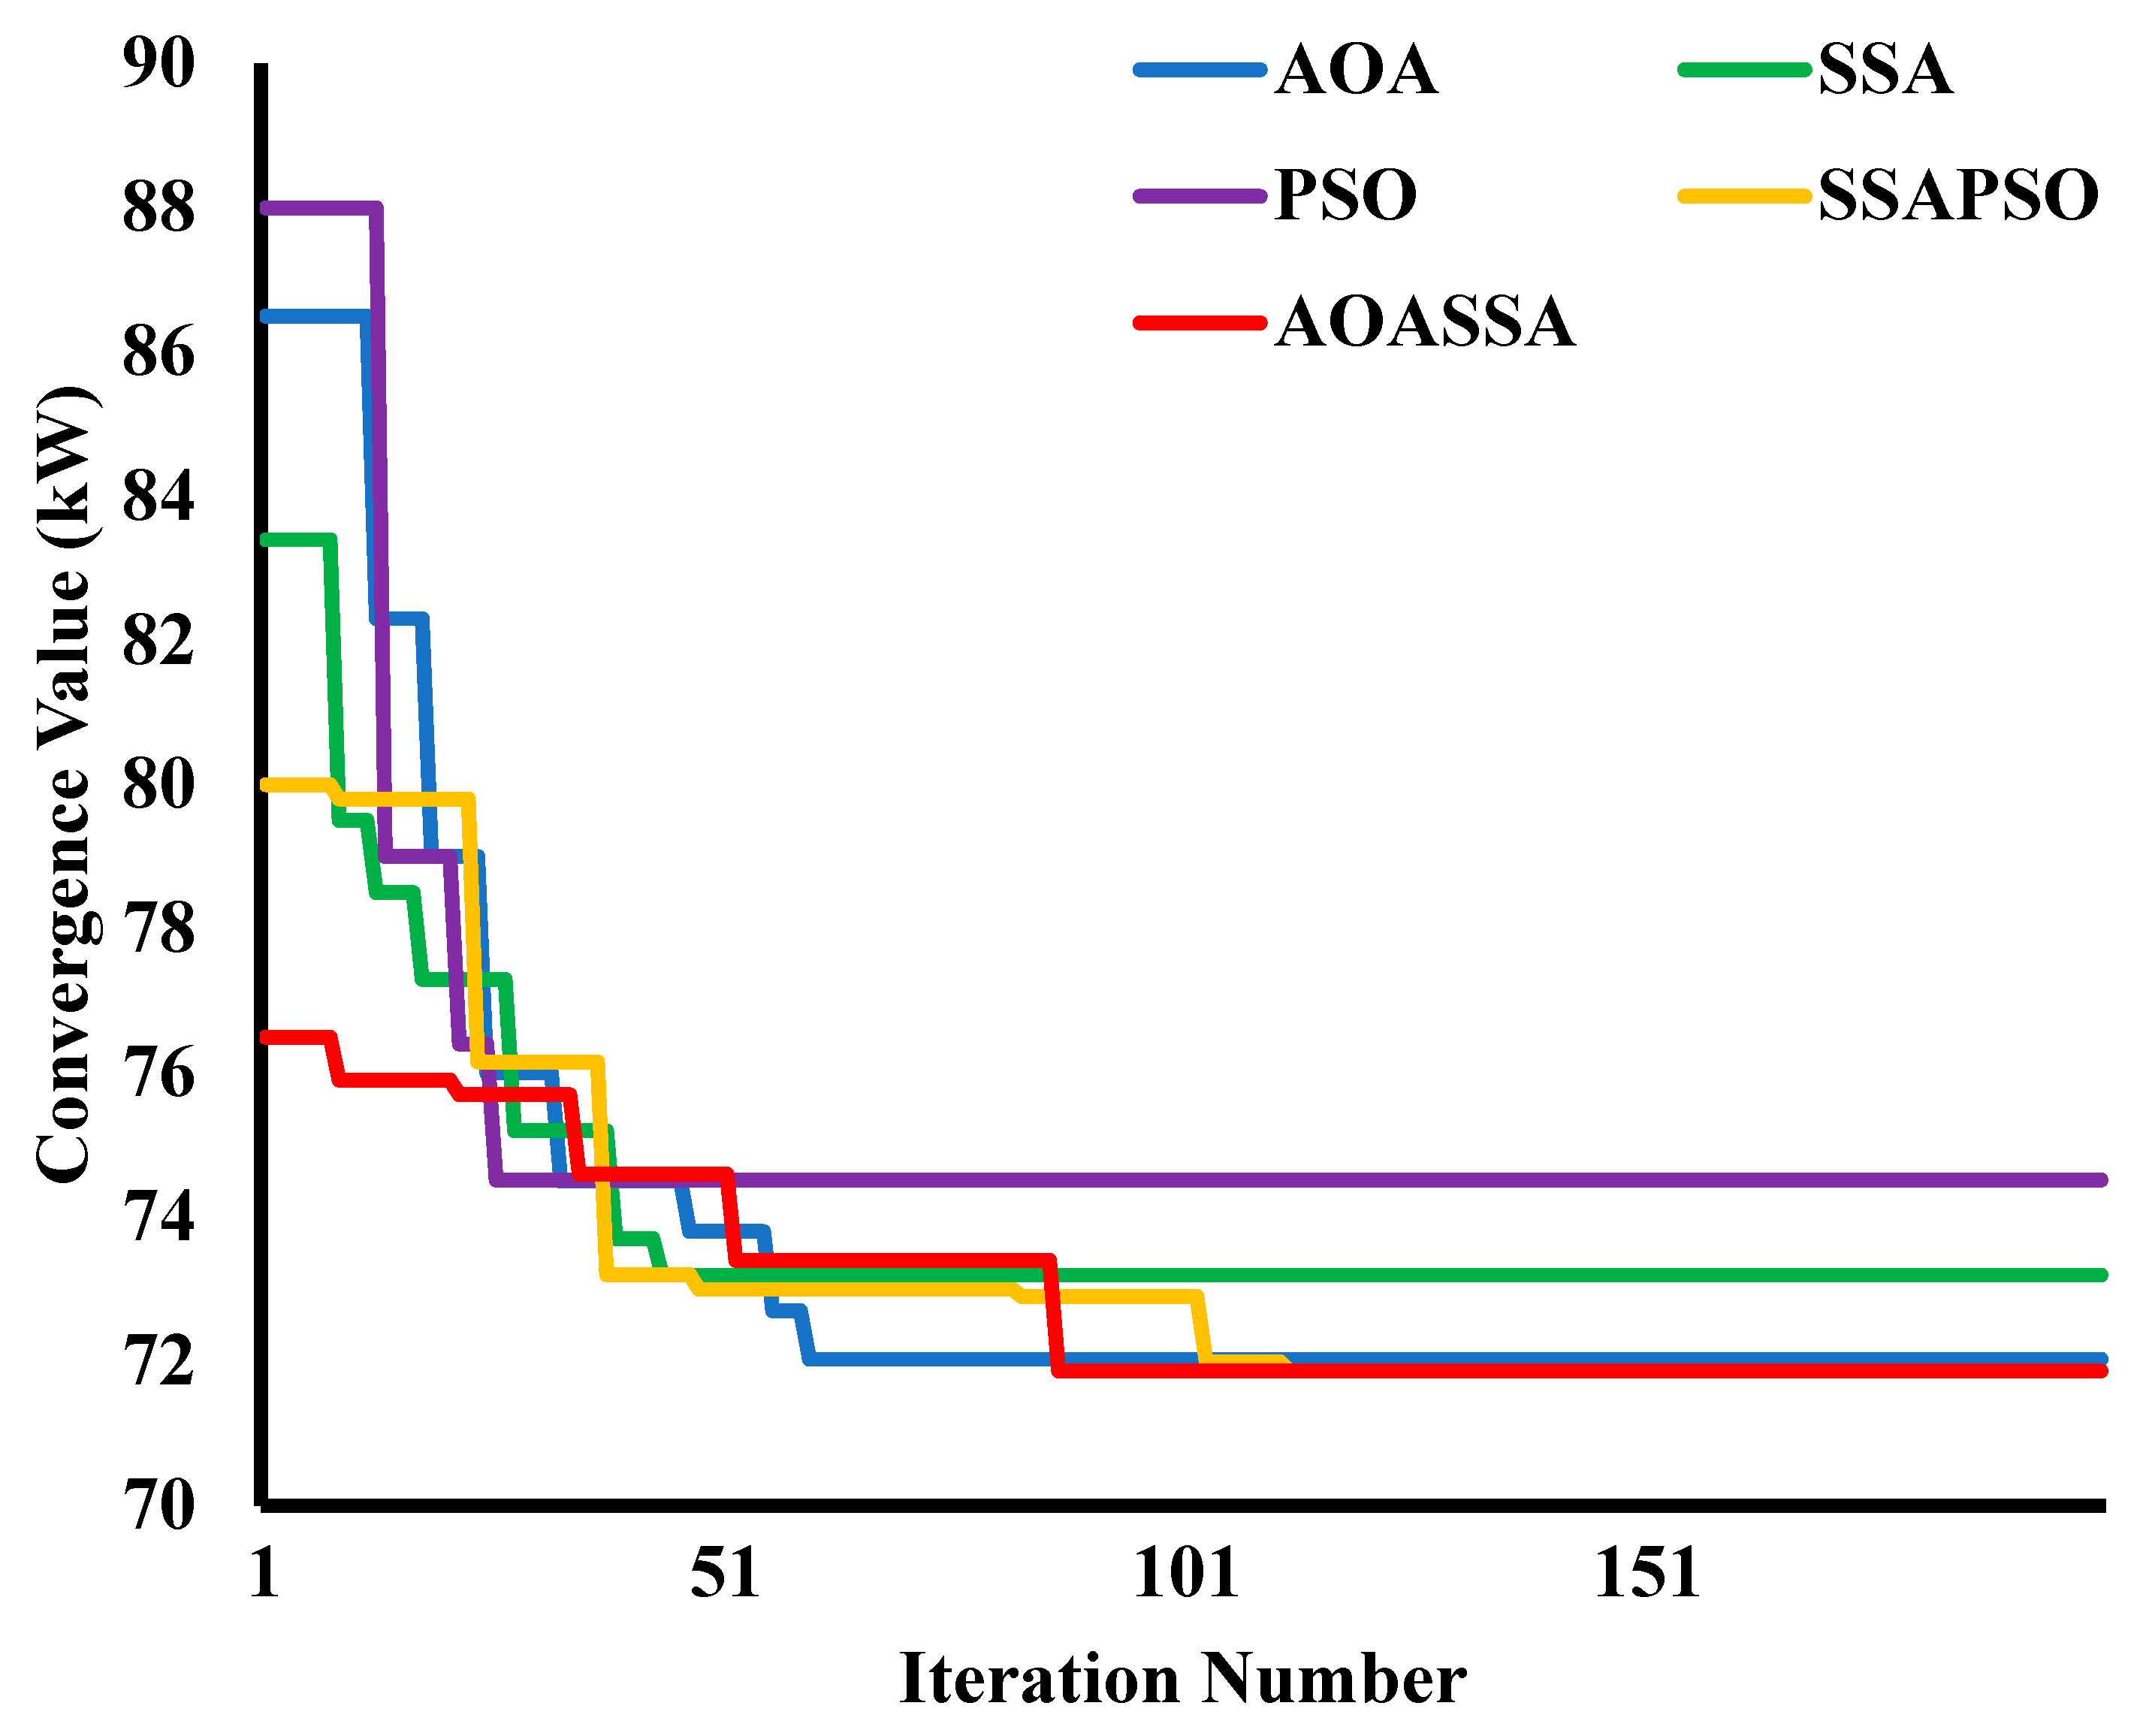
3.9. Convergence Characteristics of Proposed AOASSA Algorithm in IEEE-69 -Bus RDN
3.10. PEV Charge and Discharge Ratio Optimization for Power Loss Reduction in IEEE69-Bus RDN
3.10.1. Charge and Discharge Ratio Optimization with One DG Unit Allocation
3.10.2. Charge Discharge Ratio Optimization with Two DG Unit Allocation
3.10.3. Charge and Discharge Ratio Optimization with Three DG Unit Allocation
4. Conclusions and Future Works
Author Contributions
Funding
Acknowledgments
Conflicts of Interest
References
- Turkdogan, S. Design and optimization of a solely renewable based hybrid energy system for residential electrical load and fuel cell electric vehicle. Eng. Sci. Technol. Int. J. 2021, 24, 397–404. [Google Scholar] [CrossRef]
- Ari, A.; Arregui, N.; Black, S.; Celasun, O.; Iakova, D.; Mineshima, A.; Mylonas, V.; Parry, I.; Teodoru, I.; Zhunussova, K. Surging energy prices in Europe in the aftermath of the war: How to support the vulnerable and speed up the transition away from fossil fuels. IMF Work. Pap. 2022, 152, 1–41. [Google Scholar]
- Bukar, A.L.; Tan, C.W.; Said, D.M.; Dobi, A.M.; Ayop, R.; Alsharif, A. Energy management strategy and capacity planning of an autonomous microgrid: Performance comparison of metaheuristic optimization searching techniques. Renew. Energy Focus 2022, 40, 48–66. [Google Scholar] [CrossRef]
- Bukar, A.L.; Tan, C.W.; Lau, K.Y.; Toh, C.L.; Ayop, R.; Dahiru, A.T. Energy Management Strategy and Capacity Planning of an Autonomous Microgrid: A Comparative Study of Metaheuristic Optimization Searching Techniques. In Proceedings of the 5th IEEE Conf Energy Conversion, CENCON 2021, Virtual, 25–26 October 2021; pp. 190–195. [Google Scholar] [CrossRef]
- Paend, M.; Id, B.; Salam, Z.; Rauf, A.; Id, B.; Ullah, U.; Khan, N.; Anjum, W. Techno-economic modelling of hybrid energy system to overcome the load shedding problem: A case study of Pakistan. PLoS ONE 2022, 17, e0266660. [Google Scholar] [CrossRef]
- Soomro, M.A.; Memon, Z.A.; Kumar, M.; Baloch, M.H. Wind energy integration: Dynamic modeling and control of DFIG based on super twisting fractional order terminal sliding mode controller. Energy Rep. 2021, 7, 6031–6043. [Google Scholar] [CrossRef]
- Khalid, M.; Ahmad, F.; Panigrahi, B.K.; Rahman, H. A capacity efficient power distribution network supported by battery swapping station. Int. J. Energy Res. 2022, 46, 4879–4894. [Google Scholar] [CrossRef]
- Farahmand, M.Z.; Javadi, S.; Sadati, S.M.B.; Laaksonen, H.; Shafie-khah, M. Optimal Operation of Solar Powered Electric Vehicle Parking Lots Considering Different Photovoltaic Technologies. Clean Technol. 2021, 3, 503–518. [Google Scholar] [CrossRef]
- Sultana, U.; Khairuddin, A.; Rasheed, N.; Qazi, S. Allocation of distributed generation and battery switching stations for electric vehicle using whale optimiser algorithm Allocation of distributed generation and battery switching stations for electric vehicle using whale optimiser algorithm. J. Eng. Res. 2018, 6, 70–93. [Google Scholar]
- Rezaei, M.; Moradi, M.H.; Amini, M.H. A simultaneous approach for optimal allocation of renewable energy sources and electric vehicle charging stations in smart grids based on improved GA-PSO algorithm. Sustain. Cities Soc. 2017, 32, 627–637. [Google Scholar]
- Tan, M.; Ates, Y.; Erdinc, O.; Gokalp, E.; Catalão, J.P.S. Effect of electric vehicle parking lots equipped with roof mounted photovoltaic panels on the distribution network. Electr. Power Energy Syst. 2019, 109, 283–289. [Google Scholar]
- Amjad, M.; Ahmad, A.; Ahmed, M.; Hussain, T.U. A review of EVs charging: From the perspective of energy optimization, optimization approaches, and charging techniques. Transp. Res. Part D 2018, 62, 386–417. [Google Scholar] [CrossRef]
- Said, D.; Mouftah, H.T. A Novel Electric Vehicles Charging/Discharging Management Protocol Based on Queuing Model. IEEE Trans. Intell. Veh. 2020, 5, 100–111. [Google Scholar] [CrossRef]
- Gil-González, W.; Garces, A.; Montoya, O.D.; Hernández, J.C. A mixed-integer convex model for the optimal placement and sizing of distributed generators in power distribution networks. Appl. Sci. 2021, 11, 627. [Google Scholar] [CrossRef]
- El-Khattam, W.; Salama, M.M.A. Distributed generation technologies, definitions and benefits. Electr. Power Syst. Res. 2004, 71, 119–128. [Google Scholar] [CrossRef]
- Ackermann, T.; Andersson, G.; Söder, L. Distributed generation: A definition. Electr. Power Syst. Res. 2001, 57, 195–204. [Google Scholar] [CrossRef]
- Pepermans, G.; Driesen, J.; Haeseldonckx, D.; Belmans, R.; D’haeseleer, W. Distributed generation: Definition, benefits and issues. Energy Policy 2005, 33, 787–798. [Google Scholar] [CrossRef]
- Himabindu, N.; Hampannavar, S.; Deepa, B.; Swapna, M. Analysis of microgrid integrated Photovoltaic (PV) Powered Electric Vehicle Charging Stations (EVCS) under different solar irradiation conditions in India: A way towards sustainable development and growth. Energy Rep. 2021, 7, 8534–8547. [Google Scholar] [CrossRef]
- Zeng, B.; Zhu, Z.; Zhu, X.; Qin, L.; Liu, J.; Zhang, M. Estimation of Distribution System Capability for Accommodating Electric Vehicles. J. Electr. Syst. 2020, 16, 131–141. [Google Scholar]
- Said, D. A Survey on Information Communication Technologies in Modern Demand Side Management for Smart Grids: Challenges, Solutions, and Opportunities. IEEE Eng. Manag. Rev. 2022, 51, 76–107. [Google Scholar] [CrossRef]
- Kongjeen, Y.; Bhumkittipich, K.; Mithulananthan, N. Optimal DG sizing and location in modern power grids using PEVs load demand probability. Trans. Electr. Eng. Electron. Commun. 2019, 17, 51–59. [Google Scholar] [CrossRef]
- Tang, H.; Wu, J. Multi-objective coordination optimisation method for DGs and EVs in distribution networks. Arch. Electr. Eng. 2019, 68, 15–32. [Google Scholar] [CrossRef]
- Fazelpour, F.; Vafaeipour, M.; Rahbari, O.; Rosen, M.A. Intelligent optimization of charge allocation for plug-in hybrid electric vehicles utilizing renewable energy considering grid characteristics. In Proceedings of the 2013 IEEE International Conference on Smart Energy Grid Engineering (SEGE), Oshawa, ON, Canada, 28–30 August 2013; pp. 28–30. [Google Scholar] [CrossRef]
- Ahmad, F.; Khalid, M.; Panigrahi, B.K. An enhanced approach to optimally place the solar powered electric vehicle charging station in distribution network. J. Energy Storage 2021, 42, 103090. [Google Scholar] [CrossRef]
- Deng, Q.; Feng, C.; Wen, F.; Tseng, C.-L.; Wang, L.; Zou, B.; Zhang, X. Evaluation of Accommodation Capability for Electric Vehicles of a Distribution System Considering Coordinated Charging Strategies. Energies 2019, 12, 3056. [Google Scholar] [CrossRef]
- Chiodo, E.; Fantauzzi, M.; Lauria, D.; Mottola, F. A Probabilistic Approach for the Optimal Sizing of Storage Devices to Increase the Penetration of Plug-in Electric Vehicles in Direct Current Networks. Energies 2018, 11, 1238. [Google Scholar] [CrossRef]
- Amini, M.H.; Parsa, M.; Karabasoglu, O. Simultaneous allocation of electric vehicles’ parking lots and distributed renewable resources in smart power distribution networks. Sustain. Cities Soc. 2017, 28, 332–342. [Google Scholar] [CrossRef]
- Shaaban, M.F.; Member, S.; Atwa, Y.M.; Member, S.; El-saadany, E.F.; Member, S. PEVs Modeling and Impacts Mitigation in Distribution Networks. IEEE Trans. Power Syst. 2013, 28, 1122–1131. [Google Scholar] [CrossRef]
- Memon, Z.A.; Hassan, M.Y.; Said, D.M.; Leghari, Z.H.; Shaikh, P.H. A Systematic Approach to Accommodate Plug-in Electric Vehicles in Distribution Networks with Optimal Integration of Distributed Generation. In Proceedings of the 6th International Conference on Electrical, Control and Computer Engineering, Pahang, Malaysia, 23 August 2022; pp. 339–352. [Google Scholar] [CrossRef]
- Leemput, N.; Geth, F.; Van Roy, J.; Büscher, J.; Driesen, J. Sustainable Energy, Grids and Networks Reactive power support in residential LV distribution grids through electric vehicle charging. Sustain. Energy Grids Netw. 2015, 3, 24–35. [Google Scholar] [CrossRef]
- Zhao, J.; Wang, J.; Xu, Z.; Wang, C.; Wan, C.; Chen, C. Distribution Network Electric Vehicle Hosting Capacity Maximization: A Chargeable Region Optimization Model. IEEE Trans. Power Syst. 2017, 32, 4119–4130. [Google Scholar] [CrossRef]
- Avila-Rojas, A.E.; De Oliveira-De Jesus, P.M.; Alvarez, M. Distribution network electric vehicle hosting capacity enhancement using an optimal power flow formulation. Electr. Eng. 2022, 104, 1337–1348. [Google Scholar] [CrossRef]
- Zuluaga-Ríos, C.D.; Villa-Jaramillo, A.; Saldarriaga-Zuluaga, S.D. Evaluation of Distributed Generation and Electric Vehicles Hosting Capacity in Islanded DC Grids Considering EV Uncertainty. Energies 2022, 15, 7646. [Google Scholar] [CrossRef]
- Bin Humayd, A.S.; Bhattacharya, K. Assessment of distribution system margins to accommodate the penetration of plug-in electric vehicles. In Proceedings of the 2015 IEEE Transportation Electrification Conference and Expo (ITEC), Dearborn, MI, USA, 14–17 June 2015; pp. 1–6. [Google Scholar] [CrossRef]
- Zárate-Miñano, R.; Flores Burgos, A.; Carrión, M. Analysis of different modeling approaches for integration studies of plug-in electric vehicles. Int. J. Electr. Power Energy Syst. 2020, 114, 105398. [Google Scholar] [CrossRef]
- Hazazi, K.M.; Mehmood, K.K.; Cho, G.; Kim, C. Optimal Planning of Distributed Generators for Loss Reduction and Voltage Profile Enhancement Considering the Integration of Electric Vehicles. In Proceedings of the TENCON 2018—2018 IEEE Region 10 Conference, Jeju, Republic of Korea, 28–31 October 2018; pp. 883–888. [Google Scholar]
- Moradijoz, M.; Member, S.; Ghazanfarimeymand, A.; Member, S.; Moghaddam, M.P.; Haghifam, M.R. Optimum Placement of Distributed Generation and Parking Lots for Loss Reduction in Distribution Networks. In Proceedings of the 2012 Proceedings of 17th Conference on Electrical Power Distribution, Tehran, Iran, 2–3 May 2012; pp. 1–5. [Google Scholar]
- Baharudin, M.A. Minimization of Power Losses in Distribution System via Sequential Placement of Distributed Generation and Charging Station. Arab. J. Sci. Eng. 2014, 39, 3023–3031. [Google Scholar] [CrossRef]
- Moradi, M.H.; Abedini, M.; Tousi, S.M.R.; Hosseinian, S.M. Electrical Power and Energy Systems Optimal siting and sizing of renewable energy sources and charging stations simultaneously based on Differential Evolution algorithm. Int. J. Electr. Power Energy Syst. 2015, 73, 1015–1024. [Google Scholar] [CrossRef]
- Sultana, U.; Khairuddin, A.B.; Sultana, B.; Rasheed, N.; Hussain, S.; Riaz, N. Placement and sizing of multiple distributed generation and battery swapping stations using grasshopper optimizer algorithm. Energy 2018, 165, 408–421. [Google Scholar] [CrossRef]
- Jha, B.K. Coordinated effect of PHEVs with DGs on distribution network. Int. Trans. Electr. Energy Syst. 2019, 29, e2800. [Google Scholar] [CrossRef]
- Kanwar, N.; Gupta, N.; Niazi, K.R.; Swarnkar, A. Optimal distributed generation allocation in radial distribution systems considering customer-wise dedicated feeders and load patterns. J. Mod. Power Syst. Clean Energy 2015, 3, 475–484. [Google Scholar] [CrossRef]
- Anjum, Z.M.; Said, D.M.; Hassan, M.Y.; Leghari, Z.H.; Sahar, G. Parallel operated hybrid Arithmetic-Salp swarm optimizer for optimal allocation of multiple distributed generation units in distribution networks. PLoS ONE 2022, 17, e0264958. [Google Scholar] [CrossRef]
- Abualigah, L.; Diabat, A.; Mirjalili, S.; Abd Elaziz, M.; Gandomi, A.H. The Arithmetic Optimization Algorithm. Comput. Methods Appl. Mech. Eng. 2021, 376, 113609. [Google Scholar] [CrossRef]
- Leghari, Z.H.; Hussain, S.; Memon, A.; Memon, A.H.; Baloch, A.A. Parameter-Free Improved Best-Worst Optimizers and Their Application for Simultaneous Distributed Generation and Shunt Capacitors Allocation in Distribution Networks. Int. Trans. Electr. Energy Syst. 2022, 2022, 6833488. [Google Scholar] [CrossRef]
- Tasnim, S.; Uddin, J.; Tahsin, S.; Anam, K. Developing Efficient Charging Schedule of Electrical Vehicles for Centralized Charging Station by Analyzing Impact on Distribution Network Due to EV Charging. EJCE Eur. J. Electr. Eng. Comput. Sci. 2020, 4, 1–7. [Google Scholar] [CrossRef]
- Leghari, Z.H.; Hassan, M.Y.; Said, D.M.; Jumani, T.A.; Memon, Z.A. A novel grid-oriented dynamic weight parameter based improved variant of Jaya algorithm. Adv. Eng. Softw. 2020, 150, 102904. [Google Scholar] [CrossRef]
- Leghari, Z.H.; Hassan, M.Y.; Said, D.M.; Memon, Z.A.; Hussain, S. An efficient framework for integrating distributed generation and capacitor units for simultaneous grid-connected and islanded network operations. Int. J. Energy Res. 2021, 45, 14920–14958. [Google Scholar] [CrossRef]


| Bus | Initial Loading (MW) | Loading Capacity to Power Loss Index (LCPLI) |
|---|---|---|
| 2 | 0.1 | 9.81 |
| 3 | 0.09 | 3.76 |
| 4 | 0.12 | 2.36 |
| 5 | 0.06 | 1.67 |
| 6 | 0.06 | 1.04 |
| 7 | 0.2 | 0.95 |
| 8 | 0.2 | 0.55 |
| 9 | 0.06 | 0.45 |
| 10 | 0.06 | 0.37 |
| 11 | 0.045 | 0.36 |
| 12 | 0.06 | 0.34 |
| 13 | 0.06 | 0.28 |
| 14 | 0.12 | 0.26 |
| 15 | 0.06 | 0.25 |
| 16 | 0.06 | 0.23 |
| 17 | 0.06 | 0.20 |
| 18 | 0.09 | 0.19 |
| 19 | 0.09 | 9.55 |
| 20 | 0.09 | 7.38 |
| 21 | 0.09 | 6.97 |
| 22 | 0.09 | 6.38 |
| 23 | 0.09 | 3.60 |
| 24 | 0.42 | 3.37 |
| 25 | 0.42 | 3.19 |
| 26 | 0.06 | 1.01 |
| 27 | 0.06 | 1.01 |
| 28 | 0.06 | 0.97 |
| 29 | 0.12 | 0.95 |
| 30 | 0.2 | 0.94 |
| 31 | 0.15 | 0.91 |
| 32 | 0.21 | 0.91 |
| 33 | 0.06 | 0.91 |
| Number of DG Units Allocated | Optimization Technique | DG Size, kW (@Bus Location) | Power Loss (kW) | PLR (%) |
|---|---|---|---|---|
| Without DG allocation (integration of maximum PEV load) | - | - | 224.43 | |
| 1 DG unit allocation | AOA | 2425(26) | 118.05 | 47.40 |
| SSA | 2528.3(26) | 119.5 | 46.75 | |
| PSO | 2551.2(26) | 120.7 | 46.21 | |
| SSAPSO | 2682.5(6) | 117.13 | 47.81 | |
| AOASSA | 2682.5(6) | 117.13 | 47.81 | |
| 2 DG unit allocation | AOA | 906.6(14), 1113.2(30) | 95.31 | 57.53 |
| SSA | 697.6(14), 1115.6(30) | 96.54 | 56.98 | |
| PSO | 1006.6(11), 1113.2(31) | 96.82 | 56.86 | |
| SSAPSO | 1190.1(30), 867.03(13) | 94.69 | 57.80 | |
| AOASSA | 1190.1(30), 867.03(13) | 94.69 | 57.80 | |
| 3 DG unit allocation | AOA | 723.54(14), 1228.2(30), 996.59(24) | 78.73 | 64.92 |
| SSA | 800(13), 980(24), 900(30) | 79.67 | 64.50 | |
| PSO | 810(13), 1300(30), 810(24) | 80.47 | 64.14 | |
| SSAPSO | 840.82(13), 1067(24), 1091.5(30) | 77.94 | 65.27 | |
| AOASSA | 1184.6(24), 1077.2(30), 812.97(13) | 77.74 | 65.36 |
| Number of DG Units Allocated | Technique | Mean Power Loss (kW) | Standard Deviation σ | Variance σ2 |
|---|---|---|---|---|
| 1 DG unit allocation | AOA | 124.71 | 4.31 | 18.55 |
| SSA | 126.01 | 5.18 | 26.85 | |
| PSO | 127.42 | 5.30 | 28.08 | |
| SSAPSO | 119.90 | 1.63 | 2.66 | |
| AOASSA | 117.97 | 0.78 | 0.61 | |
| 2 DG unit allocation | AOA | 100.41 | 4.39 | 19.29 |
| SSA | 101.24 | 5.25 | 27.59 | |
| PSO | 102.76 | 5.44 | 29.58 | |
| SSAPSO | 96.59 | 2.39 | 5.69 | |
| AOASSA | 95.31 | 1.14 | 1.30 | |
| 3 DG unit allocation | AOA | 83.58 | 4.42 | 19.51 |
| SSA | 86.54 | 5.35 | 28.64 | |
| PSO | 87.74 | 6.04 | 36.43 | |
| SSAPSO | 81.07 | 2.45 | 6.00 | |
| AOASSA | 78.50 | 1.53 | 2.35 |
| Bus | Initial Loading (MW) | Loading Capacity to Power Loss Index (LCPLI) |
|---|---|---|
| 2 | 0 | 28.24 |
| 3 | 0 | 28.20 |
| 4 | 0 | 28.06 |
| 5 | 0 | 26.40 |
| 6 | 0.0026 | 10.79 |
| 7 | 0.0404 | 5.69 |
| 8 | 0.075 | 5.08 |
| 9 | 0.03 | 4.84 |
| 10 | 0.028 | 4.40 |
| 11 | 0.145 | 4.31 |
| 12 | 0.145 | 4.03 |
| 13 | 0.008 | 3.74 |
| 14 | 0.008 | 3.48 |
| 15 | 0 | 3.25 |
| 16 | 0.0455 | 3.21 |
| 17 | 0.06 | 3.12 |
| 18 | 0.06 | 3.12 |
| 19 | 0 | 3.02 |
| 20 | 0.001 | 2.96 |
| 21 | 0.114 | 2.87 |
| 22 | 0.0053 | 2.87 |
| 23 | 0 | 2.83 |
| 24 | 0.028 | 2.75 |
| 25 | 0 | 2.60 |
| 26 | 0.014 | 2.54 |
| 27 | 0.014 | 2.51 |
| 28 | 0.026 | 28.02 |
| 29 | 0.026 | 25.73 |
| 30 | 0 | 17.94 |
| 31 | 0 | 17.03 |
| 32 | 0 | 13.56 |
| 33 | 0.014 | 9.07 |
| 34 | 0.0195 | 6.04 |
| 35 | 0.006 | 5.29 |
| 36 | 0.026 | 28.02 |
| 37 | 0.026 | 25.68 |
| 38 | 0 | 22.84 |
| 39 | 0.024 | 22.14 |
| 40 | 0.024 | 22.10 |
| 41 | 0.0012 | 13.05 |
| 42 | 0 | 11.18 |
| 43 | 0.006 | 10.97 |
| 44 | 0 | 10.93 |
| 45 | 0.0392 | 10.42 |
| 46 | 0.0392 | 10.42 |
| 47 | 0 | 27.90 |
| 48 | 0.079 | 24.34 |
| 49 | 0.3847 | 17.32 |
| 50 | 0.3847 | 16.18 |
| 51 | 0.0405 | 5.07 |
| 52 | 0.0036 | 4.95 |
| 53 | 0.0044 | 4.13 |
| 54 | 0.0264 | 3.52 |
| 55 | 0.024 | 2.89 |
| 56 | 0.024 | 2.90 |
| 57 | 0 | 2.48 |
| 58 | 0 | 1.34 |
| 59 | 0 | 1.09 |
| 60 | 0.1 | 1.02 |
| 61 | 0 | 0.93 |
| 62 | 1.244 | 0.84 |
| 63 | 0.032 | 0.83 |
| 64 | 0 | 0.81 |
| 65 | 0.227 | 0.73 |
| 66 | 0.059 | 0.65 |
| 67 | 0.018 | 4.26 |
| 68 | 0.018 | 4.26 |
| 69 | 0.028 | 3.88 |
| Number of DG Units Allocated | Optimization Technique | DG Size, kW (@Bus Location) | Power Loss (kW) | PLR (%) |
|---|---|---|---|---|
| Without DG allocation (integration of maximum PEV load) | - | 225.3 | ||
| 1 DG unit allocation | AOA | 1829.10@61 | 83.50 | 62.93 |
| SSA | 2039.70@61 | 84.39 | 62.54 | |
| PSO | 2130.0@61 | 85.69 | 61.96 | |
| SSAPSO | 1873.20@61 | 83.43 | 62.96 | |
| AOASSA | 1873.20@61 | 83.43 | 62.96 | |
| 2 DG unit allocation | AOA | 1778.2@61, 554.91 @15 | 72.03 | 68.02 |
| SSA | 1589@61, 576 @15 | 73.27 | 67.47 | |
| PSO | 1922.20@61, 755.50 @15 | 74.52 | 66.92 | |
| SSAPSO | 1781.90@61, 531.90 @17 | 71.87 | 68.10 | |
| AOASSA | 1781.90@61, 531.90 @17 | 71.87 | 68.10 | |
| 3 DG unit allocation | AOA | 1702.6@61, 524.63@67, 229.03@18 | 70.91 | 68.53 |
| SSA | 393.1@67, 629@18, 1577.8@61 | 72.17 | 67.96 | |
| PSO | 401@67, 726.19@18, 1640@61 | 73.67 | 67.30 | |
| SSAPSO | 452.77@17, 1689@61, 678.06@18 | 70.17 | 68.85 | |
| AOASSA | 528.32@11, 380.35@18, 1719.2@61 | 69.60 | 69.10 |
| Number of DG Units Allocated | Technique | Mean Power Loss (kW) | Standard Deviation σ | Variance σ2 |
|---|---|---|---|---|
| 1 DG unit allocation | AOA | 87.94 | 4.44 | 19.79 |
| SSA | 90.54 | 5.65 | 32.01 | |
| PSO | 91.95 | 5.81 | 33.81 | |
| SSAPSO | 85.45 | 2.49 | 6.24 | |
| AOASSA | 84.27 | 0.98 | 0.96 | |
| 2 DG unit allocation | AOA | 76.59 | 4.59 | 21.07 |
| SSA | 79.69 | 5.79 | 33.61 | |
| PSO | 80.39 | 5.98 | 35.80 | |
| SSAPSO | 74.91 | 2.70 | 7.33 | |
| AOASSA | 74.08 | 1.36 | 1.85 | |
| 3 DG unit allocation | AOA | 75.94 | 4.61 | 21.27 |
| SSA | 78.34 | 5.97 | 35.74 | |
| PSO | 80.20 | 7.49 | 56.25 | |
| SSAPSO | 74.39 | 3.00 | 9.05 | |
| AOASSA | 71.65 | 2.13 | 4.57 |
Disclaimer/Publisher’s Note: The statements, opinions and data contained in all publications are solely those of the individual author(s) and contributor(s) and not of MDPI and/or the editor(s). MDPI and/or the editor(s) disclaim responsibility for any injury to people or property resulting from any ideas, methods, instructions or products referred to in the content. |
© 2023 by the authors. Licensee MDPI, Basel, Switzerland. This article is an open access article distributed under the terms and conditions of the Creative Commons Attribution (CC BY) license (https://creativecommons.org/licenses/by/4.0/).
Share and Cite
Memon, Z.A.; Said, D.M.; Hassan, M.Y.; Munir, H.M.; Alsaif, F.; Alsulamy, S. Effective Deterministic Methodology for Enhanced Distribution Network Performance and Plug-in Electric Vehicles. Sustainability 2023, 15, 7078. https://doi.org/10.3390/su15097078
Memon ZA, Said DM, Hassan MY, Munir HM, Alsaif F, Alsulamy S. Effective Deterministic Methodology for Enhanced Distribution Network Performance and Plug-in Electric Vehicles. Sustainability. 2023; 15(9):7078. https://doi.org/10.3390/su15097078
Chicago/Turabian StyleMemon, Zeeshan Anjum, Dalila Mat Said, Mohammad Yusri Hassan, Hafiz Mudassir Munir, Faisal Alsaif, and Sager Alsulamy. 2023. "Effective Deterministic Methodology for Enhanced Distribution Network Performance and Plug-in Electric Vehicles" Sustainability 15, no. 9: 7078. https://doi.org/10.3390/su15097078