Article

Polystyrene Nanoparticle Uptake and Deposition in Silkworm and Influence on Growth

Key Laboratory of Advanced Light Conversion Materials and Biophotonics, Department of Chemistry, Renmin University of China, Beijing 100872, China
*
Authors to whom correspondence should be addressed.
Sustainability 2023, 15(9), 7090; https://doi.org/10.3390/su15097090
Submission received: 13 March 2023 / Revised: 19 April 2023 / Accepted: 20 April 2023 / Published: 23 April 2023
(This article belongs to the Special Issue Microplastics in Terrestrial Ecosystem)

Abstract

:
This work reports the biological toxicity of nano plastic particles (NPs) to silkworms fed on the bait dopped with polystyrene encapsulated luminescent nanoparticles. The processes of NPs intake and excretion were monitored by means of time-gated optical imaging (TGI) and Inductively Coupled Plasma Mass Spectrometry (ICP-MS), which allowed the quantification of the spatiotemporal deposition of NPs in an individual silkworm. The rates of NPs excretion and sequestration were found to be 99.92% and 0.08%, respectively, and the NPs retentate stayed mainly in the fat body (67.7%), digestive tract (18.0%), and head (7.54%). Adverse effects of NPs exposure were accordingly confirmed such as growth retardation and smaller physique. The results of the present work confirmed the possibility of nano-plastics accumulating and transmitting along the food chain in terrestrial ecosystems. The present work demonstrates the potential of employing silkworm as a model of full metamorphosed insects for exploring the biological impact of NPs on congeneric terrestrial animals, as well as the efficacy of the TGI-MS modality for in situ visualizing and quantifying the propagation of NPs via the primary food chain.

1. Introduction

Plastic waste in micron and nano sizes have attracted considerable concerns in recent years because of their proven biological hazards to various biological components in the ecosystem [1,2] as a consequence of the wide application of plastics in industry [3], medicine [4], and daily lives [5]. Since the physical dimensions of NPs are comparable to or less than the cell membrane structures, the environmental and biological effects of NPs are profound and hence deserve in-depth investigation [6,7]. According to documented research, environmental accumulation of NPs may affect animals and plants. For instance, NPs of various size can deposit in marine shellfish [8,9,10,11] and phytoplanktons [12], and hence can impose biotoxicity on their living. In the case of Pecten maximus exposed to NPs for 6 h, 250 nm NPs accumulation in the intestines was observed, whereas 24 nm NPs were found to disperse throughout the whole bodies [8]. Meanwhile, it is claimed that some aquatic organisms, such as Daphnia [2,13,14], Zebrafish [15,16], zooplankton [17], and microbes [18,19], can intake environmental NPs and, consequently, will suffer from low growth rate and neonate production, as well as high mortality and malformation. Moreover, it has been shown that NPs-adsorbed inorganic and/or organic pollutants exert even serious biological consequences to aquatic organisms [20,21]. On the other hand, some terrestrial plants, e.g., M. exotica plants [22] and some crops [23,24], have also been recently shown to be able to uptake NPs from environmental media.
However, there is still a lack of research on the biological progresses of NPs in terrestrial animals, and we also have a limited idea about the agglomeration effect of NPs along the food chain. Recent investigation taking silkworms as models discussed the reaction of silkworms to such exogenous sub-nanometer molecules as rhodamine [25], indicating the possible distribution of xenobiotics in vivo. To fabricate excellent modified silk protein, fluorescent modified substances were added to the silkworm feed, which interpreted that those molecules in nanoscale could be doped into fibroin and sericin by ingestion [26]. Previous studies [25,26] showed us that silkworm can prove to be a model animal that has potentials to reveal the unknown role NPs played in vivo. Silkworm will go through four patterns in its whole life cycle just as most completely metamorphosed insects, visualizing uptake and accumulation of NPs in silkworm will conduce to deepen the comprehending effect and potential toxicity of NPs. Significantly, a long-term breeding experience for silkworm made it possible to establish such an experiment frame to realize the target of this work. Besides, silkworm would deliver the exogenous matters to senior consumers, for which the distribution of NPs in them could be a substantial element in the whole research system of the NPs in the terrestrial ecological chain.
Upconversion nano particles (UCNPs), with the ability to achieve anti-Stokes shift and near-infrared excitation [27], are pitched at a significant biological fluorescent probe, which help a large number of achievements in biology [28], anti-counterfeit [29], and many other important light industries [30]. Compared to conventional excitation modes, near-infrared excitation of 980 nm and 800 nm laser will induce a weaker autofluorescence background, which is also more powerful in the live tissue penetration simultaneously. Recently, some related research studies targeting the monitoring of the interaction of UCNPs had been conducted with model plants by optical microscopy, which also in some way concluded the advantages of UCNPs as a fluorescent label [22]. Polystyrene-encapsulated UCNPs provide a solution to monitor NPs, maintaining its surface properties. Herein, PS-coated UCNPs were employed to feed silkworm, so as to visualize the in vivo and in vitro distribution of UCNPs in a noninvasive manner, and to explore the potential influence on the silkworm vitality.
For conventional optical observation, excitation stray light and biological autofluorescence seemed inevitable when monitoring biological samples, which would seriously affect the extraction of effective signals. Time-gating, which exploited the difference in luminescence lifetime, made it possible to eliminate the interference and improve the reliability of the signals. On this basis, time-gating had made great contributions to medical imaging and biological imaging [31]. In this study, a time-gated optical imaging (TGI) setup was used to eliminate the interference from excitation stray light and biological autofluorescence, and furthermore, to realize the in situ imaging of UCNPs without damaging the original morphology of the biological samples. Silkworm cultivation experiments were conducted for one month, in which the first instar silkworms were bred to cocoons and eventually to silk moths. Silkworm excrement was monitored and collected per day throughout the larval period, and a series of other measurements on the silk from cocoons were carried out (Figure 1). To measure the spatial distribution of NPs in silkworm, samples were subjected to TGI imaging, as well as to ICP-MS analysis to quantitatively determine the lutetium content in the primary organs of silkworm. Altogether, these have established a new experimental modality for the investigation of the tissue distribution of NPs in terrestrial animals and the evaluation of the biotoxicity.

2. Materials and Methods

2.1. Materials

Rare-earth oxides LuCl3 (99.99%), YbCl3 (99.99%), ErCl3 (99.995%), and eosin Y (high purity) were from the Beijing Innochem Science & Technology company, Beijing, China. NH4F (98%) and NaOH (98.5%) were from J&K Chemical, Beijing, China. Oleic acid (OA, >90%) and octadecane (ODE, >90%) were from Alfa Aesar, Shanghai, China. Cyclohexane and ethanol were from Beijing Chemical Plants, Beijing, China. St (99%), and THF (>99.9%) was from the Meryer Company, Shanghai, China. Triethanolamine (>99.0%) was from the Shanghai Aladdin Biochemical Technology Company, Shanghai, Beijing. All of the chemical reagents were used directly without further purification.

2.2. Preparation of NaLuF4: 20% Yb, 2% Er@NaLuF4 UCNPs

In previous study, the distribution of NPs was generally determined by means of heavy metal [32] and radioisotope [33] labeling. In this work, a core–shell–shell three-layer structure of NPs was manufactured, whose luminescent label (NaLuF4: 20% Yb, 2% Er@NaLuF4) was used for the UCNPs visualization (cf. Figure 2). The detailed synthetic protocol reported elsewhere [27] is described briefly below. To begin with, 1 mmol rare-earth chlorides were mixed with 6 mL OA and 15 mL ODE. The mixture was heated to 130 °C with uniform stirring under vacuum atmosphere. NaOH (2.5 mmol) and NH4F (4 mmol) were added to the flask after the homogeneous solution cooled down to room temperature. The NaLuF4: 20% Yb, 2% Er nanocrystals were then achieved by thermostatic reaction at 295 °C for 1.5 h when maintaining argon atmosphere subsequently. The synthesized products were centrifuge-washed three times, followed by finally dispersing in cyclohexane. The preparation process of coating NaLuF4 inert shell on NaLuF4: 20% Yb, 2% Er core was almost consistent with the aforementioned content except that the dispersion of NaLuF4: 20% Yb, 2% Er was also contained as raw material.

2.3. In Situ Polymerization of Polystyrene (PS) on the Surface of UCNPs

A previously published approach of upconversion photopolymerization was selected to realize the coating of PS on the surface of UCNPs [28]. The UCNPs (0.25 mmol), St (20 mmol), eosin Y (3 μmol), triethanolamine (0.24 mmol), and THF (2 mL) were mixed in a glass vial which would be irradiated by NIR excitation light (980 nm, 0.7 W/cm2) in the dark chamber for 12 h, and after centrifuge-washing three times, the UCNPs-labelled NPs fluorescent probes were ultimately obtained.

2.4. Cultivation Experiment of Silkworms

As shown in Figure 1, silkworms of first instar were cultivated in a climatic chamber with programmatic temperature, humidity, illumination, and other climatic conditions, which also had exactly identical feeding conditions [25,26]. After two molts, 54 silkworms with approximately the same growth were divided into three culture conditions with 9 groups (three groups for every condition). Three groups were set as the control with regular feeding conditions to conduct a parallel controlled experiment; the other six groups were equivalent experimental groups in which silkworms were fed with NPs-modified regular feed (the mass ratio of NPs: 0.009%, 0.09%, which was called NPs-900 ppm and NPs-90 ppm in the following). The regular feed was purchased from the Hangzhou Jiuyuan Silk Culture limited company, the NPs-modified regular feed was achieved by uniform mixing of diet powder and NPs followed by tableting into disks. For each condition, the excrement of silkworms of 2 groups thereof was collected per day for further growth tracking, and the other one was for histological anatomy study. The cultivation experiment would remain ongoing until the next generation of silkworm eggs was obtained. The weight in g and the size in mm of silkworm cocoons were measured. The statistics of all analyses were presented as mean ± standard deviation (SD). The results were also analyzed for the significance of differences among the control and the experimental by Student’s t-test [34]. All the tests were conducted by IBM SPSS Statistics software.

2.5. Characterization of UCNPs-Labelled NPs Fluorescent Probes

The morphologies and sizes of the UCNPs-labelled NPs fluorescent probes were measured at 80 kV using a Hitachi H-7650B transmission electron microscope (TEM). The prepared UCNPs were dispersed incyclohexane and transferred onto the surface of a copper grid for TEM analysis. The luminescent properties of the materials were achieved by steady-state upconversion luminescence (UCL) spectra scanning from 400 nm to 700 nm, determined with fluorescence spectrophotometer (FLS-980, Edinburgh Instruments), which were activated by an external continuous-wave (CW) 980 nm diode laser (MDL-H-980-5W, Changchun New Industries Optoelectronics Tech Company, Changchun, China) at an appropriate excitation power of 1.50 W. All the luminescence studies were recorded at room temperature.

2.6. Time Gated Imaging of Biological Samples

As shown in Figure 1, the TGI apparatus was constituted with an optical microscope (Nikon, E 200) and an ICMOS camera (TRC 312, Zhongzhi Keyi Beijing Technology Co., Ltd., Beijing, China). Put simply, slides bearing biological samples were loaded on the sample stage of the microscope, and laser pulses (974 nm, 7 ns, 10 mJ, 50 Hz) generated by an optical parametric oscillator irradiated the samples obliquely upward in the direction of 45° offset from the vertical. The light signals were transferred onto the ICMOS camera which was synchronized with the excitation laser. For each excitation/capture operate circle, the gate of ICMOS (gate width, 1 ms) was set with a time delay of 1 μs compared to excitation laser pulse, so that the stray light and the autofluorescence from biological samples can be eliminated [35]. The TGI imaging measurements were all conducted at room temperature, and all results of TGI were processed with Fiji ImageJ software.

2.7. Distribution Analysis of NPs

To examine the distribution of NPs in silkworm, the sections with thickness of 1~2 mm were achieved through scalpel excision and three-time rinse with fresh water after dissection of the silkworm, and subsequently subjected to TGI measurement. Besides, silk with a size of ~5 mm × 5 mm stripped from the interlayer of cocoons was carried out using the same analysis, and so were the silkworm eggs which had not been treated before measurement. Distribution analysis of NPs was realized by the comparison of luminescence intensity under evenly excitation conditions. Furthermore, the organs mentioned above were freeze-dried and then dissolved with nitric acid and hydrogen peroxide, and ICP-MS tests of these samples for Lutetium were conducted subsequently to analyse the relative content of NPs in different organs and ulteriorly the distribution of NPs in vivo [36]. All ICP-MS tests were executed by the Hangzhou Yanqu Information Technology limited company (Angilent ICP-MS 7800; RF power, 1550 W). The same analysis was carried out on silkworm excrement to determine the transmission of NPs along the food chain.

2.8. In Situ Observation of NPs in Silk

The resolution of the optical microscope carried out on TGI was not enough to resolve the specific location of NPs existing in silk. To satisfy the demand for further exploration of NPs in biological samples, the combination of both TGI and SEM analyses was performed. (i) For the aforementioned TGI imaging of silk, bright-field and dark-field images were merged, and the approximate location of NPs was determined. (ⅱ) To obtain more accurate deposition details, silk samples were subjected to SEM test, some certain areas selected on the basis of the overlying pictures of TGI results were observed at much higher resolution. (ⅲ) Some regions suspected that NPs morphology were subjected to elemental analysis with EDS to provide further evidences of the existence of NPs.

3. Results and Discussion

3.1. Morphology and Optical Properties of UCNPs-Labelled NP Fluorescent Probe

Figure 3A shows the morphology of the synthesized NPs as measured with transmission electron microscopy (TEM). The NPs ellipsoidal in shape exhibited a length of 68.4 ± 3.7 nm and a width of 60.3 ± 3.7 nm (cf. Figure 3B; the statistical results were obtained by size analysis of 100 stochastic particles). Figure 3C shows the luminescent spectra of the NPs as freshly prepared and as recycled from modified feed. They asserted an excellent Er3+ luminescence performance in the visible region under laser excitation at 980 nm. Importantly, they were almost identical, suggesting the negligible damages to the luminescence property of NPs during milling. Figure 3D exhibits the time evolution profiles of NPs-luminescence intensity. The almost undropped intensity over 34 days proves the excellent photostability of the NPs, which was crucial for its application in the long-term cultivation experiments.

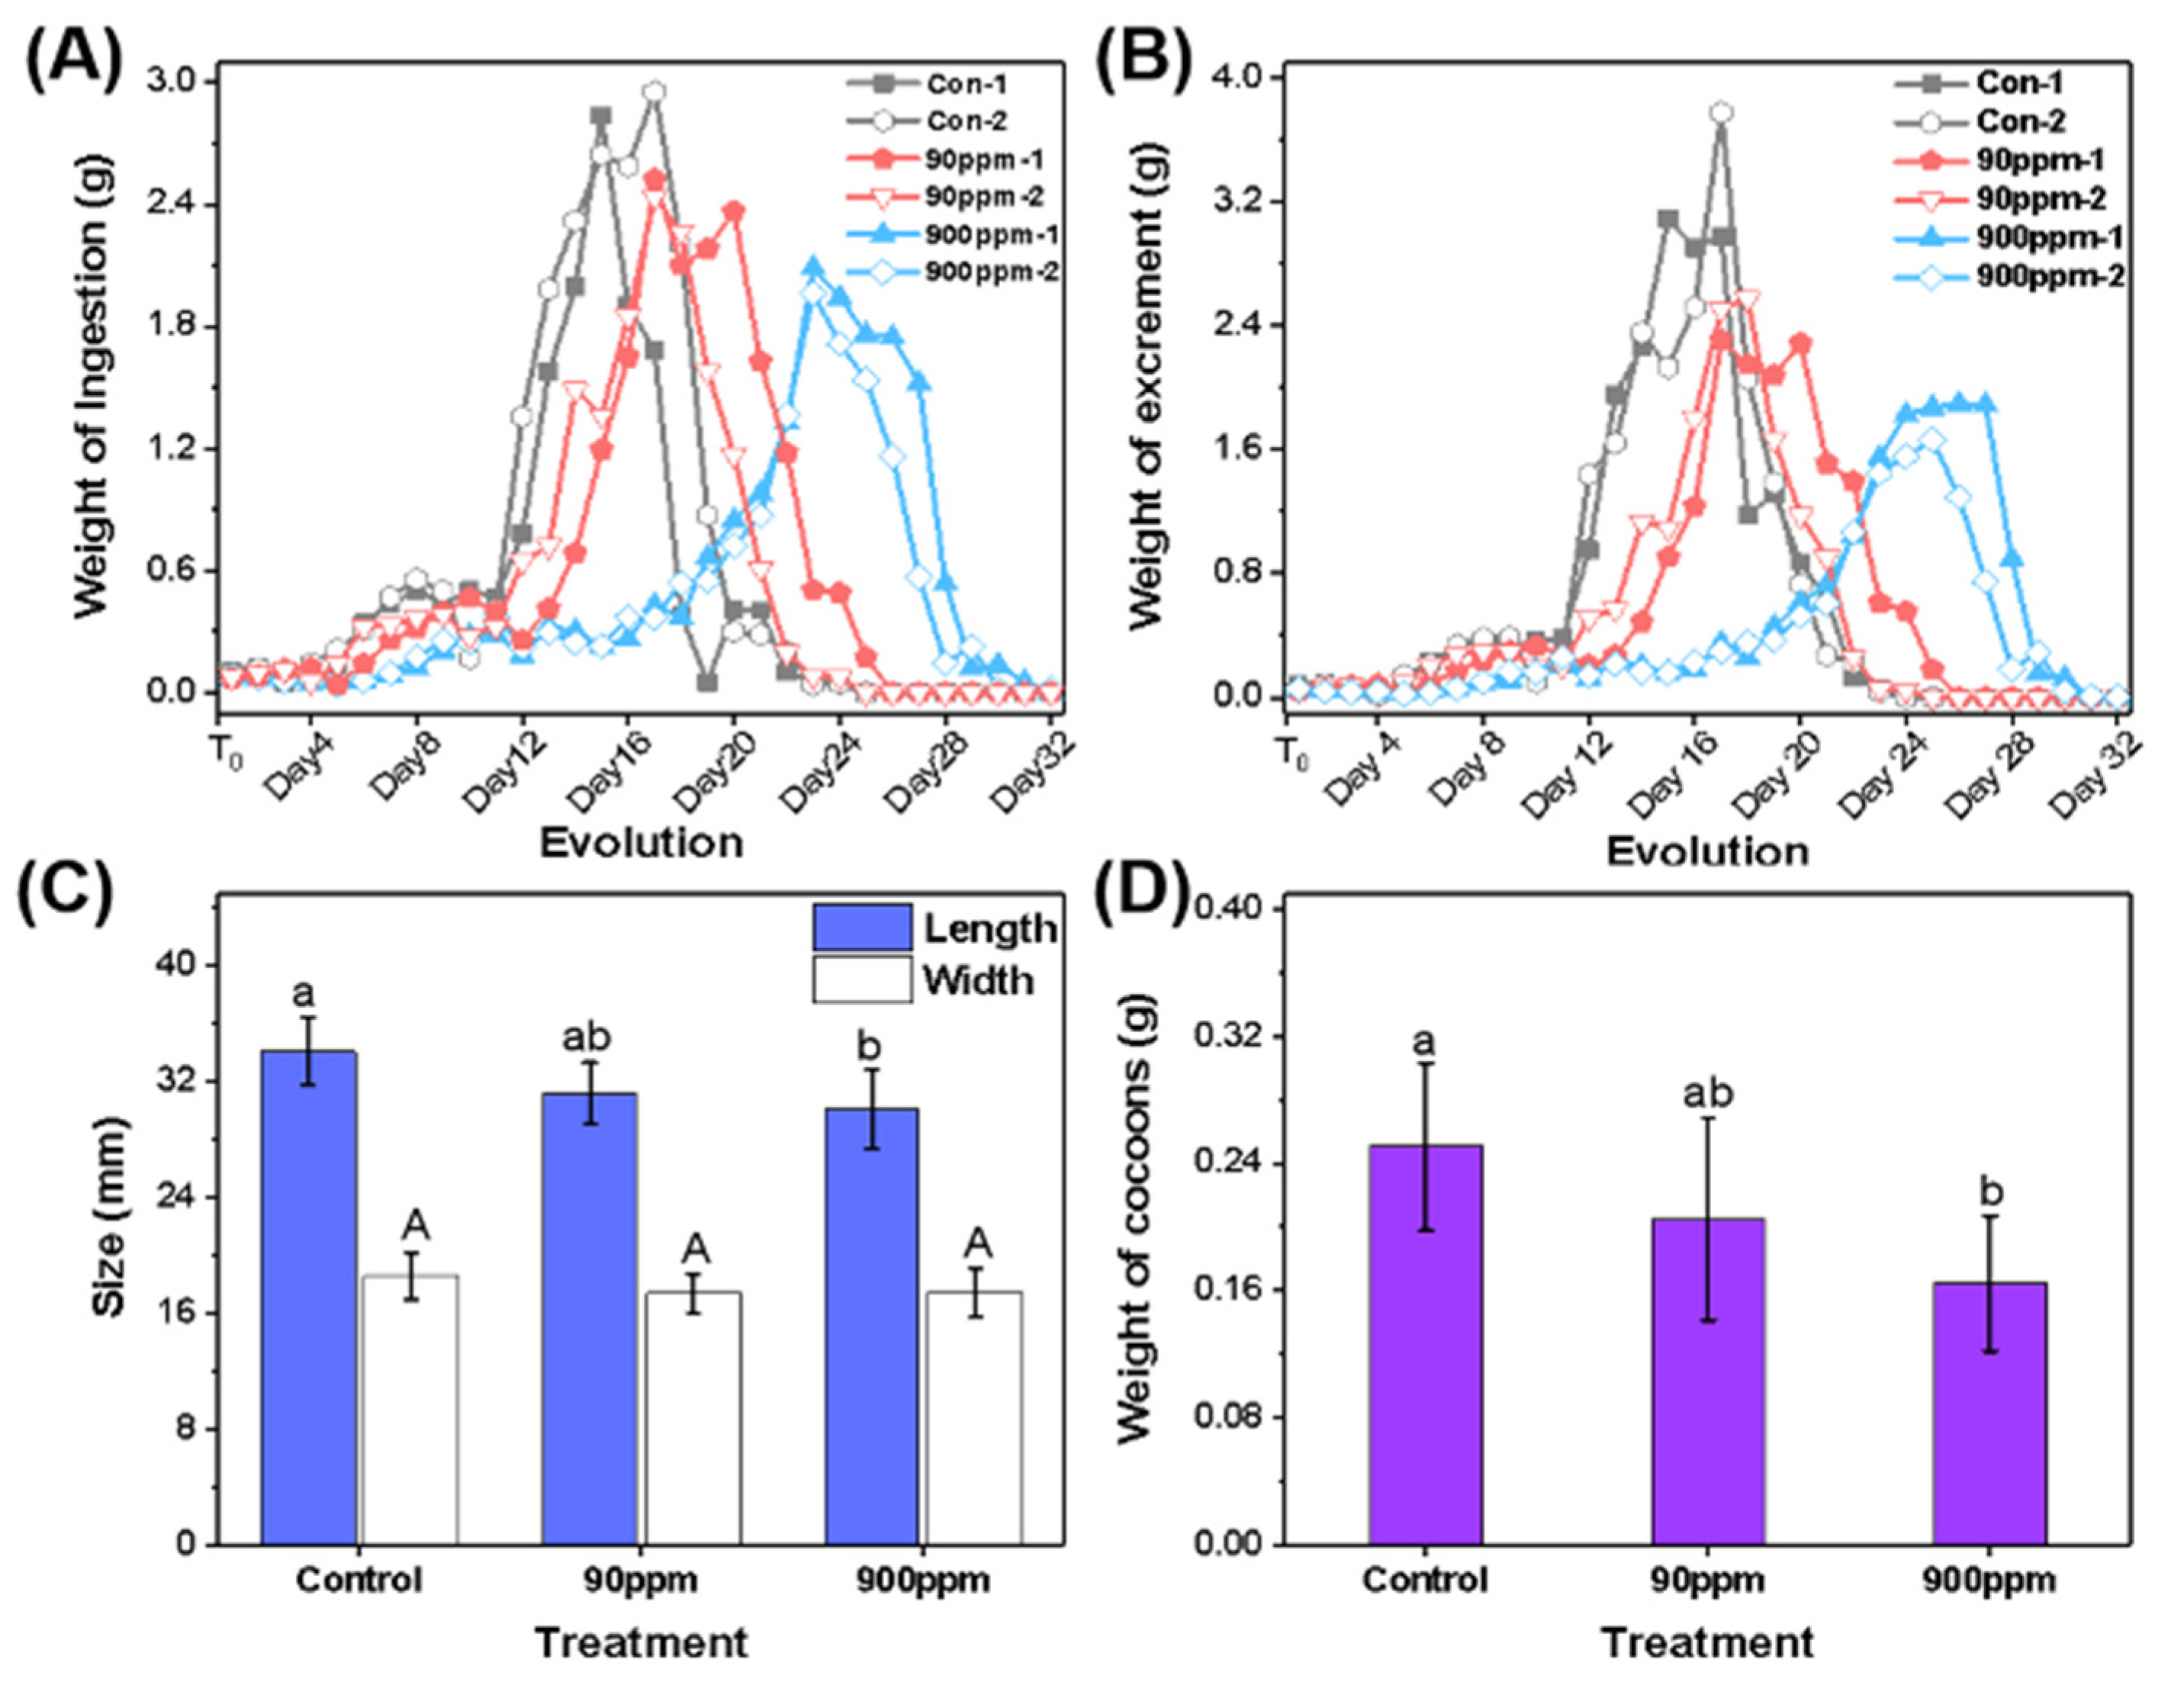
3.2. Comparison of Growth Evolution of Silkworms under Different Culture Conditions

Figure 4A,B, respectively, show the change tendency of the feed intake and excrement of silkworms of different groups in weight. Daily ingestion and excretion of control groups and experimental groups over the experimental period displayed a similar change trend that, during the worm period, all of the silkworms would grow much faster with age while be stagnate at molting, which made the growth curve compose of three gradually larger peaks. Otherwise, the appearances of mature silkworms at the end of the fifth instar bred in different growth environments are shown as Figure S1. According to the pictures, the length of silkworms in control groups was uniformly about 6 cm with ~1 cm of width at the same time, which suggested their sense of health.
However, silkworms of experimental groups presented as markedly weaker in view of the growth curve, which indicated an apparent growth retardation of approximately 1~2 days for silkworms in NPs-90 ppm groups compared to those under regular feeding conditions, while the retardation reached 7 days for silkworms in NPs-900 ppm groups. As for semblance, the silkworms in NPs-90 ppm groups seemed to differ little from those in control groups. Simultaneously, however, silkworms under the pressure of NPs with a mass fraction ratio of 0.09% showed some individual differences to some extent. A number of silkworms in NPs-900 ppm groups grew normally without physical difference compared to silkworms with regular feed; meanwhile, however, the others seemed much more emaciated, with only ~4 cm in length and less than 1 cm in width. On the basis of the phenomena, the negative effects to silkworm growth could be summarized as smaller physique and retardation of growth, while there was no systematic influence to the specific living behavior of silkworms, which was ulteriorly attributed to the inhibitions of NPs to the digestive system of silkworms.
Besides, silk cocoons were also collected, and the weight of cocoons with shred skin cleaned was measured to judge whether the existence of NPs would have some impacts on silk production, moreover, to reflect benefits or hazards that NPs would take to silkworms laterally. Figure S2 collected some images of silkworm cocoons. Evidently, the cocoons of normal silkworms were ~34.1 ± 2.3 mm in length and ~18.6 ± 1.6 mm in width, which were significantly larger than those in experimental groups, just as shown in Figure 4C. Figure 4D shows the results of characterization for the weight of silkworm cocoons; the weight of cocoons in control groups was 0.251 ± 0.053 g, which were markedly larger than those with a weight of 0.205 ± 0.064 g in NPs-90 ppm groups and 0.165 ± 0.043 g in NPs-900 ppm groups. In view of the phenomenon just announced, it was not troublesome to conjecture that the involvement of NPs will do harm to the growth and secretion of silkworms.

3.3. Discussion of the Distribution of NPs

Silkworm sections and excrement samples were directly loaded on a glass slide for TGI analysis. Figure 5 shows the TGI results for primary organs of silkworm including the head (from cross section), digestive tract (from the side), silk gland (from cross section), and fat body (from the side), as well as the excrement. It was apparent that luminescence signals belonging to UCNPs-labelled NPs were widely distributed in the field of view when observing the excrement, indicating abundant NPs accumulation. See Figure S3 for luminescence images by TGI, which respectively showed bright- and dark-field photos of silkworm excrement of NPs-900 ppm groups collected 1 day, 3 days, 5 days, 7 days, 14 days, and 21 days after initiating the cultivation. Similar phenomena were observed in excrement at different live stages. Obviously, luminescence signals obtained illustrated wide distribution of the NPs discharged in excrement, which would not undergo profound changes with different life stages.
The same analysis was subsequently performed on the rest of the groups; the results were absolutely as anticipated that the excrement of NPs-90 ppm groups (as shown in Figure S4) was observed with apparent signals originated from UCNPs-labelled NP fluorescent probes compared to those of control groups (as shown in Figure S5).
In the same way, the luminescence signals were also captured in silkworm organs, while the signal intensities seemed much weaker compared to those in excrement. It highly suggested that the NPs ingested had more tendency to be excreted in the form of faeces. As shown in Figure 5, the fat body performed more obvious luminescence signals, which represented a higher concentration of NPs. In comparison, the head and the digestive tract were observed with weaker luminescence intensity when the luminescence of silk gland was even fainter, which showed different distributions of NPs in these organs.
To further study the distribution of NPs ingested, silkworms were dissected, and the head, the digestive tract, the silk gland, and the fat body of both NPs-900 ppm and control groups were freeze-dried and analyzed by ICP-MS for lutetium element, as was the silkworm excrement. Table 1 shows the distribution of NPs in silkworm organs and excrement. As anticipated, excrement of NPs-900 ppm groups was determined to have the highest concentration, which reached 1344.07 mg/kg. Comparatively, the concentration of NPs in the head, digestive tract, and fat body was just 34.02 mg/kg, 25.58 mg/kg, and 7.78 mg/kg, respectively, which was several orders lower than those in excrement. In addition, the value for silk gland was only 0.72 mg/kg, which significantly indicated the rare distribution of NPs in silk gland. Notably, the concentrations of NPs in the digestive tract, silk gland, and fat body are higher than the detection limit, which could be due to the accidental contamination by the airborne NPs in the laboratory atmosphere. Further, the content of NPs in the head, digestive tract, silk gland, fat body, and excrement was examined as 0.142 μg, 0.340 μg, 0.126 μg, 1.275 μg, and 2.3 mg, respectively, which provided more details about the distribution of NPs on the basis of TGI results. In addition, it was worthy of note that high penetrability of 980 nm near-infrared light to tissues made the fat body perform much stronger luminescence when observed with TGI. The sink of NPs ingested was obtained after further calculation, and the results claimed that 99.92% of the NPs in diet were excreted in the form of faeces, while only 0.08% were preserved internally, which also represented the digestibility of NPs by silkworms. The digested part of NPs intake made a claim that NPs had a few accesses to enter the body of silkworms though the amount of this part was not much. Figure 5 also summarized details of the distribution of NPs; as listed in the table, the vast majority of NPs internally were found in the fat body, which reached the ratio of 67.7% Besides, 18.0% of NPs were found in the digestive tract, 7.54% of NPs were explored in the head, while only 6.69% of NPs were distributed in the silk gland. Moreover, the NPs dispersed in tissues and organs suggested weak accumulation of NPs along the food chain compared to the initial concentration of dosing.

3.4. Investigations of Silk and Silkworm Eggs

To avoid the interference from the pollution of culture environment to the outer silk and adhesion of NPs from silkworm to the inner silk, the silk in the interlayer of cocoons was peeled off and separated into pieces with an appropriate area of ~5 mm × 5 mm before being subjected to TGI analysis. Figure 6A–C shows bright-field, dark-field, and superimposed images of silk sample from silkworms cultured with 900 ppm NPs-modified feed, which suggested the approximate location of NPs contained in silk; at the same time, however, identical results could hardly be achieved from NPs-90 ppm groups and control groups (cf. Figure S6). On this basis, the combined use of TGI and SEM was applied. Signal regions obtained by TGI were further observed with higher revolution by SEM. In Figure 6D, numerous particles similar to NPs in shape are observed, which together with more morphological details as in the inset and the elemental analysis (cf. Figure S7, Table S1) revealed the existences and accurate locations of NPs in silk. Although the contamination of NPs on silkworm skin to cocoons was almost inevitable, there was still probability that the NPs observed were from the silk gland of silkworms.
The silkworm egg was another sample of interest, which would reflect the potential role of NPs in reproduction. Some eggs of NPs-900 ppm groups were found in irregular shapes, whereas those of the control groups were rounded as shown by comparing Figure 7 and Figure S8. Besides, 50 silkworm eggs laid by NPs-900 ppm groups were collected for TGI observation, but only a very few silkworm eggs were observed with luminescence signals as shown in Figure 7 as a result of NPs existence, which suggested that NPs could be transmitted to the next generation through the reproductive system, though hardly likely. By comparison, the silkworm eggs in control groups showed nothing while irradiated by nanosecond laser (cf. Figure S8). Further, Figure S9 introduced TGI results of eggshell and contents, however, which alerted that NPs were mainly distributed in eggshells to some extent. The dark-field and the overlapped images have evidenced the existence of NPs on eggshells, and hence the limited hazardous to silkworm reproduction.

4. Conclusions

In summary, silkworm has been demonstrated as an appropriate model of terrestrial insects for the investigation of the biological consequence of NPs, which helps to understand the intake, distribution, and excretion of exogenous NPs. Negative biological response was observed for silkworms exposed to NPs as characterized explicitly by the intake and the excretion curves. Specifically, the NPs-90 ppm group showed a growth retardation of 1~2 days with respect to the control, while the retardation for the NPs-900 ppm group was boosted up to 7 days. In addition, silkworm cocoons of the experimental groups exhibited smaller physique compared to the control. On the other hand, the present work has proved that a combination of the noninvasive and in situ optical imaging and the elemental analysis (TGI-MS) is powerful for the study of the deposition and distribution of NPs in biological tissues. It was shown that 99.92% of the NPs ingested by silkworms were excreted as faeces. Furthermore, the biological impacts of NPs on terrestrial organisms are worthy of more in-depth study, especially for the effect on metamorphosis and the underlying mechanism [37].

Supplementary Materials

The following supporting information can be downloaded at: https://www.mdpi.com/article/10.3390/su15097090/s1, Figure S1: Digital camera images of silkworms at the fifth instar in control, NPs-90 ppm and NPs- 900 ppm groups; Figure S2: Digital camera images of cocoons in control, NPs-90 ppm and NPs-900 ppm groups; Figure S3: TGI and bright-field images of silkworm excrement from the 1st day to the 21st day for NPs-900 ppm groups; Figure S4: TGI and bright-field images of silkworm excrement from the 1st day to the 21st day for NPs-90 ppm groups; Figure S5: TGI and bright-field images of silkworm excrement from the 1st day to the 21st day for control groups; Table S1: Silkworm growth comparison in three culture conditions with all groups; Figure S6: (A) Region of interests (ROI) on silk samples of NPs-900 ppm groups for energy dispersive spectroscopy (EDS); (B) spectrum result of ROI by EDS; Figure S7: (A) Region of interests (ROI) on silk samples of NPs-900 ppm groups for energy dispersive spectroscopy (EDS); (B) spectrum result of ROI by EDS; Table S2: Elemental analysis for Yb, Lu and Er in ROI by EDS; Figure S8: (A) Bright-field, (B) TGI and (C) Superimposed images of the silkworm egg sample in control groups; Figure S9: (A) Superimposed, (C) TGI and (E) bright-field images of the content of silkworm egg samples in NPs-900 ppm groups; (B) Superimposed, (D) TGI and (F) bright-field images of the eggshell of the same silkworm egg samples.

Author Contributions

Conceptualization, Z.-J.W., L.-M.F. and J.-P.Z.; Methodology, Z.-J.W. and L.-M.F.; Investigation, Z.-J.W., Y.-H.Z., R.-Y.G., H.-B.J. and X.-J.L.; Writing—Original Draft, Z.-J.W. and L.-M.F.; Writing—Review and Editing, Z.-J.W., L.-M.F., J.-P.Z., Y.-H.Z., R.-Y.G., Y.-W.H. and Q.-Q.S.; Funding Acquisition, L.-M.F. and J.-P.Z. All authors have read and agreed to the published version of the manuscript.

Funding

This research was funded by the National Natural Science Foundation of China (NSFC), Grant Nos. 22076218.

Institutional Review Board Statement

Not applicable.

Informed Consent Statement

Not applicable.

Data Availability Statement

Not applicable.

Acknowledgments

The authors would like to acknowledge the National Natural Science Foundation of China (NSFC, Grant Nos. 22076218) for their support.

Conflicts of Interest

The authors declare no conflict of interest.

References

  1. Besseling, E.; Quik, J.T.K.; Sun, M.; Koelmans, A.A. Fate of nano- and microplastic in freshwater systems: A modeling study. Environ. Pollut. 2017, 220, 540–548. [Google Scholar] [CrossRef] [PubMed]
  2. Besseling, E.; Wang, B.; Lurling, M.; Koelmans, A.A. Nanoplastic Affects Growth of S. obliquus and Reproduction of D. magna. Environ. Sci. Technol. 2014, 48, 12336–12343. [Google Scholar] [CrossRef] [PubMed]
  3. Peng, L.; Fu, D.; Qi, H.; Lan, C.Q.; Yu, H.; Ge, C. Micro- and nano-plastics in marine environment: Source, distribution and threats—A review. Sci. Total Environ. 2020, 698, 134254. [Google Scholar] [CrossRef] [PubMed]
  4. Wright, S.L.; Thompson, R.C.; Galloway, T.S. The physical impacts of microplastics on marine organisms: A review. Environ. Pollut. 2013, 178, 483–492. [Google Scholar] [CrossRef]
  5. Yang, D.; Shi, H.; Li, L.; Li, J.; Jabeen, K.; Kolandhasamy, P. Microplastic Pollution in Table Salts from China. Environ. Sci. Technol. 2015, 49, 13622–13627. [Google Scholar] [CrossRef]
  6. Jeong, B.; Baek, J.Y.; Koo, J.; Park, S.; Ryu, Y.K.; Kim, K.S.; Zhang, S.; Chung, C.; Dogan, R.; Choi, H.S.; et al. Maternal exposure to polystyrene nanoplastics causes brain abnormalities in progeny. J. Hazard. Mater. 2022, 426, 127815. [Google Scholar] [CrossRef]
  7. Li, L.; Xu, Y.; Li, S.; Zhang, X.; Feng, H.; Dai, Y.; Zhao, J.; Yue, T. Molecular modeling of nanoplastic transformations in alveolar fluid and impacts on the lung surfactant film. J. Hazard. Mater. 2022, 427, 127872. [Google Scholar] [CrossRef]
  8. Al-Sid-Cheikh, M.; Rowland, S.J.; Stevenson, K.; Rouleau, C.; Henry, T.B.; Thompson, R.C. Uptake, Whole-Body Distribution, and Depuration of Nanoplastics by the Scallop Pecten maximus at Environmentally Realistic Concentrations. Environ. Sci. Technol. 2018, 52, 14480–14486. [Google Scholar] [CrossRef]
  9. Wang, S.; Zhong, Z.; Li, Z.; Wang, X.; Gu, H.; Huang, W.; Fang, J.K.-H.; Shi, H.; Hu, M.; Wang, Y. Physiological effects of plastic particles on mussels are mediated by food presence. J. Hazard. Mater. 2021, 404, 124136. [Google Scholar] [CrossRef]
  10. Guo, X.; Cai, Y.; Ma, C.; Han, L.; Yang, Z. Combined toxicity of micro/nano scale polystyrene plastics and ciprofloxacin to Corbicula fluminea in freshwater sediments. Sci. Total Environ. 2021, 789, 147887. [Google Scholar] [CrossRef]
  11. Manzo, S.; Schiavo, S. Physical and chemical threats posed by micro (nano)plastic to sea urchins. Sci. Total Environ. 2022, 808, 152105. [Google Scholar] [CrossRef] [PubMed]
  12. Dedman, C.J.; Christie-Oleza, J.A.; Fernandez-Juarez, V.; Echeveste, P. Cell size matters: Nano- and micro-plastics preferentially drive declines of large marine phytoplankton due to co-aggregation. J. Hazard. Mater. 2022, 424, 127488. [Google Scholar] [CrossRef] [PubMed]
  13. Lin, W.; Jiang, R.; Xiong, Y.; Wu, J.; Xu, J.; Zheng, J.; Zhu, F.; Ouyang, G. Quantification of the combined toxic effect of polychlorinated biphenyls and nano-sized polystyrene on Daphnia magna. J. Hazard. Mater. 2019, 364, 531–536. [Google Scholar] [CrossRef] [PubMed]
  14. Liu, Z.; Li, Y.; Perez, E.; Jiang, Q.; Chen, Q.; Jiao, Y.; Huang, Y.; Yang, Y.; Zhao, Y. Polystyrene nanoplastic induces oxidative stress, immune defense, and glycometabolism change in Daphnia pulex: Application of transcriptome profiling in risk assessment of nanoplastics. J. Hazard. Mater. 2021, 402, 123778. [Google Scholar] [CrossRef]
  15. Pitt, J.A.; Kozal, J.S.; Jayasundara, N.; Massarsky, A.; Trevisan, R.; Geitner, N.; Wiesner, M.; Levin, E.D.; Di Giulio, R.T. Uptake, tissue distribution, and toxicity of polystyrene nanoparticles in developing zebrafish (Danio rerio). Aquat. Toxicol. 2018, 194, 185–194. [Google Scholar] [CrossRef]
  16. Yu, Z.; Zhang, L.; Huang, Q.; Dong, S.; Wang, X.; Yan, C. Combined effects of micro-/nano-plastics and oxytetracycline on the intestinal histopathology and microbiome in zebrafish (Danio rerio). Sci. Total Environ. 2022, 843, 156917. [Google Scholar] [CrossRef]
  17. Cole, M.; Lindeque, P.; Fileman, E.; Halsband, C.; Goodhead, R.; Moger, J.; Galloway, T.S. Microplastic ingestion by zooplankton. Environ. Sci. Technol. 2013, 47, 6646–6655. [Google Scholar] [CrossRef]
  18. Sun, X.; Chen, B.; Li, Q.; Liu, N.; Xia, B.; Zhu, L.; Qu, K. Toxicities of polystyrene nano- and microplastics toward marine bacterium Halomonas alkaliphile. Sci. Total Environ. 2018, 642, 1378–1385. [Google Scholar] [CrossRef]
  19. Chu, Q.; Zhang, S.; Yu, X.; Wang, Y.; Zhang, M.; Zheng, X. Fecal microbiota transplantation attenuates nano-plastics induced toxicity in Caenorhabditis elegans. Sci. Total Environ. 2021, 779, 146454. [Google Scholar] [CrossRef]
  20. Nyeste, K.; Dobrocsi, P.; Czegledi, I.; Czedli, H.; Harangi, S.; Baranyai, E.; Simon, E.; Nagy, S.A.; Antal, L. Age and diet-specific trace element accumulation patterns in different tissues of chub (Squalius cephalus): Juveniles are useful bioindicators of recent pollution. Ecol. Indic. 2019, 101, 1–10. [Google Scholar] [CrossRef]
  21. Yancheva, V.; Georgieva, E.; Velcheva, I.; Iliev, I.; Stoyanova, S.; Vasileva, T.; Bivolarski, V.; Todorova-Bambaldokova, D.; Zulkipli, N.; Antal, L.; et al. Assessment of the exposure of two pesticides on common carp (Cyprinus carpio Linnaeus, 1758): Are the prolonged biomarker responses adaptive or destructive? Comp. Biochem. Phys. C. 2022, 261, 109446. [Google Scholar]
  22. Zhang, T.R.; Wang, C.X.; Dong, F.Q.; Gao, Z.Y.; Zhang, C.J.; Zhang, X.J.; Fu, L.M.; Wang, Y.; Zhang, J.P. Uptake and Translocation of Styrene Maleic Anhydride Nanoparticles in Murraya exotica Plants as Revealed by Noninvasive, Real-Time Optical Bioimaging. Environ. Sci. Technol. 2019, 53, 1471–1481. [Google Scholar] [CrossRef] [PubMed]
  23. Liu, Y.; Guo, R.; Zhang, S.; Sun, Y.; Wang, F. Uptake and translocation of nano/microplastics by rice seedlings: Evidence from a hydroponic experiment. J. Hazard. Mater. 2022, 421, 126700. [Google Scholar] [CrossRef]
  24. Du, J.; Qv, W.; Niu, Y.; Qv, M.; Jin, K.; Xie, J.; Li, Z. Nanoplastic pollution inhibits stream leaf decomposition through modulating microbial metabolic activity and fungal community structure. J. Hazard. Mater. 2022, 424, 127392. [Google Scholar] [CrossRef] [PubMed]
  25. Tansil, N.C.; Li, Y.; Koh, L.D.; Peng, T.C.; Win, K.Y.; Liu, X.Y.; Han, M.Y. The use of molecular fluorescent markers to monitor absorption and distribution of xenobiotics in a silkworm model. Biomaterials 2011, 32, 9576–9583. [Google Scholar] [CrossRef]
  26. Zheng, X.; Zhao, M.; Zhang, H.; Fan, S.; Shao, H.; Hu, X.; Zheng, Y. Intrinsically Fluorescent Silks from Silkworms Fed with Rare-Earth Upconverting Phosphors. ACS Biomater. Sci. Eng. 2018, 4, 4021–4027. [Google Scholar] [CrossRef]
  27. Li, Z.; Zhang, Y.; Jiang, S. Multicolor Core/Shell-Structured Upconversion Fluorescent Nanoparticles. Adv. Mater. 2008, 20, 4765. [Google Scholar] [CrossRef]
  28. Kamimura, M.; Yano, Y.; Kuraoka, S.; Suyari, S.; Ube, T.; Wortmann, L.; Soga, K. Near-Infrared to Visible Upconversion Emission Induced Photopolymerization: Polystyrene Shell Coated NaYF4 Nanoparticles for Fluorescence Bioimaging and Nanothermometry. J. Photopolym. Sci. Technol. 2017, 30, 265–270. [Google Scholar] [CrossRef]
  29. Wang, F.; Deng, R.; Wang, J.; Wang, Q.; Han, Y.; Zhu, H.; Chen, X.; Liu, X. Tuning upconversion through energy migration in core-shell nanoparticles. Nat. Mater. 2011, 10, 968–973. [Google Scholar] [CrossRef]
  30. Zhou, J.; Liu, Q.; Feng, W.; Sun, Y.; Li, F. Upconversion Luminescent Materials: Advances and Applications. Chem. Rev. 2015, 115, 395–465. [Google Scholar] [CrossRef]
  31. Wang, Y.; Kuang, C.; Gu, Z.; Xu, Y.; Li, S.; Hao, X.; Liu, X. Time-gated stimulated emission depletion nanoscopy. Opt. Eng. 2013, 52, 093107. [Google Scholar] [CrossRef]
  32. Clark, N.J.; Khan, F.R.; Mitrano, D.M.; Boyle, D.; Thompson, R.C. Demonstrating the translocation of nanoplastics across the fish intestine using palladium-doped polystyrene in a salmon gut-sac. Environ. Int. 2022, 159, 106994. [Google Scholar] [CrossRef] [PubMed]
  33. Tian, L.; Chen, Q.; Jiang, W.; Wang, L.; Xie, H.; Kalogerakis, N.; Ma, Y.; Ji, R. A carbon-14 radiotracer-based study on the phototransformation of polystyrene nanoplastics in water versus in air. Environ. Sci.-Nano 2019, 6, 2907–2917. [Google Scholar] [CrossRef]
  34. Thompson, H.W.; Mera, R.; Prasad, C. A Description of the Appropriate Use of Student’s t-test. Nutr. Neurosci. 1998, 1, 165–172. [Google Scholar] [CrossRef] [PubMed]
  35. Zhang, Y.-H.; Wang, R.-Y.; Wang, Z.-J.; Shao, Q.-Q.; Hu, Y.-W.; Jia, H.-B.; Liu, X.-J.; Dong, F.-Q.; Fu, L.-M.; Zhang, J.-P. Daphnia magna uptake and excretion of luminescence-labelled polystyrene nanoparticle as visualized by high sensitivity real-time optical imaging. Chemosphere 2023, 326, 138341. [Google Scholar] [CrossRef]
  36. Jimenez-Lamana, J.; Marigliano, L.; Allouche, J.; Grassl, B.; Szpunar, J.; Reynaud, S. A Novel Strategy for the Detection and Quantification of Nanoplastics by Single Particle Inductively Coupled Plasma Mass Spectrometry (ICP-MS). Anal. Chem. 2020, 92, 11664–11672. [Google Scholar] [CrossRef]
  37. Demir, E.; Demir, F.T. Drosophila melanogaster as a dynamic in vivo model organism reveals the hidden effects of interactions between microplastic/nanoplastic and heavy metals. J. Appl. Toxicol. 2023, 43, 212–219. [Google Scholar] [CrossRef]
Figure 1. Conceptual diagram of experiment process.
Sustainability 15 07090 g001
Figure 2. The schematic structure of UCNPs-labelled NP fluorescent probe.
Sustainability 15 07090 g002
Figure 3. (A) TEM images of UCNPs-labelled NP; (B) The size distribution diagram of UCNPs-labelled NP; (C) Luminescence spectrum of pure and recycled UCNPs-labelled NP at the excitation wavelength of 980 nm; (D) The photostability of NP in aqueous phase (900 μg/mL).
Sustainability 15 07090 g003
Figure 4. (A,B) Growth curve of silkworms through larval stage by ingestion and excretion; (C) Size of a single cocoon. Bars represent the means ± SD of the control and experimental groups. Different letters indicate significant differences among treatments (p < 0.05); (D) Weight of a single cocoon. Bars represent the means ± SD of the control and experimental groups. Different letters indicate significant differences among treatments (lowercase for Length, and capital letters for Width; p < 0.05).
Sustainability 15 07090 g004
Figure 5. Superimposed images of sections by TGI and distribution data of the NPs intake by ICP-MS of important organs (head, digestive tract, fat body, silk gland, and excrement) in silkworm in NPs-900 ppm groups. Internal: total amount of NPs that were preserved internally; Total: total amount of NPs that were ingested by the silkworm.
Sustainability 15 07090 g005
Figure 6. (A) Bright-field, (B) TGI and (C) superimposed images of the silk sample from a cocoon in NPs-900 ppm groups; (D) SEM images of the same sample. The upper right inset showed the higher- resolution observations for the indicated region of interests (ROI).
Sustainability 15 07090 g006
Figure 7. (AC) Superimposed, (DF) TGI and (GI) bright-field images of the silkworm egg samples in NPs-900 ppm groups.
Sustainability 15 07090 g007
Table 1. Distribution of the NPs intake in main sinks for silkworms in Control and NPs-900 ppm groups.
TreatmentOrganDry Weight (g)Concentration of NPs (mg/kg)/Detection LimitContent of NPs (μg)
ControlHead0.00740.2/0.4/
Digestive tract0.01980.95/0.09/
Silk gland0.25210.12/0.01/
Fat body0.20790.15/0.01/
Excrement2.88060.03/0.03/
NPs-900 ppmHead0.004534.0/0.30.142
Digestive tract0.013625.58/0.070.340
Silk gland0.17470.72/0.020.126
Fat body0.16407.78/0.021.275
Excrement1.73581344.07/0.032.3 × 103
Disclaimer/Publisher’s Note: The statements, opinions and data contained in all publications are solely those of the individual author(s) and contributor(s) and not of MDPI and/or the editor(s). MDPI and/or the editor(s) disclaim responsibility for any injury to people or property resulting from any ideas, methods, instructions or products referred to in the content.

