Abstract
Real-world applications often involve imbalanced datasets, which have different distributions of examples across various classes. When building a system that requires a high accuracy, the performance of the classifiers is crucial. However, imbalanced datasets can lead to a poor classification performance and conventional techniques, such as synthetic minority oversampling technique. As a result, this study proposed a balance between the datasets using adversarial learning methods such as generative adversarial networks. The model evaluated the effect of data augmentation on both the balanced and imbalanced datasets. The study evaluated the classification performance on three different datasets and applied data augmentation techniques to generate the synthetic data for the minority class. Before the augmentation, a decision tree was applied to identify the classification accuracy of all three datasets. The obtained classification accuracies were 79.9%, 94.1%, and 72.6%. A decision tree was used to evaluate the performance of the data augmentation, and the results showed that the proposed model achieved an accuracy of 82.7%, 95.7%, and 76% on a highly imbalanced dataset. This study demonstrates the potential of using data augmentation to improve the classification performance in imbalanced datasets.
1. Introduction
Any artificial intelligence application is mainly dependent on data [1]. Due to its numerous uses, AI has been incorporated in many areas such as healthcare [2,3,4,5], agriculture [6,7], multi-class image classification [8], image caption prediction [9], fake image identification [10], and other purposes [11,12,13]. In the majority of real-world classification applications, the training data shows a distribution with a long tail. It means that the training data is spread out. This is because few classes are abundant whereas other classes are limited [14,15]. Over the last several years, the research community has been interested in learning from imbalanced data. Various researchers attempted to solve binary-class imbalanced problems [16]. When various labels are present, the proposed solutions for binary-class problems may not be directly applicable or may perform poorly. Most real-world problems are multi-class problems. Machine learning is a well-known research field in computer science that employs several algorithms to extract useful information from the datasets. However, imbalanced data can lead to biased models [17], which may have negative impacts on marginalized communities and the environment. For example, a biased model may lead to the misclassification of environmental data, such as air quality, which could have significant consequences for public health and the environment. Another example could be the wrong classification of a COVID-19 patient as a non-COVID-19 patient, resulting in a huge losses. Using adversarial approaches to address imbalanced data can help mitigate these risks by ensuring that the models are trained on a more representative and balanced dataset. This can lead to more accurate and fair predictions, which in turn can help support sustainable decision-making and policies.
Furthermore, sustainable development requires us to consider the needs and perspectives of all stakeholders, including those who may be underrepresented or marginalized. By using adversarial approaches to tackle imbalanced data, we can ensure that these stakeholders are properly represented in our models and decision-making processes. Using adversarial approaches to tackle imbalanced data in machine learning is an important step towards building more sustainable and equitable systems. By addressing the imbalances in our data and models, we can ensure that our algorithms are fair, accurate, and representative.
It is evident in the literature that various solutions have been proposed to address the issue of class imbalance, and these can be broadly classified into three types. (1) Methods for cost-sensitive learning [18,19], which utilize the costs of misclassifying samples and attempts to make the classifiers more favorable to the minority class, by incorporating different cost factors into the algorithms,. (2) Methods based on resampling [20], which use undersampling or oversampling techniques to balance the class-imbalanced dataset [21,22]. (3) Methods based on ensemble learning [23], Which attempt to enhance the accuracy of the imbalanced data classification by combining multiple classifiers to create a new and more effective classifier. However, these techniques have a few limitations. (1) They fail to generate diverse data samples, (2) they add noise to the dataset, and (3) they can only generate a specific type of distribution. Recently, deep generative models [24] have achieved great success due to its high learning capability. Ian Goodfellow in [25] introduced generative adversarial networks (GANs) for generating images using random values. These models combine two neural networks to form a deep metric classifier. The GAN architecture is composed of a generator and a discriminator that are trained to outwit each other, thus the term “adversarial”. The generator network learns to adjust the distribution and generate a new reliable distribution, while the discriminator learns to distinguish between the real and augmented data.
Originally, GANs were developed for generating images. However, various researchers have applied these models in different domains, such as audio generation [26], semi-supervised EEG data [15], super-resolution [27], etc. In [28], the authors used the GAN model to generate a dataset and then used a multi-scale convolutional neural network (CNN) to identify the cause of the diagnosis of the harmonic drive. In another paper [29], the authors used GANs to generate images for recognizing facial emotions.
1.1. Motivation
In general, in real-world applications, a dataset with an imbalance ratio (IR) greater than 10:1 is regarded as highly imbalanced [21]. It means that the machine learning methods favor majority class samples and typically perform poorly when applied on a highly imbalanced dataset. In the paper [30], the authors demonstrated the impact of the IR on the model classification performance. They used the Abalone19 data set [31] and started their work using IR 1:1, eventually increasing it to 129:1 by adding more samples. They found that by adjusting the IR, the performance of the model degraded. According to other studies [19,23,31,32], the classification performance on the balanced dataset was better than on the imbalanced data. Despite extensive research on imbalanced data, researchers continue to identify pertinent issues that must be addressed. One of them involves dealing with a variety of multi-class minority groups. Due to the complex nature of the problem, a multi-class imbalanced classification is more challenging than a binary-class imbalanced classification.
Moreover, the traditional data augmentation techniques [33,34,35], such as oversampling and undersampling, remove considerable amount of data belonging to the majority class, which results in the loss of its important features. The conventional techniques can generate only specific types of distributions. Unlike the generative models, those techniques do not learn the underlying distribution of the dataset. Further, the real-world datasets consist of mixed datatypes, such as categorical, numerical, float, spatiotemporal, and so on.
Motivated by the above analysis, the main goal of our work was to explore the newly proposed adversarial learning networks for generating data to solve the data imbalance problem. In practice, some challenges still exist, including (1) validating the similarity between the generated data and the original dataset, (2) generating the augmented data from a mixed data distribution using a single GAN model, and (3) performing a deterministic inverse transformation of the augmented data. The main objective of our work was not to achieve a high accuracy but to see whether we could replace the traditional data augmentation techniques with new techniques. The new data augmentation techniques based on GANs have more advantages than the traditional ones and they can generate data from any distribution.
1.2. Contribution
The main contributions of our work are summarized below.
- We proposed to utilize a GAN model to augment the dataset and solve the imbalanced dataset problem by analyzing its performance on various real-world multi-class datasets.
- To generate more realistic data, an input layer was incorporated with the GAN in order to ensure that the augmented data resembles the real data.
- We ran a series of demonstrations on three highly imbalanced datasets from various fields.
- We introduced model-level approaches for assessing the quality of the generated data using the GAN.
2. Related Work
Due to the immense utilization of deep learning in the area of supervised learning [36,37], the GANs for real-world datasets face multiple challenges. The challenges include multi-datatypes, random distributions, and high-dimensional data. Choi et al., in [38] introduced a novel GAN model called the medical GAN (MedGAN). In their work, they used an autoencoder to convert the categorical data into a latent space where the generator model could learn its characteristics. However, they evaluated their dataset only using the binary class. The authors in [39] presented a novel method called the CorrGAN (correlated GAN) to generate synthetic discrete data. To approach this idea, the author’s main goal was to build an AI (artificial intelligence) agent based on a text career. They used a vanilla autoencoder to transform the discrete data into a continuous space. They found out that their proposed model performed better when it captured the deep correlation within the data. However, the performance might have increased if they conditioned their model with some parameters.
To solve the problem of the missing values in the dataset, the authors in [40] proposed a novel method called the generative adversarial imputation network (GAIN). By gaining knowledge of the parameters of a latent variable moment, the authors proposed a new model called TensorGen to generate synthetic data. Further, they also compared their model to the MedGAN and found that their model performed better. The reason behind this was that their model did not suffer from a mode collapse. However, they evaluated their model only using a binary classified dataset. In [41], the authors proposed a novel method based on different GAN architectures to generate multi-categorical values for the discrete dataset. They modified the autoencoder of the MedGAN, the adversarially regularized autoencoder (ARAE), and the generator of the GumbelGAN and Wasserstein GAN-gradient penalty (WGAN-GP) by introducing dense layers in the Softmax layers. They concluded that all the new variants improved the overall performance compared to the state-of-the-art methods, but they could not establish the best model. They only used a few metrics to evaluate the quality of the synthetic data. In order to preserve the privacy of any database, the authors in [42] developed a model that could generate synthetic data from suitable dataset. The model was called the incomplete table synthesis GAN (ITS-GAN). The main goal of this model was to generate synthetic data while maintaining the record-wise functional dependencies and column-wise distribution statistics. It accomplished this by first training the autoencoder on each functional dependency and then training the generator with the statistic and functional dependency information. Finally, to capture the functional dependency constraints, the pre-trained autoencoder was used to train the discriminator. However, did not evaluate their model using noisy datasets to check their performance. To generate high-quality patient-centric data, [43] proposed a novel method called the sequentially coupled GAN (SC-GAN). The proposed model consisted of two layers of LSTM which acted as a generator and a single layer of bidirectional LSTM which acted as a discriminator. However, using coupled GANs increased the computational cost and was highly unstable. The GAN based on the conditional Wasserstein was proposed in [44] to generate synthetic imbalanced datasets that had numerical as well as categorical variables. They discovered that their model performed better only on non-linear datasets.
In another work [45], the authors proposed continuous RNN-GANs in which they used the bidirectional recurrent neural network as the discriminator. They established that adversarial learning with recurrent neural networks is capable of generating diverse music collections. But they evaluated their model only on a single dataset.
In our work, we proposed a novel GAN-based model to solve the problem of imbalanced datasets. The main difference between our proposed methodology and the existing work is as follows.
- Most of the researchers evaluated their models only on binary-class imbalanced datasets. We applied the GAN to a multi-class dataset.
- The existing works evaluated their models only on one type of dataset.
- None of the previous works assessed their models using classifier approaches.
3. Proposed Methodology
In this section, we describe the design and the basic architecture of the GAN model for augmenting the data. Our proposed methodology is divided into three subsections.
- In the first subsection, we describe the basic principle of GANs.
- In the second subsection, we describe the proposed GAN model used in our work.
- In the third subsection, we illustrate the decision tree as the base classifier.
The proposed methodology is shown in Figure 1.
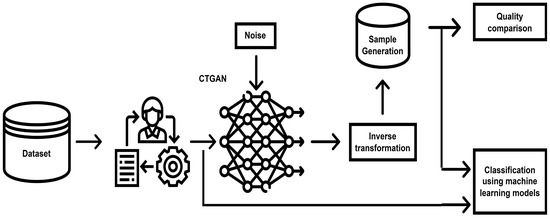
Figure 1.
Proposed framework.
3.1. Generative Adversarial Network
The goal of the GAN is to understand the underlying data distribution and generate the same output [46]. The purpose of generating the augmented data is to solve the imbalanced problem. A standard GAN is composed of neural networks that are trained against each other, known as the generator and the discriminator. The GAN’s main principle is to use adversarial learning to enhance the quality of the synthetic data. The generator is trained to generate realistic synthesized data from a random noise vector z in order to fool the discriminator and prevent the augmented data from being recognized as artificial samples. Conversely, the discriminator is fed the original training data and the augmented samples produced by the generator as the input. Then, it is trained to differentiate between the augmented samples and the original data. The discriminator returns the likelihood that a few samples will correspond to the potential sources of the data. The loss function of the generator and discriminator is shown below.
where and represent the generator and discriminator gradient, is the discriminator’s output for the real data, and represents the discriminator’s output for the augmented data. The main objective for training a discriminator is to increase the loss function, which means maximizing the probability of predicting the correct data source. In contrast, the goal of training a generator is to minimize the second-term present in Equation (1). This is conducted in order to confuse the discriminator. The GAN is trained using the stochastic gradient descent (SGD) by changing the parameters of the model based on the objective function to achieve a good discriminator and generator pair.
3.2. Proposed GAN
The conditional GAN, developed by Mirza et al. in [47], is an extension of the original GAN which conditions the generator and discriminator using the label information. The addition of extra information, i.e., the labels, is achieved by introducing an input layer into the neural network of the generator and discriminator. Therefore, the loss function changes to the following.
The random input noise and labels are combined in the generator to form a joint hidden representation. X and Y are the input for a discriminative function in the discriminator. The basic architecture of a conditional GAN is shown in Figure 2.
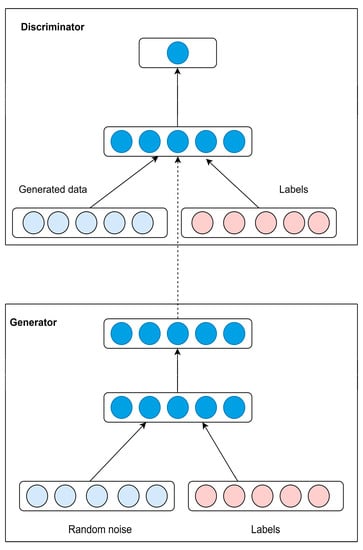
Figure 2.
The architecture of conditional GAN.
To represent the input noise vector with the labels as a joint representation, the embedding and element-wise multiplication is conducted. It is done by converting the label information into a dense vector using an embedding layer from Keras. The addition of a feature vector controls the output and helps the generator figure out what to do. Afterwards, the multiplied layer from Keras is used to combine the label embedding with the noise vector. This layer produces a single vector of the final products by multiplying the corresponding entries of the two equal length vectors. This resulting vector is fed as an input to the GAN architecture, as shown in Figure 3. A noise prior z is drawn from a uniform distribution within the unit hypercube in the generator net. Both z and y are mapped onto the hidden layers using the rectified linear unit (ReLu) activation. Afterwards, it is mapped onto a combined second hidden ReLu layer.
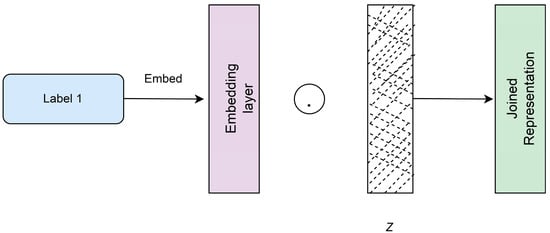
Figure 3.
The architecture for integrating the random noise vector and the labels into a single joint representation.
3.3. Decision Tree
The decision tree is a multi-node directional tree [48]. The root node is the first node in a tree and has no input. An internal node has both an input and an output. Additionally, the other nodes can only have one input, which is referred to as a leaf node or a decision node. The internal nodes divide the sample count into two or more sub-samples. This is accomplished by employing a specific probability index, such as entropy or Gini. The connection points between the branches represent the discrimination conditions. The leaf nodes at the branches’ ends represent the categories to which the records belong. Finally, the class with the best response values is assigned to each node or leaf. There are several decision tree algorithms that are applicable to discrete and continuous features, including C4.5, C5.0, CART, and the logistics tree.
4. Experimental Framework
In this section, we first describe the real-world multiple-class imbalanced problems that were used in the experiments. Following that, we present the statistical tests and classification metrics used to compare the results after augmenting the data.
4.1. Datasets
There is no agreement among the researchers on which constraints must be set for a given data set to address the data imbalance problems, whether for binary-class or multi-class problems. One of the datasets is highly imbalanced, as shown in Figure 4. The structured data refers to a two-dimensional matrix X with rows representing the samples x and columns representing the variables. The text and image data, for example, display a fixed vocabulary of tokens or a value range representing the color intensity for each input variable. The domain of the input variables in the tabular data is wide ranging and can be distinctive for each column. In this paper, we utilized three different data sets. Therefore, the challenges that were faced while working with the real-world datasets are summarized.
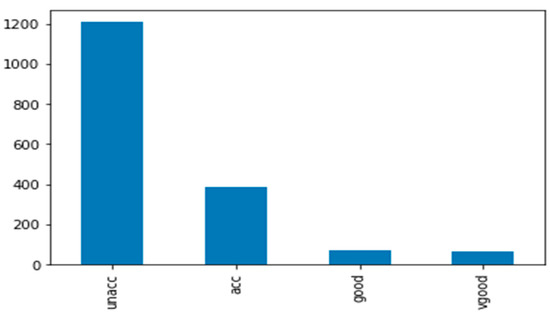
Figure 4.
Imbalanced car datasets. The dataset consists of four classes in which acc, good, and vgood are the minority ones.
- Modeling numerical dataset variables: Although numerical values are easy to augment, it is very important to look after them in the case of tabular data generation. The real-world dataset may consist of multiple- modes.
- Modeling datasets with categorical variables: The loss attribute, for example, is a feature in credit scoring that frequently exhibits bi-modal distributions with peaks at 0 and 1. In this case, the generator should learn how to generate these specific modes on a regular basis. However, generating the exact values for float numbers is a difficult task since the discriminator may learn to reject all the samples that are close to a frequent mode. As a result, only those samples are likely to be generated by a generator intending to output a frequent mode.
4.1.1. Car Evaluation
The dataset used in this study was obtained from the UCI dataset repository and consisted of a collection of records donated by Marco Bohanec in 1997. The attributes of the dataset are summarized in Table 1. Further, the table also shows the number of samples per class. In the case of the pre-processing step, we checked and removed the missing values. The whole dataset was divided into four classes: unacceptability, acceptability, good, and very good.

Table 1.
Class distribution using the car evaluation dataset.
4.1.2. Human Activity Recognition Using a Smartphone
This dataset [49] was collected from 30 subjects using a Samsung smartphone. The subjects were asked to perform various activities, such as walking, walking upstairs, walking downstairs, sitting, standing, and laying. The dataset was split into training (70%) and testing (30%) ratios. This dataset was not as imbalanced as the car evaluation, as shown in Figure 5. For pre-processing, we cross-checked the missing values and no missing values were identified.
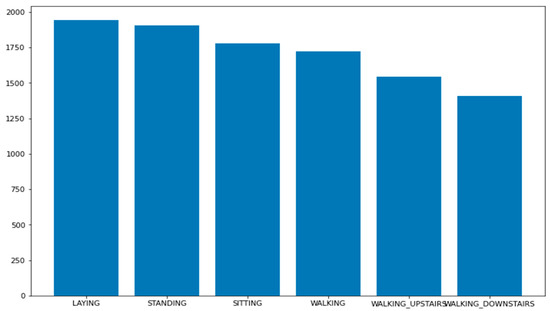
Figure 5.
Human activity recognition data distribution. This dataset was not highly imbalanced.
4.1.3. Banking Dataset
This dataset was created by [50] while taking into consideration the real dataset from a Portuguese bank. The main goal of the classification of this model was to predict whether or not a client would make a deposit. Therefore, it is a binary classification problem. The data distribution is shown in Figure 6.
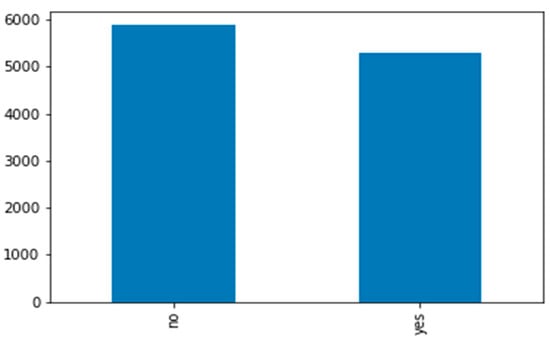
Figure 6.
Bank evaluation data distribution. It was a binary dataset and not highly imbalanced.
4.2. Experimental Configuration
To evaluate the performance of the conditional tabular GAN on the imbalance datasets, different real-world datasets were generated. The imbalance class distribution was common in real-world applications. In our study, we selected three datasets belonging to three different domains. These included the car evaluation dataset, the human action recognition dataset, and the bank dataset. The car evaluation dataset was the most imbalanced. To investigate the performance of the conditional tabular GAN, we trained the proposed model on all the original datasets. After fitting the data to the model, we applied the proposed model to generate the synthetic data and add the augmented data to the original datasets, respectively. For classification purposes the datasets were split into training, validation and testing subsets into the ratio of 8:1:1 respectively. In this way, we were able to solve the problem of the data imbalance. The proposed GAN architecture modeled the numerical and categorical columns using tabular data. The categorical columns were modeled by encoding the Gumbel-Softmax activation function as discussed before. The details of the datasets are presented in Table 2.
Table 2.
Summary of the datasets.
We used the Windows 10 operating system with a GPU of 256 GB RAM. Further, we used the TensorFlow 2.7.0, NumPy 1.21.4, and Matplot 3.5.1 for our implementation. It was noted that those different datasets required different computational costs for completion. Among the three, the human action recognition dataset took the longest time, followed by the bank dataset. The car evaluation dataset took significantly less time compared to the other two datasets. In the case of the car evaluation dataset, the “acc”, “good”, and “vgood” classes had only 400, 100, and 150 samples whereas the “unacc” class had 1200 datasets. This meant it was a highly imbalanced dataset. After completing the training, we generated the samples according to the imbalanced distribution of the dataset. In the case of the car evaluation dataset, we generated 800 samples for the “acc” class, 1000 for “good”, and 1050 for “vgood”, respectively. Similarly, in the case of the human activity recognition dataset, we generated 65 samples for the standing class, 150 for sitting, 200 for walking, 350 for walking upstairs, and 400 for walking downstairs. Although this dataset was not highly imbalanced, our aim in this study was to analyze the performance of the conditional tabular GAN on the different datasets. In the case of the bank dataset, we generated 600 datasets for the “yes” class.
By using the conditional tabular GAN as an augmentation technique, we used a decision tree as a classifier for the evaluation since the decision tree was sensitive to the imbalanced data. To stabilize the GAN training, the conditional GAN modified the objective functions of the generators and discriminators [51]. By appending the class label y to both the generator and the discriminator input, the generator was conditioned to generate the samples that belonged to a specific class. As a result, the generator approximated the real distribution, and the discriminator learned to estimate and differentiate between the real and fake data. The handling of the hyperparameters was a critical decision in the classifier comparisons. We used manual selection and a random Grid search algorithm to identify the optimal hyper parameters. The individual classifiers and oversampling methods both had hyperparameters. In the proposed model, the various hyperparameters included the epochs, batch size, log frequency, embedding dimension, generator dimension, discriminator dimension, generator learning rate, discriminator learning rate, generator decay rate, discriminator decay rate, and discriminator steps. These hyperparameters were crucial for this model. A thorough optimization of all the hyperparameters for each dataset provided an advantage for the proposed method over the benchmarks. As a result, we performed hyperparameter tuning on all three datasets. The descriptions of all the hyperparameters are shown in Table 3.
Table 3.
Hyperparameters present in the conditional tabular GAN.
We performed the experiments using the default hyperparameters on all three datasets. The results are discussed in the next section.
4.3. Results
We proposed a conditional tabular GAN model on three different real-world datasets. To summarize the results, the precision, f1 score, recall, and accuracy are reported in Table 4. Note that the conditional tabular can be applied to the tables with mixed values. Therefore, we applied it as a whole on all three datasets. Through our work, tested whether the conventional techniques could be replaced by GANs and whether it would improve the classification accuracy. Table 4 shows the performance results of three different datasets before implementing the data augmentation technique. Whereas Figure 7 shows the confusion metrics before performing the data augmentation.
Table 4.
Performance results on the three datasets before the data augmentation.
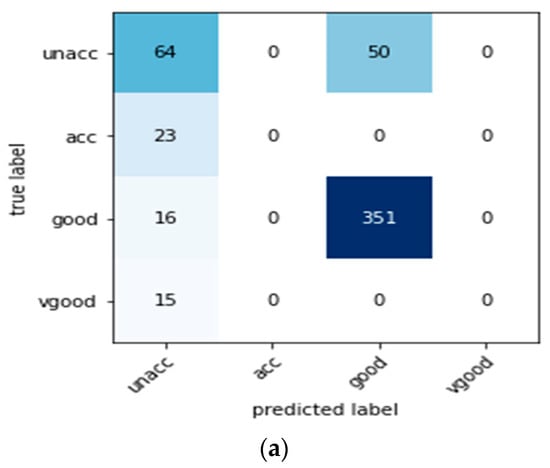
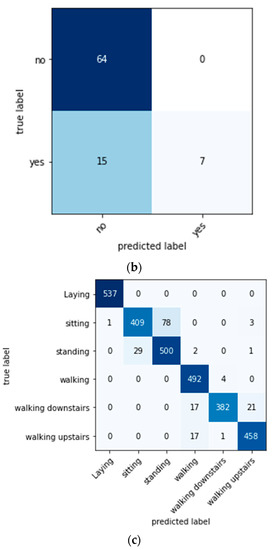
Figure 7.
Confusion metrics before performing the data augmentation: (a) the car evaluation dataset, (b) the bank dataset, and (c) the human activity recognition dataset.
It is evident from Table 4 that the accuracy achieved by a highly imbalanced dataset (car evaluation) was 79.9%. The data augmentation using the conditional tabular GAN was our main focus, however we also wanted to assess the effect of the data augmentation on the time series and another dataset as well. Therefore, we performed the same procedure on the other two datasets. Before augmenting, the accuracy achieved on the human activity recognition was 94.1% and the bank dataset was 72.6%.
Figure 8 shows the car dataset distribution after incorporating data augmentation. After applying the conditional tabular GAN, the obtained results are shown in Table 5. The confusion metrics obtained after the augmentation are shown in Figure 9.
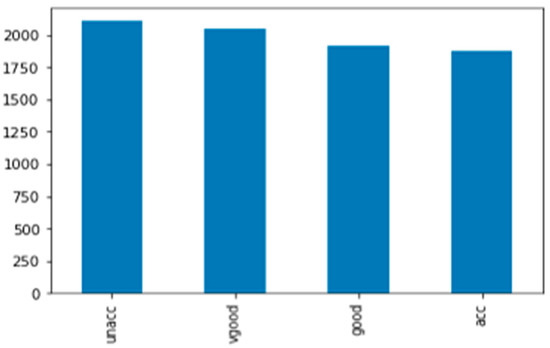
Figure 8.
Car dataset distribution after augmentation.
Table 5.
Performance results on three datasets after the data augmentation.
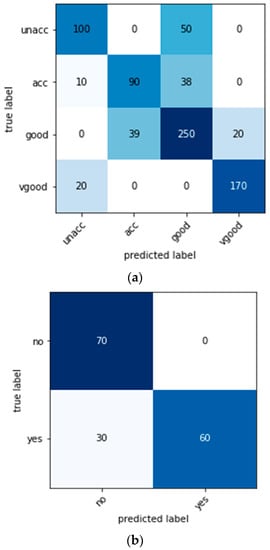
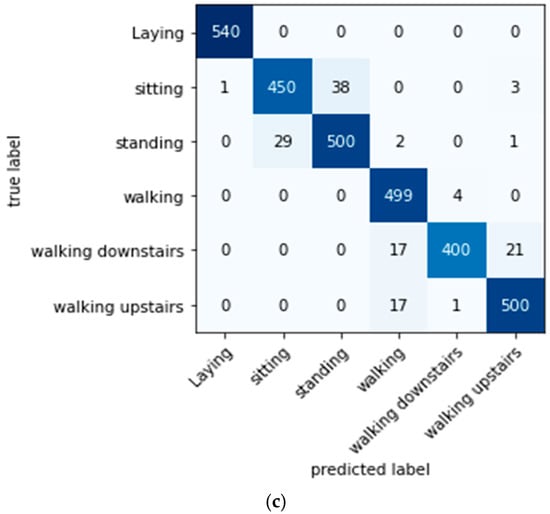
Figure 9.
Confusion metrics after performing the data augmentation using the GAN model: (a) the car evaluation dataset, (b) the bank dataset, and (c) the human activity recognition dataset.
4.4. Comparison of Model Performance
In this section, the proposed model was further compared to the other data augmentation techniques, as shown in Table 6. We compared the proposed model to the conventional data augmentation technique, i.e., the synthetic minority oversampling technique (SMOTE) and the other GAN model.
Table 6.
Performance of the different models compared to the GAN-based model.
Table 6 indicates that various models were put forth for various datasets in or der to solve the class imbalance problem. We compared the proposed model using conventional data augmentation and generative network-based models since we implemented a proposed model on three datasets belonging to different domains. Therefore, we compared the proposed model to the state-of-the-art techniques that were implemented on the various datasets, including the bank, human activity, heart disease, and diabetic datasets. From the table, it was clear that proposed model performed better than the other models. However, the accuracy that was achieved on the bank dataset using the GAN was lower compared to the SMOTE + bagging. This might have been because the later model was a hybrid. It can be considered as a future direction, and we will try to improve it.
5. Discussion
This paper provided data augmentation based on a GAN for managing multi-class imbalanced datasets. In this work, we addressed the problem of class imbalance. Researchers devised a number of techniques to solve the imbalance problem. However, the conventional techniques were only able to generate few types of distribution. The selection of an efficient model for the data augmentation was important to solve the data imbalance problem. In our work, we proposed an extension to the standard GAN by modifying the architecture. The original standard GAN was extended to the hyperparameters so that adversarial learning was fully utilized. We established a scalable study by applying the data augmentation to three different datasets. Following that, the decision tree classifier was used to evaluate the effectiveness of our method. The classification performance without the data augmentation is shown in Table 4. The highest accuracy of approx. 96% was achieved on the human activity recognition dataset whereas the lowest accuracy of 72% was achieved on the bank dataset. From this, we concluded that the real-world imbalanced datasets showed a poor to moderate classification accuracy. This might have been because the model can be biased towards the majority class. Therefore, we used a conditional tabular GAN on all three datasets. The achieved performance is shown in Table 5. It was evident from the table that the classification accuracy of the car evaluation dataset increased after applying the data augmentation. This was because the number of minority classes was equal to the number of majority classes.
Further, we can also see an improvement in the classification accuracy of the other two datasets as well. These results indicated how our proposed model performed on the different datasets.
6. Conclusions and Future Work
In this paper, we presented a thorough empirical analysis for the data augmentation of real-world muti-class datasets. The real-world datasets were highly imbalanced, so we considered the use of a model based on adversarial learning. We evaluated the performance of the model on three different datasets belonging to three different domains. The datasets consisted of categorical and time series data. Further, we also used a decision tree classifier to assess the quality of the synthetic data.
The results showed that the augmenting samples using GANs can generate any type of distribution. Unlike the conventional techniques, it can also work on mixed and any kind of data. Finally, this work lays the groundwork for various solutions to handle imbalanced datasets with multiple classes and mixed datatypes. Further, the significance of our work lies in the fact that it opens up future research directions. The results presented in this paper demonstrate the potential of conditional adversarial nets and indicate the potential for beneficial and intriguing applications. One possible future direction is to compare the performance of the various variants of GANs on the basis of the quality of the generated data and computational costs. The two main challenges while working with GANs were the mode collapse and non-convergence. However, significantly less work has been conducted to solve these problems. Therefore, in the future, we will try to solve these challenges. Another possible direction is to apply a GAN model on various datasets, such as audio signals, brain signals, and so on, to assess their performance.
Author Contributions
Conceptualization, S.A., J.R., A.J., F.A.R. and S.T.; Methodology, S.A., Y.G., F.A.R. and S.T.; Software, S.A.; Validation, S.A., Y.G., J.R. and S.T.; Formal analysis, S.A. and Y.G.; Investigation, S.A. and Y.G.; Data curation, S.A., and S.T.; Writing—original draft, S.A. and Y.G.; Writing—review & editing, Y.G., J.R., A.J., F.A.R. and S.T.; Visualization, Y.G. and S.T.; Supervision, Y.G. and S.T.; Project administration, Y.G. and S.T.; Funding acquisition, Y.G. and S.T. All authors have read and agreed to the published version of the manuscript.
Funding
The authors would like to thank the United Arab Emirates University for funding this work under UAEU Strategic Research Grant G00003676 (Fund No.: 12R136) through Big Data Analytics Center.
Institutional Review Board Statement
Not applicable.
Informed Consent Statement
Not applicable.
Data Availability Statement
Not applicable.
Acknowledgments
This work was supported by the Deanship of Scientific Research, Vice Presidency for Graduate Studies and Scientific Research, King Faisal University, Saudi Arabia, under the Project GRANT2,518. The authors would also like to thank the United Arab Emirates University for funding this work under UAEU Strategic Research Grant G00003676 (Fund No.: 12R136) through Big Data Analytics Center.
Conflicts of Interest
The authors declare that there are no conflict of interest regarding the publication of this paper.
References
- Mohammadzadeh, A.; Sabzalian, M.H.; Zhang, C.; Castillo, O.; Sakthivel, R.; El-Sousy, F.F.M. Modern Adaptive Fuzzy Control Systems; Springer Nature: Berlin, Germany, 2022; Volume 421, ISBN 3031173937. [Google Scholar]
- Alam, S.; Raja, P.; Gulzar, Y. Investigation of Machine Learning Methods for Early Prediction of Neurodevelopmental Disorders in Children. Wirel. Commun. Mob. Comput. 2022, 2022, 1–12. [Google Scholar] [CrossRef]
- Gulzar, Y.; Khan, S.A. Skin Lesion Segmentation Based on Vision Transformers and Convolutional Neural Networks— A Comparative Study. Appl. Sci. 2022, 12, 5990. [Google Scholar] [CrossRef]
- Khan, S.A.; Gulzar, Y.; Turaev, S.; Peng, Y.S. A Modified HSIFT Descriptor for Medical Image Classification of Anatomy Objects. Symmetry 2021, 13, 1987. [Google Scholar] [CrossRef]
- Ayoub, S.; Khan, M.A.; Jadhav, V.P.; Anandaram, H.; Anil Kumar, T.C.; Reegu, F.A.; Motwani, D.; Shrivastava, A.K.; Berhane, R. Minimized Computations of Deep Learning Technique for Early Diagnosis of Diabetic Retinopathy Using IoT-Based Medical Devices. Comput. Intell. Neurosci. 2022, 2022, 7040141. [Google Scholar] [CrossRef] [PubMed]
- Gulzar, Y.; Hamid, Y.; Soomro, A.B.; Alwan, A.A.; Journaux, L. A Convolution Neural Network-Based Seed Classification System. Symmetry 2020, 12, 2018. [Google Scholar] [CrossRef]
- Hamid, Y.; Wani, S.; Soomro, A.B.; Alwan, A.A.; Gulzar, Y. Smart Seed Classification System Based on MobileNetV2 Architecture. In Proceedings of the 2022 2nd International Conference on Computing and Information Technology, ICCIT 2022, Tabuk, Saudi Arabia, 25–27 January 2022; pp. 217–222. [Google Scholar] [CrossRef]
- Albarrak, K.; Gulzar, Y.; Hamid, Y.; Mehmood, A.; Soomro, A.B. A Deep Learning-Based Model for Date Fruit Classification. Sustainability 2022, 14, 6339. [Google Scholar] [CrossRef]
- Ayoub, S.; Gulzar, Y.; Reegu, F.A.; Turaev, S. Generating Image Captions Using Bahdanau Attention Mechanism and Transfer Learning. Symmetry 2022, 14, 2681. [Google Scholar] [CrossRef]
- Hamid, Y.; Elyassami, S.; Gulzar, Y.; Balasaraswathi, V.R.; Habuza, T.; Wani, S. An Improvised CNN Model for Fake Image Detection. Int. J. Inf. Technol. 2022, 15, 5–15. [Google Scholar] [CrossRef]
- Sahlan, F.; Hamidi, F.; Misrat, M.Z.; Adli, M.H.; Wani, S.; Gulzar, Y. Prediction of Mental Health among University Students. Int. J. Perceptive Cogn. Comput. 2021, 7, 85–91. [Google Scholar]
- Faris, M.; Hanafi, F.M.; Sukri Faiz, M.; Nasir, M.; Wani, S.; Abdulkhaleq, R.; Abdulghafor, A.; Gulzar, Y.; Hamid, Y. A Real Time Deep Learning Based Driver Monitoring System. Int. J. Perceptive Cogn. Comput. 2021, 7, 79–84. [Google Scholar]
- Yan, S.R.; Tian, M.; Alattas, K.A.; Mohamadzadeh, A.; Sabzalian, M.H.; Mosavi, A.H. An Experimental Machine Learning Approach for Mid-Term Energy Demand Forecasting. IEEE Access 2022, 10, 118926–118940. [Google Scholar] [CrossRef]
- Fernández, A.; López, V.; Galar, M.; José, M.; Herrera, F. Knowledge-Based Systems Analysing the Classification of Imbalanced Data-Sets with Multiple Classes: Binarization Techniques and Ad-Hoc Approaches. Knowl.-Based Syst. 2013, 42, 97–110. [Google Scholar] [CrossRef]
- Raoof, I.; Gupta, M.K. A Study of Semi Supervised Based Approaches for Motor Imagery Signal Generation. In Proceedings of the 3rd International Conference on Inventive Research in Computing Applications, ICIRCA 2021, Coimbatore, India, 2–4 September 2021; pp. 1312–1316. [Google Scholar] [CrossRef]
- Raghuwanshi, B.S.; Shukla, S. Class-Specific Extreme Learning Machine for Handling Binary Class Imbalance Problem. Neural Netw. 2018, 105, 206–217. [Google Scholar] [CrossRef]
- Zhu, B.; Baesens, B.; vanden Broucke, S.K.L.M. An Empirical Comparison of Techniques for the Class Imbalance Problem in Churn Prediction. Inf. Sci. 2017, 408, 84–99. [Google Scholar] [CrossRef]
- Thai-Nghe, N.; Gantner, Z.; Schmidt-Thieme, L. Cost-Sensitive Learning Methods for Imbalanced Data. In Proceedings of the International Joint Conference on Neural Networks, Barcelona, Spain, 18–23 July 2010. [Google Scholar] [CrossRef]
- Castro, C.L.; Braga, A.P. Novel Cost-Sensitive Approach to Improve the Multilayer Perceptron Performance on Imbalanced Data. IEEE Trans. Neural Netw. Learn. Syst. 2013, 24, 888–899. [Google Scholar] [CrossRef]
- Dudoit, S.; Ridlyand, J. A Prediction-Based Resampling Method for Estimating the Number of Clusters in a Dataset. Genome Biol. 2002, 3, 1–21. [Google Scholar] [CrossRef]
- Fernández, A.; García, S.; del Jesus, M.J.; Herrera, F. A Study of the Behaviour of Linguistic Fuzzy Rule Based Classification Systems in the Framework of Imbalanced Data-Sets. Fuzzy Sets Syst. 2008, 159, 2378–2398. [Google Scholar] [CrossRef]
- Basgall, M.J.; Hasperué, W.; Naiouf, M.; Fernández, A.; Herrera, F. SMOTE-BD: An Exact and Scalable Oversampling Method for Imbalanced Classification in Big Data. J. Comput. Sci. Technol. 2018, 18, e23. [Google Scholar] [CrossRef]
- Yang, P.; Yoo, P.D.; Fernando, J.; Zhou, B.B.; Zhang, Z.; Zomaya, A.Y. Sample Subset Optimization Techniques for Imbalanced and Ensemble Learning Problems in Bioinformatics Applications. IEEE Trans. Cybern. 2014, 44, 445–455. [Google Scholar] [CrossRef] [PubMed]
- Kingma, D.P.; Rezende, D.J.; Mohamed, S.; Welling, M. Semi-Supervised Learning with Deep Generative Models. Adv. Neural Inf. Process. Syst. 2014, 4, 3581–3589. [Google Scholar]
- Goodfellow, I.; Pouget-Abadie, J.; Mirza, M.; Xu, B.; Warde-Farley, D.; Ozair, S.; Courville, A.; Bengio, Y. Generative Adversarial Networks. Commun. ACM 2020, 63, 139–144. [Google Scholar] [CrossRef]
- Donahue, C.; Mcauley, J.; Puckette, M.; Science, C.; Diego, S. Synthesizing Audio with Gans. In Proceedings of the Workshop Track—ICLR 2018, Vancouver, BC, Canada, 30 April–3 May 2018; pp. 1–6. [Google Scholar]
- Mahapatra, D.; Bozorgtabar, B.; Garnavi, R. Image Super-Resolution Using Progressive Generative Adversarial Networks for Medical Image Analysis. Comput. Med. Imaging Graph. 2019, 71, 30–39. [Google Scholar] [CrossRef] [PubMed]
- Yang, G.; Zhong, Y.; Yang, L.; Tao, H.; Li, J.; Du, R. Fault Diagnosis of Harmonic Drive with Imbalanced Data Using Generative Adversarial Network. IEEE Trans. Instrum. Meas. 2021, 70, 1–11. [Google Scholar] [CrossRef]
- Yi, W.; Sun, Y.; He, S. Data Augmentation Using Conditional GANs for Facial Emotion Recognition. In Proceedings of the 2018 Progress in Electromagnetics Research Symposium (PIERS-Toyama), Toyama, Japan, 1–4 August 2018; pp. 710–714. [Google Scholar]
- Jing, X.; Zhang, X.; Zhu, X.; Wu, F.; You, X.; Member, S. Multiset Feature Learning for Highly Imbalanced Data Classification. IEEE Trans. Pattern Anal. Mach. Intell. 2021, 43, 139–156. [Google Scholar] [CrossRef]
- Triguero, I.; Gonz, S.; Moyano, J.M.; Garc, S.; Luciano, S.; Fern, A.; Jos, M. KEEL 3.0: An Open Source Software for Multi-Stage Analysis in Data Mining. Int. J. Comput. Intell. Syst. 2017, 10, 1238–1249. [Google Scholar] [CrossRef]
- Galar, M.; Fernández, A.; Barrenechea, E.; Herrera, F. EUSBoost: Enhancing Ensembles for Highly Imbalanced Data-Sets by Evolutionary Undersampling. Pattern Recognit. 2013, 46, 3460–3471. [Google Scholar] [CrossRef]
- Gulzar, Y. Fruit Image Classification Model Based on MobileNetV2 with Deep Transfer Learning Technique. Sustainability 2023, 15, 1906. [Google Scholar] [CrossRef]
- Mamat, N.; Othman, M.F.; Abdulghafor, R.; Alwan, A.A.; Gulzar, Y. Enhancing Image Annotation Technique of Fruit Classification Using a Deep Learning Approach. Sustainability 2023, 15, 901. [Google Scholar] [CrossRef]
- Aggarwal, S.; Gupta, S.; Gupta, D.; Gulzar, Y.; Juneja, S.; Alwan, A.A.; Nauman, A. An Artificial Intelligence-Based Stacked Ensemble Approach for Prediction of Protein Subcellular Localization in Confocal Microscopy Images. Sustainability 2023, 15, 1695. [Google Scholar] [CrossRef]
- Zhou, Y.; Zhang, W.; Kang, J.; Zhang, X.; Wang, X. A Problem-Specific Non-Dominated Sorting Genetic Algorithm for Supervised Feature Selection. Inf. Sci. 2021, 547, 841–859. [Google Scholar] [CrossRef]
- Huang, X.; Chi, Y.; Zhou, Y. Feature Selection of High Dimensional Data by Adaptive Potential Particle Swarm Optimization. In Proceedings of the 2019 IEEE Congress on Evolutionary Computation (CEC), Wellington, New Zealand, 10–13 June 2019; pp. 1052–1059. [Google Scholar]
- Choi, E.; Biswal, S.; Malin, B.; Duke, J.; Stewart, W.F.; Sun, J. Generating Multi-Label Discrete Patient Records Using Generative Adversarial Networks. In Proceedings of the 2nd Machine Learning for Healthcare Conference, Boston, MA, USA, 18–19 August 2017; Volume 68, pp. 1–20. [Google Scholar]
- Patel, S.; Kakadiya, A.; Mehta, M.; Derasari, R.; Patel, R.; Gandhi, R. Correlated Discrete Data Generation Using Adversarial Training. arXiv 2018, arXiv:1804.00925. [Google Scholar]
- Yoon, J.; Jordon, J.; Van Der Schaar, M. GAIN: Missing Data Imputation Using Generative Adversarial Nets. In Proceedings of the 35th International Conference on Machine Learning, ICML 2018, Stockholm, Sweden, 10–15 July 2018; Volume 13, pp. 9042–9051. [Google Scholar]
- Camino, R.; Hammerschmidt, C.; State, R. Generating Multi-Categorical Samples with Generative Adversarial Networks. arXiv 2018, arXiv:1807.01202. [Google Scholar]
- Chen, H.; Jajodia, S.; Liu, J.; Park, N.; Sokolov, V.; Subrahmanian, V.S. Faketables: Using GANs to Generate Functional Dependency Preserving Tables with Bounded Real Data. In Proceedings of the IJCAI International Joint Conference on Artificial Intelligence 2019, Macao, China, 10–16 August 2019; pp. 2074–2080. [Google Scholar] [CrossRef]
- Wang, L.; Zhang, W.; He, X. Continuous Patient-Centric Sequence Generation via Sequentially Coupled Adversarial Learning; Springer International Publishing: Cham, Switzerland, 2019; Volume 11447 LNCS, ISBN 9783030185787. [Google Scholar]
- Engelmann, J.; Lessmann, S. Conditional Wasserstein GAN-Based Oversampling of Tabular Data for Imbalanced Learning. Expert Syst. Appl. 2021, 174, 114582. [Google Scholar] [CrossRef]
- Mogren, O. C-RNN-GAN: Continuous Recurrent Neural Networks with Adversarial Training. arXiv 2016, arXiv:1611.09904. [Google Scholar]
- Durugkar, I.; Gemp, I.; Mahadevan, S. Generative Multi-Adversarial Networks. In Proceedings of the 5th International Conference on Learning Representations, ICLR 2017—Conference Track Proceedings, Toulon, France, 24–26 April 2017; pp. 1–14. [Google Scholar]
- Mirza, M.; Osindero, S. Conditional Generative Adversarial Nets. arXiv 2014, arXiv:1411.1784. [Google Scholar]
- Moslehi, S.; Rabiei, N.; Soltanian, A.R.; Mamani, M. Application of Machine Learning Models Based on Decision Trees in Classifying the Factors Affecting Mortality of COVID-19 Patients in Hamadan, Iran. BMC Med. Inform. Decis. Mak. 2022, 22, 1–12. [Google Scholar] [CrossRef]
- Cruciani, F.; Sun, C.; Zhang, S.; Nugent, C.; Li, C.; Song, S.; Cheng, C.; Cleland, I.; McCullagh, P. A Public Domain Dataset for Human Activity Recognition in Free-Living Conditions. In Proceedings of the 2019 IEEE SmartWorld, Ubiquitous Intelligence and Computing, Advanced and Trusted Computing, Scalable Computing and Communications, Internet of People and Smart City Innovation, SmartWorld/UIC/ATC/SCALCOM/IOP/SCI 2019, Leicester, UK, 19–23 August 2019; pp. 166–171. [Google Scholar] [CrossRef]
- Moro, S.; Cortez, P.; Rita, P. A Data-Driven Approach to Predict the Success of Bank Telemarketing. Decis. Support Syst. 2014, 62, 22–31. [Google Scholar] [CrossRef]
- Odena, A.; Olah, C.; Shlens, J. Conditional Image Synthesis with Auxiliary Classifier Gans. In Proceedings of the 34th International Conference on Machine Learning, ICML 2017, Sydney, Australia, 6–11 August 2017; Volume 6, pp. 4043–4055. [Google Scholar]
- Mukherjee, M.; Khushi, M. SMOTE-ENC: A Novel SMOTE-Based Method to Generate Synthetic Data for Nominal and Continuous Features. Appl. Syst. Innov. 2021, 4, 18. [Google Scholar] [CrossRef]
- Moshiri, P.F.; Navidan, H.; Shahbazian, R.; Ghorashi, S.A.; Windridge, D. Using GAN to Enhance the Accuracy of Indoor Human Activity Recognition. arXiv 2020, arXiv:2004.11228. [Google Scholar]


Disclaimer/Publisher’s Note: The statements, opinions and data contained in all publications are solely those of the individual author(s) and contributor(s) and not of MDPI and/or the editor(s). MDPI and/or the editor(s) disclaim responsibility for any injury to people or property resulting from any ideas, methods, instructions or products referred to in the content. |
© 2023 by the authors. Licensee MDPI, Basel, Switzerland. This article is an open access article distributed under the terms and conditions of the Creative Commons Attribution (CC BY) license (https://creativecommons.org/licenses/by/4.0/).