Article

Effect of Karst Microhabitats on the Structure and Function of the Rhizosphere Soil Microbial Community of Rhododendron pudingense

1
Guizhou Academy of Forestry, Guiyang 550005, China
2
National Positioning Observation and Research Station of Guizhou Libo Karst Forest Ecosgstem, Libo 558403, China
3
College of Forestry, Guizhou University, Guiyang 550025, China
*
Authors to whom correspondence should be addressed.
These authors contributed equally to this work.
Sustainability 2023, 15(9), 7104; https://doi.org/10.3390/su15097104
Submission received: 3 April 2023 / Revised: 13 April 2023 / Accepted: 19 April 2023 / Published: 24 April 2023
(This article belongs to the Special Issue Advanced Plant Biotechnology for Sustainable Agriculture)

Abstract

:
Soil microbes play an important role in the microbial circulation and energy flow of ecosystems. In order to understand the change in the rhizosphere soil microbial community structure and function in the heterogeneous karst habitats, the nutrient content and enzyme activity were analyzed, and Illumina MiSeq high-throughput sequencing technology was used to detect the composition, quantity and functional types of the rhizosphere soil microbial community in Rhododendron pudingense under three kinds of karst microhabitats (soil surface, rock gully and rock surface) in Wangmo Country (WM), Zhenning Country (ZN) and Qinglong Country (QL). The results showed that SS and RG microhabitats had a higher nutrient content and enzyme activity, while RS had the lowest. At the phylum level, Proteobacteria and Actinomycetes were dominant in terms of bacteria, while Ascomycota and Basidiomycotina were dominant in terms of fungi. There was no significant difference in microbial diversity among different karst microhabitats (p > 0.05). At the microbial genus level, there were some differences in species composition among the three karst microhabitats, which may lead to soil heterogeneity in karst microhabitats. WM was a little different from ZN and QL. The results of PCoA showed that the community composition of RG and RS was more similar to that of SS. There was no significant difference in microbial functional types among different microhabitats (p > 0.05). Only the abundance of pathothoph-symbiothoph fungi in RG was significantly higher than that in RS (p < 0.05). The main function of bacteria was metabolism, and saprophytic and symbiotic fungi were the dominant fungal group. In conclusion, soil organic carbon and alkaline phosphatase are important factors affecting the level distribution of microflora in different karst microhabitats. R. pudingense in the SS and RG microhabitats has better soil conditions, which may require protection for the plants in the RS microhabitat. The current study results can provide a theoretical basis for the adaptation mechanism of Rhododendron pudingense to the karst microhabitat.

1. Introduction

Soil is the largest reservoir of biodiversity on Earth, and the soil microbial community is composed of bacteria, fungi, archaea and viruses, which is an important manifestation of soil biodiversity [1,2]. Soil microorganisms can provide fixed nitrogen sources for plants [3], regulate soil nutrient conversion [4], affect plant hormone metabolism and thus promote plant growth or enhance plant stress resistance [5], but they may also be affected by some pathogenic bacteria [6]. The rhizosphere refers to the narrow area near plant roots. Due to the influence of plant root exudates, its physical and chemical properties and biological activities are different from those of the original soil [7]. In recent years, the rhizosphere has received extensive attention, and many scholars take the rhizosphere soil as the research object to reveal the interaction between plant, environment and microbes [8,9]. In different environment conditions, microbial communities can affect the decomposition and utilization of organic matter by changing various metabolic properties [10]. Therefore, it is of great significance to study the response characteristics of soil microorganisms to environmental changes.
Karst landforms in China are widely distributed and affected by internal dynamics of the Earth, strong geological movement, uneven distribution of high temperature and rain, and high dissolution of carbonate. It has the characteristics of a high rock exposure rate, calcium rich soil, severe drought, etc. [11,12], as well by discontinuous surface soil, shallow soil layer, and high heterogeneity of the habitat in horizontal space [13,14]. Guizhou Province is located in a typical area of karst development in southwest China, and the karst is widely distributed through the province [15]. According to the origin and external morphological characteristics of the habitat, six microhabitats, such as rock gully, rock surface, rock trough, soil surface, rock seam and rock cave, could be classified [16]. Previous studies have shown that there are differences in soil physical and chemical properties and microclimate characteristics in karst microhabitats, which are mainly manifested in soil nutrient content, temperature, humidity and light intensity [17,18,19,20]. The community structure and function of soil microorganisms are closely related to the soil environment [21], and differences in soil environment will also affect the energy flow and nutrient cycle closely related to microbial activities in the ecosystem [22]. The adaptability of different plants to karst stresses is different to some extent, and the adaptability of the same plant to karst stresses at different scales may also be different. The study of the rhizosphere soil microbial community structure and function of single species in different microhabitat is helpful to answer the question of how plants cope with karst heterogeneous habitats.
Previous studies mostly focused on soil microbial community structure in different vegetation restoration processes [23], different forest ages [24], different soil depths [25] and different seasons [26]. Some studies revealed the influence of single species rhizosphere soil microorganisms on microhabitats in karst areas [27]. The soil samples taken were forest ecosystem soils, and the soil microbial community may be affected by different tree species and their root exudates [28,29]. Rhododendron pudingense is a new species of Ericaceae found in 2020. It is a shrub with a light pink color, and it blooms in April to May every year. The wild population is small, mainly distributed in the middle and upper limestone of Puding County, Wangmo County and Qinglong County of Guizhou Province [30]. Thus, are there differences in the structure and function of the rhizosphere soil microbial communities in different karst microhabitats? In this study, the rhizosphere soil of R. pudingense suitable for karst rock mountains was selected as the research object. High-throughput sequencing technology was used to explore the community structure and function of soil bacteria and fungi under different karst microhabitats, so as to further understand the response characteristics of soil microbial communities to the heterogeneity of the karst habitat, laying a foundation for the protection and utilization of wild R. pudingense resources. It provides a theoretical reference for the protection of microbial diversity and prevention of rocky desertification in karst mountainous areas.

2. Materials and Methods
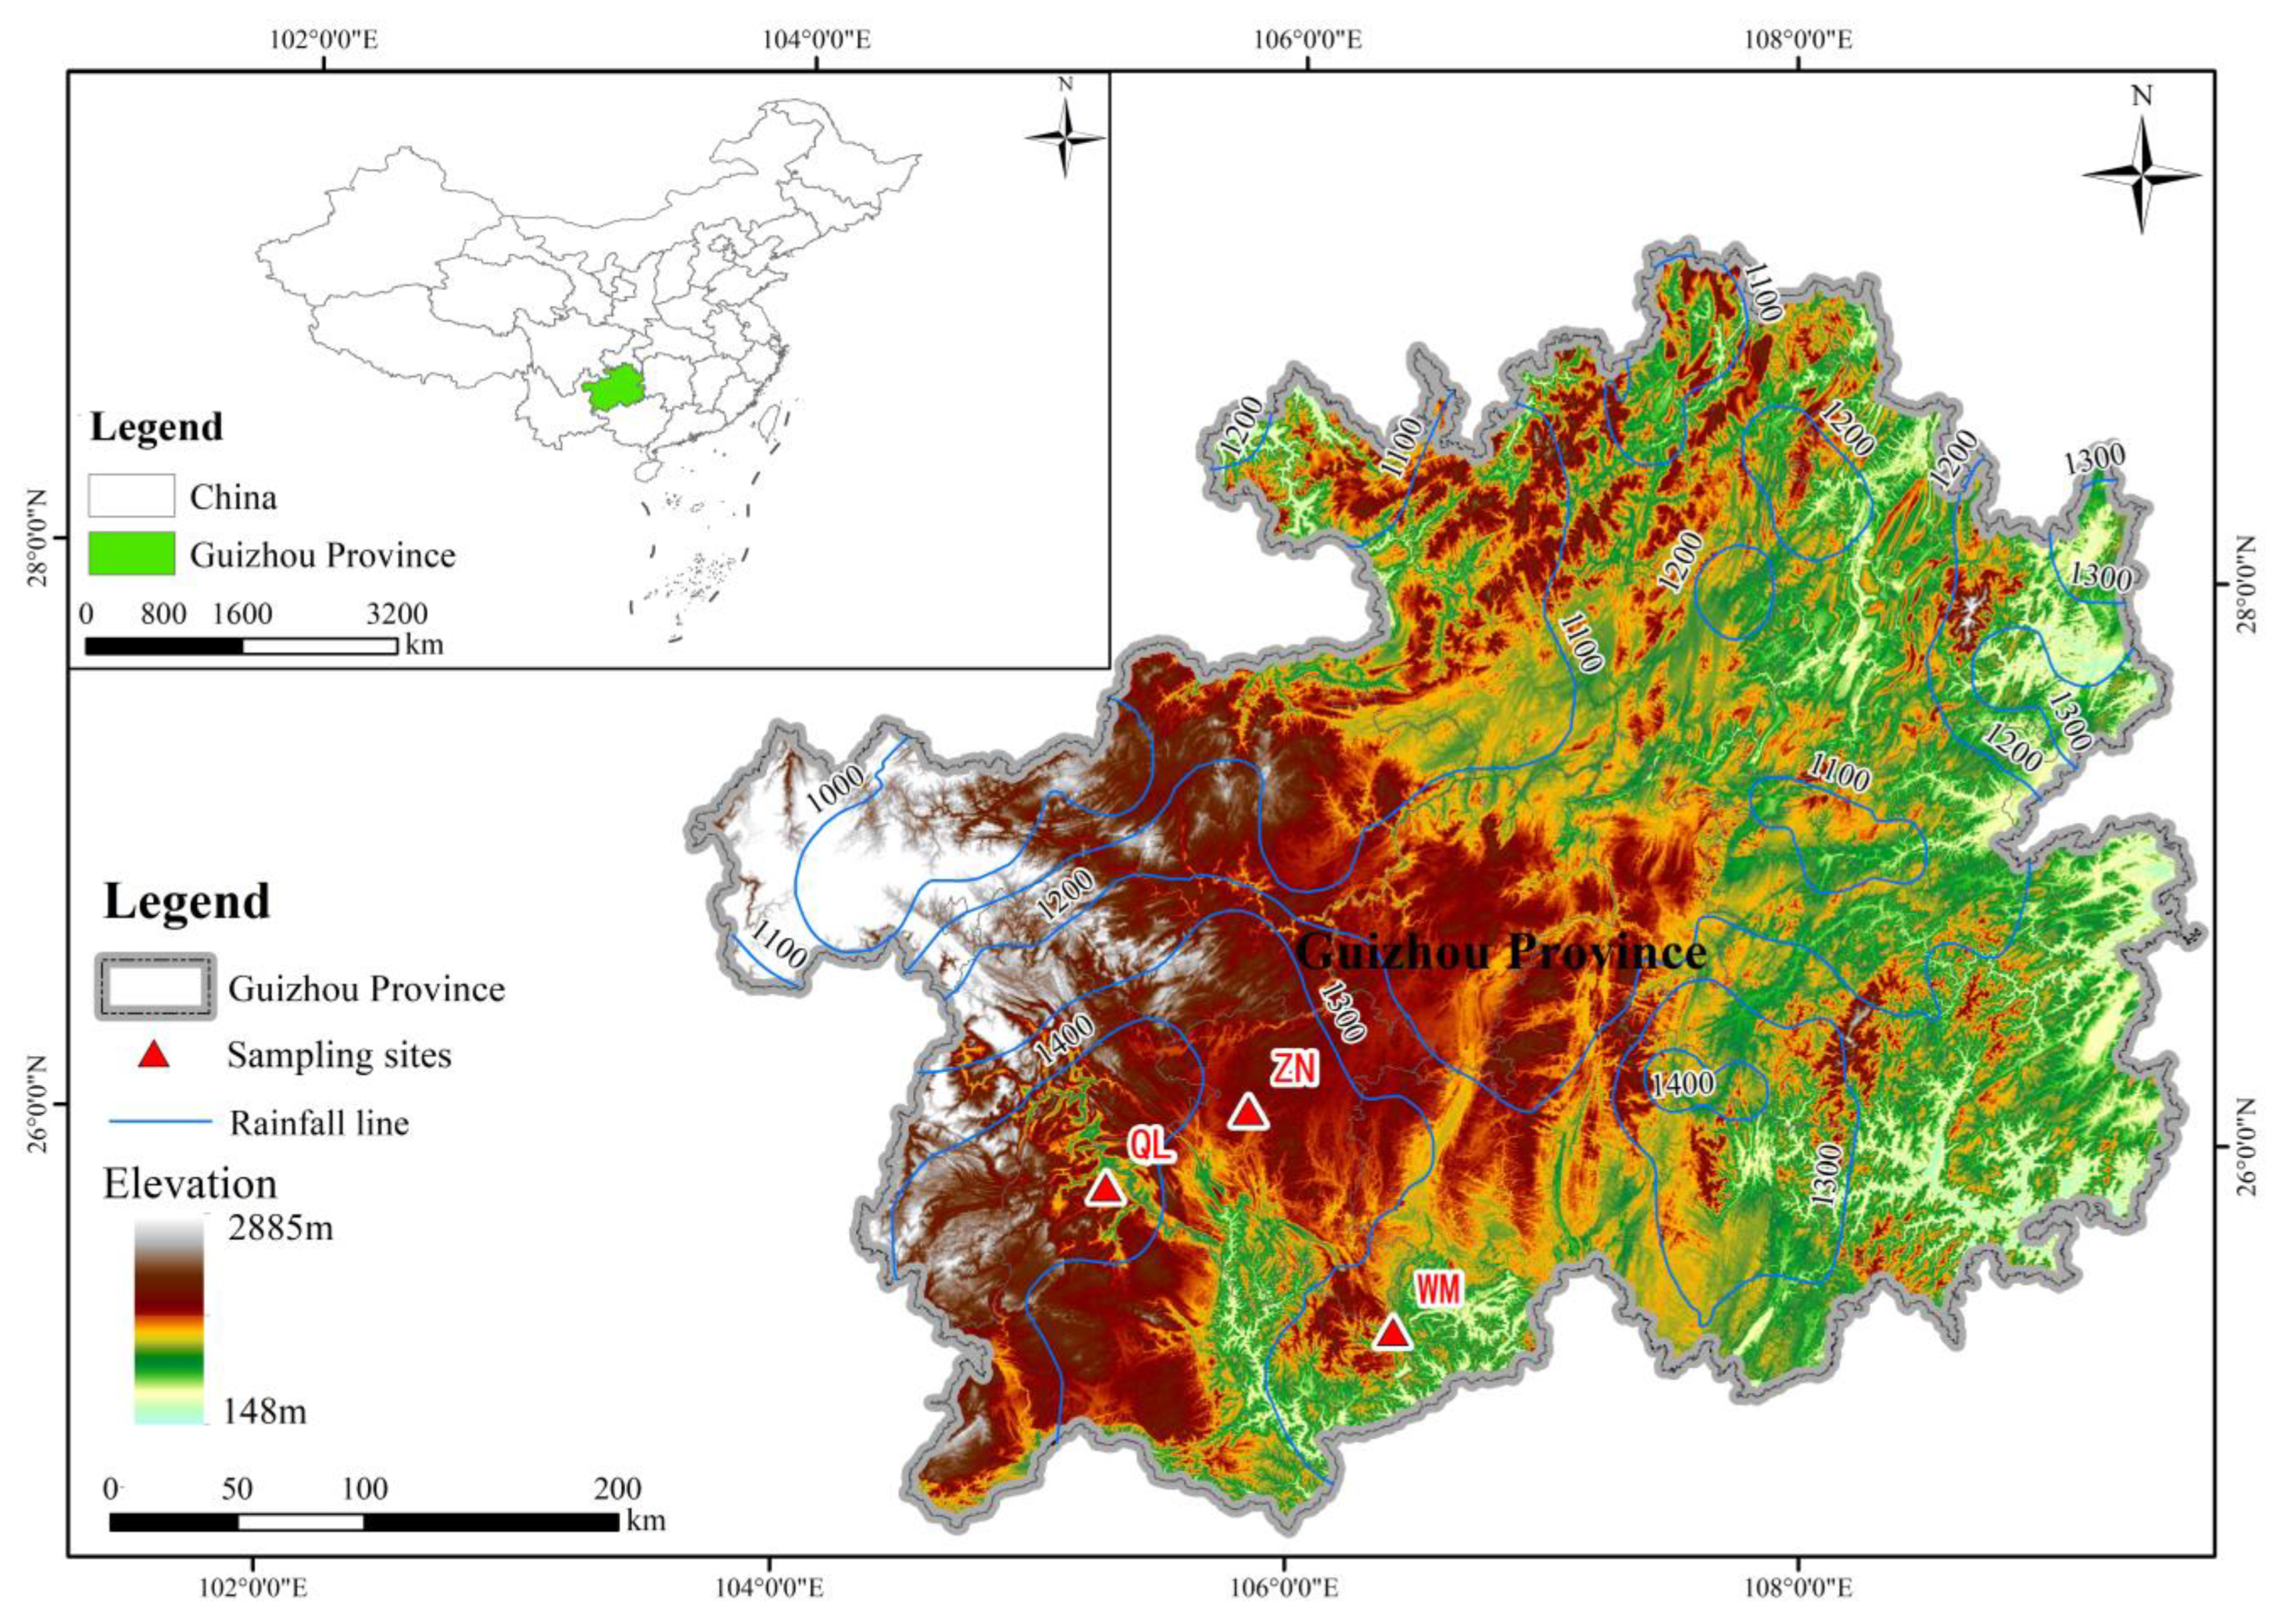
2.1. Study Area

The study area was located in Xinfa Village, Zhenning County (ZN), Hama Community, Qinglong County (QL) and Black Hole, Wangmo County (WM), Guizhou Province, China (Figure 1). Zhenning County is located in Anshun City of Guizhou Province(105°35′ to 106°1′ E, 25°25′ to 26°11′ N). It is located in the gentle area of the watershed zone between the Pearl River Basin and the Yangtze River Basin. It is a typical rocky desertification area of the karst plateau, and the terrain is high in the north and low in the south, 356–1678 m above sea level. The annual average temperature is 17.4–19.7 °C, the annual rainfall is 1025.6–1193.3 mm, the average annual sunshine duration is 1299 h and the annual frost free period is 270 d. Qinglong County is located in Qianxinan Buyi and Miao Autonomous Prefecture of Guizhou Province(105°1′ to 105°25′ E, 25°33′ to 26°11′ N). It is located in the middle part of Yunnan–Guizhou Plateau and the upper reaches of Pearl River. The annual rainfall is 1050–1650 mm, the annual average sunshine number is 1462 h and the annual frost-free period is 287 days. Wangmo County is located in Qiandinan Buyi and Miao Autonomous Prefecture of Guizhou Province(106°49′ to 106°32′ E, 24°53′ to 25°38′ N). It is located in the slope zone of transition from Guizhou Plateau to Guangxi hilly basin. The terrain is high in the north and low in the south, with an altitude of 275–1718 m. The average annual temperature is 19.5 °C, the rainfall is 1236.8 mm, the sunshine duration is 1402 h and the frost-free period is 341 days.

2.2. Classification of Karst Microhabitats

Combining the research results of Zhu et al. [16] and An [31], the karst microhabitats were divided accordingly. In this study, rock surface (RS), rock gully (RG) and soil surface (SS), the most typical microhabitats with R. pudingense, were selected, and the division criteria are shown in Table 1.

2.3. Sample Collection

Soil samples were collected from Zhenning County, Qinglong County and Wangmo County from 28 July to 1 August 2022, and there were 3 plots (20 m × 10 m) in each region, with an interval of more than 20 m between the plots. In the plots, at least one R. pudingense was required to grow in each karst microhabitats. There were 9 plots in total. Meanwhile, the coordinates, elevation, slope and slope direction of the sample were recorded. One R. pudingense was selected from different karst microhabitats in each plot, the plant height and ground diameter were recorded (Table 2), and the rhizosphere soil was collected. The sampling methods of rhizosphere soil refer to Riley et al. [32]: during the sampling process, impurities such as ground litter and humus were first removed; soil blocks with complete roots were dug from each direction of the plant, and large chunks of soil were shaken off. Keep 1~4 mm soil on the root surface and collect it as rhizosphere soil; impurities such as stone grains and residual roots were removed from the soil samples, which were then put into sealed sterile bags, mixed with about 20 g, and numbered into foam boxes with ice packs. A total of 27 samples were collected. After sampling, the samples were quickly taken back to the laboratory and stored in the refrigerator at −80 °C for the determination of soil physical and chemical properties and soil microbial community structure.

2.4. Determination of Physical and Chemical Properties of Soil

Soil organic carbon content was determined by potassium dichromate oxidation capacity method. Soil total nitrogen content was determined by diffusion method and semi-microKelvin method. The content of total phosphorus in soil was determined by antiboiling solution and molybdenum-antimony resistance colorimetry. Soil available nitrogen content was determined by alkali-hydrolyzed diffusion method. The content of available phosphorus in soil was determined by sodium bicarbonate extraction and molybdenum-antimony resistance colorimetric method. In this study, the activities of three soil enzymes were determined by enzyme-linked immunosorbent assay method, namely, sucrase, urease and alkaline phosphatase. The enzyme activities were completed by Shanghai Majorbio Bio-Pharm Technology Co., Ltd., Shanghai, China.

2.5. DNA Extraction and Sequencing

DNA extraction and the quality control: according to E.Z.N.A soil kits (Omega Bio-tek, Norcross, GA, USA) instruction for total DNA extraction, the DNA concentration and purity of NanoDrop 2000 detection, using 1% agarose gel electrophoresis detection DNA extraction quality. Library preparation: Primers 338F (ACTCCTACGGGAGGCAG-CAG) and 806R (GGACTACHVGGGTWTCTAAT) were used for PCR amplification of V3~V4 variable regions. The amplification procedure was as follows: 95 °C degeneration 3 min, 27 cycle (55 °C 95 °C modified 30 s, 30 s, annealing extends 30 s) 72 °C, the last 72 °C extends 10 min (PCR: ABIGeneAmp type 9700). The amplification system was 20 μL, 4 μL 5 × FastPfu buffer, 2 μL 2.5 mmol·L−1 dNTPs, 0.8 μL 5 mmol·L−1 primer, 0.4 μL FastPfu polymerase. 10 ng DNA modules. Illumina Miseq sequencing: PCR products were recovered using 2% agarose Gel, purified by AxyPrep DNA Gel Extraction Kit (Axygen Biosciences, Union City, CA, USA), eluted by Tris-HCl, and detected by 2% agarose electrophoresis. Quantification was performed using quantifiers Fluortm-ST (Promega, Madison, Wisconsin, USA). A PE2 × 300 library was constructed from purified amplified fragments according to the Illu-mina MiS eq platform (Illumina, SanDiego, USA) standard operating procedures. Steps of library construction: (1) Connect the “Y” connector; (2) Magnetic bead screening was used to remove the joint self-connecting segments; (3) Enrichment of library templates by PCR amplification; (4) Denaturation of sodium hydroxide produces single-stranded DNA fragments. Illumina’s Miseq PE300 platform was commissioned by Shanghai Majorbio Bio-Pharm Technology Co., Ltd for sequencing.

2.6. Data Analysis

Operational Taxonomic Unit (OTU) clustering was performed on the optimized sequences at 97% similarity level. In the clustering process, the total number of filtered sequences was less than 5, and OTUs with less than 3 samples appeared. Chloroplast and species with low abundance and unnoted species were removed. The OTU sequences with 97% similarity level were analyzed by using RDPclassifier, and Silva (Release 132 http://www.arb-silva.de, accessed on 30 August 2022) was compared. Greengene (Release 13.5, http://greengenes.secondgenome.com, accessed on 30 August 2022) database was used count the community composition of samples at various taxonomic levels. The α diversity analysis was calculated using Mothur software, and then Shannon index was used to plot the dilution curve. Based on the weighted unifrac distance matrix between sample OTUs components, the similarity between microbial communities was analyzed by principal coordinate analysis (PCoA), and the PCoA analysis was carried out using R language vegan package. Bacterial function was predicted by KEGG database of Tax4Fun software, and fungal function was predicted by FUNGuild software for microbial community species composition analysis. Linear discriminant analysis (LDA) was performed on samples according to different grouping conditions using LEfSe software according to taxonomic composition. The results showed that LDA > 3.5 was the significant discriminant criterion for difference. The above analysis and drawing were completed with the help of the majorbio cloud platform (https://cloud.majorbio.com/ (accessed on 2 April 2023)). Data were processed and analyzed using Excel 2016 and SPSS 26.0. The α diversity of soil microorganisms was tested by one-way analysis of variance. Two-factor analysis of variance was used to test the significance of differences in soil nutrient content between regions and karst microhabitats, and the minimum significance difference (LSD) test was performed at the 95% confidence level. Origin was used to draw the functional structure diagram of microorganisms, and redundancy analysis was completed in Canoco 5. Before redundancy analysis, VIF variance inflation factor analysis was performed on all environmental factors, and collinearity >10 factors were removed, while smaller factors were retained.

3. Results

3.1. Soil Nutrient Content and Enzyme Activity

The results showed (Table 3) that there were significant differences in soil TN and TP in QL in SS and RG (p < 0.05), no significant differences in nutrient contents and stoichiometric ratios between ZN and QL in different karst microhabitats (p > 0.05), and significant differences in soil SOC and TN contents in WM in different karst microhabitats (p < 0.05). SAN content of SS and RS was significantly different (p < 0.05), SAP content of RS was significantly different from the other two karst microhabitats (p < 0.05), and the other indicators were not significantly different. Table 3 shows that, except soil C:N, the karst microhabitats had significant influence on each indicator(p < 0.05), but only the contents of C, N and P in soil were significantly affected between regions (p < 0.05). The nutrient content of SS habitat was lower, and the nutrient content of QL and WM was higher than that of ZN. SC and UE enzyme activities showed SS > RG > RS in different karst microhabits, while ALP enzyme activities showed higher SS and RG and the lowest RS. The karst microhabitat had a significant influence on SOC, TN, TP, AN, AP, UE, SC and ALP (p < 0.05). SOC, TN, TP, UE, SC and ALP were significantly affected by regional differences (p < 0.05). Except for AN, the karst microhabitat and region had significant interaction effects on the other seven indicators (p < 0.05) (Table 4).

3.2. Dilution Curve

Shannon–Wiener is an index reflecting microbial diversity in a sample. Curve figures were constructed using the microbial diversity index of each sample at different sequencing depths to reflect the microbial diversity of each sample at different sequencing quantities. When the curve tends to be flat, it indicates that the sequencing data volume is large enough to reflect the majority of the microbial information in the sample. Figure 2 shows that with the increase in sequencing data, the Shannon diversity index of bacteria and fungi gradually stabilized, and dilution curve was close to horizontal. The coverage rates of all samples were above 97% (Table 5), indicating that the microbial gene sequences in the samples had a high probability of detection. In summary, it can be shown that the sample sequencing depth is representative, can reflect the majority of the microbial diversity information in the sample, and can meet the needs of the community composition and microbial diversity analysis.

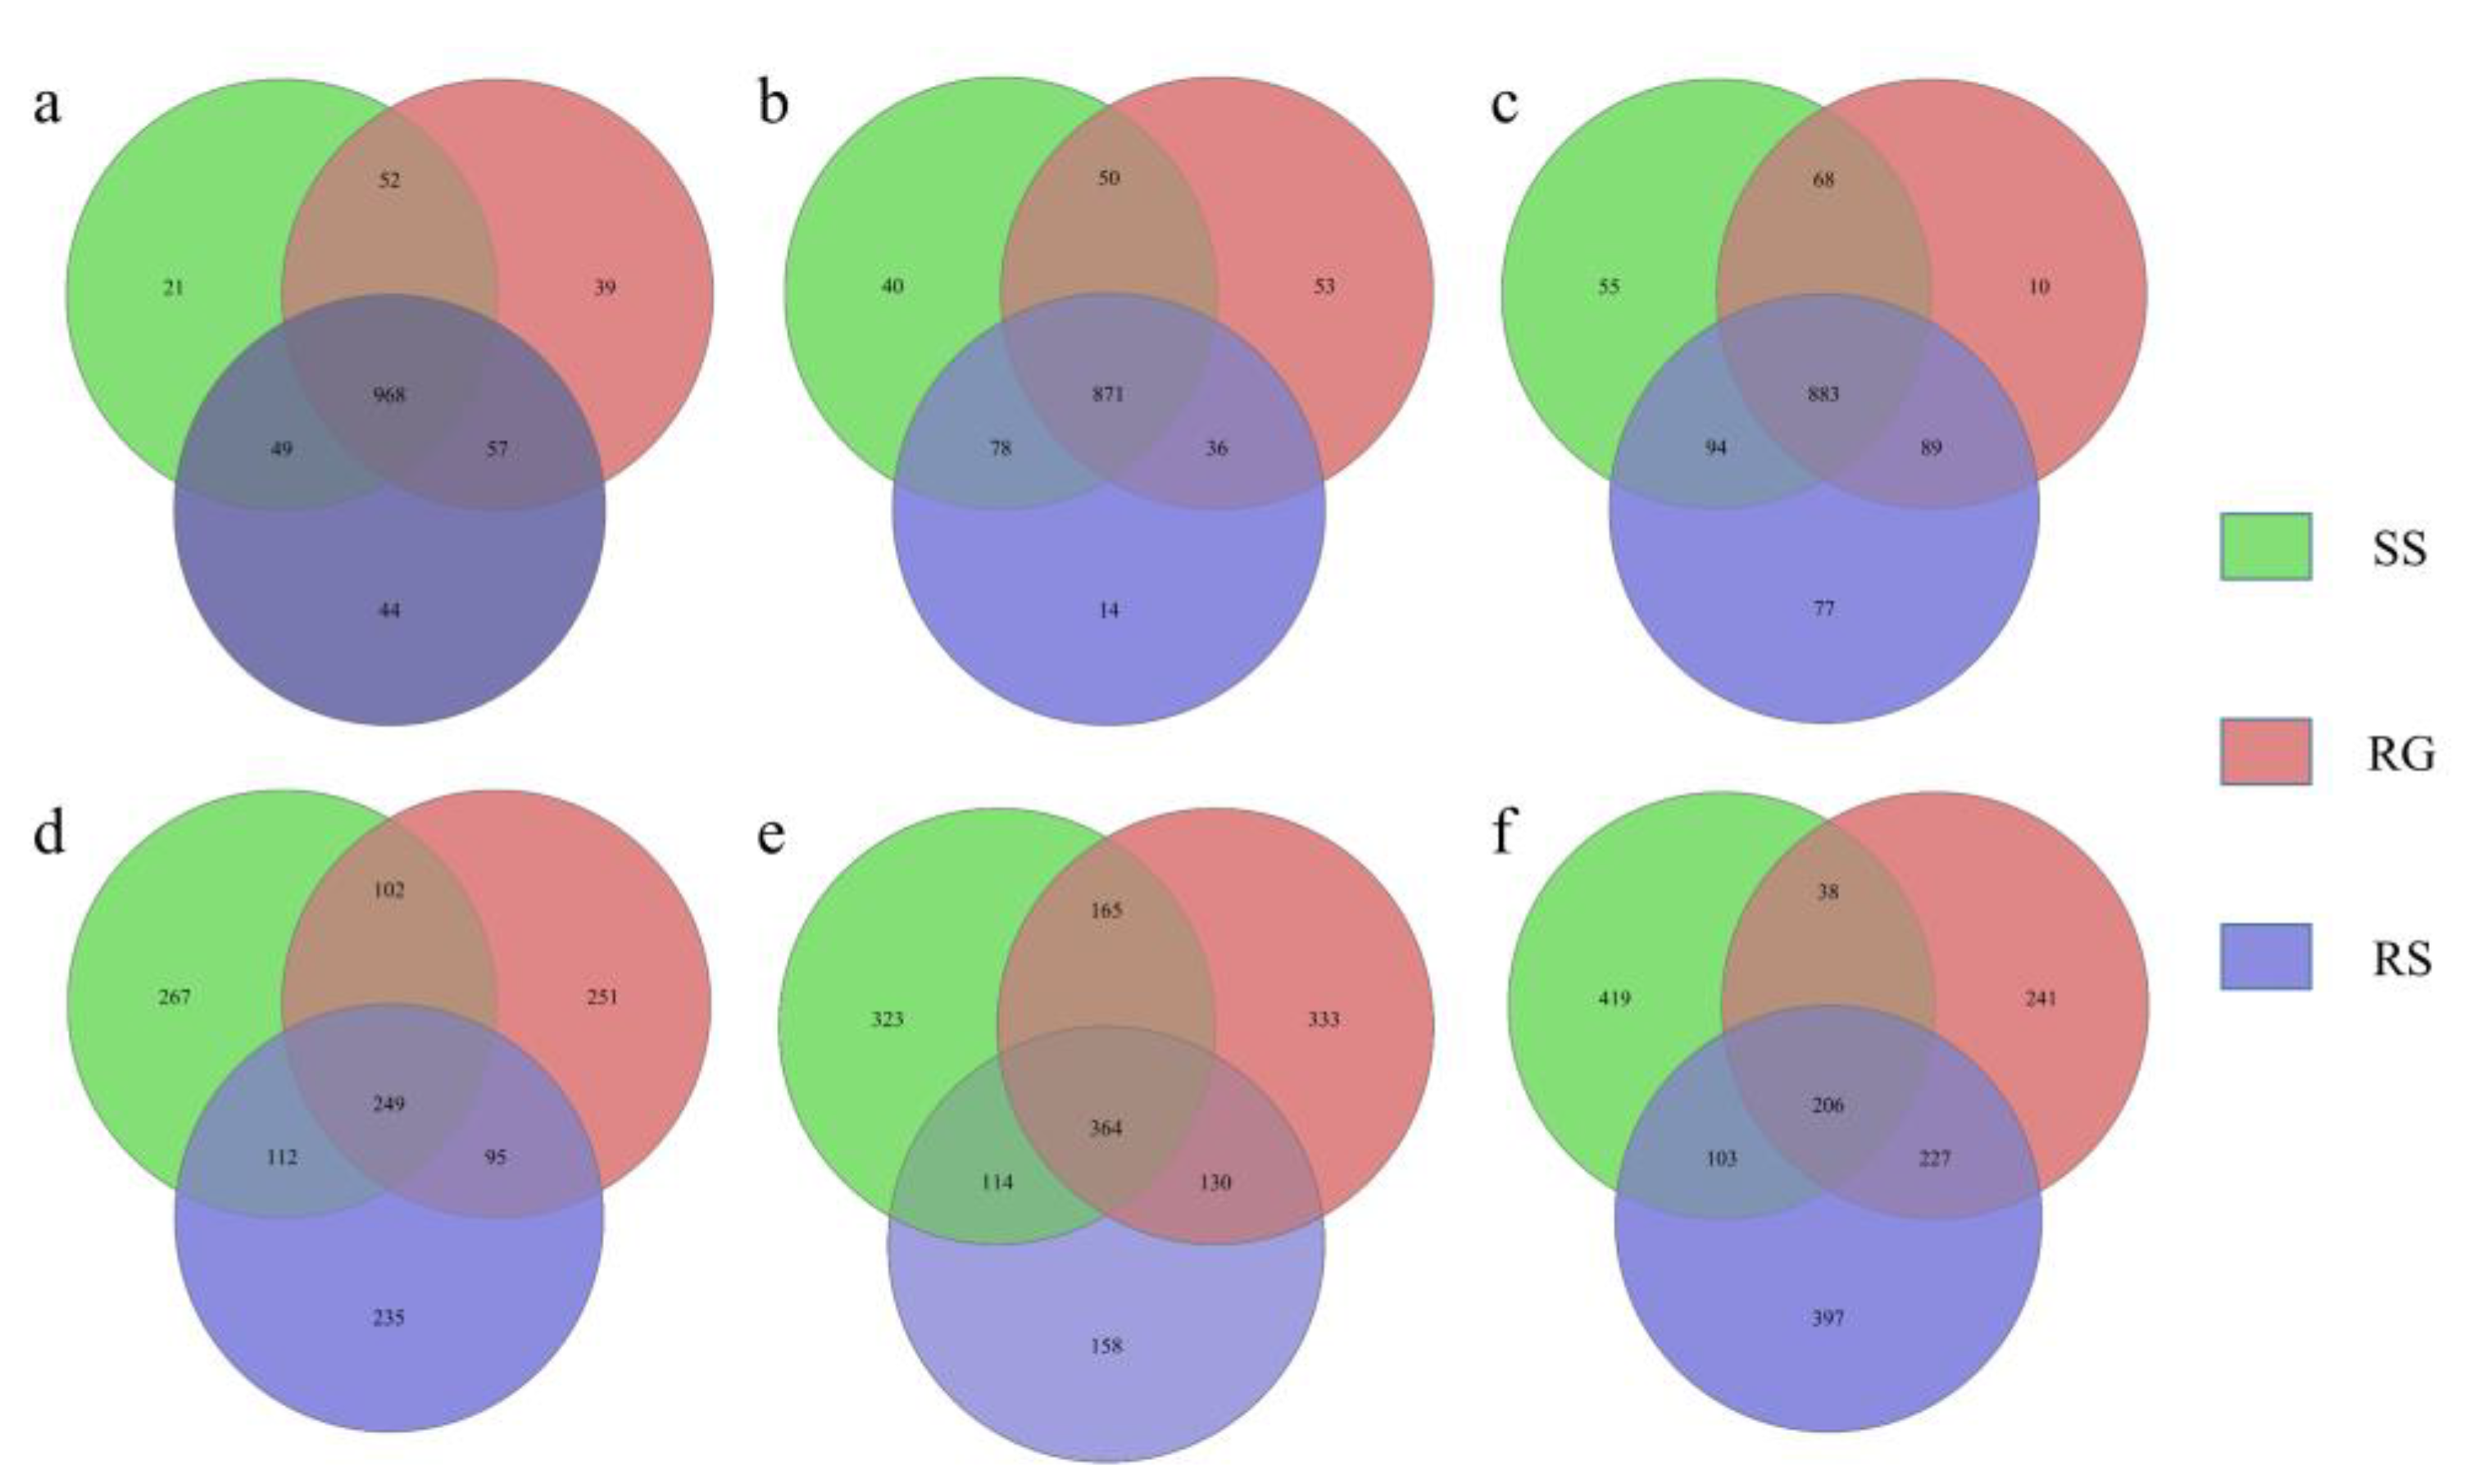
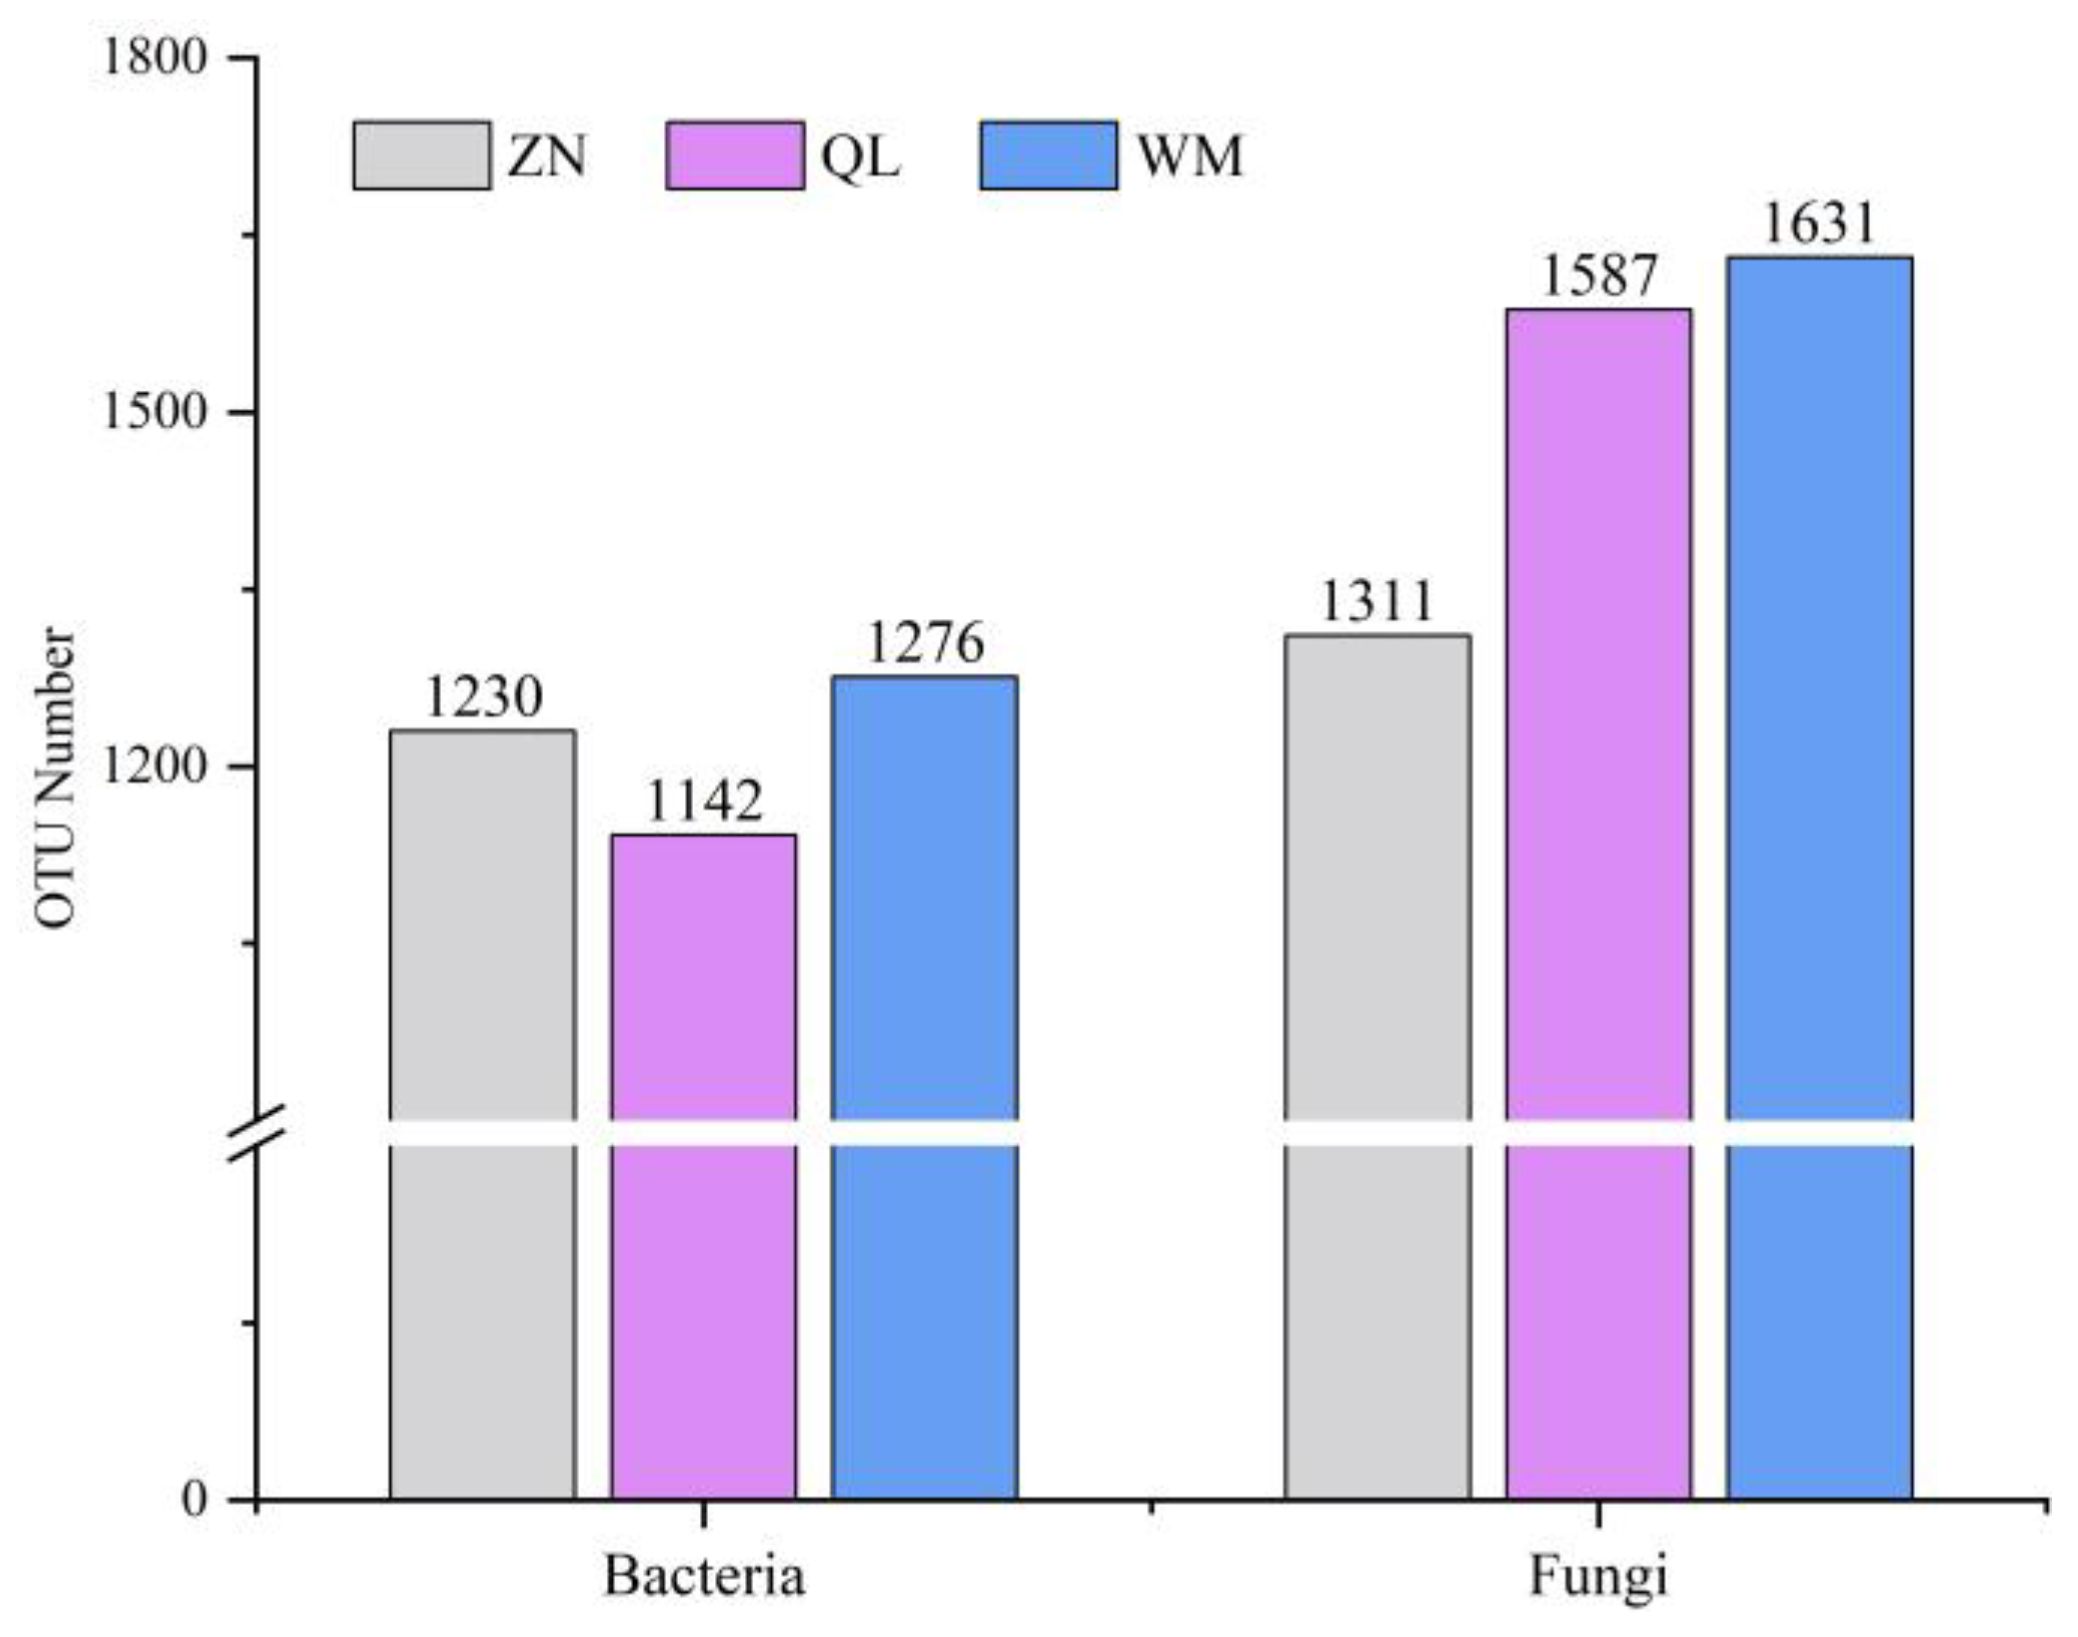
3.3. Alpha Diversity Index and OTU Analysis

In this study, based on the Illumina high-throughput sequencing platform, bacteria and fungi were sequenced in rhizosphere soil of R. pudingense from three distribution sites with different karst microhabitats. After splicing, optimization and filtration, a total of 1,405,624 effective sequences of bacteria and 1,412,898 effective sequences of fungi were obtained. The sequence length of bacteria ranged from 200 to 530 bp, with an average of 377.35 bp. The sequence length of fungi ranged from 140 to 530 bp, with an average of 251.05 bp. By clustering the sequences with 97% similarity, a total of 2392 bacterial OTUs were obtained, belonging to 30 phyla, 80 classes, 184 orders, 283 families, 501 genera, and 961 species, and 3049 fungal OTUs were obtained, belonging to 17 phyla, 58 classes, 141 orders, 314 families, 664 genera, and 1037 species. Ace and Chao indices reflect the richness of microbial community, and Shannon and Simpson indices reflect the diversity of microbial community. As shown in Table 5, Ace, Chao, Shannon and Simpson indices have certain differences in different karst microhabitats, but none has reached a significant level (p > 0.05). The highest Shannon index, Ace index, Chao index and Simpson index were found in SS, indicating that the bacterial community richness and community diversity were the highest in SS. For fungi, the Shannon index showed RG > SS > RS, Simpson index showed SS > RS > RG, and Ace index and Chao index showed RS > RG > SS. In summary, bacteria richness in SS was the highest, followed by RG, RS was the lowest, and fungal community diversity showed RS > RG > SS.
Through the analysis of Venn diagram, the coincidence of OTU among samples can be obtained, reflecting the number of common and unique OTU in different karst microhabitats (Figure 3). Among the three karst microhabitats, 968, 871 and 883 bacteria OTU were found in ZN, QL and WM, respectively, while 249, 364 and 206 fungi OTU were found in ZN, QL and WM, respectively. The bacterial community’s common OTU of SS, RS and RG samples in ZN accounted for 88.81%, 86.74% and 86.58%, respectively; QL and WM samples accounted for 83.83%, 86.24% and 87.19%, and 80.27%, 83.91% and 77.01%, respectively. As for the common OTU of fungi, the proportion of each karst microhabitat sample in ZN was 34.11%, 35.72% and 36.03%, respectively, and that in QL and WM was 37.68%, 28.39% and 38.25%, and 24.58%, 28.93% and 22.08%, respectively. The results showed that bacterial groups in different karst microhabitats had higher similarity, fungal groups had more unique OTU, and the differences among different karst microhabitats were higher. By comparing the microbial OTU of ZN, QL and WM, it can be found (Figure 4) that there are 1230, 1142 and 1276 bacterial OTU, and 1311, 1587 and 1631 fungi, respectively. The fungal OTU of the three regions is higher, and WM has the highest bacterial and fungal OTU compared with ZN and QL.

3.4. Analysis of Microbial Community Composition in Different Karst Microhabitats

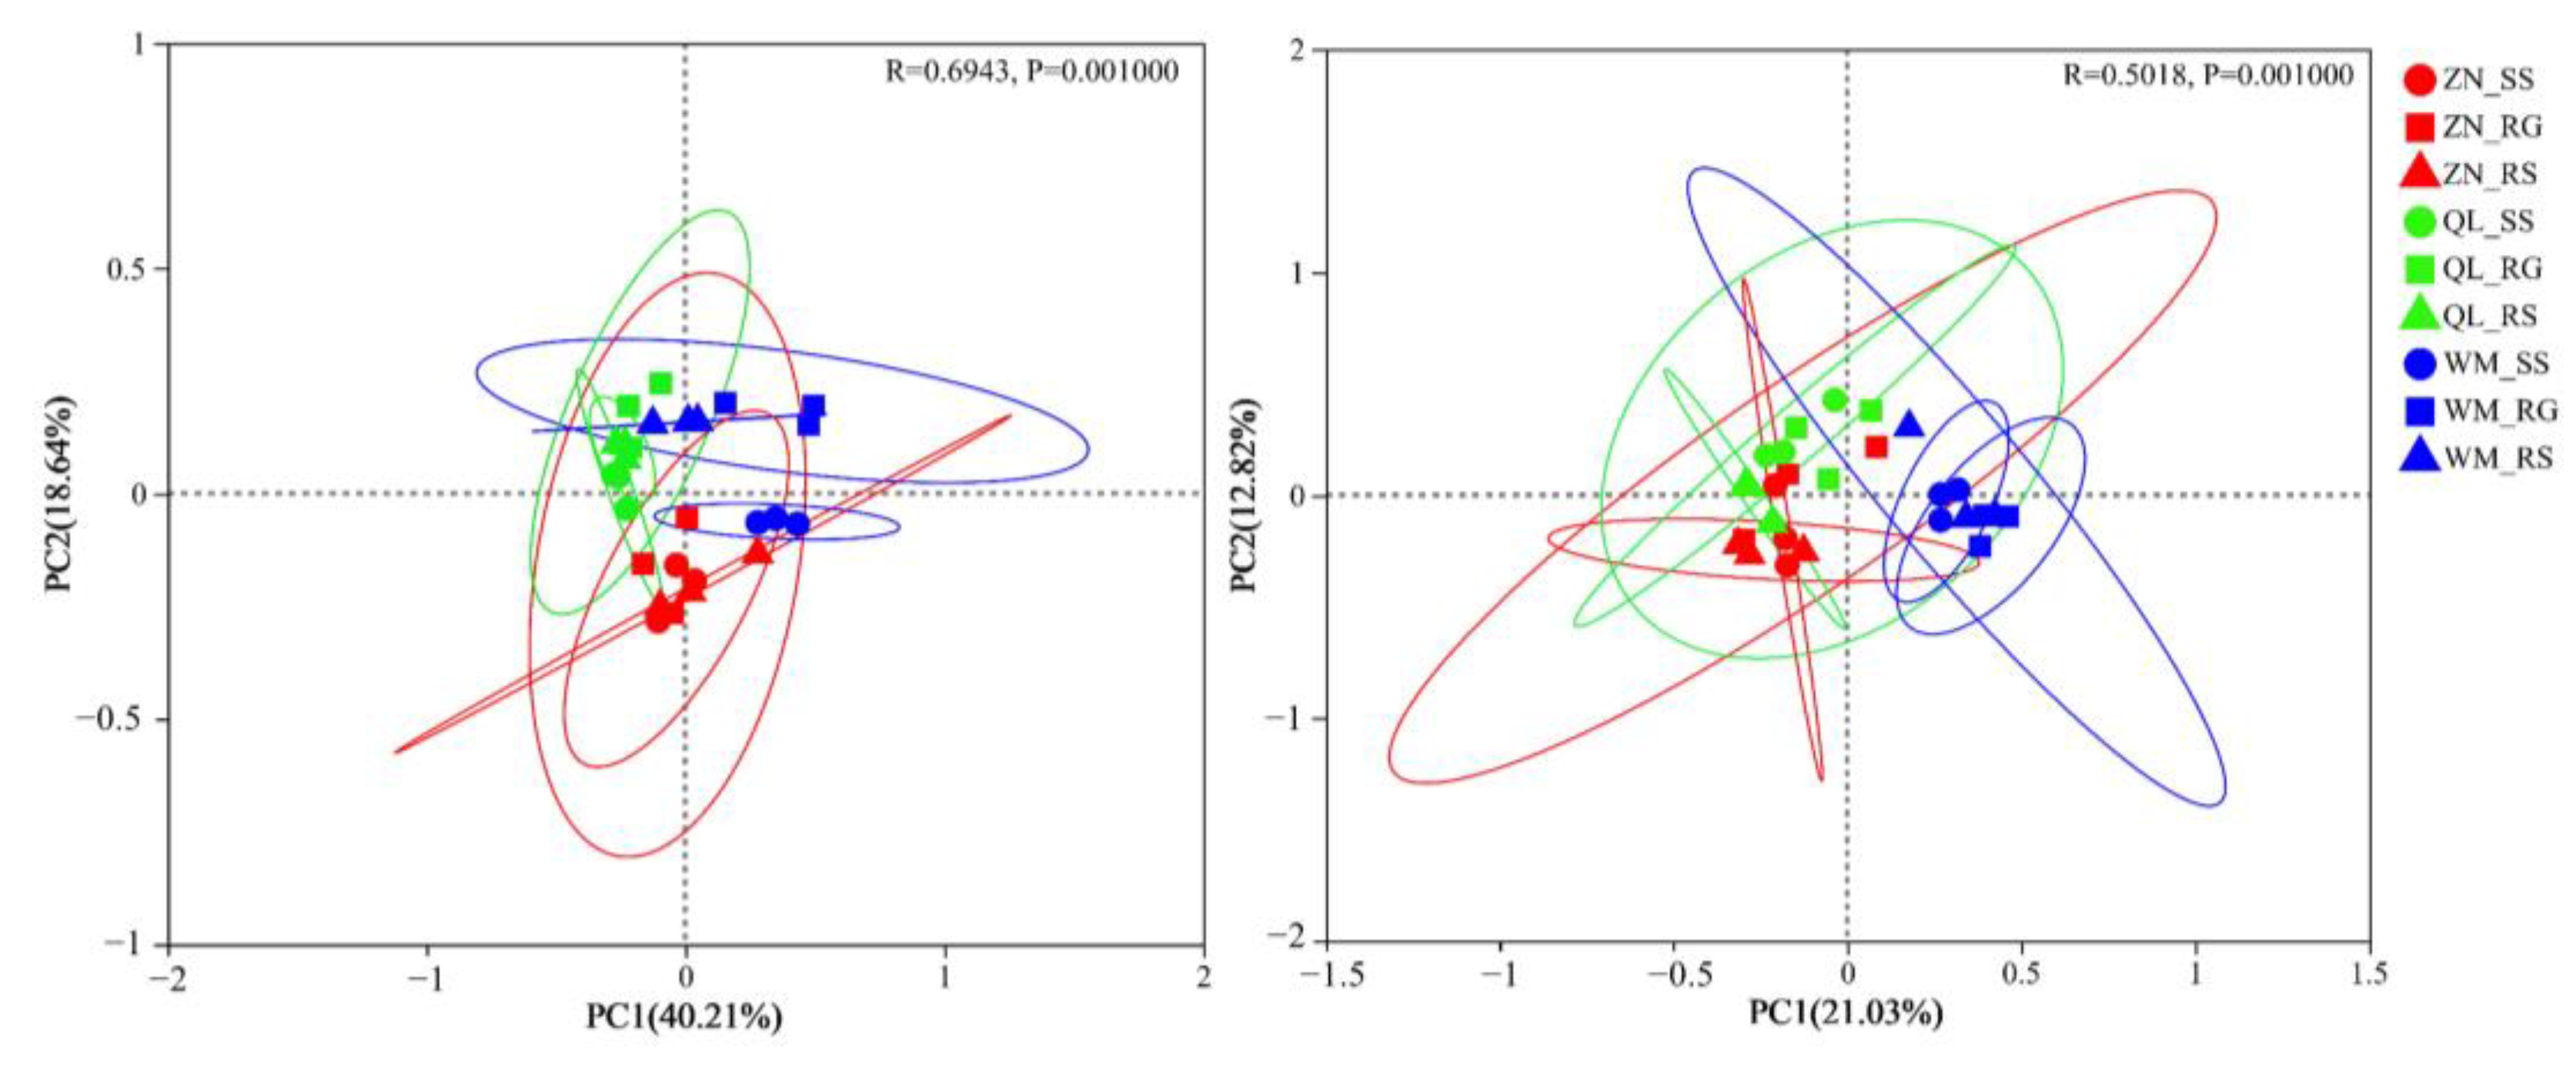
3.4.1. PCoA Analysis

Based on the Bray–Curtis algorithm, the PCoA analysis of soil bacteria and fungi was conducted to explore the similarity or difference in community composition between soil samples in different karst microhabitat s at the Phylum level (Figure 5). The results showed that, at the OTU level, the interpretive variances of bacteria PC1 and PC2 were 40.21% and 18.64%, and the interpretive variances of fungi PC1 and PC2 were 21.03% and 12.82%, respectively. The cumulative interpretive abilities were 58.85% and 33.85%, respectively. When looking at the region alone, no matter bacteria or fungi, the distance between ZN and QL samples in the figure is relatively close, indicating that the soil microbial species composition of ZN and QL in different karst microhabitats is similar, while the bacterial and fungal species compositions of WM in different karst microhabitats are different to some extent. RG and RS samples are close and similar in species composition, while they differ significantly from SS samples. These results indicated that the species composition of RG, RS and SS was different. The distance of samples between regions was far, indicating significant differences in microbial diversity between regions.

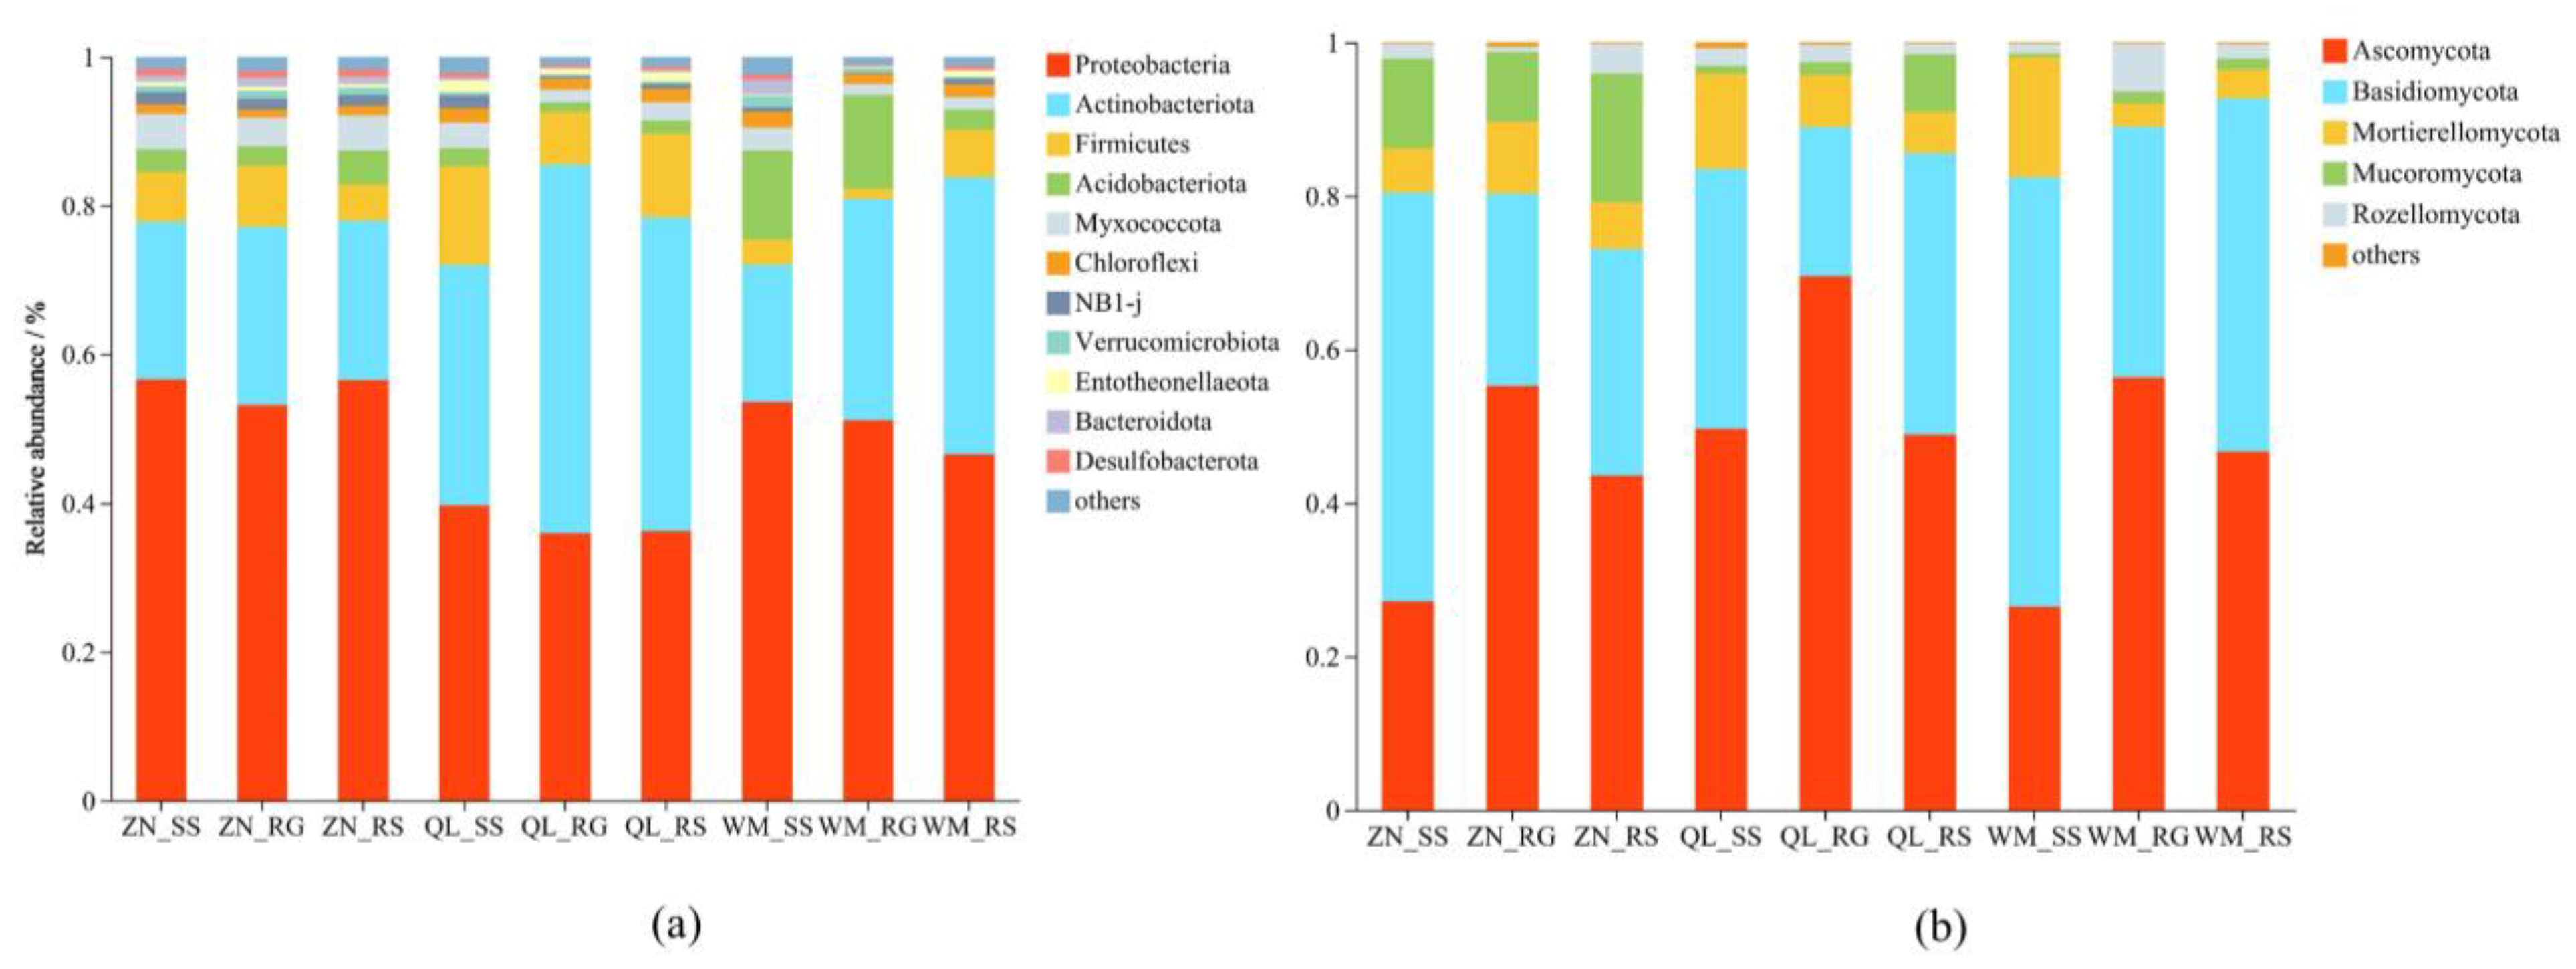
3.4.2. Microbial Community Structure

At the phylum level, the species with high relative abundance in soil microorganisms in different karst microhabitats were consistent (Figure 6). At the phylum classification level, soil bacteria mainly consisted of seven types of bacteria (relative abundance >1%), namely, Proteobacteria, Actinobacteriota, Firmicutes, Acidobacteriota, Myxococcota, Chlorofleexi and NB1-j. Proteobacteria and Actinobacteriota had the highest relative abundance, with 35.93% (QL_RG), 56.64% (ZN_SS), and 18.38% (WM_SS), 49.55% (QL_RG), respectively. At the phylum classification level, there were five main fungal groups, namely, Ascomycota, Basidiomycota, Mortierellomycota, Mucoromycota and Rozellomycota. Ascomycota and Basidiomycota had the highest relative abundance: 26.50% (WM_SS), 69.52% (QL_RG), 19.47% (QL_RG) and 55.96% (WM_SS), respectively.
The species abundance clustering heat map displays the abundance changes in different species in samples through color block color gradient, which is convenient for more intuitive study of community composition. Three karst microhabitat samples from different regions were taken as units, and the top 50 genera with the abundance of bacteria and fungi in each habitat species were plotted into clustering heat maps of species abundance of bacteria and fungi in different karst microhabitats (Figure 7). Figure 6 shows that at the genus level, bacteria can be divided into three classes: Type 1, composed of WM_SS and WM_RG; Type 2, composed of ZN_SS, ZN_RG and ZN_RS; and Type 3, composed of WM_RS, QL_SS, QL_RG and QL_RS. At the genus level, Bacillus of Firmicutes, Mycobacterium of Actinobacteriota and two unidentified genera and Xanthobacteraceae of Proteobacteria were the top five in terms of bacterial abundance. Fungi can be divided into two classes at the genus level, i.e., Type 1, consisting of samples of ZN and QL, and Type 2 for WM. The top five fungi in abundance are Geminibasidiidium (Basidiomycota), Trichoderma (Ascomycota) and Archaeorhizomyces (Archaeorhizomyces), Mortierella in Mortierellomycota and Bifiguratus in Mucoromycota. At the same time, the relative abundance of Russula and Hygrocybe in Basidiomycota differed greatly, Russula was the highest in SS, and Hygrocybe was the highest in RG at the level of the highest microbial genus WM, ZN and QL samples. In general, there were great differences in microbial communities among different regions at the microbial genus level, which may lead to soil heterogeneity in different karst microhabitats. However, there was little difference between different karst microhabitats in the same region, indicating that the difference of environmental factors in different regions had more influence on the composition of soil microbial community than the type of karst microhabitats.

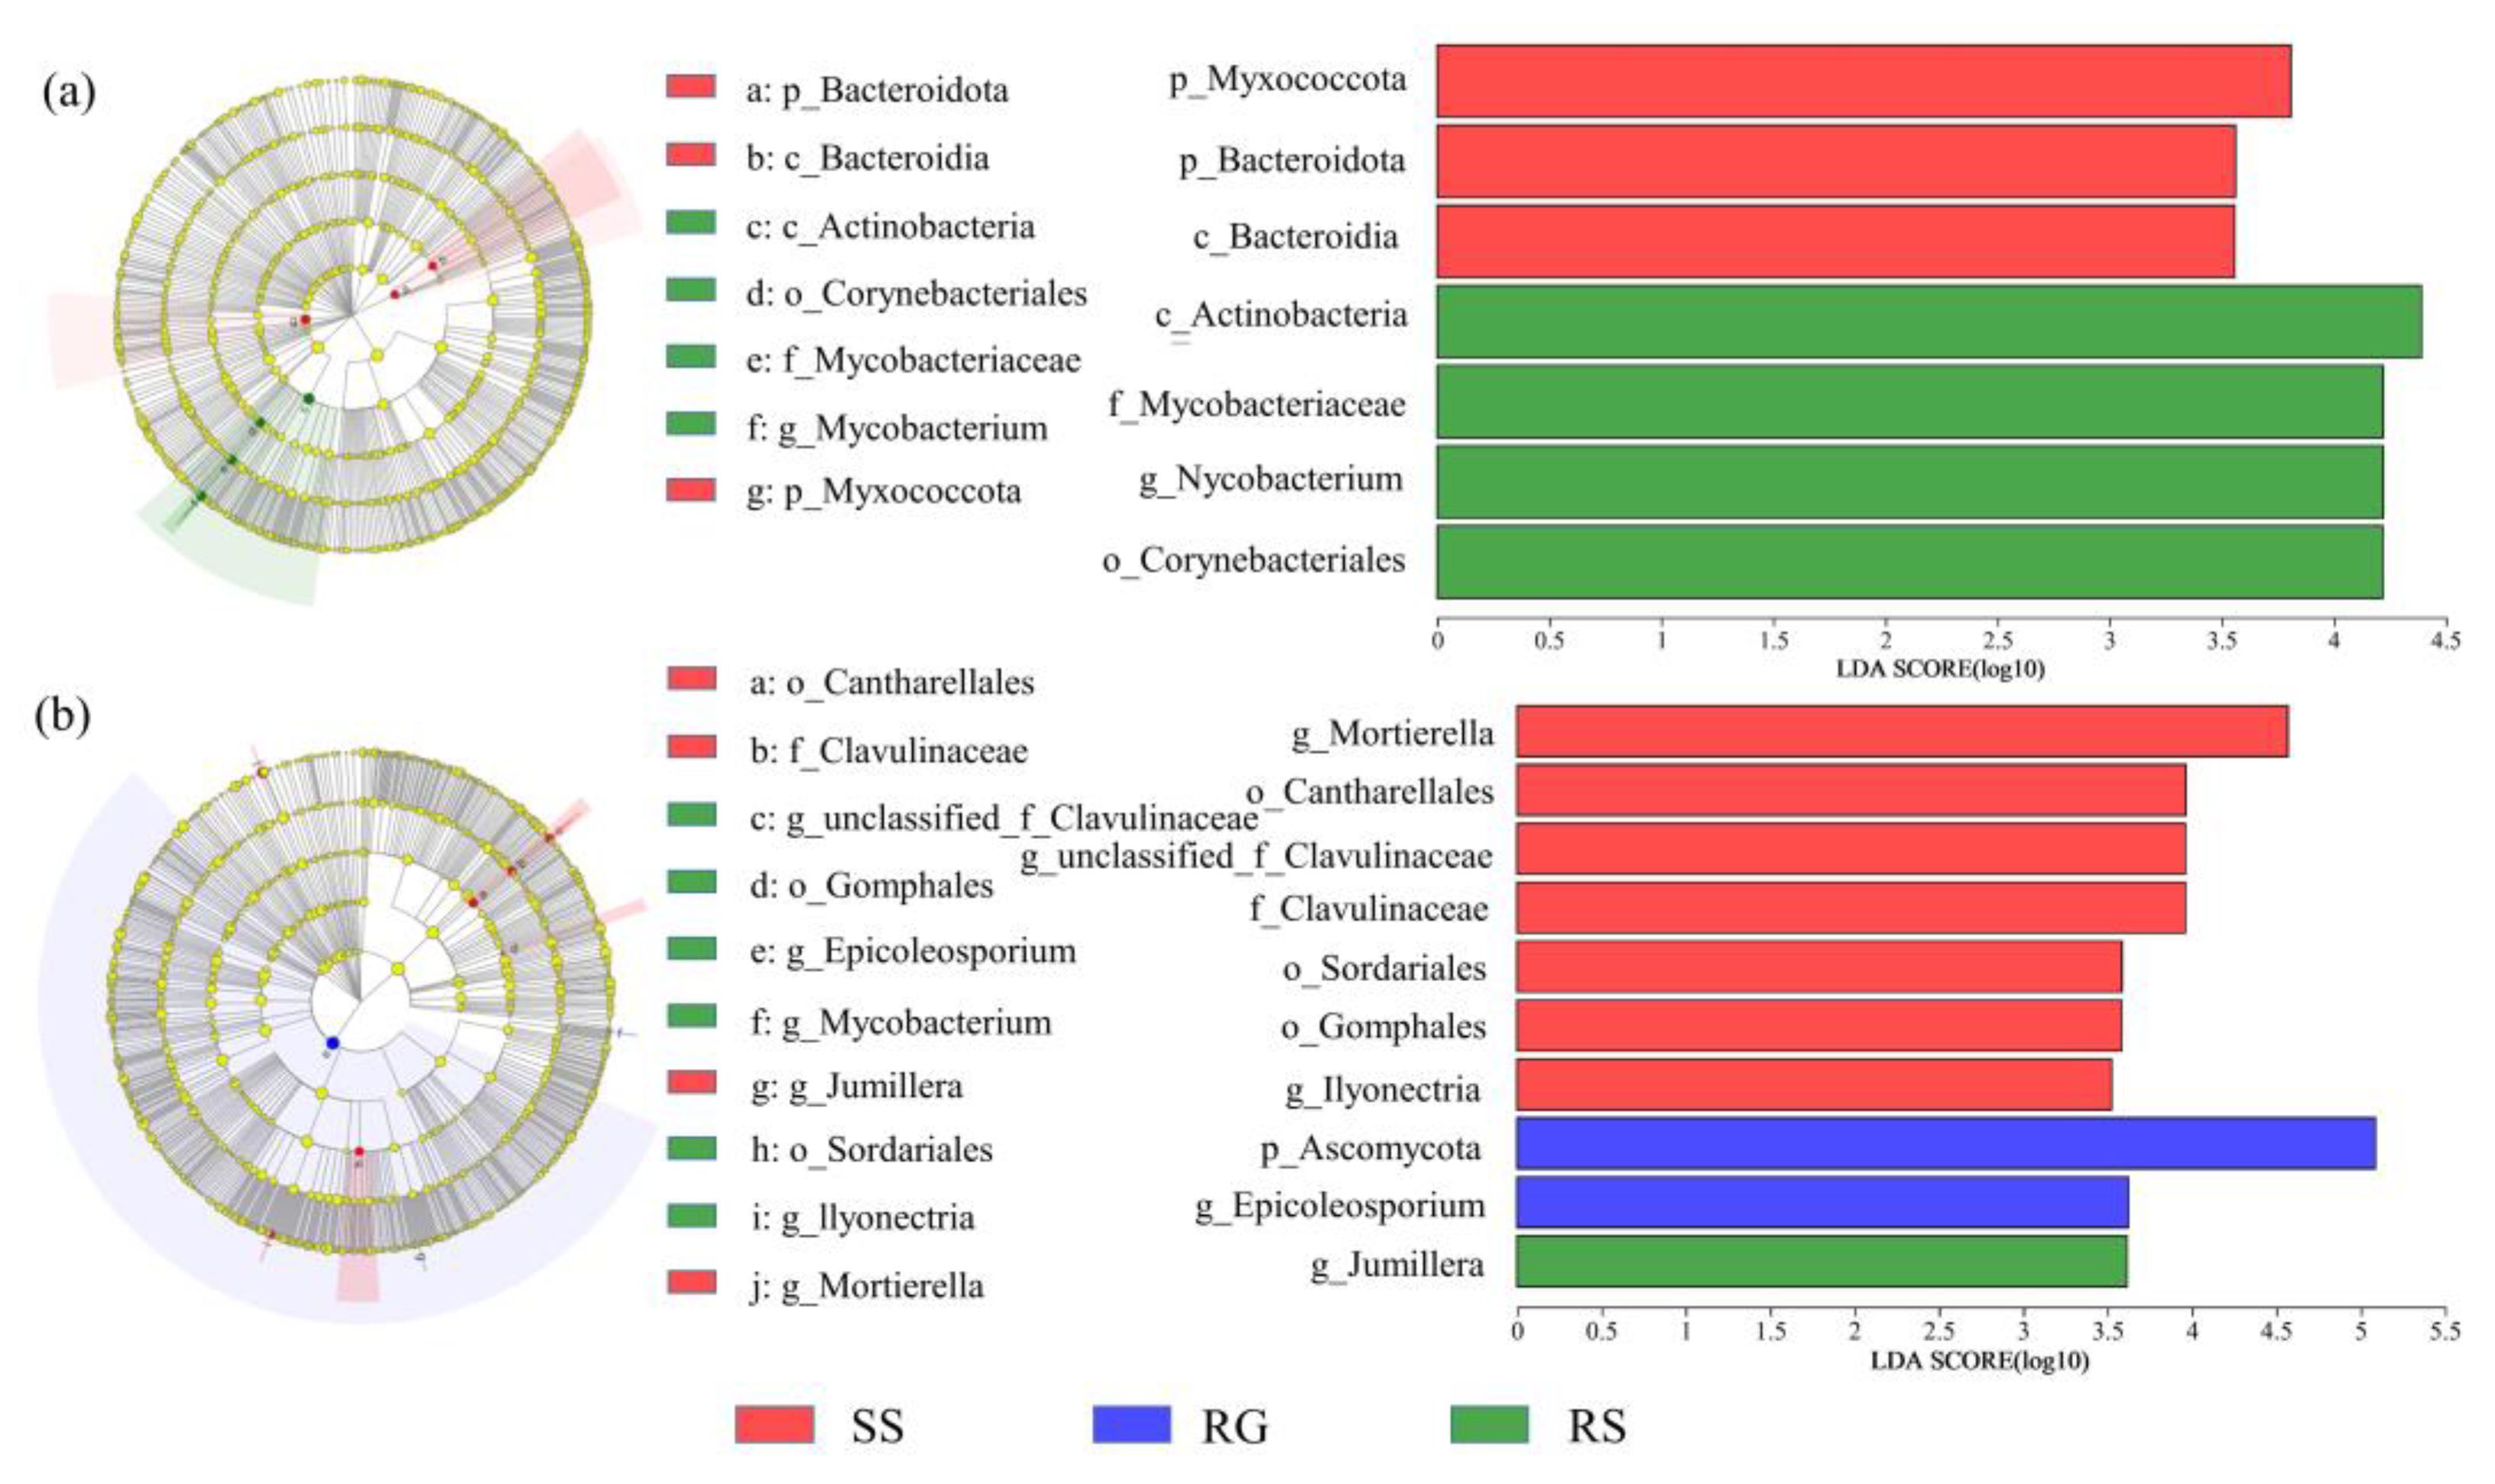
3.5. Differences in Soil Microbial Communities in Different Karst Microhabitat

In order to explore the signature species of soil microbial community composition differences in different karst microhabitats, linear discriminant analysis (LDA) effect size (LEfSe) was used to identify the significant differences between active communities in different karst microhabitats (LDA > 3.5) [33]. LEfSe analysis results showed that (Figure 8), when LDA > 3.5 was taken as the criterion for significant difference, there were 7 bacteria groups and 10 fungi groups with significant differences in the three karst microhabitats. In RS, SS followed, and RG had no significant species difference. The species of fungi in SS had the most significant differences, followed by RG and RS. Myxococcota, Bacteroidota and Bacteroidia had significant differences in SS. Significant differences in RS include Actinobacteria, Mycobacteriaceae, Mycobacterium and Corynebacteriales. For fungi, there had significant differences in SS include Mortierella, Cantharellales, Clavulinaceae, Clavulinaceae, Sordariales, Gomphales, Ilyonectria; Ascomycota and Epicoleosporium had significant differences in RG; Jumillera had significant differences in RS. Among them, Actinobacteria and Ascomycota had the largest significant difference value, indicating that Actinobacteria and Ascomycota had the greatest impact on the diversity of microbial communities in the karst microhabitats.

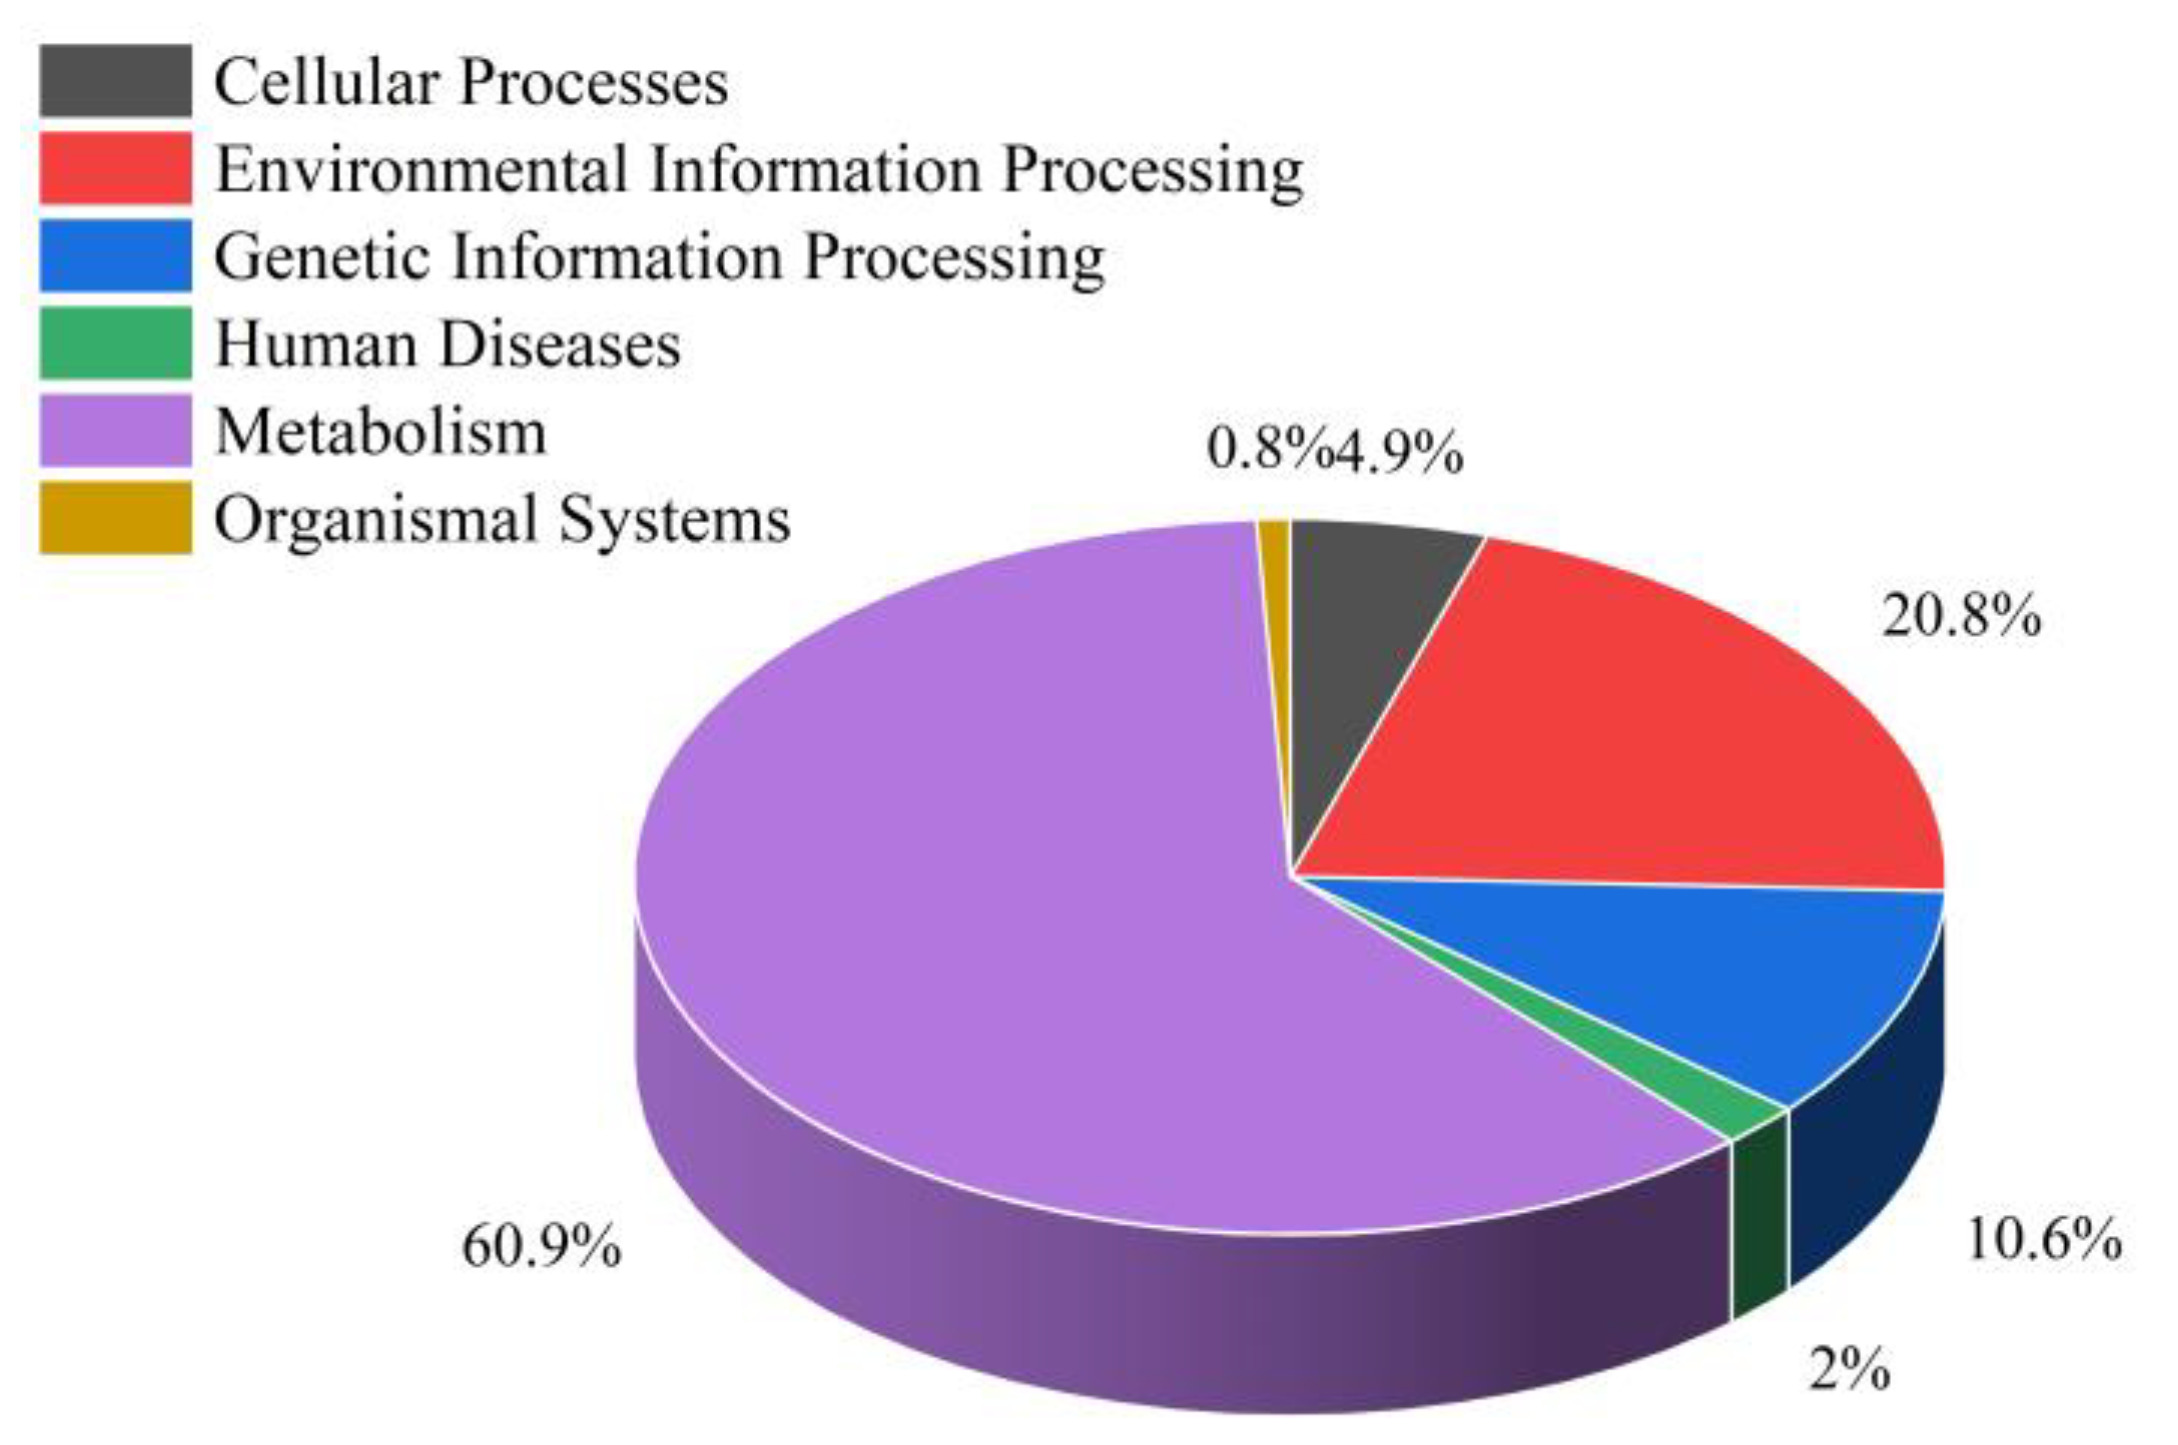
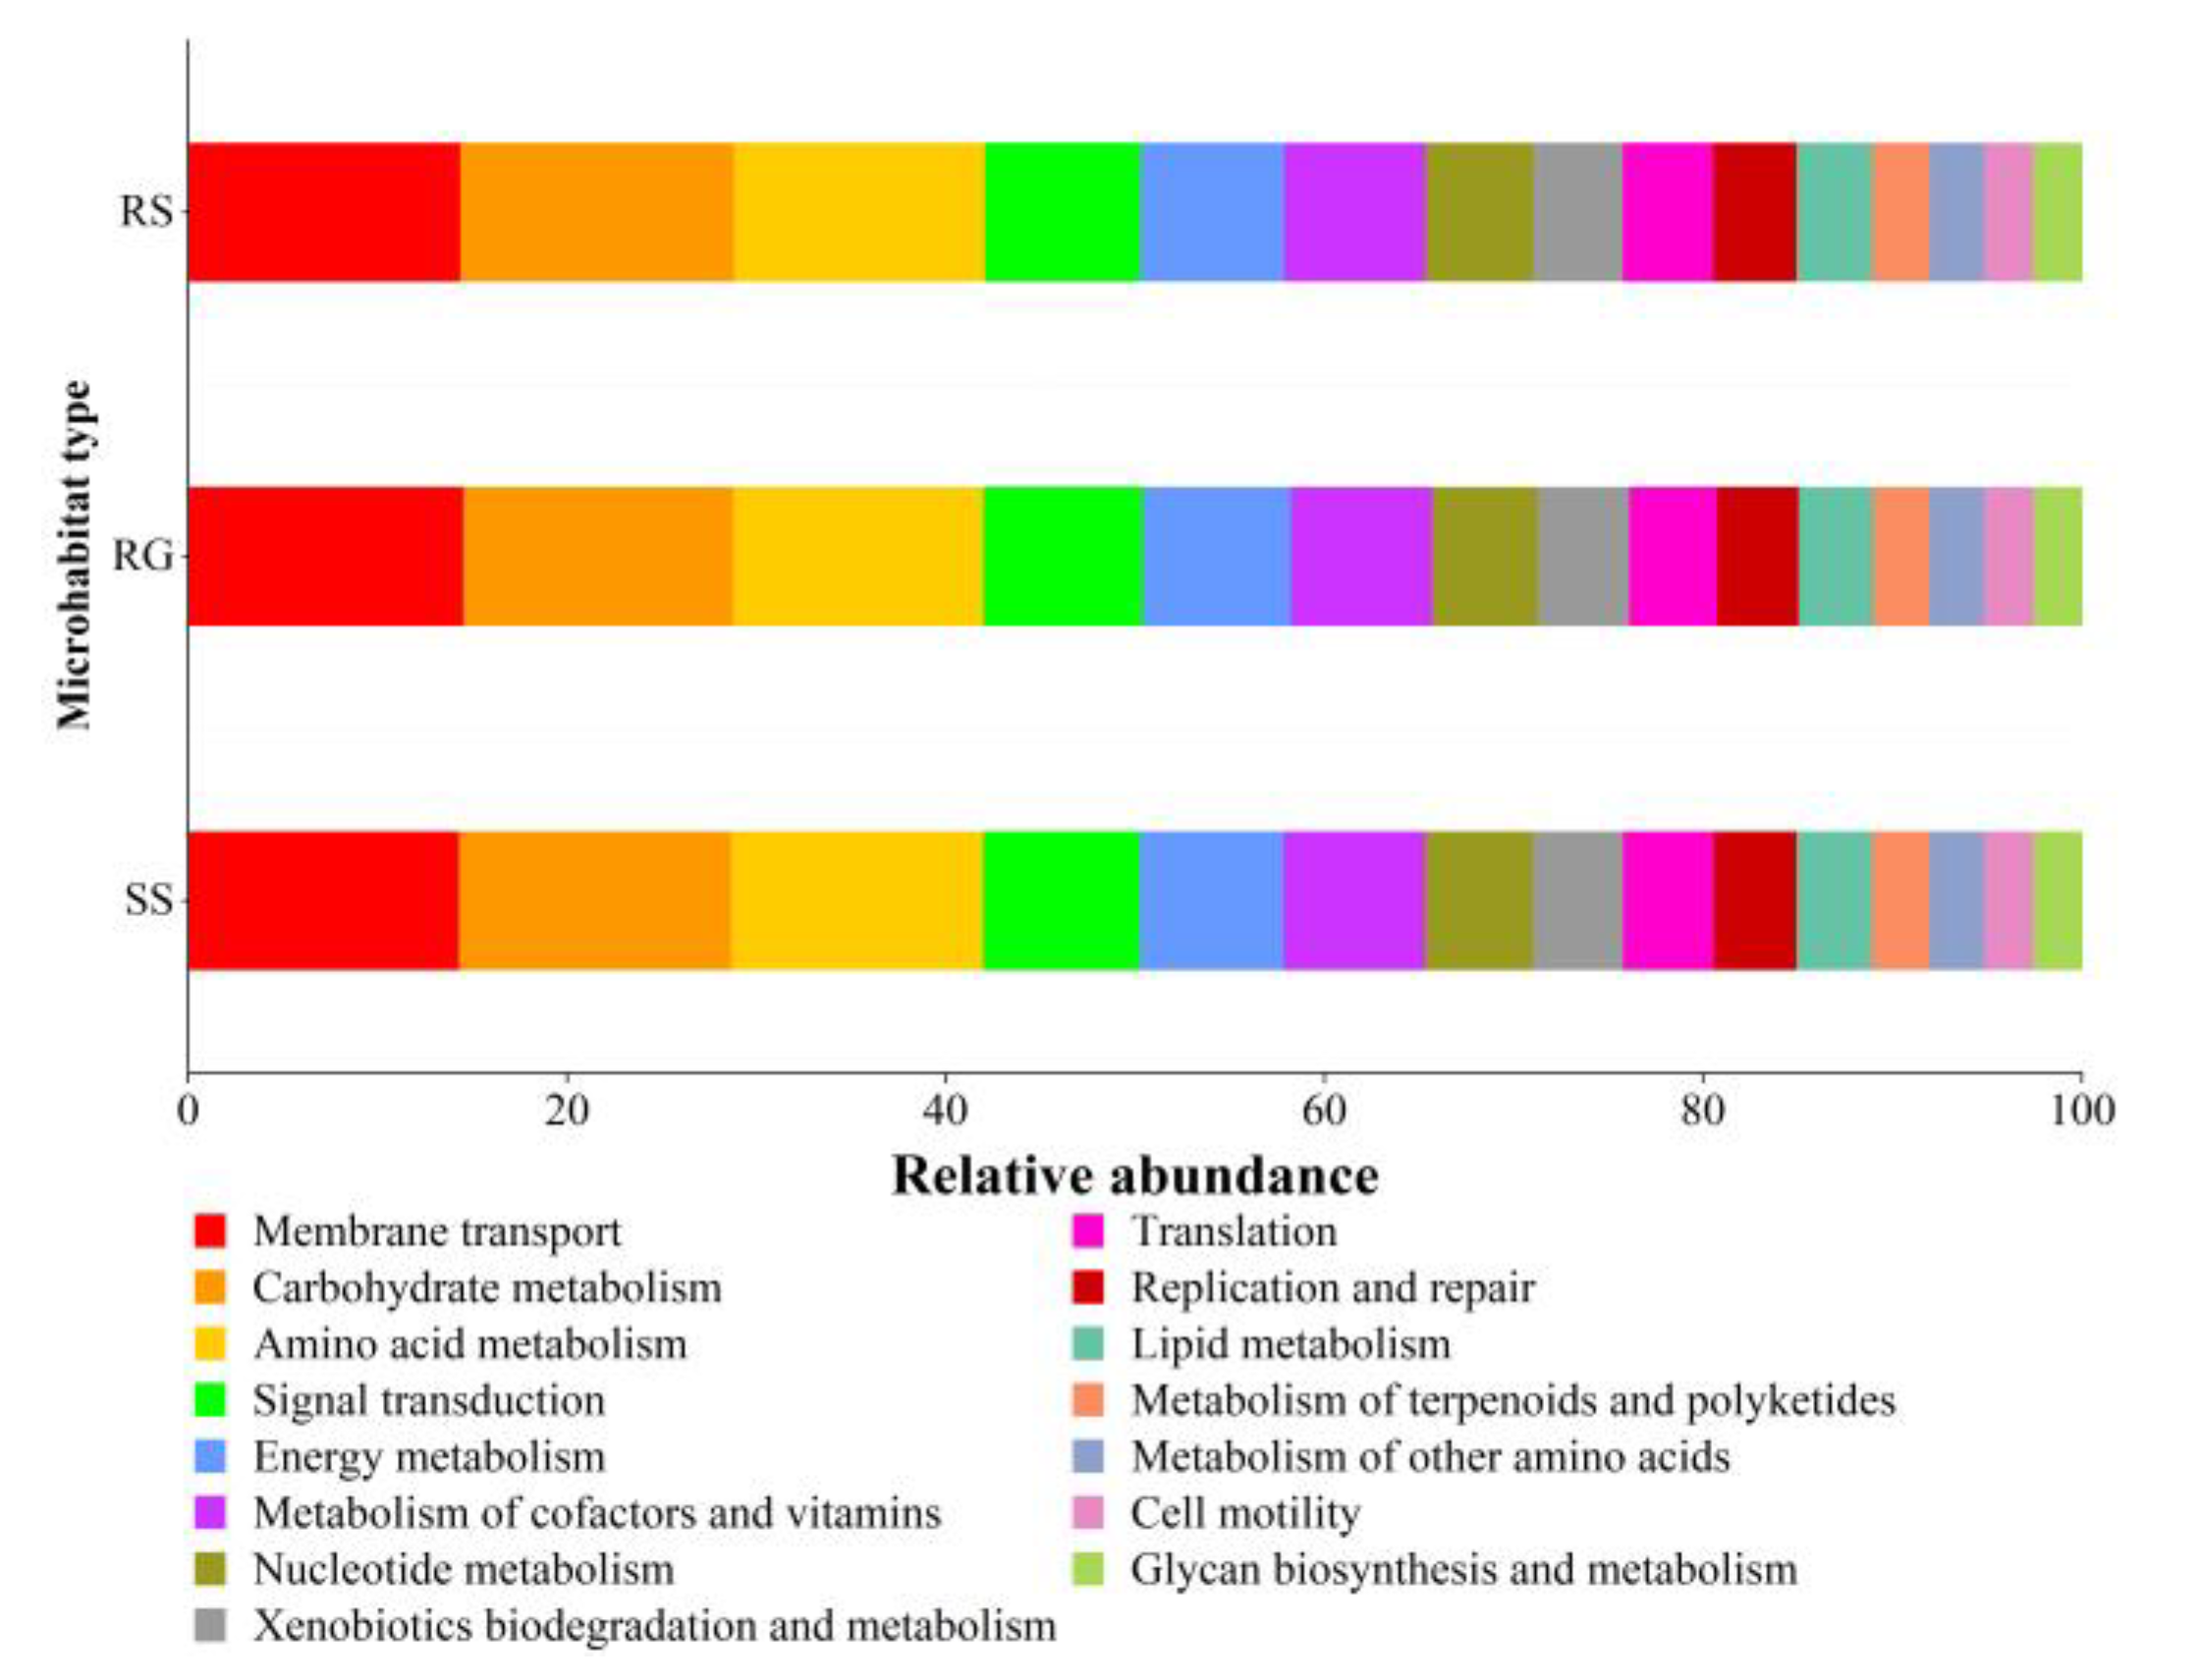
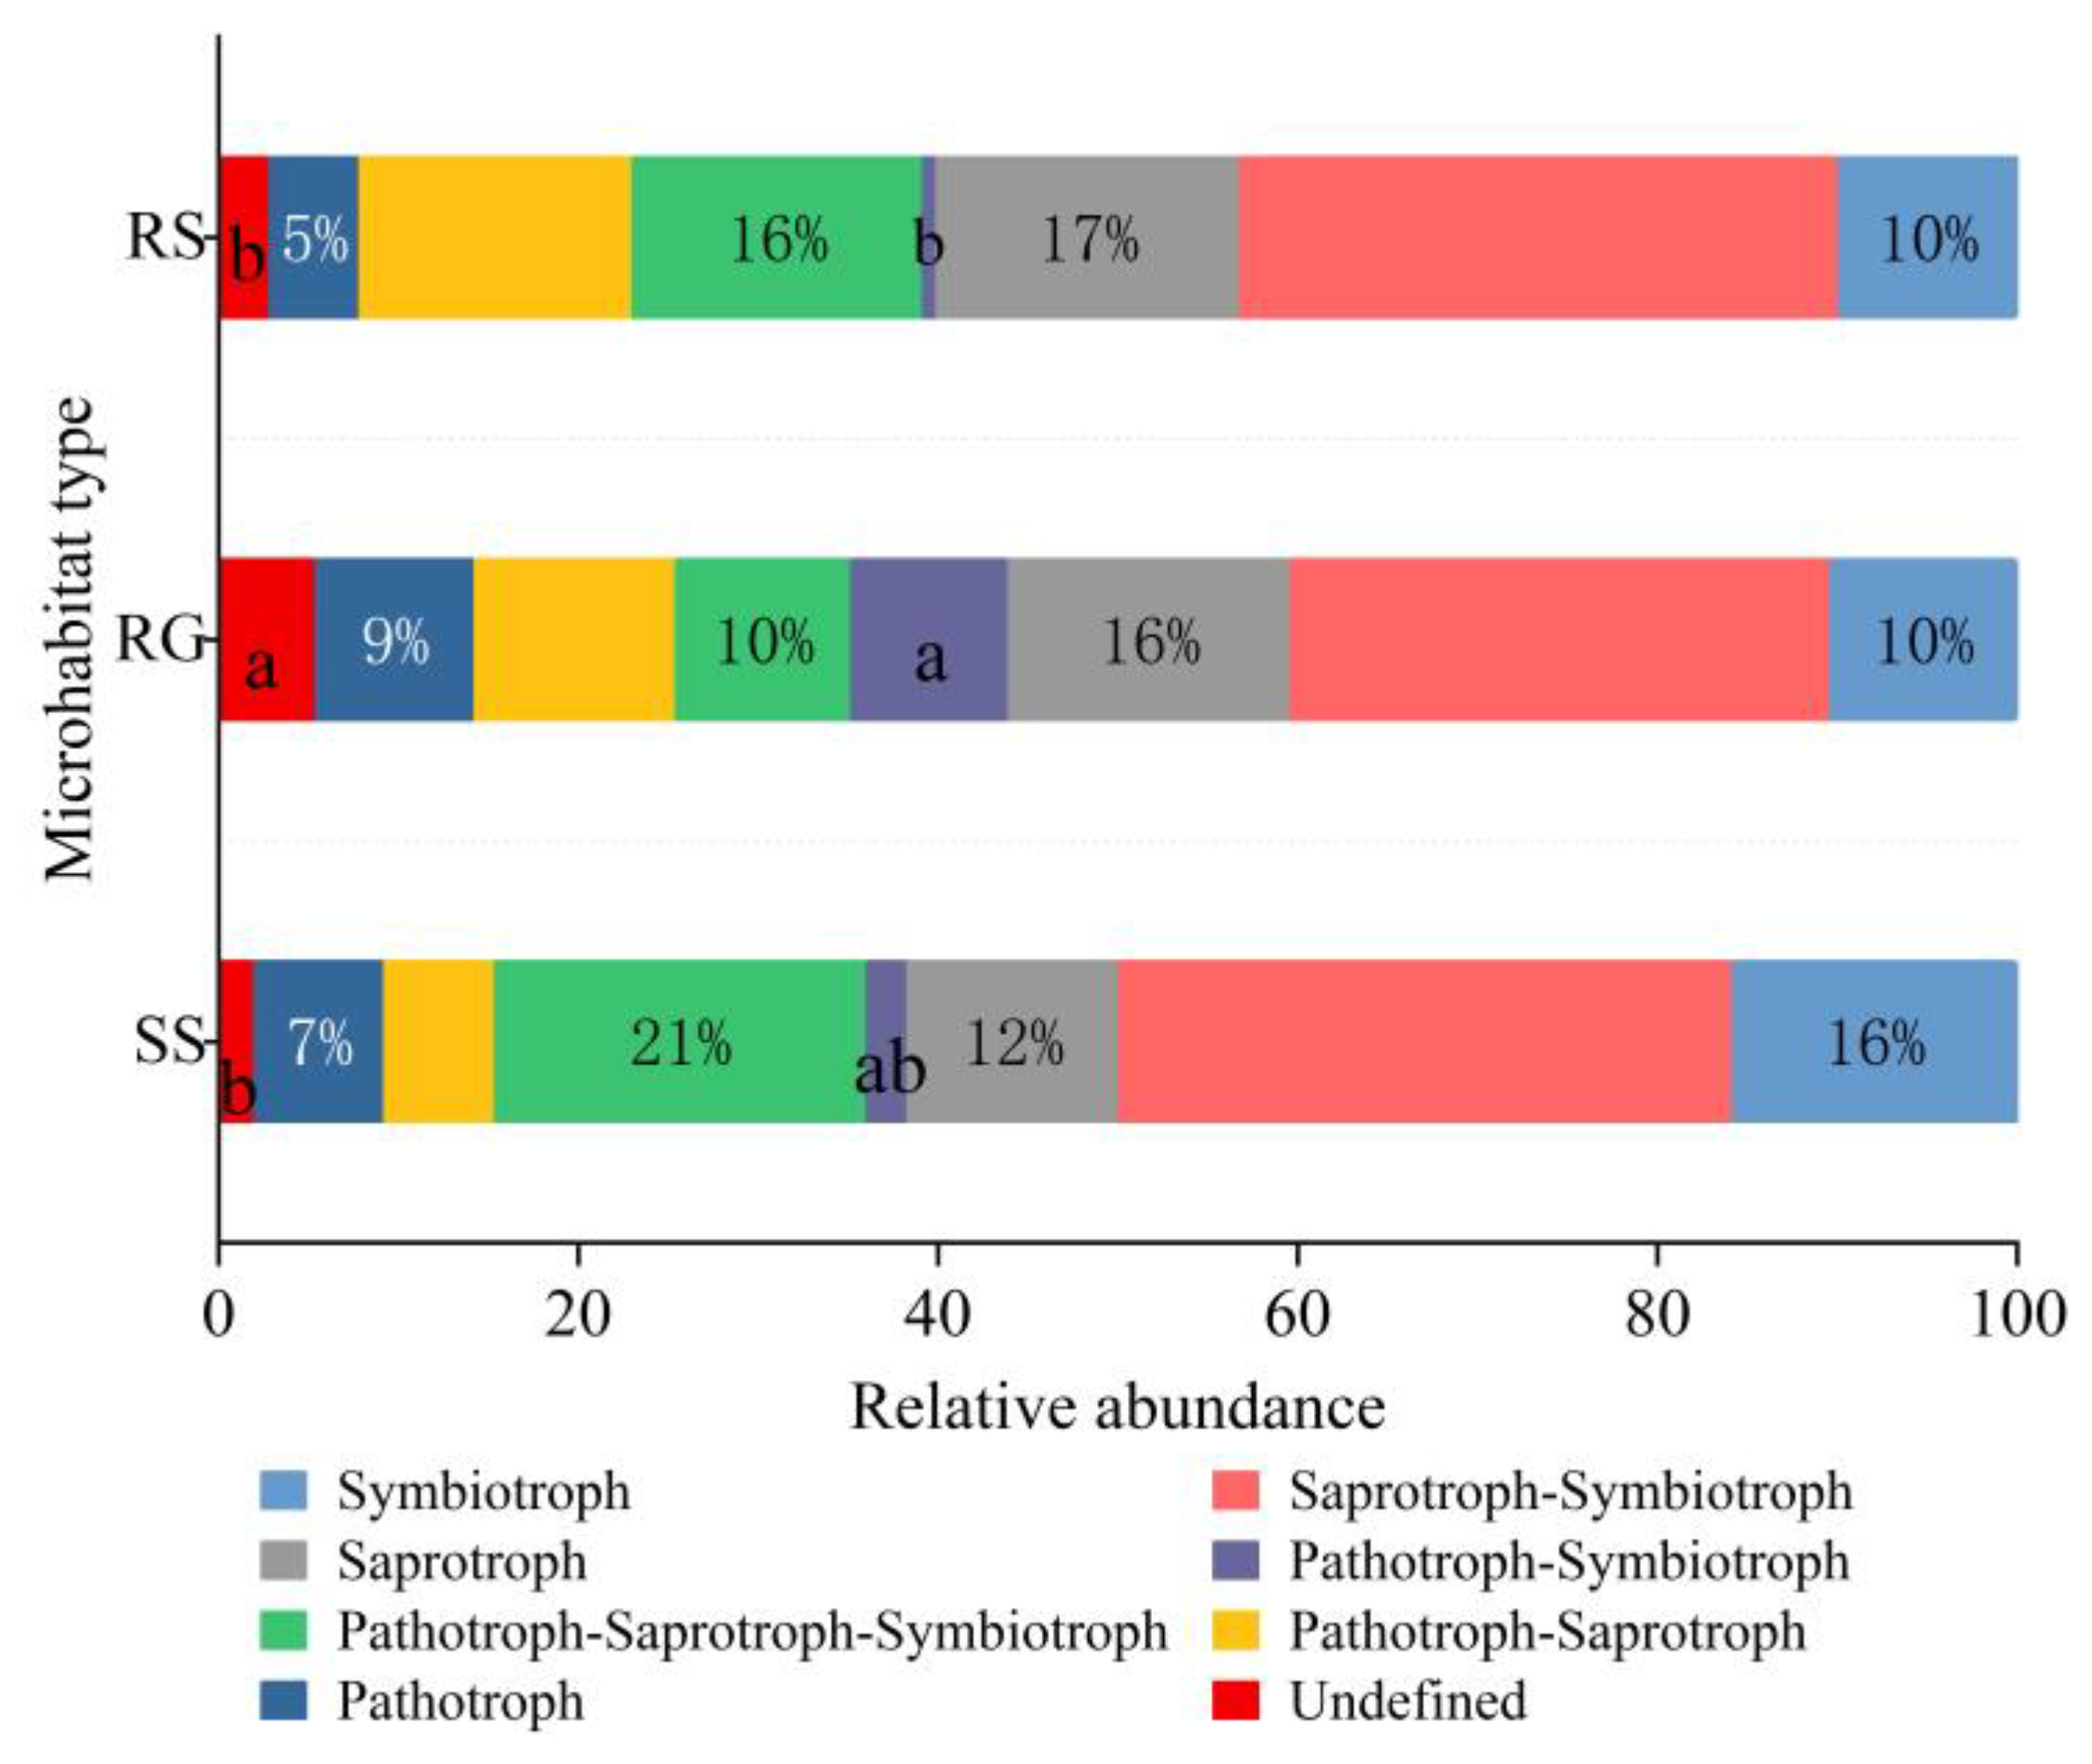
3.6. Notes on the Function of Soil Microorganisms

Tax4Fun was used to annotate the functions of bacteria based on KEGG database (Figure 9), and a total of six functional genes of primary metabolic pathways were obtained, mainly including metabolism and environmental information processing, accounting for 60.9% and 20.8% on average, respectively. A total of 40 features were annotated on secondary metabolic pathways, and Figure 10 only showed the relative functional group abundance of the top 15 bacteria. Major bacterial functional annotations in karst microhabitats (relative abundance > 5%) include membrane transport, carbohydrate metabolism, amino acid metabolism, signal transduction, energy metabolism, cofactor and vitamin metabolism, and nucleotide metabolism. There was no significant difference in bacterial functional diversity among the three karst microhabitats (p > 0.05).
Annotating the fungal function using FUNGuild (Figure 11), fungi can be divided into Pathotroph, Saprotroph, Symbiotroph, pathotroph-saprotroph, pathotroph-saprotroph-symbiotroph, pathotroph-symbiotroph and saprotroph-symbiotroph. The three karst microhabitats were dominated by saprophytic and symbiotic transitional fungi with an average abundance of 30–34%, followed by saprotrophic fungi with an average abundance of 12–17%. The abundance of pathophysiological transitional fungi in RG was significantly higher than that in RS (p < 0.05), but there was no significant difference among other fungi in different karst microhabitats (p > 0.05).

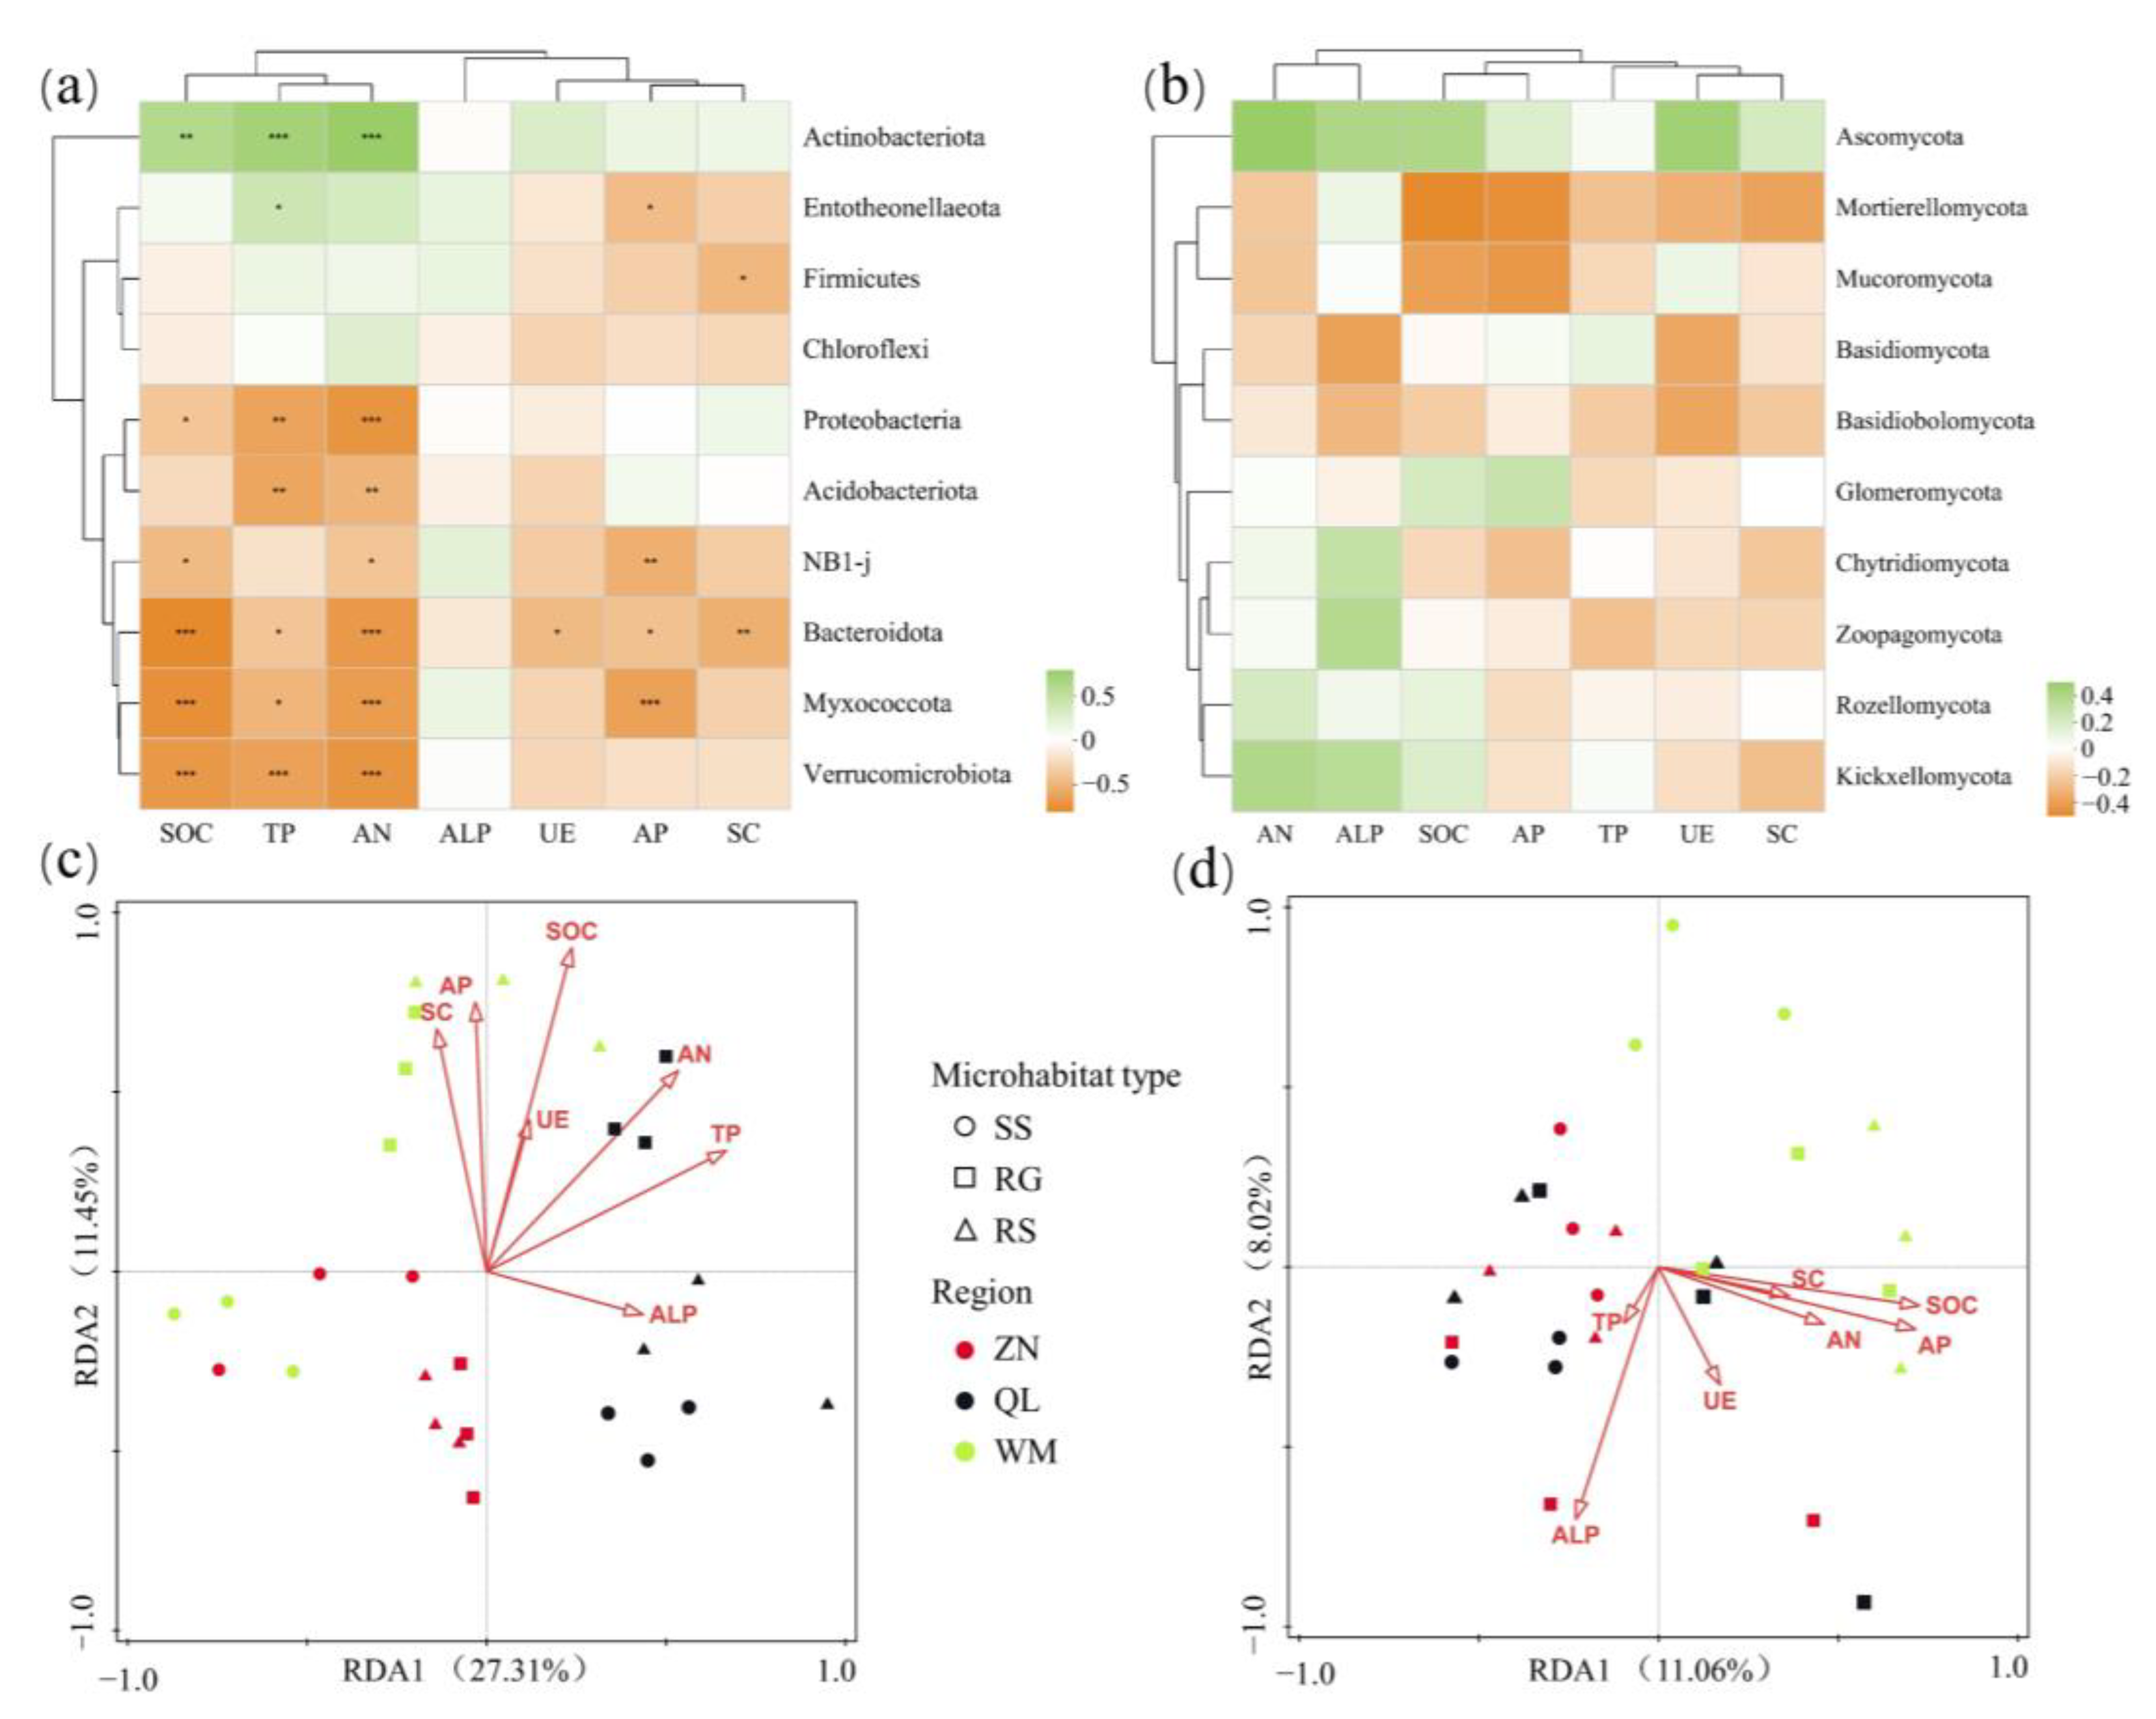
3.7. Relationship between Microbial Community Structure and Soil Factors

Variance inflation factor analysis (VIF) can avoid the presence of collinear environmental factors to obscure its effect on microbial community structure by screening environmental factors. The result shows that TN needs to be removed, and correlation analysis and redundancy analysis were carried out between the remaining seven soil environmental factors and community structure.. The results showed that at the phylum level of bacteria (Figure 12a), the contents of SOC, TP and AN were significantly negatively correlated with Proteobecteria, Acidobacteriota, Bacteroidota, Myxococcota and Verrucomicrobiota (p < 0.05). AP had a significant negative correlation with Entotheonellaeota, NB1-j, Bacteroidota and Myxococcota (p < 0.05), while Actinobacteriota had a significant positive correlation with SOC, TP and AN (p < 0.05). Environmental factors had no significant effect on fungal community abundance (Figure 12b). The first two ranking axes accounted for 38.76% and 19.08% of the total variation of the relationship between soil bacterial (Figure 12c) and fungal (Figure 12d) community structure and soil physicochemical properties, respectively. The bacterial community was significantly affected by TP (p < 0.01), SC (p < 0.01), SOC (p < 0.05) and ALP (p < 0.05), while the fungal community was significantly affected by SOC (p < 0.05) and ALP (p < 0.05).

4. Discussion

4.1. Effects of Habitat Heterogeneity on Rhizosphere soil Microbial Diversity

Vegetation types and species configurations vary in karst heterogeneous habitats, and soil microbial diversity varies significantly under different vegetation types [34]. In this study, high-throughput technology was used to detect the variation characteristics of the rhizosphere soil microbial community diversity in three karst microhabitats (SS-RS-RG) of R. pudingense, a plant endemic to karst stony mountains. The study showed that the soil microbial groups in the karst area were relatively rich, including 30 phyla, 80 classes, 184 orders, 283 families, 501 genera and 961 species of bacteria, and 17 phyla, 58 classes, 141 orders, 314 families, 664 genera and 1037 species of fungi. It is higher than Rhododendron moulmainense [35] and Rhododendron rubiginosum [36] in the normal mountains. The more species and higher number of microorganisms, the stronger the biological activity of soil, and the more beneficial it is to the growth of plants, which may be one of the factors that plants can adapt to the harsh karst environment. In this study, the microbial diversity index did not reach a significant difference level among the three karst microhabitats (p > 0.05), and only a small difference existed, indicating that soil microbes could still maintain a relatively stable state in heterogeneous microhabitats to maintain normal physiological and ecological processes. This may be related to the tolerance and self-recovery ability of karst forests to natural disturbances [37]. A higher organic matter content in karst soils can reduce the burden of microbes under environmental stress and increase the stability of microbial communities [38]. Microbial diversity is usually positively correlated with activity, and the quality of soil conditions will directly affect microbial activity and diversity [39]. Compared with the two karst microhabitats prone to short-term drought, the bacterial richness in SS is higher, and the fungal richness is lower. The reason may be that, from the perspective of bacteria and fungi as a whole, drought has a certain inhibitory effect on the soil bacterial richness, while fungi are more adaptable to the arid stone surface and stone gully, thus maintaining a higher richness [40]. The roots of rhododendrons can also form mycorrhizal symbionts with some soil fungi, which can help plants to alleviate environmental stress and survive under adversity [41], which is beneficial to the enrichment of microbial diversity. To a certain extent, the study of soil microorganisms in karst can explain the ecological characteristics of plants in this region. The presence of plants contributes to the increase in soil microbial diversity, which also promotes the formation of soil fertility [42] and enhances the ability of plants to adapt to heterogeneous habitats.

4.2. Effects of Habitat Heterogeneity on Rhizosphere Soil Microbial Community Structure

Karst microhabitats are intricate and unevenly distributed, and their spatial distribution and combination are random. There are differences in light, temperature, water and other factors among karst microhabitats, which ultimately results in soil heterogeneity [15,43]. Compared with climate change and geographical location differences, soil microbial community structure is more affected by soil heterogeneity [44], and microorganisms respond to environmental changes mainly by adjusting community structure [45]. In this study, the community structures of bacteria and fungi in the three karst microhabitats were similar at the phylum and genus levels. Bacteria were mainly Proteobacteria and Actinomycetes, which were common symbiotic bacteria in karst areas, while fungi were mainly Ascomycetes and Basidiomycetes, which was consistent with the results of previous studies [46]. Maestre et al. [40] found that soil microbial communities have different tolerance to drought. For example, Actinomycetes have strong resistance to drought, while Acidobacteria have weak resistance to drought. In this study, although there was no significant difference in bacterial community structure at the level of phylum in different karst microhabitats, Actinomycetes were more dominant in RG and RS microhabitats, but the abundance of Acidobacteria was significantly lower than that in SS microhabitats with a stronger soil water retention ability. This phenomenon may be related to the degree of habitat drought. At the generic level, the microbial communities were similar among the karst microhabitats, but there were differences among the regions, which might be related to the interregional climatic conditions and vegetation composition. Compared with the bacterial community, the fungal community has more unique OTUs and less common OTUs, which may be due to the fact that the fungi community is more complex than the bacteria community, and it forms a unique survival structure to adapt to harsh environments [47]. According to the results of PCoA analysis, whether bacterial or fungal, the microbial composition in RG and RS habitat is more similar, but it is not exactly the same as that in SS. It may be that SS has better soil texture and can better preserve nutrients and water [15,48], and the rapid change in water in RG and RS causes certain physiological pressure on microorganisms [49]. At the same time, the bare bedrock causes large temperature fluctuations in RG and RS [17], and the microclimate is different [20]. In order to adapt to this feature, the microbial species composition is different from that in SS.
The microbial community structure was affected by soil environmental conditions. In this study, both bacterial and fungal communities were affected by SOC content and ALP enzyme activity. It has been reported that SOC and ALP have certain effects on a microbial community structure [50]. In an environment with high SOC content and high enzyme activity, bacteria such as Actinobacteria can well adapt to soil through their physiological metabolism [51]. At the same time, SC and TP also significantly affected bacterial communities, and similar conclusions have been reported [52]. Liu et al. [53] found that TP had a significant impact on bacterial community through research. The results of this study enrich the understanding of karst habitat heterogeneity and provide a reference basis for the construction and restoration of regional ecological vegetation.

4.3. Effects of Habitat Heterogeneity on the Functional Structure of Rhizosphere Soil Microorganisms

Microbial groups with similar functions constitute the basic functional unit of a microbial community. Different microbial groups play different roles and are of great significance in maintaining the function and stability of ecosystem [54]. The high heterogeneity of karst habitat will affect the function of the soil microbial community [55]. Soil bacteria play an important role in metabolism, environmental information processing, genetic information processing, cellular processes, human diseases and organismal systems [56]. The results showed that soil bacteria in different karst microhabitats were involved in 6 primary metabolic pathways and 40 secondary metabolic pathways. In the first-order metabolic pathway, metabolism has the highest abundance, followed by environmental information processing. Metabolism is still the core function of bacteria, which is consistent with the results of Xin et al. and Chen Yanyun et al. [57,58]. The secondary metabolic pathways mainly include membrane transport, carbohydrate metabolism, amino acid metabolism, signal transduction, energy metabolism, metabolism of cofactor and vitamin, nucleotide metabolism, etc. The total average relative abundance reached 69.37%, indicating that the soil bacteria in karst had a strong ability to obtain energy from carbon sources such as sugars, amino acids and vitamins. Litter decomposition is an important nutrient input link in karst forest ecosystems, and microorganisms play a crucial role in nutrient cycling in the ecosystem [59]. Wang et al. [60] found that the metabolic function of microorganisms was affected by the input amount of litters, and there was little difference in the input amount and type of litters in different karst microhabitats in the same forest ecosystem, leading to no significant difference in the functional structure of microorganisms in different karst microhabitats in this study. Similar to the research results of Nguyen et al. [61], the FUNGuild database still needs to be improved. Saprophytic and symbiotic transitional fungi dominated the three karst microhabitats, followed by saprophytic trophic fungi. Studies have shown that the rock surface is not suitable for the survival of microorganisms, but they can survive by saprophysis or autotrophic microbe with autotrophic microbes [62]. In this study, the eight trophic types of fungi are mainly saprophytic and symbiotic trophic fungi, while pathotrophic fungi were the least the least, and the distribution of each trophic fungus is relatively uniform, which may be related to this reason. The pathophysiological and symbiotic transitional fungi differ significantly among different karst microhabitats, which may be caused by differences in water content and other factors among different karst microhabitats [63]. Due to the shallow soil layer in the karst region and the large proportion of evergreen trees in the forest, the litter amount of the karst forest is lower [64]. The lack of decomposition substrate makes the proportion of saprotrophic fungi smaller than that of the normal landform forest, and fungal pathogens in soil can disrupt the inherent balance of the soil fungal community. There were fewer pathotrophic fungi, which reflects the soil health and forest community stability of the karst forest [65].

4.4. Limitation and Prospect

Soil microbes play an important role in the material circulation and energy flow of the ecosystem. In this paper, we studied the variation characteristics of the rhizosphere soil microbial community structure and function in different karst microhabitats of the endemic R. pudingense in karst stone mountain, Guizhou province, China. The preliminary understanding of a microbial community can lay a theoretical foundation for subsequent studies on this adaptability, which is of great significance for promoting the development and utilization of R. pudingense resources. However, due to the high heterogeneity of karst microhabitats and the wide variety of karst microhabitat combination types, it is difficult to ensure complete consistency when selecting karst microhabitat types in the field based on previous studies. Therefore, only the most typical SS, RG and RS microhabitats of R. pudingense are selected. At present, little is known about the distribution of this species. The prediction of potential suitable areas can provide convenience for the collection and introduction of this species. For research on this species, in the future, indicators such as higher rock exposure rates and soil thickness, as well as physicochemical factors such as plant habitat nutrient limitations and root exudate composition, should be considered. The changes caused by differences in regional climate should also be analyzed to further explore the relationship between soil microorganisms and the environment and reveal the unique adaptation mechanisms of this species.

5. Conclusions

In this study, rhizosphere soils of R. pudingense, an endemic plant in different karst microhabitats (SS, RG and RS), were collected and analyzed for nutrient content, enzyme activity, and soil microbial community structure and function. The results showed that the nutrient content and enzyme activity of SS and RG were higher than that of RS. The rhizosphere soil microbial community of this species was rich, and there was no significant difference in the diversity of soil bacteria and fungi in the three karst microhabitats, indicating that they maintain stability within heterogeneous habitat. There were some differences in the community structure of bacteria and fungi in different karst microhabitats at the genus level. There were some differences in the microbial species composition of WM, ZN and QL, and the microbial community structure of RG and RS was more similar to that of SS. Proteobacteria and Actinomycetes were the main bacteria, while Ascomycetes and Basidiomycetes had the highest abundance. There was no significant difference in microbial function among different karst microhabitats (p > 0.05). Only the abundance of pathophysiological transitional fungi in RG was significantly higher than that in RS (p < 0.05). The function of bacteria was mainly metabolic, and that of fungi was mainly saprophytic and symbiotic. SOC and ALP had significant effects on the community structure of soil bacteria and fungi (p < 0.05), and SC and TP also had certain effects on the community structure of soil fungi. In conclusion, SOC and ALP are important factors affecting the horizontal distribution of microflora in soil in karst microhabitats, and SS and RG microhabitats has better soil conditions, while plants in the RS habitat may need to be protected.

Author Contributions

C.Y., conceptualization, methodology, validation, formal analysis, investigation, writing—review and editing. H.W., conceptualization, methodology, software, formal analysis, investigation, writing—review and editing, data curation. X.D., investigation, resources, project administration. M.C., resources, supervision, project administration. J.L., resources, supervision, project administration. R.Y., conceptualization, writing—review and editing, investigation, methodology. F.D., conceptualization, writing—review and editing, methodology. All authors have read and agreed to the published version of the manuscript.

Funding

This research was funded by the Science and Technology Foundation of Guizhou (No. [2021] 097 and [2021] 089); the National Natural Science Foundation of China (grant number 32060244); the Guizhou Science and Technology Conditions and Service Capacity Construction Project (No. [2020] 4010).

Institutional Review Board Statement

Not applicable.

Informed Consent Statement

Not applicable.

Data Availability Statement

The data presented in this study are available on request from the corresponding author.

Acknowledgments

We are very grateful to Shanghai Majorbio Bio-Pharm Technology Co., Ltd for assisting in the completion of the experiment and providing the data analysis platform. Meanwhile, we thank the reviewers for their valuable comments on this paper.

Conflicts of Interest

The authors declare no conflict of interest.

References

  1. Shen, R.F.; Zhao, X.Q. Role of soil microbes in the acquisition of nutrients by plants. Acta Ecol. Sin. 2015, 35, 6584–6591. [Google Scholar]
  2. Wu, C.H.; Liu, J.Z. Research progress on influencing factors of rhizosphere microorganisms and their interaction with plants. J. Hebei Norm. Univ. Nat. Sci. Ed. 2022, 46, 603–613. [Google Scholar]
  3. Zhao, H.; Zhou, Y.C. Characteristics of structure and abundance of the nitrogen-fixing bacterial community in Pinus massoniana soil developed from different parent rocks. Acta Ecol. Sin. 2020, 40, 6189–6201. [Google Scholar]
  4. Zhu, L.X.; Zhang, J.E.; Liu, W.G. Review of studies on interactions between root exudates and rhizopheric microorganisms. Ecol. Environ. 2003, 12, 102–105. [Google Scholar]
  5. Mahmoudi, T.R.; Yu, J.M.; Liu, S.; Pierson, L.R.; Pierson, E.A. Drought-stress tolerance in wheat seedlings conferred by phenazine-producing rhizobacteria. Front. Microbiol. 2019, 10, 1590. [Google Scholar] [CrossRef] [Green Version]
  6. Ruan, L.; Ma, Z.H.; Liu, Z.Y.; Qin, F.; Wang, H.G. Isolation, identification and toxicity determination of pathogens causing alfalfa root rot. J. Chin. Agric. Univ. 2016, 21, 56–67. [Google Scholar]
  7. Zhang, L.; Xu, H.M.; Zhu, B.L. Association of rhizosphere soil microbiome with the occurrence and development of replant disease-A review. Acta Microbiol. Sin. 2016, 56, 1234–1241. [Google Scholar]
  8. Lynch, J. Root Architecture and Plant Productivity. Plant Physiol. 1995, 109, 7–13. [Google Scholar] [CrossRef]
  9. Qiu, Q.; Li, J.Y.; Wang, J.H.; Wang, N.; Sun, K.; He, Q.; Su, Y.; Pan, X. Microbes, enzyme activities and nutrient characteristics of rhizosphere and non-rhizosphere soils under four shrubs in Xining Nanshan, Prefecture, China. Acta Ecol. Sin. 2014, 34, 7411–7420. [Google Scholar]
  10. Allison, S.D.; Lu, Y.; Weihe, C.; Goulden, M.L.; Martiny, A.C.; Treseder, K.K.; Martiny, J.B. Microbial abundance and composition influence litter decomposition response to environmental change. Ecology 2013, 94, 714–725. [Google Scholar] [CrossRef] [Green Version]
  11. Song, T.Q. Plants and the Environment in Karst Areas of Southwest China; Sci Press: Beijing, China, 2015; pp. 1–5. [Google Scholar]
  12. Xi, X.Q.; Zhao, Y.J.; Liu, Y.G.; Wang, X.; Gao, X.M. Variation and correlation of plant functional traits in karst area of central Guizhou Province, China. Chin. J. Plant Ecol. 2011, 35, 1000–1008. [Google Scholar] [CrossRef]
  13. Yu, L.F.; Zhu, S.Q.; Ye, J.Z.; Wei, L.M.; Chen, Z.R. Dynamics of adegraded karst forest in the process of natural restoration. Sci. Silvea Sin. 2002, 38, 1–7. [Google Scholar]
  14. Zhang, J.Y.; Dai, M.H.; Wang, L.C.; Su, W.C.; Cao, L.G. Plant selection and their ecological adaptation for rocky desertification control in karst region in the southwest of China. Earth Environ. 2015, 43, 269–278. [Google Scholar]
  15. Liu, F.; Wang, S.J.; Luo, H.B.; Liu, Y.S.; Liu, H.Y. Microhabitats in karst forest ecosystem and variability of soils. Acta Pedol. Sin. 2008, 45, 1055–1062. [Google Scholar]
  16. Zhu, S.Q. Ecological Research on Karst Forest(Ⅰ); Guizhou Science and Techlonogy Press: Guiyang, China, 1993; p. 168. [Google Scholar]
  17. Yan, L.B.; Zhang, J.L.; Zhu, S.Y.; Gao, F.; Yang, Y.Z.; Huang, Z.S.; Yu, L.F. Base on model experiment to study the effects of vertical space on the temperature of soil microhabitats in the process of karst rock desertification. Appl. Ecol. Environ. Res. 2019, 17, 15605–15614. [Google Scholar] [CrossRef]
  18. Li, A.D.; Jia, S.; Yu, L.F. Microclimates of different microhabitats in Huajiang karst area. J. Zhejiang For. Coll. 2010, 27, 374–378. [Google Scholar]
  19. Liao, H.K.; Li, J.; Long, J.; Zhang, W.J.; Liu, L.F. Soil characteristics of different microhabitats of chinese prickly ash in karst mountain areas of Guizhou province. J. Agro-Env. Sci. 2013, 32, 2429–2435. [Google Scholar]
  20. Yu, G.S.; Wang, S.J.; Rong, L. Microclimate characteristics of different microhabitats in successional stages of Maolan karst forest. Ear Environ. 2011, 39, 469–477. [Google Scholar]
  21. Cavicchioli, R.; Ripple, W.J.; Timmis, K.N.; Azam, F.; Bakken, L.R.; Baylis, M.; Behrenfeld, M.J.; Boetius, A.; Boyd, P.W.; Classen, A.T.; et al. Scientists’ warning to humanity: Microorganisms and climate change. Nat. Rev. Microbiol. 2019, 17, 569–586. [Google Scholar] [CrossRef] [Green Version]
  22. Schimel, J.; Balser, T.C.; Wallenstein, M. Microbial stress-response physiology and its implications for ecosystem function. Ecology 2007, 88, 1386–1394. [Google Scholar] [CrossRef]
  23. Lu, Z.C.; Wen, Y.G.; Zhou, X.G.; Wang, L.; Xun, D.J.; Zhu, H.G.; Li, J.W. Correlation analysis of plant and soil microbial diversity during forest natural restoration in karst region, southwest China. Guangxi Sci. 2022, 29, 108–119. [Google Scholar]
  24. Guo, W.; Gao, L.W.; Peng, Z.W.; Wei, M.Q.; Wang, Y.Z.; Hu, Y.L.; Liu, X. Characteristics of microbial community in rhizosphere and non-rhizosphere soil of Cunninghamia lanceolata plantation with different stand ages. Res. Soil Water Conserv. 2022, 29, 260–267. [Google Scholar]
  25. Ding, S.; Wei, S.Z.; Chen, Z.L.; Shao, J.; Duan, F.R.; Yan, Y.; Duan, X.W. Variation characteristics of microorganism at different soil depths of typical forests in southwest China. Chin. J. Appl. Ecol. 2022, 33, 1–11. [Google Scholar]
  26. Chen, X.L.; Shen, Y.; Huang, Y.; Luo, C.L.; Yan, W.D.; Liu, H.N.; He, G.X.; He, H.J. Responses of soil enzyme activities and microbial communities to dry and wet seasons in Cinnamomum camphora and Pinus massoniana plantations. J. Cent. South Uni. For. Technol. 2022, 42, 114–126. [Google Scholar]
  27. Wu, Q.S.; Long, J.; Li, J.; Liao, H.K.; Liu, L.F.; Wu, J.N.; Xiao, X. Effects of different microhabitat types on soil microbial community composition in the Maolan karst forest in Southwest China. Acta Ecol. Sin. 2019, 39, 1009–1018. [Google Scholar]
  28. Lucas-Borja, M.E.; Candel, D.; Jindo, K.; Moreno, J.L.; Andrés, M.; Bastida, F. Soil microbial community structure and activity in monospecific and mixed forest stands, under mediterranean humid conditions. Plant Soil 2012, 354, 359–370. [Google Scholar] [CrossRef]
  29. Patel, J.S.; Singh, A.; Singh, H.B.; Sarma, B.K. Plant genotype, microbial recruitment and nutritional security. Front. Plant Sci. 2015, 6, 608. [Google Scholar] [CrossRef] [Green Version]
  30. Dai, X.; Yang, C.; Yang, B.; Chen, P.; Ma, Y. A new species of Rhododendron (Ericaceae) from Guizhou, China. Phytokeys 2020, 146, 53–59. [Google Scholar] [CrossRef]
  31. An, M.T. Studies on Maintenance Mechanism of Plant Species Diversityand Soil Moisture and Nutrient Pattern in Karst Forest Summary. Ph.D. Thesis, Guizhou University, Guiyang, China, 2019. [Google Scholar]
  32. Riley, D.; Barber, S.A. Bicarbonate accumulation and pH changes at the soybean (Glycine max (L.) Merr.) root-soil interface. Soil Sci. Soc. Am. J. 1969, 33, 905–908. [Google Scholar] [CrossRef]
  33. Duran-Pinedo, A.E.; Solbiati, J.; Frias-Lopez, J. The effect of the stress hormone cortisol on the metatranscriptome of the oral microbiome. Npj Biofilms Microbiomes 2018, 4, 25. [Google Scholar] [CrossRef] [Green Version]
  34. Yang, Y.L.; Xu, M.; Zhou, X.; Chen, J.; Zhang, J.; Zhang, J. Effects of different vegetation types on the characteristics of soil bacterial communities in the Hilly area of central Guizhou. J. Ecol. Rural Environ. 2021, 37, 518–525. [Google Scholar]
  35. Peng, J.G.; Gong, J.Y.; Fan, Y.H.; Zhang, H.; Zhang, Y.F.; Bai, Y.Q.; Wang, Y.M.; Xie, L.J. Diversity of soil microbial communities in rhizosphere and non-rhizosphere of Rhododendron moulmainense. Sci. Silvea Sin. 2022, 58, 89–99. [Google Scholar]
  36. Peng, L.M.; Jiang, X.F. Analysis of fungal community structure and diversity in the roots of Rhododendron rubiginosum. Southwest Chin. J. Agric. Sci. 2022, 35, 957–963. [Google Scholar]
  37. Zhou, J.; Huang, Y.; Mo, M. Phylogenetic analysis on the soil bacteria distributed in karst forest. Braz. J. Microbiol. 2009, 40, 827–837. [Google Scholar] [CrossRef] [PubMed] [Green Version]
  38. Wardle, D.A. Controls of temporal variability of the soil microbial biomass: A global-scale synthesis. Soil Biol. Biochem. 1998, 30, 1627–1637. [Google Scholar] [CrossRef]
  39. Zuo, P.; Ou, Z.J.; Jiang, Q.W.; Liu, M. Function diversity of soil microbial communities in originalcoastal wetlands, Yancheng, Jiangsu province. J. Nanjing Uni. Nat. Sci. 2014, 50, 715–722. [Google Scholar]
  40. Maestre, F.T.; Delgado-Baquerizo, M.; Jeffries, T.C.; Eldridge, D.J.; Ochoa, V.; Gozalo, B.; Quero, J.L.; García-Gómez, M.; Gallardo, A.; Ulrich, W. Increasing aridity reduces soil microbial diversity and abundance in global drylands. Proc. Natl. Acad. Sci. USA 2015, 112, 15684–15689. [Google Scholar] [CrossRef] [Green Version]
  41. Ou, J.; Liu, R.Y.; Chen, X. Study on microstructure and infections of Rhododendron annae mycorrhiza. J. Cent South Uni. For. Technol. 2012, 32, 28–33. [Google Scholar]
  42. Zhou, J.; Lei, T. Review and prospects on methodology and affecting factors of soil mi-crobial diversity. Biodivers. Sci. 2007, 15, 306. [Google Scholar]
  43. Wang, D.L. Study on Karst Rocky Desertification Forming Process and Its Control Technology. Ph.D. Thesis, Nanjing Forestry University, Nanjing, China, 2003. [Google Scholar]
  44. Hermans, S.M.; Buckley, H.L.; Case, B.S.; Curran, C.F.; Taylor, M.; Lear, G. Bacteria as emerging indicators of soil condition. Appl. Environ. Microbiol. 2016, 83, e02826-16. [Google Scholar] [CrossRef] [Green Version]
  45. Zhou, T.; Wang, C.; Zhou, Z. Impacts of forest thinning on soil microbial community structure and extracellular enzyme activities: A global meta-analysis. Soil Bio. Biochem. 2020, 149, 107915. [Google Scholar] [CrossRef]
  46. Fan, Z.; Lu, S.; Liu, S.; Guo, H.; Wang, T.; Zhou, J.; Peng, X. Changes in plant rhizosphere microbial communities under different vegetation restoration patterns in karst and non-karst ecosystems. Sci. Rep. 2019, 9, 8761. [Google Scholar] [CrossRef] [PubMed] [Green Version]
  47. Xiong, D.; Ou, J.; Li, L.P.; Yang, S.T.; He, Y.J.; Li, Z.C. Community composition and ecological function analysis of endophytic fungi in the roots of Rhododendron simsii in Pinus massoniana forest on central Guizhou. Acta Ecol. Sin. 2020, 40, 1228–1239. [Google Scholar]
  48. Li, A.D.; Lu, Y.F.; Wei, X.L.; Yu, L.F. Studies on the regime of soil moisture under different microhabitats in Huajiang karst valley. Carsolog Sin. 2008, 27, 56–62. [Google Scholar]
  49. Harris, R.F. Effect of water potential on microbial growth and activity. Water Potential Relat. Soil Microbiol. 1981, 9, 23–95. [Google Scholar]
  50. Gong, X.; Liu, C.; Li, J.; Luo, Y.; Yang, Q.; Zhang, W.; Yang, P.; Feng, B. Responses of rhizosphere soil properties, enzyme activities and microbial diversity to intercropping patterns on the Loess Plateau of China. Soil Till. Res. 2019, 195, 104355. [Google Scholar] [CrossRef]
  51. Goldfarb, K.C.; Karaoz, U.; Hanson, C.A.; Santee, C.A.; Bradford, M.A.; Treseder, K.K.; Wallenstein, M.D.; Brodie, E.L. Differential growth responses of soil bacterial taxa to carbon substrates of varying chemical recalcitrance. Front. Microbiol. 2011, 2, 94. [Google Scholar] [CrossRef] [Green Version]
  52. Nan, J.; Chao, L.; Ma, X.; Xu, D.; Mo, L.; Zhang, X.; Zhao, X.; Bao, Y. Microbial diversity in the rhizosphere soils of three Stipa species from the eastern Inner Mongolian grasslands. Glob. Ecol. Conserv. 2020, 22, e992. [Google Scholar] [CrossRef]
  53. Liu, S.; Wang, Z.; Niu, J.; Dang, K.; Zhang, S.; Wang, S.; Wang, Z. Changes in physicochemical properties, enzymatic activities, and the microbial community of soil significantly influence the continuous cropping of Panax quinquefolius L.(American ginseng). Plant Soil. 2021, 463, 427–446. [Google Scholar] [CrossRef]
  54. Liu, Y.Y.; Wang, S.; Li, S.Z.; Deng, Y. Advances in molecular ecology on microbial functional genes of carbon cycle. Microbiol. Chin. 2017, 44, 1676–1689. [Google Scholar]
  55. Chaer, G.; Fernandes, M.; Myrold, D.; Bottomley, P. Comparative resistance and resilience of soil microbial communities and enzyme activities in adjacent native forest and agricultural soils. Microb. Ecol. 2009, 58, 414–424. [Google Scholar] [CrossRef]
  56. Wan, W.; Tan, J.; Wang, Y.; Qin, Y.; He, H.; Wu, H.; Zuo, W.; He, D. Responses of the rhizosphere bacterial community in acidic crop soil to pH: Changes in diversity, composition, interaction, and function. Sci. Total Environ. 2020, 700. [Google Scholar] [CrossRef] [PubMed]
  57. Xin, Y.; Ji, L.; Wang, Z.; Li, K.; Xu, X.; Guo, D. Functional diversity and CO2 emission characteristics of soil bacteria during the succession of halophyte vegetation in the Yellow River Delta. Int. J. Environ. Res. Public Health 2022, 19, 12919. [Google Scholar] [CrossRef] [PubMed]
  58. Chen, Y.Y.; Xia, W.Y.; Zhao, H.; Zeng, M. Effects of deep vertical rotary tillage on soil enzyme activity, microbialcommunity structure and functional diversity of cultivated land. Acta Ecol. Sin. 2022, 42, 5009–5021. [Google Scholar]
  59. Balami, S.; Vašutová, M.; Košnar, J.; Karki, R.; Khadka, C.; Tripathi, G.; Cudlin, P. Soil fungal communities in abandoned agricultural land has not yet moved towards the seminatural forest. For. Ecol. Manag. 2021, 491, 119181. [Google Scholar] [CrossRef]
  60. Wang, L.Y.; Zhou, G.N.; Zhu, X.Y.; Gao, B.J.; Xu, H.D. Effects of litter on soil organic carbon and microbial functional diversity. Acta Ecol. Sin. 2021, 41, 2709–2718. [Google Scholar]
  61. Nguyen, N.H.; Song, Z.; Bates, S.T.; Branco, S.; Tedersoo, L.; Menke, J.; Schilling, J.S.; Kennedy, P.G. FUNGuild: An open annotation tool for parsing fungal community datasets by ecological guild. Fungal Ecol. 2016, 20, 241–248. [Google Scholar] [CrossRef]
  62. Viles, H.A.; Gorbushina, A.A. Soiling and microbial colonisation on urban roadside limestone: A three year study in Oxford, England. Build. Environ. 2003, 38, 1217–1224. [Google Scholar] [CrossRef]
  63. Evans, S.E.; Wallenstein, M.D. Climate change alters ecological strategies of soil bacteria. Ecol. Lett. 2014, 17, 155–164. [Google Scholar] [CrossRef]
  64. Yu, G.S.; Wang, S.J.; Rong, L.; Ran, J.C. Litter dynamics of major successional communities in Maolan karst forest of China. Chin. J. Plant Ecol. 2011, 35, 1019–1028. [Google Scholar]
  65. Zhang, Z.H.; Hu, G.; Zhu, J.D.; Ni, J. Spatial heterogeneity of soil nutrients and its impact on tree species distribution in a karst forest of Southwest China. Chin. J. Plant Ecol. 2011, 35, 1038–1049. [Google Scholar]
Figure 1. Studied Sampling Sites in Guizhou Province, China.
Sustainability 15 07104 g001
Figure 2. Microbial Shannon index dilution curve. (a) Bacterial dilution curve; (b) Fungal dilution curve.
Sustainability 15 07104 g002
Figure 3. Venn diagram of microbial at OTU level in different karst microhabitats. Venn diagram of bacteria at OTU level in ZN (a), Venn diagram of bacteria at OTU level in QL (b), Venn diagram of bacteria at OTU level in WM (c), Venn diagram of fungi at OTU level in ZN (d), Venn diagram of fungi at OTU level in QL (e) and Venn diagram of fungi at OTU level in WM (f).
Sustainability 15 07104 g003
Figure 4. Total number of microbial OTU in different regions.
Sustainability 15 07104 g004
Figure 5. PCoA analysis of soil bacterial (left) and fungal (right) communities in different karst microhabitats based at OTU level abundance.
Sustainability 15 07104 g005
Figure 6. Community structure and relative abundance of soil bacteria (a) and fungi (b) in different karst microhabitats at the phylum classification level.
Sustainability 15 07104 g006
Figure 7. Clustering heat maps of soil bacteria (a) and fungi (b) genera in different karst microhabitats at genus level.
Sustainability 15 07104 g007
Figure 8. Cladogram and histogram of LEfSe analysis of bacteria (a) and fungi (b).
Sustainability 15 07104 g008
Figure 9. Functional notes pie chart of karst soil bacteria (Pathway level 1).
Sustainability 15 07104 g009
Figure 10. Functional structure of soil bacterial in different karst microhabitats (Pathway level 2).
Sustainability 15 07104 g010
Figure 11. Soil fungi trophic mode in different karst microhabitats. (Note: Different lowercase letters indicate significant differences in fungal function among different karst microhabitats (p < 0.05).
Sustainability 15 07104 g011
Figure 12. Relationships between bacterial (a,c) and fungal (b,d) community structure and environmental factors. * p < 0.05; ** p < 0.01; *** p < 0.001.
Sustainability 15 07104 g012
Table 1. Classification criteria for karst microhabitats.
MicrohabitatsGrown FormSoil Water Characteristics
Soil surface (SS)Contiguous soil covering area is greater than 1 m2; or, although the contiguous soil covers an area less than 1 m2, the bare rate of bedrock is less than 50%, and the soil is the main body, and no rock groove or groove depth more than 30 cm has been formed.The soil layer is thicker, the ventilation condition is better, and the water is lost slowly.
Rock gully (RG)The bare rate of bedrock is greater than 50%, the covering area of contiguous soil is less than 1 m2, and the depth of rock groove or groove is more than 30 cm. Or, although the depth of the rock groove or groove is not more than 30 cm, the thickness of the soil layer is more than 30 cm; or, although the bare rate of bedrock is less than 50%, it is mainly soil, and the rock groove or groove depth is more than 30 cm.The soil layer is thick, and water and fertilizer preservation is better.
Rock surface (RS)The bare rate of bedrock is greater than 50%, the contiguous soil covers an area less than 1 m2, the depth of rock groove or groove formed is less than 30 cm, and the thickness of soil layer is less than 30 cm.There are good ventilation conditions, there is fast water loss, the water and fertilizer retention ability is weak, and it is easy to form frequent temporary drought in a short time.
Table 2. Basic information of R. pudingense.
RegionMicrohabitat TypeGround Diameter (cm)Plant Height (m)Altitude (m)
ZNSS1.74 ± 0.131.90 ± 0.621389.66 ± 7.77
RG2.46 ± 0.622.08 ± 1.141394.90 ± 18.72
RS1.24 ± 0.271.70 ± 0.281393.04 ± 9.25
QLSS2.00 ± 0.132.27 ± 0.211426.30 ± 11.27
RG2.33 ± 0.311.73 ± 0.811431.43 ± 16.71
RS2.00 ± 0.612.00 ± 0.201437.99 ± 13.84
WMSS2.39 ± 0.502.20 ± 0.521291.42 ± 2.66
RG1.75 ± 0.122.07 ± 0.811248.51 ± 52.50
RS2.05 ± 0.601.70 ± 1.011277.21 ± 49.24
Table 3. Physicochemical properties of the R. pudingense rhizosphere soils.
RegionMicrohabitatSOC (g/kg)TN (g/kg)TP (g/kg)SAN (mg/kg)SAP (mg/kg)SC (μmol/L·min)UE (μmol/L·min)ALP (μmol/L·min)
ZNSS97.23 ± 41.91 Aa8.54 ± 3.45 ABa0.77 ± 0.20 Aa448.52 ± 142.86 Aa30.20 ± 15.38 Aa1104.06 ± 16.34 Ba935.82 ± 5.67 Ba68.43 ± 0.23 Cc
RG74.43 ± 41.07 Ba8.01 ± 1.65 Ba0.61 ± 0.23 Ba385.70 ± 222.52 Ba27.89 ± 9.44 Aa1091.11 ± 13.9 Bb834.21 ± 23.54 Aa75.14 ± 1.20 Ba
RS94.77 ± 28.45 Ba8.12 ± 1.84 Ca0.61 ± 0.12 Ba580.41 ± 29.11 Aa24.08 ± 10.79 Ba998.51 ± 26.74 Ab808.93 ± 19.33 ABb72.24 ± 0.96 Ab
QLSS137.90 ± 11.33 Aa13.76 ± 2.74 Aa0.72 ± 0.10 Ab750.99 ± 64.70 Aa22.02 ± 1.43 Aa1204.85 ± 26.74 Aa989.06 ± 13.02 Aa70.26 ± 0.48 Bb
RG208.93 ± 29.87 Aa19.44 ± 3.30 Ab1.36 ± 0.14 Aa951.63 ± 324.54 Aa60.09 ± 44.76 Aa984.65 ± 25.33 Cb775.20 ± 3.00 Bb80.24 ± 0.69 Aa
RS134.88 ± 33.88 Ba14.12 ± 1.74 Bab1.16 ± 0.26 Aa761.58 ± 67.23 Aa25.45 ± 6.65 Ba1031.98 ± 19.45 Bb770.55 ± 23.05 Ac64.94 ± 1.18 Bc
WMSS75.30 ± 13.29 Ac5.65 ± 0.92 Bc0.59 ± 0.19 Aa378.07 ± 24.79 Ab36.24 ± 4.05 Ab1161.75 ± 29.55 Aa1016.24 ± 16.86 Aa75.32 ± 0.45 Aa
RG237.02 ± 38.44 Ab17.25 ± 3.69 Ab0.71 ± 0.08 Ba858.03 ± 202.08 ABab57.66 ± 25.11 Ab1003.03 ± 6.81 Ab869.37 ± 9.33 Bb63.74 ± 0.62 Cb
RS338.30 ± 58.49 Aa23.07 ± 1.68 Aa0.92 ± 0.07 ABa950.52 ± 535.62 Aa143.46 ± 71.89 Aa965.75 ± 9.51 ABc775.55 ± 22.65 Bb48.18 ± 0.41 Cc
Note: SOC, TN, TP, AN, AP, UE, SC and ALP indicated soil organic carbon, total nitrogen, total phosphorus, available nitrogen, available phosphorus, urease, sucrase and alkaline phosphatase, respectively. Different capital letters indicate that the nutrient content and enzyme activities is significantly different between the same karst microhabitat and different regions (p < 0.05), and different lowercase letters indicate that the nutrient content and enzyme activities is significantly different between different karst microhabitats and the same region (p < 0.05). The same applies below. Data are means ± S.D.
Table 4. Two-factor variance analysis of soil nutrient contents and tenzyme activities by karst microhabitat and region (F value).
FactorSOCTNTPANAPUESCALP
Microhabitat29.028 ***25.559 ***15.955 ***5.187 *7.508 **5.085 *14.367 ***452.735 ***
Region14.700 ***15.382 ***4.226 *2.6372.968130.997 ***160.722 ***276.331 ***
Microhabitat × Region15.560 ***13.439 ***5.584 **1.7614.485 *29.208 ***100.604 ***520.353 ***
Note: * p < 0.05; ** p < 0.01; *** p < 0.001.
Table 5. α diversity index of soil microorganisms in different karst microhabitats (different lowercase letters in the table indicate significant differences at the 0.05 level).
MicrobialMicrohabitatShannon IndexSimpson IndexAce IndexChao IndexCoverage Index
BacterialSS5.31 ± 0.07 a0.0153 ± 0.0023 a1367.67 ± 109.27 a1360.15 ± 113.82 a0.9860 ± 0.0026 a
RG5.25 ± 0.21 a0.0146 ± 0.0028 a1253.81 ± 91.88 a1253.47 ± 101.49 a0.9817 ± 0.0048 b
RS5.23 ± 0.18 a0.0160 ± 0.0052 a1288.92 ± 172.51 a1220.39 ± 133.62 a0.9823 ± 0.0033 b
FungiSS3.16 ± 0.94 a0.173 ± 0.152 a442.23 ± 95.57 a439.09 ± 98.13 a0.9984 ± 0.0007 a
RG3.29 ± 0.47 a0.114 ± 0.078 a453.73 ± 140.50 a448.98 ± 137.86 a0.9977 ± 0.0014 a
RS3.14 ± 0.32 a0.117 ± 0.038 a462.63 ± 75.03 a457.03 ± 75.56 a0.9976 ± 0.0010 a
Note: Data are means ± S.D.
Disclaimer/Publisher’s Note: The statements, opinions and data contained in all publications are solely those of the individual author(s) and contributor(s) and not of MDPI and/or the editor(s). MDPI and/or the editor(s) disclaim responsibility for any injury to people or property resulting from any ideas, methods, instructions or products referred to in the content.

