Abstract
One of the key indicators to measure the sustainability and resilience of a city during a public health crisis is how well it can meet the daily needs of its residents. During the COVID-19 lockdown in Shanghai in 2022, e-commerce shopping and delivery became the most important method for ensuring the city’s material supplies. This article uses the distribution data of a fresh e-commerce platform’s pre-warehouse and static population distribution data to establish a basic material supply system evaluation model for the city and explore its resilience potential. Focusing on the central urban area of Shanghai, this study uses a population heat map with geographic coordinates to reflect the static distribution of residents and obtains the distribution data of the e-commerce pre-warehouses. Using kernel density analysis, the relationship between the pre-warehouses and the residents’ needs is established. Through analysis, it was found that the supply capacity of fresh food in different areas of Shanghai during the lockdown could be categorized as insufficient, adequate, or excessive. Based on these three categories, improvement strategies were proposed. Finally, this article suggests establishing a scientific supply security system to promote urban sustainability and prepare for future challenges.
1. Introduction
The guarantee ability of basic living materials under public health emergencies is one of the important criteria needed to measure the sustainability and resilience of cities. According to “Comprehensively Improving the Ability of Prevention and Control According to Law and Perfecting the National Public Health Emergency Management System” released by China’s Central Government, the establishment of a basic material support system that can play a role in both daily and emergency situations is a significant urban planning issue in the post-epidemic era. Since the outbreak of the COVID-19 pandemic in 2020, countries around the world have experienced certain impacts, and many cities have also adopted measures such as lockdowns. From this unprecedented public health crisis, we can see that in addition to the traditional areas of urban sustainability that focus on the economy, ecology, environment, and energy, we should pay more attention to the field of urban resilience characterized by safety, health, and adaptability.
The concept of “resilience” originated in mechanical physics and refers to the ability of a material to return to its original state after plastic deformation. In the 1970s, Holling introduced the concept to the field of ecology, focusing on the ability of ecosystems to recover after being subjected to external forces. Later, it was extended to include the ability to resist external forces and buffer effects and was used to describe the maintenance of balance and regulatory resilience of ecological systems [1]. Since the 1990s, research on “resilience” has expanded from the field of “natural ecology” to “human ecology” [2]. With the continuous progress of urbanization, the disaster prevention, reduction, and risk resistance of cities have received increased attention. Therefore, the concept of “resilience” has been introduced to the field of urban studies, and the concept of “urban resilience” has emerged, emphasizing the ability of urban systems to continue to operate normally even when subjected to external shocks. In this process, the meaning of “resilience” itself has expanded from “engineering resilience” and “ecological resilience” to “evolutionary resilience”, emphasizing a dynamic ability to constantly seek new balance points and self-adjustment [3]. Therefore, urban resilience has become an important aspect of demonstrating sustainable urban development. In the study of urban resilience, the optimization of urban public service facilities is an important foundation for achieving environmental sustainability and social equity [4]. Such optimization requires a balance of economic, environmental, and social factors. On the economic side, urban public service facilities need to allocate resources rationally to ensure the sustained growth of the city’s economy. On the environmental side, urban public service facilities need to strengthen environmental awareness and protect the ecological environment. In the social aspect, urban public service facilities are needed to meet people’s living needs and ensure social stability. This paper attempts to explore the relationship between urban raw material supply facilities and sustainable urban development, using the experience of Shanghai during the 2022 epidemic.
At the beginning of March 2022, the COVID-19 pandemic broke out in Shanghai. The entire Pudong area began to be sealed and controlled by 27 March. The whole city entered closed control from 1 April to 1 June. At the beginning of this period, the Shanghai Department of Commerce issued “The Notice on Releasing the Supply Guarantee Ability of E-commerce Platform”, which proposed that the provision of residents’ basic living materials through fresh e-commerce platforms should be included as a vital part of the government guarantee system. Shanghai Xinmin Evening News reported (22 March 2022) that there are three ways for Shanghai residents to obtain basic necessities during the lockdown period: e-commerce platforms, Supermarket’s own platforms, and direct supply from the place of origin that offers group-buying (Table 1) [5]. Among them, the group purchase mode of direct supply from the place of origin can only develop under extreme circumstances and is not competitive in daily life because of the problems such as group threshold, lack of personalization, and difficulty in guaranteeing service level. Relying on the developed distribution system, the pre-warehouse of the large-scale e-commerce platform and supermarket’s online platforms have unique advantages in meeting the diversified needs of urban residents for food and daily consumer goods (Figure 1). The pre-warehouse in this research refers to the model of establishing a warehouse near the community, which is different from traditional warehouses and is far away from the final consumer population. Fresh e-commerce pre-warehouse is an innovative model of fresh e-commerce industry under this situation, which is a commodity pre-warehouse based on O2O service demand and uses the mode of “Urban Distribution Center + Pre-warehouse” with characteristics such as a small scale of 80–100 square meters and a 3–5 km radius of radiation. Therefore, this paper refers to the pre-warehouse of e-commerce platform and supermarket online platforms as the pre-warehouse of fresh e-commerce, studies the adaptability of the pre-warehouse of fresh e-commerce in the central city of Shanghai, analyzes and discusses the use of such facilities as the basic material supply node of urban residents, and constructs the material support system of the resilient city that meets the principle of sustainability.

Table 1.
Online platforms for residents to purchase materials.
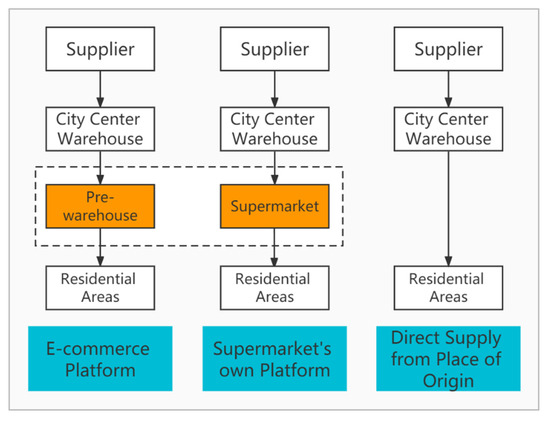
Figure 1.
Logistics diagram of online material purchase method.
2. Literature Review
2.1. The Fresh E-Commerce Pre-Warehouse and Urban Sustainability
The sustainability of urban infrastructure refers to the fact that the facilities sustain function and maintain long-term use value with the progress of society on the basis of safety, effectiveness, and durability [6]. Domestic and foreign scholars generally divide urban infrastructure into productive service facilities and social service facilities [7]. Scholars propose that the deployment of a management platform based on the principles of facility management can provide a better mechanism to facilitate the process of achieving urban sustainability [8]. Some used stepwise regression analysis to study the impact of pre-existing facilities and current policies and compared the status quo of urban facilities and the level of supply balance between cities [9]. Others studied the development model of urban infrastructure and the impact of different types of infrastructure on the environment, and discussed the environmental indicators that urban infrastructure should have in sustainable cities [10].
The object of this paper is the fresh e-commerce pre-warehouse, which belongs to the commercial facilities. The coverage of fresh e-commerce pre-warehouse in the city has gradually reached a certain level to ensure its service ability.
The research on the location of the fresh e-commerce pre-warehouse has been widely concerned by scholars, most of which focus on the goal of minimizing costs, such as the rotten cost of food [11,12], carbon emission cost [13], and customer satisfaction [14]. However, with the advent of the post-epidemic era leading to home consumption, the status significance of fresh e-commerce pre-warehouse in urban infrastructure has changed significantly, which has begun to assume responsibility as the node of the urban material support system in emergency situations. In 2020, during the epidemic in Wuhan, all kinds of commercial supermarkets and fresh e-commerce pre-warehouse demonstrated their ability to guarantee people’s livelihood and their potential as the node of the emergency supply system in megacities [15]. In 2021, after a new round of COVID-19 broke out, Heihe City of Heilongjiang Province, Shijiazhuang City of Hebei Province, Lanzhou City of Gansu Province, Hefei City of Anhui Province, and many other places provided daily necessities for residents through fresh e-commerce platforms [16]. What is more, during the outbreak of the COVID-19 in Shanghai in 2022, the role of fresh food e-commerce platform in ensuring residents’ daily necessities was once again reflected, and the government also issued relevant announcements to release the supply guarantee capacity of an e-commerce platform.
This research shows the feasibility of fresh e-commerce as a part of the urban basic material support system. In addition, its guaranteed role should be taken into consideration when conducting research on the location of fresh e-commerce pre-warehouse in the post-epidemic era.
2.2. Research on Facility Configuration
There has been plentiful research on the standards and principles of urban public service facilities allocation in the field of urban planning. Relevant studies such as three levels of residential facilities allocation based on population size: “group—community—residential area” [17], the life cycle system theory of service facility configuration which, based on the scale of service space, includes “fundamental circle (refers to meeting the needs of urban residents in terms of residence, education, and medicine, the range of behaviors required for the most basic needs of life, such as therapy and shopping, can be achieved by walking or bicycle), basic life circle (refers to the range of behaviors that meet the needs of urban residents for employment, recreation, external transportation, etc. It is usually a distance range that requires taking buses, subways, etc.), and opportunity life circle (a range of behaviors formed mainly to meet the infrequent needs of urban residents. The mode of transportation mainly consists of public transportation and private cars) planning mode from the perspective of residents’ personal life [18] have been proposed. The public service facility configuration in residential areas divided by these studies changes with different research perspectives and objects, which leads to the inconsistency of divided units. Scholars studied the relationship between the distribution of urban facilities and residents’ satisfaction with the facilities through the comprehensive facility satisfaction index to evaluate the spatial equity and urbanization quality of urban facility allocation [19].
The preparation of community public service facility allocation standards should shift from a simple blueprint planning standard to an action planning standard oriented towards residents’ needs, giving play to the two-way regulatory role of the market and planning standards, and seeking a dynamic balance between supply and demand [20]. Some studies measured the comprehensive spatial accessibility index of the geographic changes in the spatial accessibility of urban facilities to evaluate the vertical spatial equity in the geographical layout of urban facilities [21]. Some studies have conducted a coupling analysis between urban infrastructure spatial allocation efficiency and urban spatial base to reflect the degree of infrastructure allocation efficiency [22]. Others studied the service coverage of medical facilities through a Maximal Covering Location Problem (MCLP) and proposed a solution based on a genetic algorithm to determine the location of the facility to maximize population coverage [23]. Scholars used clustering-related strategies to solve the problem of facility location allocation in order to maximize the benefits of urban facility allocation [24].
2.3. Research on Population Scale and Facility Distribution
With the development of research, both domestic and foreign researchers have found that population and spatial scale are fundamental factors affecting the allocation of urban service facilities [25]. Therefore, the standard research of urban service facility configuration mainly focuses on population size and service space range. In addition, relevant studies have classified living circle levels according to different population size and space scale based on actual urban cases to analyze the living circle service facility configuration standards of different units.
At the end of 2015, Shanghai proposed the basic community unit of “15-min community living circle” during the new round of master planning and released “Shanghai Municipal People’s Government. Shanghai planning guidance of 15-min community-life circle” in 2016 [26], which not only guides the preparation and implementation of various community level plans in Shanghai, but also provides a very significant reference criterion for the constructure of communities in cities all over the country [27]. The theory of “15 min community living circle” has become a research focus in the field of urban planning to explore the characteristics of urban sustainability and resilience and has been widely used in the effective allocation of urban public service facilities.
With the development of the research method, scholars have further deepened the research on public service facilities, and the quantitative analysis of the sustainability of facility configuration with the help of spatial data processing tools such as econometric model and ArcGIS has been gradually enriched [28]. For example, taking the 15-min walking distance as the dividing boundary, ArcGIS was used to analyze the suitability of the living circle facilities configuration of different levels of population size [29] or to quantitatively study the spatial coordination of the distribution of population and facilities [30]. Some researchers analyzed the spatial inequity of facilities in cities by using an integrated model for spatial inequity measurement (SIM) to study the mismatch between population demand and the number of people served by facilities, and the spatial distribution of population distribution and the spatial distribution of facilities [31]. Others evaluated the service capacity of facilities according to their location and quantity to measure the service scale and capacity of educational facilities [32]. However, the spatial units of these studies are basically administrative districts. In order to further promote the sustainability of urban facilities, the researchers used big data tools to transition the study subjects into smaller research units. The relevant research constructs a suitable analysis grid based on the Autonavi POI facility point [33], Baidu thermal data [34], and GPS data [35] to explore the actual supply of various facilities and the adaptation of residents’ demands. Scholars measured the accessibility level of urban facilities from the perspective of the elderly based on geographic information systems to support the urban planning process [36]. Based on data from the latest census and multivariate analysis techniques, researchers studied the relationship between urban infrastructure and urban segregation through neighborhood typology [37].
The following conclusions were obtained by combing the literature on the development of fresh e-commerce platforms and infrastructure configuration. First, fresh e-commerce pre-warehouse is a significant part for the construction of urban basic living material, and a necessity for future urban sustainable public infrastructure. At the same time, a large number of studies evaluated the facility coverage from the demand-side perspective of population size, but there is a lack of research on the supply side. Furthermore, the theory of “15-min living circle” has become an important criterion for studying the allocation of urban facilities in the field of urban planning.
Based on the above research, it is of great significance to evaluate the service and sustainable development ability of fresh e-commerce platform as urban infrastructure from the perspective of supply side. The sustainability and accessibility costs on the supply side of infrastructure are respectively related to the population size and spatial scale of the service area. Therefore, this paper takes the service population size [38] and space scale [39] of the fresh e-commerce pre-warehouse as the main indicators, based on the population data of Baidu Heat Map and the POI data of the fresh e-commerce pre-warehouse, comprehensively analyzes the suitability degree of the fresh e-commerce pre-warehouse in 101 streets of central city of Shanghai, and discusses the sustainability and service cost of the fresh e-commerce pre-warehouse, which finally provides operable ideas for the configuration method of public service infrastructure.
3. Research Spatial Scale, Data Sources, and Research Methods
3.1. Spatial Scale of Study
Shanghai is divided into four levels by roads: Inner Ring, Central Ring, Outer Ring, and Suburbs. The research area of this paper is mainly in the central city of Shanghai, which involves 101 streets, respectively, in Huangpu District, Xuhui District, Changning District, Jing’an District, Putuo District, Hongkou District, Yangpu District, Minhang District, Baoshan District, Jiading District, and Pudong New Area (Table 2, Figure 2 and Figure 3). The study area is about 635.13 km2 and has 10 million permanent residents, with a population density of 15,700 people/km2. It is a 100% urbanized area with relatively complete daily public service facilities. The study area has basically achieved full coverage of e-commerce pre-warehouse. Therefore, the population data and POI data of fresh e-commerce pre-warehouse in the study area are more convincing and experimental, which can better explain the significance of the material support of fresh e-commerce pre-warehouse in emergencies.
Table 2.
Study spatial scale street table.
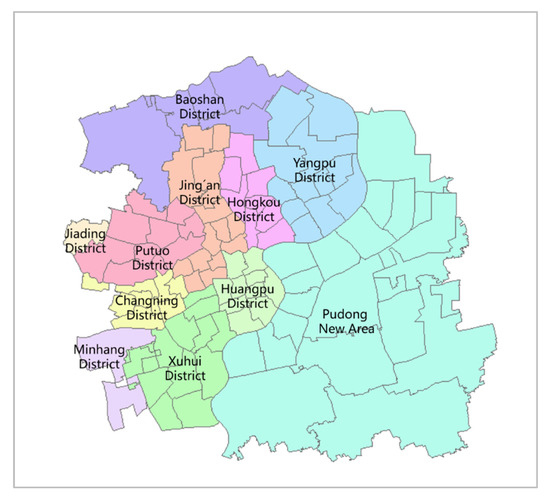
Figure 2.
Scale map of study area.
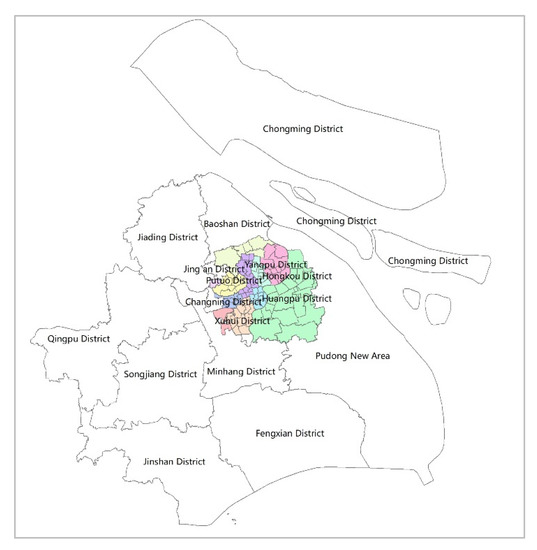
Figure 3.
Location map of the study area.
3.2. Research Data
The research data are mainly the population extracted from Baidu heat map and POI data of pre-warehouse points of e-commerce platform.
3.2.1. Population Data
The alpha value of the corresponding color of Baidu heat map is related to the spatial density of population, and there is a corresponding reclassification function (Table 3) [40,41]. Based on Baidu heat map, geographical location coordinates (Figure 4), and the reclassification function, this paper obtains the population distribution map of the study area through data preprocessing, reclassification, grid division, and population activity quantity statistics. During the epidemic control period, residents were basically at home, and therefore the heat map basically reflected the real population distribution in central city of Shanghai. This study captured the Baidu heat map at 8:00 p.m. on Sunday, 10 April 2022, and the data accuracy is 17-level (30 m × 30 m). In order to obtain smaller-scale basic spatial units, set the size of 300 m × 300 m grid, its area is 0.09 km2 of the basic space unit. After processing, there are 7057 units in the study area. After data conversion, the total active population in the study area is about 10,694,400 (Figure 5).
Table 3.
Reclassification table of population aggregation density of the Baidu heat map.
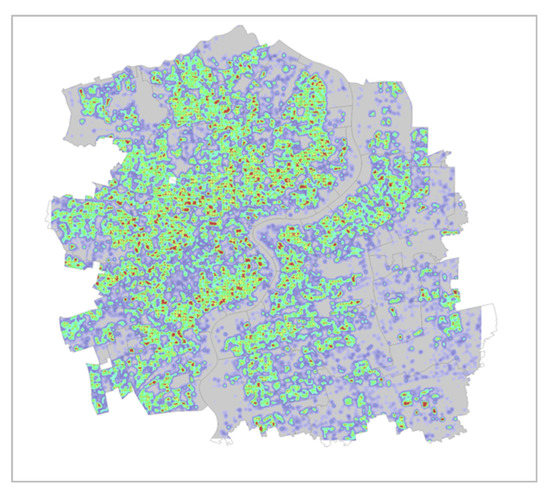
Figure 4.
Population heat map of the study area.
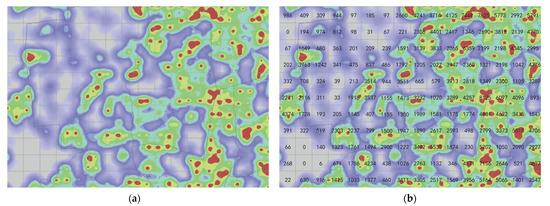
Figure 5.
Sketch of population activity quantity extraction. (a) Gridding (300 m × 300 m); (b) Population activity quantity extraction (300 m × 300 m).
3.2.2. POI Data
POI data are the core data of location-based services widely used in electronic maps. POI is short for “Point of Interest” or “Point of Information”.
This study captures the POI data of fresh e-commerce pre-warehouse by making use of python to retrieve the name of fresh e-commerce pre-warehouse (Table 4). The POI data of fresh e-commerce pre-warehouse obtained from Baidu map were contained in a text file with geographical location coordinates. After de-duplication screening, we obtained 254 effective fresh e-commerce pre-warehouse data located in the central city of Shanghai (Figure 6).
Table 4.
A pre-warehouse table of fresh e-commerce in the study area.
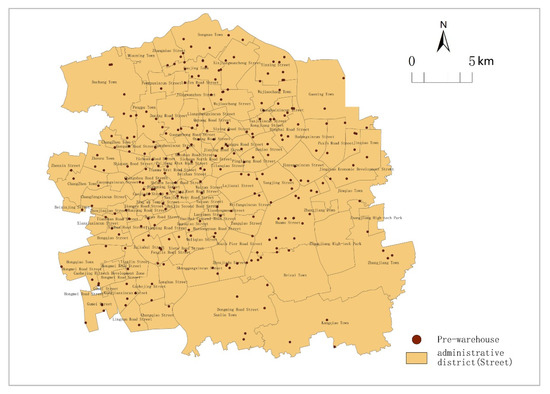
Figure 6.
Distribution points of fresh e-commerce pre-warehouses.
3.3. Research Methods
3.3.1. Fresh E-Commerce Pre-Warehouse-Analysis Method of Spatial Characteristics of Population Distribution
The method used to calculate the kernel density of the fresh e-commerce pre-warehouse is the kernel density analysis in ArcGIS tool. The calculation formula of kernel density is as follows:
where h is the threshold, n is the number of points within the threshold, d is the dimension of the data, and is the kernel density equation, which means that the density value is the highest when it is distributed at the center of the point, and gradually decreases when it is distributed outward. The higher the nuclear density, the denser the distribution of point elements [42].
The spatial characteristics and population distribution density of the fresh e-commerce pre-warehouse were determined through the superimposed comparison diagram of the core density of pre-warehouse and the population distribution density of the study area.
3.3.2. Delineation Method of Fresh E-Commerce Pre-Warehouse Service Area
The spatial scale of the service area of the fresh e-commerce pre-warehouse of fresh e-commerce is not necessarily the same as the population size, and the unified spatial scale analysis by using buffer method will lead to errors in the results. Therefore, based on the principle of nearest accessibility, the nearest fresh e-commerce pre-warehouse point was obtained by using the nearest neighbor analysis method of ArcGIS, and its service region was obtained by merging the same grid of the nearest pre-warehouse [43]. The principle of nearest neighbor analysis is equivalent to the two-dimensional calculation formula of Euclidean distance:
3.3.3. Evaluation Method of Fresh E-Commerce Pre-Warehouse Service Area
The main factors to evaluate the allocation of public service facilities are the size of service population and service space scale. In this study, is used to represent the spatial scale of the fresh e-commerce pre-warehouse and is used to represent the size of service population. represents the minimum value of service area space scale, represents the maximum value of service area space scale, and indicates the average value of service area space range. represents the minimum value of the service population size, represents the maximum value of the service population size, and indicates the average value of the service population size. According to the calculation, the average service population size of the fresh e-commerce pre-warehouse in the study area is 42,270 people, and the average space scale is 2.51 km2.
According to “Shanghai Municipal People’s Government. Shanghai planning guidance of 15-min community-life circle” [22], the fresh e-commerce pre-warehouse belongs to the 15-min community living circle level facility, so its service radius is 800–1000 m, the service space scale is 2.01–3.14 km2, and the service population size is 50,000–100,000. Therefore, the upper limit values of 3.14 km2 and 100,000 people were taken as the supply capacity of the fresh e-commerce pre-warehouse, which are respectively expressed as and . The average value of service population and spatial scale in the study area satisfies and . Based on the above setting, the evaluation formula of adaptive relationship between service population size and spatial scale of fresh e-commerce pre-warehouse was obtained.
The evaluation formula of population size adaptation relationship is as follows:
The evaluation formula of spatial adaptation relationship of service area is as follows:
Based on the above two formulas, represents the adaptative relationship between supply capacity pre-warehouse and service population size of the fresh e-commerce pre-warehouse and represents the adaptative relationship between spatial scale and service range of the fresh e-commerce pre-warehouse. Excess value means that the supply capacity of fresh e-commerce pre-warehouse is much higher than the demand capacity within its service area; the value appropriately indicates that the supply capacity of the pre-warehouse of fresh e-commerce just meets the demand capacity of its service area and can obtain the sustainability of economic benefits. Insufficient value means that the layout of fresh e-commerce pre-warehouse needs to be appropriately increased in the service area to meet the needs of residents in the service area. The cases of insufficient G value are discussed as follows:
- (1)
- When but , is insufficient, but is excessive or appropriate. In this situation, the fresh e-commerce pre-warehouse meets the demand in the service area, but the cost of material distribution is high due to the dispersed population in the service area.
- (2)
- When but , is excessive or appropriate, but is insufficient. In this case, due to the high population density in the service area of the fresh e-commerce pre-warehouse, the population demand in the service area cannot be met. New pre-warehouses will not be considered if the pressure can be released to the nearest fresh e-commerce pre-warehouse.
- (3)
- When and , and are both insufficient. The e-commerce pre-warehouse in this situation cannot meet the needs of residents in the service area. In addition, since the service space scale of fresh e-commerce pre-warehouse is too large and the transport capacity cost is high in the further-away population gathering areas, it can increase the fresh e-commerce pre-warehouses.
4. Analysis Process
According to the kernel density analysis, the superposition analysis diagram of the kernel density and population density of the fresh e-commerce pre-warehouse in the study area was obtained (Figure 7). It was found that there is a high consistency between the fresh e-commerce pre-warehouse location and the spatial agglomeration characteristics of population distribution in the Puxi District of central city of Shanghai, and the main concern in these area is that the size of population exceeds the capacity. However, the population distribution of Sanlin Town, Dongming Road Street, Kangqiao Town, Zhangjiang High-tech Park, and other streets in Pudong area was evacuated, and the distribution density of pre-warehouses is low, which may lead to the required service scale being too large and other problems. Therefore, the service area of the fresh e-commerce pre-warehouse in the study area was delimited to conduct further comprehensive research on the scale of service space and population size.
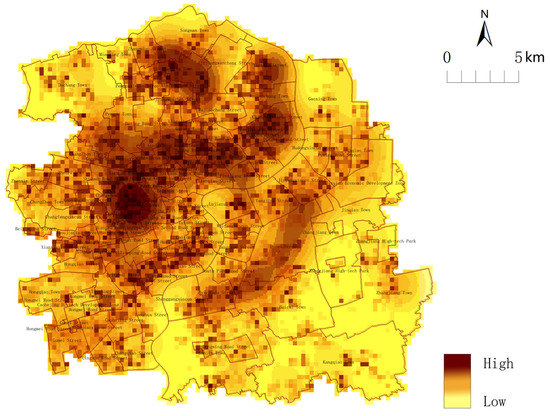
Figure 7.
Overlay diagram of fresh e-commerce pre-warehouse population density in the study area.
The service area of the pre-warehouse of fresh e-commerce platforms in the study area is as follows (Figure 8).
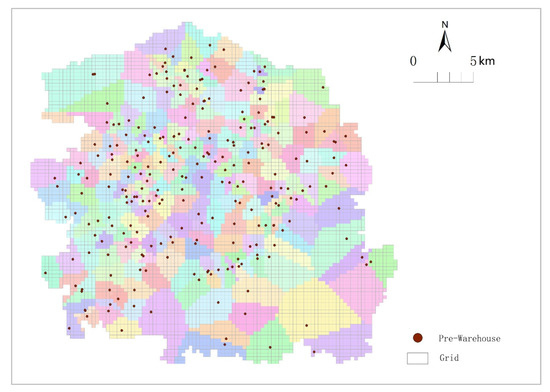
Figure 8.
Service area diagram of e-commerce pre-warehouse.
According to ArcGIS statistical tools, the minimum, average, and maximum values of the spatial range and service population size of each fresh e-commerce pre-warehouse service area were obtained. Among them, the spatial scale data is 0.18 km2, is 2.51 km2, and is 23.58 km2. The numbers of and were 135, 42,270, and 168,635, respectively (Table 5).
Table 5.
The minimum, average, and maximum value of spatial scale and population size.
Therefore, based on the study of minimum, average, maximum, and the 15-min living circle value of spatial scale and population data, respectively, we took the evaluation formula of population size and spatial scale described in the research methods as standards then evaluated the supply capacity of service areas of each fresh e-commerce pre-warehouse. The supply capacity evaluation of fresh e-commerce pre-warehouses based on service spatial scale and population size (Figure 9 and Figure 10).
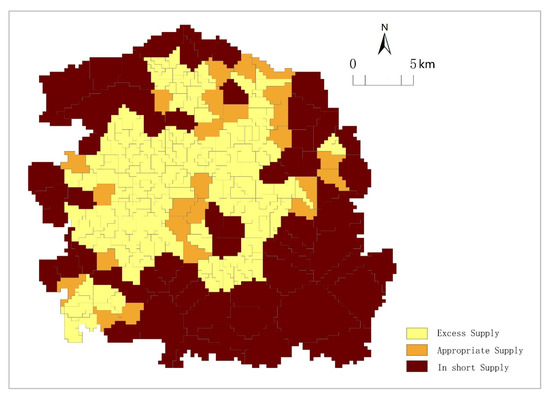
Figure 9.
Spatial service scale map of fresh e-commerce pre-warehouse.
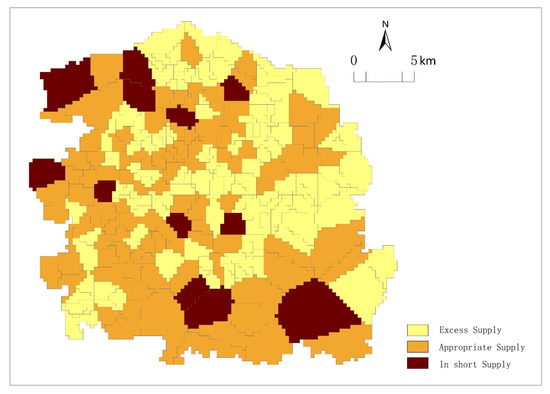
Figure 10.
Service population size map of fresh e-commerce pre-warehouse.
According to Figure 9, there are 59 fresh e-commerce pre-warehouses whose service space is larger than the standards of 15-min community living circle (), and their supply capacity is not enough to cover their service areas. These pre-warehouses are mainly distributed in the edge of central city of Shanghai, and the service area accounts for 55.62% of the total study area, among which 30 pre-warehouses are located in Pudong New Area. There are 169 e-commerce pre-warehouses with excess supply capacity, which are mainly distributed in the center of the study area.
As shown in Figure 10, there are twelve fresh e-commerce pre-warehouses whose population size in the service area exceeds the upper limit of the standards of 15-min community living circle, and the supply capacity of these pre-warehouses cannot meet the resident demand. The e-commerce pre-warehouse with the largest service area is located in Kangqiao Town, Pudong New Area. There are 100 fresh e-commerce pre-warehouses whose supply capacity meets the needs of the population size in the service area and the benefits are sufficient to achieve sustainability of development. The supply capacity of other pre-warehouses is far greater than the population demand in the service area.
5. Results and Discussion
According to the above results, there are widespread characteristics in the spatial scale of each fresh e-commerce pre-warehouse service area: the closer the fresh e-commerce pre-warehouse to the central city, the denser the distribution, and the smaller the service space scale is. The service space scale of the pre-warehouses away from the central is larger. However, the population size of each pre-warehouse service area does not show an obvious characteristic trend, and the central area showed all three types of service areas: insufficient supply capacity, appropriate supply capacity, and excess supply capacity. Therefore, the e-commerce pre-warehouse whose supply capacity cannot meet the demand of its service area was analyzed and relevant suggestions were given. There are three main situations.
- (1)
- but (Figure 11), that is, the space scale of the pre-warehouse service area is smaller, but the population size is larger than the standard of 15-min community living circle. This situation is usually found in urban centers with high population density. The e-commerce pre-warehouses in this area are densely distributed with small service area, such as Freshshippo (Dapuqiao SML Center) and Tramy Fresh (Zaoyang Road Store) in the study area, whose service areas mainly involve Dapuqiao Street and Cao Yang Xincun Street. This kind of area is characterized by high population density, so the e-commerce pre-warehouses in this area need to improve their own supply capacity to meet the needs of high-density population.
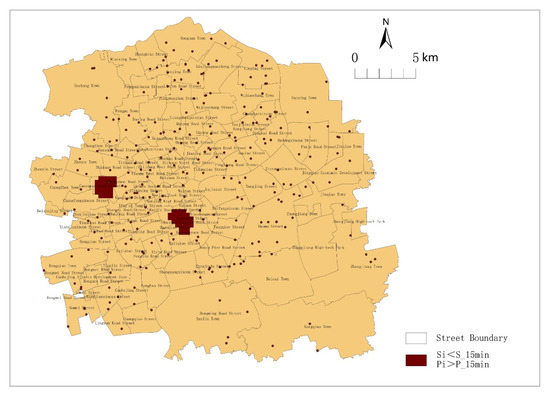 Figure 11. Service area diagram of and .
 - (2)
- but (Figure 12), that is, the space scale of the service area is larger, but the population size is smaller than the standard of 15-min community living circle. This situation is generally found in the marginal area with low population density in central city of Shanghai, where the e-commerce pre-warehouses are scattered so the spatial scale of the service areas is too large. Songnan Town in Baoshan District, Shanggang Xincun Street, Beicai Town, Zhangjiang Town, Zhangjiang High-tech Park, Jinqiao Town, Gaohang Town, and Hudong Xincun Street in Pudong New Area all belong to this category. The population size of such service areas is moderate, but service areas are too large to increase the delivery cost of each fresh e-commerce pre-warehouse. Therefore, these urban areas need to appropriately increase the capacity of existing pre-warehouses.
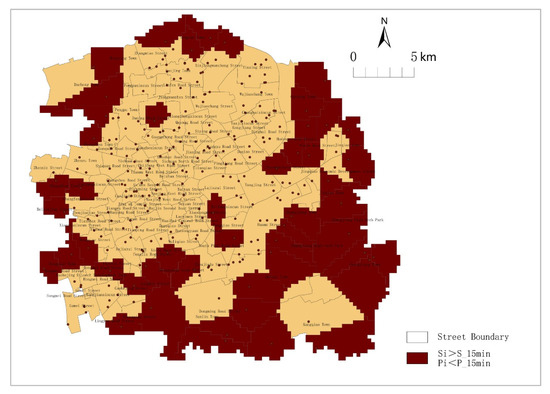 Figure 12. Service area diagram and .
 - (3)
- and (Figure 13), that is, the service space scale and the service population size both exceed the standard of 15-min community living circle. There are ten fresh e-commerce pre-warehouses in the research area. For example, the main service area of RT Mart (Kangqiao Store) in Pudong New Area radiates to Kangqiao Town, and the main service area of Yonghui Supermarket (Jinqiu Xintiandi Store) in Baoshan District is Dachang Town. The population size and spatial scale of these fresh e-commerce pre-warehouse are beyond the standard value. Therefore, it is necessary to increase the distribution of fresh e-commerce pre-warehouses to guarantee the online basic living supply capacity in these areas.
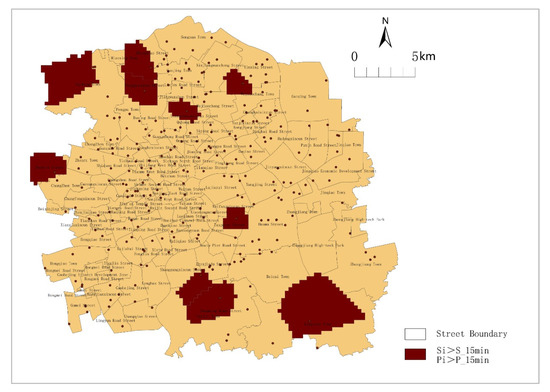 Figure 13. Service area diagram of and .
This article uses Shanghai as an example to understand how the distribution of facilities can effectively ensure the lives of residents through spatial fitting of the two elements of population and facilities in large cities. The facilities here take the fresh food front storage as the research object. Through this fitting, we express the elements that should be paid attention to in terms of zoning, classification, and classification of facilities in large cities. From the results of this paper’s analysis, the main reason for the undersupply of front-end warehouses is that the area covered by its space is not as large as it should be, as well as the size of the population within its coverage area exceeding the set size. However, in daily times, this study will face two uncertain factors. One is the large flow of urban population, especially the changes in residential and living locations, which makes the service objects of the fresh food front warehouse unable to accurately correspond to the residential population of the region. The second is that raw and fresh front-end warehouses can easily obtain material distribution and replenishment through urban logistics, and their supply capacity is highly elastic. During the epidemic period, Shanghai implemented a citywide closed management, with residents basically not moving but completely closed in their residential areas. However, the mutual allocation of raw and fresh front-end warehouses was difficult due to the blocking of the logistics system, making the inventory of front-end warehouses basically only available to surrounding communities. This provides a suitable scenario for this study, where the capacity and population distribution of the facility sites are basically static, and it is possible to fully study whether the facility can truly meet the needs of the population served in this state.
In the analysis of the results, we found that most of the problematic front-end warehouse locations were located at the edge of the central city (Figure 11 and Figure 12), which echoes the correlation between urban utility configurations and the economic, environmental, social, and sustainability of the city mentioned in the introduction of this paper. Residents living on streets at the edge of the central city are generally not as economically strong as those inside the central city, and therefore have lower daily demand for fresh food, which may reduce the willingness of fresh food e-commerce companies to set up front warehouses there. This may not have a great deal of impact in normal times, because the lack of distribution can be compensated by logistics distribution between different regional warehouses, but once the logistics is interrupted and needs to run itself there will be a shortage of supply. This relates to urban sustainability and urban resilience, as this can only show up in special circumstances.
With the help of specific scenarios, this study can more realistically reflect the coupling relationship between facilities and population, reflecting the problems existing in urban resilience and sustainable operation.
6. Suggestions
6.1. Establishing a Flexible Fresh Food Supply Guarantee System
This study found that during the lockdown period, most community supermarkets and vegetable markets that provide fresh food to citizens were unable to continue their business, while temporary material supply points set up by the government and pre-warehouse of e-commerce platforms became the main fresh food supply platforms. At the same time, these material supply points and pre-warehouses themselves are part of the city’s daily supply system. Therefore, while designing the daily supply system, the city should also consider responding to different risks and form a flexible fresh food supply guarantee system. It should be pointed out that “daily” is the basis for “emergency”. The city government should conduct risk assessments, simulate the process of material guarantee during normal operation of the city, and try to establish an effective, flexible, and sustainable two-level material supply system for “daily emergencies”.
6.2. Guaranteeing Supply Should Be Closely Integrated with Population Distribution and Characteristics
When studying different areas of Shanghai, this article found that the closer to the central urban area, the denser the distribution of supply points and the smaller the service area, while the farther away from the central area, the larger the service area. However, even in the central urban area, there are insufficient, appropriate, and excessive supply capabilities. This shows that the supply system based solely on administrative regions is not adaptable and cannot reflect the characteristics of different areas. In order to establish a sustainable urban supply security system, it is necessary to strengthen the research on the characteristics of different urban areas in order to better adapt to their needs. Through this study, we can find that, due to the different density and distribution of the urban population, the method of ensuring the distribution of supply points based on administrative divisions has its limitations. The city should set up corresponding supply points according to the actual distribution of the population and evaluate the capacity and sustainability of each supply point. In areas with high population density, supply points should be increased, or supply capacity should be improved, and vice versa.
6.3. Increasing Coordination While Ensuring the Independence of Pre-Warehouses
Each front warehouse should have “independence”, not only operating independently to provide fresh food for the surrounding areas but also maintaining basic functions in emergency situations. At the same time, it is also required to coordinate and manage the material guarantee at a higher level in the city, to timely obtain the inventory status of each front warehouse for mutual replenishment, and to maintain orderly collaboration within certain rules and scope. This is also an embodiment of the sustainable aspect of the urban material supply system.
6.4. Construct a Comprehensive Mechanism for Risk Assessment and Research
To enhance the sustainability and resilience of cities and to cope with risks, it is necessary to establish mechanisms for risk warning and assessment. For example, the lockdown of cities caused by the COVID-19 pandemic was a sudden risk challenge. From the initial panic to the later calm response, Shanghai’s “self-adaptive” process reflected the city’s ability to adapt while also highlighting the deficiencies in the city’s risk warning and assessment. If the city’s closure could be predicted in advance and the duration of the closure could be accurately assessed, the government and residents would have the opportunity to make certain material reserves to cope with the risk. At the same time, this warning and assessment mechanism will also play a role in the face of the next risk and is a truly effective means of enhancing the sustainability of cities.
Building a way to learn from and accumulate experience in risk response formed a virtuous cycle mechanism of reflection, summary, and continuous optimization. During the Shanghai lockdown period of the current pandemic, the city government adopted different response measures at different stages. Some achieved good results (such as effectively blocking the path of the spread of the epidemic through the isolation of different areas), but some were not effective (such as designating government supply points for material supply, which could not meet the demand for fresh food of residents in the early stages of the epidemic). For these experiences and lessons, they should be organized through learning and reflection mechanisms to form more effective means to deal with the next crisis.
7. Conclusions
The city lockdown caused by the COVID-19 pandemic and the various issues during that time provide a good case for studying urban sustainability and resilience. During the lockdown period in Shanghai, over 25 million people were restricted from traveling, and the city’s various systems faced unprecedented challenges. It is worth conducting in-depth research on how to continue to ensure the operation of the city under such circumstances. At the same time, strengthening the theoretical research on urban sustainability and resilience will also help cities to deal with other risks and challenges and reduce losses.
This study focuses on Shanghai during the 2022 blockade, as residents mainly purchased basic living materials through e-commerce platforms on the basis of government support materials. It should be noted that the fresh e-commerce platform has become an important guaranteed force for urban operations, and its effective configuration can help improve the resilience and sustainability of cities in responding to sudden changes. At the same time, e-commerce platforms need to consider the material supply capacity in emergency situations and the sustainability of their own economic benefits under normal circumstances. Therefore, when evaluating facilities, it is necessary to conduct a comprehensive analysis of their service population size and service space scope.
Based on the POI data of Baidu Thermal Map and e-commerce pre-warehouse, this study analyzed the population size and spatial scale of the study area using the fishing net creation and neighborhood analysis tools in ArcGIS. It broke through the restrictions of administrative boundaries and analyzed the distribution characteristics between urban e-commerce pre-warehouse and urban population from a more intuitive perspective. We analyzed the spatial coverage capacity and service population size of the e-commerce pre-warehouse service area, found out the synchronous trend of the urban agglomeration effect and population distribution density of the e-commerce pre-warehouse, and proposed using the e-commerce pre-warehouse as a material support system site.
Through similar research, it is helpful for us to better observe the layout principles of urban e-commerce pre-warehouses, discover the weak areas in urban e-commerce networks in time, and take a series of measures such as adding distribution points, increasing inventory and increasing capacity in time to enhance the resilience and sustainability of cities.
Author Contributions
Conceptualization, J.W.; Methodology, J.W.; Software, J.W. and M.-J.F.; Validation, J.W. and M.-J.F.; Formal analysis, J.W.; Resources, J.W.; Writing–original draft, J.W. and M.-J.F.; Writing–review & editing, J.W.; Visualization, M.-J.F.; Supervision, J.W.; Project administration, J.W.; Funding acquisition, J.W. All authors have read and agreed to the published version of the manuscript.
Funding
This research was funded by China National Social Science Fund (No. 19BJY063).
Institutional Review Board Statement
Not applicable.
Informed Consent Statement
Informed consent was obtained from all subjects involved in the study.
Data Availability Statement
All the data used for several analyses are freely available and resources are mentioned within the paper.
Conflicts of Interest
The authors declare no conflict of interest.
References
- Holling, C.S. Resilience and Stability of Ecological Systems. Annu. Rev. Ecol. Syst. 1973, 4, 1–23. [Google Scholar] [CrossRef]
- Wan, J.Q.; Liang, X. Construction of Urban Resilience under Pandemic Normalization. China Economist. 2022, 03, 38–41. [Google Scholar]
- Shao, Y.W.; Xu, J. Understanding Urban Resilience: A Conceptual Analysis Based on Integrated International Literature Review. Urban Plan. Int. 2015, 30, 48–54. [Google Scholar]
- Bolouri, S.; Vafeainejad, A.; Alesheikh, A.; Aghamohammadi, H. Environmental sustainable development optimizing the location of urban facilities using vector assignment ordered median problem-integrated GIS. Int. J. Environ. Sci. Technol. 2020, 17, 3033–3054. [Google Scholar] [CrossRef]
- Nong Hao Shanghai. Shanghai Home Food Guide. Available online: https://baijiahao.baidu.com/s?id=1727984053553714285&wfr=spider&for=pc.2022-03-22,2022 (accessed on 18 May 2022).
- Mao, Y. Research on the Sustainability Factors of Urban Large Infrastructure. Urban Dev. Res. 2009, 16, 92–95+111. [Google Scholar]
- Task Group. The Relationship between Infrastructure Investment and Manufacturing Industry Growth. Econ. Res. J. 2002, 2, 37–47. [Google Scholar]
- Boyle, L.; Michell, K. Urban facilities management: A systemic process for achieving urban sustainability. Int. J. Sustain. Dev. Plan. 2017, 12, 446–456. [Google Scholar] [CrossRef]
- Kim, Y.; Oh, J.; Kim, S. The Transition from Traditional Infrastructure to Living SOC and Its Effectiveness for Community Sustainability: The Case of South Korea. Sustainability 2020, 12, 10227. [Google Scholar] [CrossRef]
- Bobylev, N. Urbanization and environmental security-Infrastructure development, environmental indicators, and sustainability. In Proceedings of the NATO Advanced Research Workshop on Environmental Change and Human Security, Newport, RI, USA, 4–7 June 2007. [Google Scholar]
- Dong, Q. Research on the Location of Central Warehouse and Pre-Warehouse of Fresh E-Commerce Enterprises Based on Demand Prediction. Master’s Thesis, Beijing Jiaotong University, Beijing, China, 2020. [Google Scholar]
- Chen, J.; Dong, M. Research on the Aggregation Strategy Considering the Freshness of the Fresh Product. Syst. Eng.-Theory Pract. 2018, 38, 2018–2031. [Google Scholar]
- Wang, M.M.; Han, X.L. Joint Site-Path-Inventory Optimization of Perishables Supply Chain Considering Carbon Emissions. J. Shanghai Marit. Univ. 2019, 40, 45–51. [Google Scholar]
- Song, L. Research on Customer Satisfaction of in-depth Distribution of E-commerce Logistics. Enterp. Reform Manag. 2016, 23, 59–61. [Google Scholar]
- Jimu News. Experts on the “Wuhan Supply War” during the Epidemic: Creating the Wuhan Model of Emergency Insurance Supply in Megacities. Available online: https://baijiahao.baidu.com/s?id=1671649830684550853&wfr=spider&for=pc,2020 (accessed on 25 April 2022).
- The People’s Daily. In Response to the Epidemic, Local Governments Have Introduced Policies to Support Daily Necessities. Available online: https://baijiahao.baidu.com/s?id=1715674764591081889&wfr=spider&for-pc,2021 (accessed on 15 May 2022).
- Zhang, D.W.; Chen, W.D.; Li, X.P.; Kong, N.N. Research on the Code of Urban Community Public Service Facilities Plan and Its Implementation Unit: A Case of Wuhan. Urban Plan. Forum 2006, 3, 99–105. [Google Scholar]
- Yuan, J.D.; Sun, Z.J.; Zhang, N.; Zhang, Z. Reconstruction of urban region system in China based on daily life circle. Sci. Geogr. Sin. 2005, 1, 17–22. [Google Scholar]
- Mukherjee, K.; Mondal, D. Spatial equity in urban facility versus residents satisfaction: Challenge for the unplanned citiesa case study of Barasat city, India. Geo J. 2022, 87, 931–949. [Google Scholar] [CrossRef]
- Lu, H.; Zhan, S.R. Evolution and Comparison for Configuration Standard of Public Service Facilities in Urban Community. Community 2019, 1, 14–17. [Google Scholar]
- Ashik, F.R.; Mim, S.A.; Neema, M.N. Towards vertical spatial equity of urban facilities: An integration of spatial and aspatial accessibility. J. Urban Manag. 2020, 9, 77–92. [Google Scholar] [CrossRef]
- Tang, X.L.; Zhang, Q. Model and Empirical Research on Evaluation of Urban Infrastructure Space Allocation Efficiency. Mod. Urban Stud. 2019, 5, 122–128. [Google Scholar]
- Shariff, S.S.R.; Moin, N.H.; Omar, M. Location allocation modeling for healthcare facility planning in Malaysia. Comput. Ind. Eng. 2012, 62, 1000–1010. [Google Scholar] [CrossRef]
- Pooja, K.; Viriyasitavat, W.; Yadav, K.; Dhiman, G. Analysis of Clustering Algorithms for Facility Location Allocation Problems; Springer Science and Business Media: Berlin, Germany, 2023; pp. 597–605. [Google Scholar]
- Arruthers, J.I.; Ulfarsson, G.F. Urban sprawl and the cost of public services. Environ. Plan. B 2002, 30, 503–522. [Google Scholar] [CrossRef]
- Shanghai Planning and Land Resource Administration Burea. Shanghai Planning Guidance of 15-Minute Community-Life Circle (Trial); Shanghai Planning and Land Resource Administration Burea: Shanghai, China, 2016. [Google Scholar]
- Li, M. Research on the planning strategy of “15-minute Community Living Circle” based on the characteristics of residents’ behavioral needs. Urban Plan. Forum 2017, 1, 111–118. [Google Scholar]
- Li, A.M.; Zhang, J.X. Equal Urban Rural Public Service Facility Development. Planners 2011, 27, 5–11. [Google Scholar]
- Chen, Q.; Yang, X. Exploration on the Planning of Fundamental Public Service Circle in Chengdu. City Plan. Rev. 2013, 37, 89–92. [Google Scholar]
- Han, Z.; Du, P.; Wang, L.; Yu, Y.; Zhao, D.X.; Cong, Y.X.; Ren, Q.L. Method for Optimization Allocation of Regional Public Service Infrastructure: A Case Study of Xinghua Street Primary School. Sci. Geogr. Sin. 2014, 34, 803–809. [Google Scholar]
- Dadashpoor, H.; Rostami, F.; Alizadeh, B. Is inequality in the distribution of urban facilities inequitable? Exploring a method for identifying spatial inequity in an Iranian city. Cities 2016, 52, 159–172. [Google Scholar] [CrossRef]
- Setyono, D.A.; Cahyono, D.D.; Helmy, M. Measuring Service Capacity of Public Facilities Based on Supply Aspect (Case Study: Elementary School in Malang City). Procedia-Soc. Behav. Sci. 2016, 227, 45–51. [Google Scholar] [CrossRef]
- Sun, D.S.; Chai, Y.W. Study on the Urban Community Life Sphere System and the Optimization of Public Service Facility: A Case Study of Qinghe Area in Beijing. Urban Dev. Stud. 2017, 24, 7–14+25+2. [Google Scholar]
- Zhou, D.L.; Huang, H.M. Community Life Circle Public Facility Configuration Study Based on Demand-Supply Correlation: A Case Study of Guangzhou. Urban Dev. Stud. 2019, 26, 1–5+18. [Google Scholar]
- Chang, F.; Wang, L.C.; Ma, Y.; Yan, C.; Liu, H. Do Urban Public Service Facilities Match Population Demand? Assessment Based on Community Life Circle. Prog. Geogr. 2021, 40, 607–619. [Google Scholar] [CrossRef]
- Guida, C.; Gargiulo, C.; Caglioni, M.; Carpentieri, G. Urban Accessibility to Healthcare Facilities for the Elderly: Evolution of the Time-Based 2SFCA Methodology for the Nice Case Study (France). In Proceedings of the 21st International Conference on Computational Science and Its Applications, ICCSA 2021, Cagliari, Italy, 13–16 September 2021; Springer Science and Business Media: Berlin, Germany, 2021. [Google Scholar]
- Niembro, A.; Guevara, T.; Cavanagh, E. Urban segregation and infrastructure in Latin America: A neighborhood typology for Bariloche, Argentina. Habitat Int. 2020, 10, 107. [Google Scholar] [CrossRef]
- Fan, X.J. Study on Supply Decision System for Public Cultural Servicing Facilities Based on Satisfaction Degree. Ph.D. Thesis, Tianjin University, Tianjin, China, 2016. [Google Scholar]
- Yang, Q.Y.; Xu, J.G. An Analysis Model of Public Service Facilities Based on Attraction Accessibility. Planners 2015, 31, 96–101. [Google Scholar]
- Zhang, H.L. Extracting Active Population Data Based on Baidu Heat Maps for Transportation Planning Applications. Urban Transp. China 2021, 19, 103–111. [Google Scholar]
- Tan, X.; Huang, D.Q.; Zhao, X.S.; Ying, Y.U.; Leng, B.; Feng, L. Jobs housing balance based on Baidu thermodynamic diagram. J. Beijing Norm. Univ. (Nat. Sci.) 2016, 52, 622–627+534. [Google Scholar]
- Wang, F.H. Quantitative Methods Applications in GIS; The Commercial Press: Beijing, China, 2011. [Google Scholar]
- Cheng, L.; Wang, F.H.; Xiu, C.L. Trade Area of Supermarket in Changchun Centeral Urban Area Based on GIS. Econ. Geogr. 2014, 34, 54–58+83. [Google Scholar]


Disclaimer/Publisher’s Note: The statements, opinions and data contained in all publications are solely those of the individual author(s) and contributor(s) and not of MDPI and/or the editor(s). MDPI and/or the editor(s) disclaim responsibility for any injury to people or property resulting from any ideas, methods, instructions or products referred to in the content. |
© 2023 by the authors. Licensee MDPI, Basel, Switzerland. This article is an open access article distributed under the terms and conditions of the Creative Commons Attribution (CC BY) license (https://creativecommons.org/licenses/by/4.0/).