Abstract
After the COVID-19 pandemic, the bio-industry is becoming increasingly important. Therefore, it is necessary to respond to the changed environment after COVID-19 by analyzing the bio-industry situation before the COVID-19 pandemic. In addition, Korean bio-industry is a very important industry for Korea’s economic growth, so huge investments are being made in the development of bio-companies. Therefore, it is necessary to analyze the effect of innovation capabilities on the performance of the Korean bio-industry. Korea’s bio-industry has been developing under the leadership of the government. Thus, Korea’s bio-companies need various forms of innovation to achieve sustainability through competitive advantage on their own. The objective of this research is to find the competitive advantage factors that improve the innovation ability of the Korean bio-industry. Therefore, the elements that increase a company’s innovation capability were studied in order to uncover competitive advantage factors that improve the Korean bio-industry’s innovation capability, and the effect on corporate performance was analyzed. Using samples from the ‘Korean Bio-industry Survey’, the current state of the Korean bio-industry was examined through a review of all bio-industry enterprises. In addition, each of the eight bio-industries was examined using Korea’s industrial classification system. As an analysis method, multiple regression analysis of SPSS 25 was performed to analyze how the six input factors have a complex effect on the output factor. This study discovered that R&D intensity, machine investment, and human resource characteristics all had an impact on the business performance of Korean biotech enterprises. In eight bio-sectors, elements affecting company success were defined differently. Therefore, through this study, Korean bio-companies must understand their own industrial characteristics, and develop factors that affect business performance through strategic operational management. In addition, based on the results of this study, companies should strengthen the innovation capabilities of the bio-industry to survive post-COVID-19, analyze changes in innovation capabilities, and promote sustainable growth by strengthening key innovation factors.
1. Introduction
The bio-economy is a concept that has received a lot of attention over the past decade [1], and it is usually focused on the development of biotechnology [2]. According to the traditional definition, a bio-economy consists of all economic activities related to the development of renewable resources, biological products, and processes [3,4,5,6,7]. Recently, the bio-industry supporting the bio-economy is growing in importance worldwide due to the COVID-19 pandemic. The scope of the bio-industry is classified differently by country. Korea’s bio-industry is classified into bio-pharmaceutical industry, bio-chemical and bioenergy industry, bio-food industry, bio-environmental industry, bio-medical equipment industry, bio-instrument and bio-equipment industry, bio-sources industry, and bio-service industry based on the Korea bio-industry classification system (KS J 1009) [8]. Korea is developing the bio-industry centering on the bio-health industry [9], and the bio-health industry is classified into medical products, medical equipment, and medical services [8]. Compared to other industries, the bio-industry is characterized by relatively high technology, uncertain markets, long commercialization times, and high development costs [10]. In addition, bio-industry is a winner take all market. Therefore, bio-companies must eliminate uncertainty through strategic technology management, and achieve sustainability through innovation. Korea’s bio-industry has been developing under the leadership of the government [9]. Thus, Korea’s bio-companies need various forms of innovation to achieve sustainability through competitive advantage on their own because innovation is a factor in the success that increases an organization’s revenue and organizational excellence [11]. Internal capabilities for innovation provide a role in creating sustainable competitive advantage and improving performance [12], while external capabilities, such as collaboration, influence innovation by sharing different resources [13]. Therefore, companies must improve their innovation capabilities in order to innovate. Innovation capability is a comprehensive organizational characteristic that accelerates and drives innovation strategies and improves the company’s performance [14]. Innovation capability conducts an important role in improving performance and competitive advantages in both domestic and international markets [15]. Thus, several studies have been conducted on the various factors that influence innovation capacity [11,16,17]. As a result of these, innovation capability was considered a critical factor in creating competitive advantage and improving organizational performance in a changing environment [18,19,20]. Therefore, research on the innovation capability of the Korean bio-companies and the determinants of innovation capability is essential for innovation in the Korean bio-industry.
The aim of this study is to find the competitive advantage factors that improve the innovation ability of the Korean bio-industry. Therefore, we aimed to find factors that increase the innovation capability of a company through literature research, and to find out how these factors affect the company’s performance by applying these factors to the Korean bio-industry. As an analysis method, a multiple regression analysis of SPSS 25 was performed to analyze how the six input factors have a complex effect on the output factor. The contribution of this study is to establish competitive advantage factors in the Korean bio-industry, analyze the current status of the Korean bio-industry, and characterize each bio-business. In addition, we analyzed the situation of the Korean bio-industry before the COVID-19 pandemic to arrange the foundation for comparative research on the situation that has changed since COVID-19. Finally, it is intended to increase the efficiency of the development of the Korean bio-industry and promote the sustainable growth of Korean bio-companies post-COVID-19.
2. Innovation Capacity
Innovation capacity is a company’s ability to create added value by applying collective knowledge, skills, and resources to innovation activities related to a new product, process, service or management, marketing, or business organization system compared to its competitors [21]. Furthermore, innovation capacity is a factor that requires continuous improvement [22], and it is the potential or ability to produce innovation, including the availability of resources, collaborative structures, and problem-solving processes [23]. In other words, innovation capability is critical for improving a company’s performance.
In the literature study, the innovation capacity was seen as an important resource for higher performance. Weber and Heidenreich [24] demonstrated that cooperation with vertical and horizontal partners significantly improves innovation capabilities and firm success. Keskin [25] concluded that innovation capability significantly improves a firm’s performance. Thus, the ability to innovate leads organizations to continuously develop innovations to respond to changing market conditions [26]. Innovation capabilities include all strategies, systems, and structures that support organizational change [27]. Innovation capability can be divided into three major factors: knowledge, organization, and human factors [28]. Specifically, innovation capability is related to determinants that influence an organization’s ability to manage innovation [29], such as participatory leadership, external knowledge, ideation and organizational structure, environment, development, regeneration, and individual activities [30]. However, different types of organizations may utilize different determinants when developing innovation capability [31]. Furthermore, innovation capability depends on firm specific contextual factors, such as size, industry, financial resources, and workforce [29]. In other words, the ability to innovate varies from company to company and is determined by many factors [32]. Therefore, the following research questions are raised.
RQ1.
What are the innovation capabilities that affect the performance of bio-companies?
RQ2.
How does the innovation capability of existing industries affect the business performance of the Korean bio-industry?
In addition, some prior research has indicated that an organizational culture with values oriented towards openness, a collaborative atmosphere, and trust can be more innovative [33]. Taherparvar et al. [34] found that external knowledge has a positive impact on both innovation speed and innovation quality, as well as operational and financial performances. In addition, they found that by using external knowledge flows, firms will be aware of the external environment and new changes in customers’ needs and so will be more innovative and perform better. Saenz and Perez-Bouvier [35] found that facilitating interactions with external agents had a positive and significant impact on both innovation network formation and operational performance; it turns out that these influences are much stronger when it comes to ensuring the smooth operation of the network than when facilitating the formation of the network. Collaborative culture and knowledge sharing have been identified as two potential factors that have a significant impact on innovation capacity and are recognized as sources of successful innovation [36,37]. Thus, open collaboration activities have become a key innovation strategy for most companies [38]. These open innovation strategies increase the possibility of knowledge complementation and can lead to productivity improvements and high-quality innovation [39,40]. Furthermore, it has been shown that increasing the level of relationships and collaboration improves existing processes and new product development capabilities [41]. However, bio-markets tend to close because they are traditionally a winner take all market. Therefore, the following research questions are raised.
RQ3.
Does collaboration have a positive effect on the performance of Korean bio-companies?
RQ4.
Does collaboration have a positive impact on all bio-industries?
3. Determinants of Innovation Capability
Companies continue to adopt innovation to keep pace with globalization, emphasizing the key role of innovation capabilities [42]. Innovation-oriented companies have better opportunities to succeed financially [43], and organizational innovations not only prepare a suitable environment for the other innovation types but also have a strong and direct impact on innovative performance [44]. An organization’s innovation capability has been seen as an important means of achieving a company’s competitive advantage and sustainable success [45,46]. Therefore, innovation capability has become a major research topic for researchers recently [47]. Innovation capability can be broadly divided into external and internal organizational factors. External perspective relates to aspects that can be adjusted in response to events outside the company, while internal perspective refers to factors that are the result of internal company activities, such as process and organizational innovation performance [48]. However, the conceptualization of innovation capability is very complex. Therefore, some researchers have called for measuring innovation capability as a multidimensional construct that reflects the overall firm’s innovation capability [47]. Chang et al. [49] focused on product, market, strategy, and process. Jones and de Zubielqui [50] focused on product, marketing, process, and organizations. Kafetzopoulos and Psomas [51] identified products, marketing, processes, and organizations as four dimensions.
Several studies for the main factor of innovation capability have approached the input and output perspective as the main measure of innovation capacity [52,53,54,55,56,57,58,59,60,61,62]. The main factors of input are R&D intensity, R&D spending, spending on new products, investment in machinery and external knowledge, and training costs and R&D manpower [52,53,54,55,56,57,58,59]. Technological intensity is defined as the level of knowledge incorporated in companies’ products in every industrial sector; this indicator is typically measured by dividing the average R&D spending by the firm’s revenue [63]. In addition, the main factors of output were classified into sales, labor productivity, the share of new products, patent applications, number of patents, etc. [52,60,61,62]. To investigate the relationship more clearly, we proposed following hypotheses.
H1.
From an investment point of view, R&D intensity and machinery investment have a positive effect on corporate performance and sales.
H2.
From a resource point of view, human resources and collaboration have a positive impact on corporate performance and sales.
H3.
The innovation capabilities of external cooperation and non-cooperation companies are defined by different competitive advantage factors.
H4.
The innovation capabilities of bio-companies according to the bio-industry classification are defined by different competitive advantage factors.
Based on the research hypotheses, the research model shown in Figure 1 was constructed.
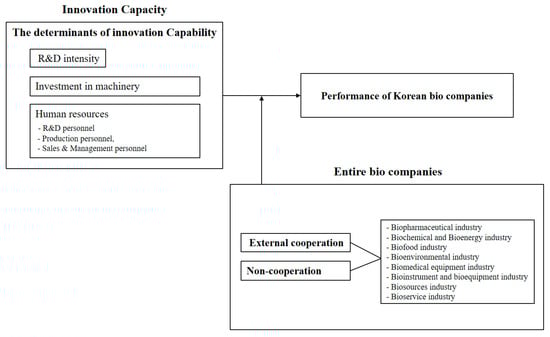
Figure 1.
Research Model.
4. Sample & Methods
4.1. Sample
In this study, in order to examine the major activities and performances of Korean bio-companies, the results of the ‘Korea Bio-industry Survey’ conducted by ‘The Korea Ministry of Trade, Industry & Energy’ and ‘Korea Bio Association’ from 2018 to 2020 were set as the objects of study. The survey year is from 2016 to 2018. The purpose of the ‘Bio-industry Survey’ is to prepare a plan for the development of the Korean bio-industry by identifying the current status of the Korean bio-industry and analyzing the actual conditions [64]. This survey was conducted by targeting bio-companies nationwide through a structured questionnaire, and survey methods were conducted via mail, fax, e-mail, telephone, and face-to-face interview by researchers [64]. The survey includes company information, income statement items, manpower status, major industries, investment costs, partnerships, etc. In addition, it was classified eight bio-industries based on the Korean bio-industry classification system (KS J 1009) [8]. During the research period, the ‘Bio-industry Survey’ conducted a survey of approximately 3000 companies engaged in bio-related activities in Korea based on the domestic bio-industry classification system. Companies surveyed included public enterprises, public-private partnerships, and private enterprises [59]. Thus, the ‘Bio-industry Survey’ conducted by administrative agencies provides reliable and appropriate data for empirical research at the corporate level. Through the ‘Bio-industry Survey’, 1973 company data was collected from a total of more than 3000 companies; 1293 companies were finally confirmed, excluding companies with missing values from the survey results. Additionally, in a total of 1293 bio-companies, external cooperation and non-cooperation companies were classified. There are 621 companies with external cooperation and 672 companies without external cooperation. Furthermore, 1293 bio-companies were classified based on the eight major Korean bio-industry classifications into bio-pharmaceutical industry (328 companies), bio-chemical and bio-energy industry (261), bio-food industry (264), bio-environmental industry (89), bio-medical equipment industry (138), bio-instrument and bio-equipment industry (60), bio-sources industry (27), and bio-service industry (126).
4.2. Research Design
The aim of this study is to find the competitive advantage factors that improve the innovation ability of the Korean bio-industry. Through a literature review, six major factors of innovation capability (R&D intensity, facility investment, R&D personnel, production personnel, sales and management personnel, and external cooperation) were input factors, and sales were set as the output.
The reason for devising this research design as that shown in Figure 2 is to investigate the effect of major factors of innovation capability derived from the literature review on the sales of bio-companies. In addition, it is for understanding the current status of the Korean bio-industry through an analysis of all bio-industry companies. Finally, by analyzing each of the eight bio-industry companies, the major factors affecting each bio-industry were identified.
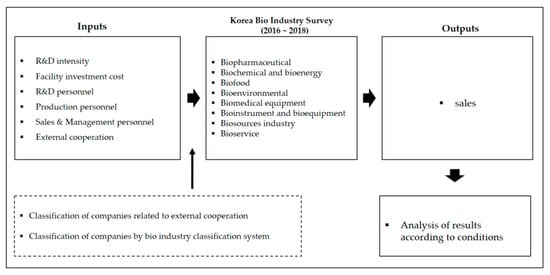
Figure 2.
Bio-industry analysis procedure.
4.3. Methodology
Prior to the main analysis, it is necessary to analyze the trend in the concentration of the collected data and the status of the domestic bio-industry. Additionally, it is necessary to analyze whether the variables are properly selected according to the correlation between the variables. Therefore, descriptive statistics and correlation analyses were performed. Innovation capability may not be a unitary set of attributes, and the attributes do not operate independently of each other but are interrelated [65]. Therefore, multiple regression analysis was performed for the main analysis of this study. Multiple regression analysis can identify major independent variables related to the dependent variable. In addition, in a situation where the influence of other variables is controlled, the degree of influence of an individual independent variable on the dependent variable can be identified. Therefore, this study, in order to analyze how the six input factors have a complex effect on the output factor, was performed through a multiple regression analysis of SPSS 25. The detailed analysis procedure is as follows.
First, 1293 companies were finally confirmed, excluding companies with missing values, from the survey results.
Second, in a total of 1293 bio-companies, external cooperation and non-cooperation companies were classified as 621 companies with external cooperation and 672 companies without external cooperation. Then, multiple regression analysis was performed by setting 6 factors derived from the literature review as independent variables and sales as the dependent variable.
Third, a total of 1293 bio-companies were classified based on the eight major Korean bio-industry classifications (bio-pharmaceutical industry, bio-chemical and bio-energy industry, bio-food industry, bio-environmental industry, bio-medical equipment industry, bio-instrument and bio-equipment industry, bio-sources industry, and bio-service industry). Multiple regression analysis was performed for each of the eight major bio-industries.
Fourth, according to Korea’s bio-industry classification system, a total of 1293 bio-companies were classified based on the eight major bio-industries; multiple regression analysis was performed for each of the eight major bio-industries.
5. Result
5.1. Descriptive Statistics and Correlation
Table 1 shows the descriptive statistics of the seven variables used in this study. As a result of analyzing the current status of the Korean bio-industry through descriptive statistics, it was found that there is a very large deviation in R&D, investment, human resources, collaboration, and sales factors. These results indicate that the deviation between SMEs and large enterprises is very large, and it can be seen that the innovation capacity of the Korean bio-industry is mainly led by large enterprises. Table 2 shows the correlation between the variables. Sales, a variable related to a company’s performance, has a significant correlation with facility investment cost, R&D personnel, production personnel, and sales management personnel, but no statistical significance with R&D intensity and external cooperation. However, R&D intensity has a significant positive correlation with R&D personnel, and external cooperation has a significant positive correlation with facility investment cost, R&D personnel, production personnel, and sales and management personnel.

Table 1.
Descriptive statistics.
Table 2.
Pearson correlation matrix.
5.2. Entire Bio-Companies Analysis Results
Table 3 shows the results of analyzing how independent variables affect corporate performance in all bio-companies through multiple regression analysis. As a result of the analysis, it was found that R&D intensity and facility investment cost had a negative effect on corporate performance. These results show that Korean bio-companies are still investing a lot compared to their performance. In addition, R&D personnel, production personnel, and sales and management personnel have a positive impact on corporate performance. However, no significant results were obtained in external cooperation.
Table 3.
Entire bio-companies analysis.
5.3. External Cooperation and Non-Cooperation Companies Analysis Results
Table 4 shows the analysis results of companies that are performing as an external cooperation through multiple regression analysis. In addition, external cooperation was analyzed in detail as joint ventures, joint R&D, technical alliances, and technical personnel exchanges. As a result of the analysis, it was found that R&D intensity and facility investment had a negative effect on corporate performance as in the analysis of all bio-companies. Furthermore, R&D personnel and production personnel had a positive effect on corporate performance. However, no significant results were obtained in sales and management personnel and external cooperation (joint venture, joint R&D, technical alliance, and technical personnel exchanges).
Table 4.
External cooperation companies analysis.
Table 5 shows the analysis results of non-cooperation companies through multiple regression analysis. As a result of the analysis, it was found that facility investment cost and sales and management personnel of non-cooperation companies had a positive effect on corporate performance. Furthermore, R&D personnel was found to have a negative effect on corporate performance. However, no significant results were obtained in R&D intensity and production personnel.
Table 5.
Non-cooperation analysis.
As a result of the analysis of external cooperation and non-cooperation bio-companies, it was found that R&D intensity, facility investment cost, R&D personnel, and production personnel affect the performance of external cooperation companies, and facility investment cost, R&D personnel, and sales and management personnel were found to affect the performance of non-cooperation companies. These results show that the factors affecting the management performance of external cooperation and non-cooperation companies are different.
5.4. Analysis Result of the Bio-Industry Classification
The major factors affecting the corporate performance of eight major industries according to the Korea Bio-industry Classification were analyzed. Table 6 shows the analysis results of the bio-pharmaceutical industry through multiple regression analysis. R&D personnel, production personnel, and sales and management personnel were found to have a positive effect on corporate performance. In addition, external cooperation was found to have a negative effect on corporate performance.
Table 6.
Bio-pharmaceutical industry.
Table 7 shows the analysis results of the bio-chemical and bio-energy industry through multiple regression analysis. R&D intensity was found to have a negative effect on corporate performance, and facility investment cost and sales and management personnel were found to have a positive effect on corporate performance.
Table 7.
Bio-chemical and bio-energy industry.
Table 8 shows the analysis results of the bio-food industry through multiple regression analysis. Facility investment cost and external cooperation were found to have a negative effect on corporate performance, and R&D personnel was found to have a positive effect on corporate performance.
Table 8.
Bio-food Industry.
Table 9 shows the analysis results of the bio-environmental industry through multiple regression analysis. R&D personnel was found to have a positive effect on corporate performance, and production personnel was found to have a negative effect on corporate performance.
Table 9.
Bio-environmental Industry.
Table 10 shows the analysis results of the bio-medical equipment through multiple regression analysis. Production personnel and sales and management personnel were found to have a positive effect on corporate performance, and external cooperation was found to have a negative impact on corporate performance.
Table 10.
Bio-medical equipment industry.
Table 11 shows the analysis results of the bio-instrument and bio-equipment industry through multiple regression analysis. R&D intensity was found to have a negative effect on corporate performance, and it was found that sales and management personnel had a positive effect on corporate performance.
Table 11.
Bio-instrument and bio-equipment industry.
Table 12 shows the analysis results of the bio-sources industry through multiple regression analysis. R&D intensity was found to have a negative effect on corporate performance, and facility investment cost, R&D personnel, and sales and management personnel were found to have a positive effect on corporate performance.
Table 12.
Bio-sources industry.
Table 13 shows the analysis results of the bio-service industry through multiple regression analysis. Facility investment cost was found to have a negative effect on corporate performance, and R&D personnel, production personnel, and sales and management personnel were found to have a positive effect on corporate performance.
Table 13.
Bio-service industry.
Factors affecting corporate performance were defined differently in eight bio-industries. Among these major factors, R&D intensity, facility investment cost, and external cooperation were found to have a negative impact on each bio-industry. When analyzing these causes, it can be said that the R&D intensity and facility investment cost factors were measured to be low compared to the investment because the government is continuously investing in the bio-industry in Korea. Additionally, although the Korean bio-industry is conducting external cooperation activities through joint ventures, joint R&D, technical alliance, and technical personnel exchanges, it can be said that it has not yet achieved results in external cooperation companies. Thus, it can be said that the Korean bio-industry is still in a period of growth. Therefore, it is necessary to make an effort to enter the maturity stage.
6. Discussion
The aim of this study is to find the competitive advantage factors that improve the innovation capability of the Korean bio-industry, and to research the current status and implications of the development of the Korean bio-industry. Accordingly, multiple regression analysis was conducted based on the results of the ‘Korea Bio-industry Survey’ from 2018 to 2020 to confirm the innovation capability of the Korean bio-industry. A total of 1293 bio-companies were classified into external and non-cooperative companies, and multiple regression analysis was performed by setting six factors derived from literature review as independent variables and sales as the dependent variable. In addition, multiple regression analysis was performed for each of the eight major bio-industries.
As a result of the analysis, it was found that R&D intensity, machine investment, and human resources factors affect the business performance of Korean bio-companies. Among these factors, R&D intensity and facility investment cost factors were found to have a negative effect on corporate performance. Thus, R&D intensity, machine investment, and human resource factors were derived as the result of RQ1 for innovation capabilities that affect the performance of Korean bio-companies. In previous studies, R&D intensity was recognized as one of the main factors of innovation capability [52,53,54,55,56,57,58], but in this study, it was found to be a factor that had a negative effect on business performance. Therefore, H1 was not supported. Human resources have been recognized as one of the important innovation factors [59,66,67,68]; in this study, R&D personnel, production personnel, and sales and management personnel were found to have a positive effect on business performance. Thus, H2 was supported. Therefore, as an answer to RQ2, it was concluded that the innovation capability of the Korean bio-industry is affecting business performance with different characteristics from existing industries.
In order to analyze the differences between external cooperation and non-cooperation companies, they were classified and analyzed. External cooperation did not show any significant results in the overall analysis of bio-companies in this study. On the other hand, previous studies have found that external cooperation has a positive effect on corporate performance [34,35,36,37,41], and it is a critical factor in innovation activities [25,54,69]. However, external cooperation did not show any significant results in the overall analysis of bio-companies in this study. Therefore, in response to RQ3 and RQ4, it was concluded that collaboration does not affect the business performance of domestic bio-companies. These results are determined to be due to the inclusion of data investigated after the outbreak of COVID-19 among the analyzed data. Therefore, if all investigations had been conducted before COVID-19, the element of ‘external collaboration’ could have been positively derived, as in previous studies. On the other hand, innovation capabilities that affect the performance of external cooperation companies were defined ‘R&D intensity’, ‘facility investment cost’, ‘R&D personnel’, and ‘production personnel’. Non-cooperation companies were defined ‘facility investment cost’, ‘R&D personnel’, and ‘sales and management personnel’. As a result of the analysis according to the classification of the Korean bio-industry, the innovation capacity that affects the performance of a company was defined differently by industry. Therefore, H3 and H4 were supported.
In order to find out the characteristics of each bio-industry in Korea, the analysis was conducted according to the classification of the Korean bio-industry.
First, in the bio-pharmaceutical industry, external cooperation and human resources were found to have a significant influence on corporate performance. Pharmaceutical companies typically use cooperation strategies to achieve many outcomes quickly and at low cost [70]. However, external cooperation was analyzed to have a negative effect on corporate performance in the bio-pharmaceutical industry in Korea. Additionally, in the bio-medical equipment industry, production personnel, sales and management personnel, and external cooperation were found to be the main factors affecting corporate performance. However, external cooperation factors in the medical device industry were also analyzed negatively.
Second, in the bio-chemical and bio-energy industry, R&D intensity, facility investment cost, and sales and management personnel were found to be major factors affecting corporate performance. In the bio-sources industry, R&D intensity, facility investment cost, R&D personnel, and sales and management personnel were found to be major factors affecting corporate performance. In the bio-instrument and bio-equipment industry, R&D intensity and sales and management personnel were found to be major factors affecting corporate performance. In these three bio-industries, human resource factors were found to be positive factors, but the R&D intensity was analyzed negatively on corporate performance.
Third, facility investment cost, external cooperation, and R&D personnel in the bio-food industry were analyzed as major factors affecting corporate performance. In the bio-service industry, Facility investment cost and Human resources factors were analyzed as major factors affecting corporate performance. However, in the bio-food industry, facility investment cost and external cooperation factors were found to have a negative impact on corporate performance, and in the bio-service industry, facility investment cost was found to be a negative factor on corporate performance.
Fourth, in the bio-environmental Industry, R&D personnel and production personnel were analyzed as major factors affecting corporate performance. However, production personnel was found to have a negative impact on corporate performance.
Table 14 shows the major factors influencing the business performance of bio-industries. Through these results, it is possible to identify the factors that affect the performance of companies in the Korean bio-industry.
Table 14.
Major factors of bio-industries.
7. Conclusions
The purpose of this study is to find the competitive advantage factors that improve the innovation capability of the Korean bio-industry. Therefore, we analyzed how the major factors that enhance innovation capabilities affect the performance of Korean bio-industry companies.
Through the analysis results, R&D intensity, machine investment, and human resources factors were derived as competitive advantage factors that can improve the innovation capabilities of Korean bio-companies. However, factors affecting innovation capacity by bio-industry were defined differently.
In the bio-pharmaceutical industry, all human resource factors were analyzed as a positive factor for corporate performance, but the external cooperation factor was analyzed as a negative factor. In the bio-medical equipment industry, production and sales and management personnel of human resource factors were analyzed as a positive factor for corporate performance, but the external cooperation factor was analyzed as a negative factor. It is analyzed that the reason for these results is that external cooperation activities are being carried out, but no results have been obtained. Therefore, the Korean bio-pharmaceutical industry and bio-medical device industry companies must develop sustainable human resource factors, and achieve results through analysis and utilization of innovative strategies that can increase the efficiency of external cooperation.
In the bio-chemical and bio-energy industry, R&D intensity factor was analyzed as negative factor for corporate performance, and facility investment cost and sales and management personnel factors were analyzed as a positive factor. In the bio-sources industry, the R&D intensity factor was analyzed as negative factor for corporate performance, and R&D personnel, sales and management personnel, and facility investment cost factors were analyzed as positive factors. In the bio-instrument and bio-equipment industry, the R&D intensity factor was analyzed as negative factor for corporate performance, and the sales and management personnel factor was analyzed as a positive factor. The result of R&D intensity as a negative factor can be attributed to the high R&D investment but low performance. Therefore, companies in the bio-chemical and bio-energy industry, bi-sources industry, and bio-instrument and bio-equipment industry should develop sustainable human resource factors and focus on activities that can increase ROI (Return On Investment) in R&D. In the bio-chemical and bio-energy industry and the bio-sources industry it is also necessary to manage the elements of the facility.
In the bio-food industry, facility investment cost, and external cooperation factors were analyzed as negative factor for corporate performance, and R&D personnel was analyzed as a positive factor. In the bio-service industry, facility investment cost factor was analyzed as negative factor for corporate performance, and all human resource factors were analyzed as a positive factor. These results showed that the bio-food industry and bio-service industry companies are investing in a lot in facilities, but performance and efficiency are low. Therefore, the bio-food industry and bio-service industry companies need the sustainable development of human resources, and activities to increase machine utilization and efficiency. Furthermore, companies in the bio-food industry need a strategy to increase the performance of external cooperation companies. In the bio-environmental industry, production personnel factor was analyzed as a negative factor for corporate performance, and R&D personnel was analyzed as a positive factor. These results can be said that companies in the bio-environmental industry have low utilization of production personnel. Therefore, companies in the bio-environmental industry need innovation through efforts to increase the utilization of human resources.
A comprehensive analysis of the results showed that the Korean bio-industry is currently in a period of growth in which external cooperation and non-cooperation companies are making huge investments in external cooperation companies. Therefore, in order for the bio-sector to mature, Korean bio-enterprises must innovate with a strategic approach that can boost the efficiency of internal and external investments. Additionally, it is very necessary for Korean bio-companies to develop sustainable human resource factors, maximize R&D investment efficiency, and establish and promote innovative strategies that can produce results through various external cooperation companies, such as open innovation.
This study contributes the following. First, factors of competitive advantage that increase the innovation capacity of the Korean bio-industry were established. Second, the present status and implications of the development of the Korean bio-industry are presented. Third, the characteristics of each bio-industry according to Korea’s industrial classification were identified, and the current status and implications of each bio-industry were presented. Fourth, by analyzing the situation of the Korean bio-industry before the COVID-19 pandemic, the foundation for comparative research on the changed environment after COVID-19 was established. On the other hand, this research has the following limitations. This study analyzed data from pre-COVID-19 surveys. Therefore, a comparative study with data after COVID-19 is needed. In addition, there is a limit to explaining all bio-industries with six independent variables and one dependent variable. Therefore, it is necessary to conduct additional multifaceted studies by expanding variables in the future.
Author Contributions
J.H.Y. and S.-h.J. designed and analyzed the research; J.H.Y. and S.-h.J. discussed the results. All authors have read and agreed to the published version of the manuscript.
Funding
This research received no external funding.
Institutional Review Board Statement
Not applicable.
Informed Consent Statement
Not applicable.
Data Availability Statement
The analyzed datasets during this study are available from the corresponding author upon reasonable request.
Conflicts of Interest
The authors declare no conflict of interest.
References
- Staffas, L.; Gustavsson, M.; McCormick, K. Strategies and policies for the bioeconomy and bio-based economy: An analysis of official national approaches. Sustainability 2013, 5, 2751–2769. [Google Scholar] [CrossRef]
- Liobikiene, G.; Balezentis, T.; Streimikiene, D.; Chen, X. Evaluation of bioeconomy in the context of strong sustainability. Sustain. Dev. 2019, 27, 955–964. [Google Scholar] [CrossRef]
- Cristóbal, J.; Matos, C.T.; Aurambout, J.-P.; Manfredi, S.; Kavalov, B. Environmental sustainability assessment of bioeconomy value chains. Biomass Bioenergy 2016, 89, 159–171. [Google Scholar] [CrossRef]
- Dietz, T.; Börner, J.; Förster, J.J.; von Braun, J. Governance of the bioeconomy: A global comparative study of national bioeconomy strategies. Sustainability 2018, 10, 3190. [Google Scholar] [CrossRef]
- Ingrao, C.; Bacenetti, J.; Bezama, A.; Blok, V.; Goglio, P.; Koukios, E.G.; Linder, M.; Nemecek, T.; Siracusa, V.; Zabaniotou, A.; et al. The potential roles of bio-economy in the transition to equitable, sustainable, post fossil-carbon societies: Findings from this virtual special issue. J. Clean. Prod. 2018, 204, 471–488. [Google Scholar] [CrossRef]
- Ramcilovic-Suominen, S.; Pülzl, H. Sustainable development—A ‘selling point’of the emerging EU bioeconomy policy framework? J. Clean. Prod. 2018, 172, 4170–4180. [Google Scholar] [CrossRef]
- Sasson, A.; Malpica, C. Bioeconomy in Latin America. New Biotechnol. 2018, 40, 40–45. [Google Scholar] [CrossRef] [PubMed]
- Bioindustry Classification Code, Korean Agency for Technology and Standards. Available online: https://standard.go.kr/KSCI/portalindex.do (accessed on 20 July 2022).
- Korea Ministry of Trade, Industry and Energy (Bio Health Industry). Available online: http://www.motie.go.kr/motie/ne/presse/press2/bbs/bbsView.do?bbs_cd_n=81&bbs_seq_n=163527 (accessed on 14 July 2022).
- Kim, S.K. 20 Years of Korean biotech venture: Past, present and challenges for future. Policy Res. 2013, 13, 43–44. [Google Scholar]
- Sulistyo, H.; Siyamtinah. Innovation capability of SMEs through entrepreneurship, marketing capability, relational capital and empowerment. Asia Pac. Manag. Rev. 2016, 21, 196–203. [Google Scholar] [CrossRef]
- Yuliansyah, Y.; Rammal, H.G.; Maryani, M.; Mohamed Jais, I.R.; Mohd-Sanusi, Z. Organizational learning, innovativeness and performance of financial service firms in an emerging market: Examining the mediation effects of customer-focused strategy. Bus. Process Manag. J. 2021, 27, 1126–1141. [Google Scholar] [CrossRef]
- Yang, Y.; Shafi, M. How does customer and supplier cooperation in micro-enterprises affect innovation? Evidence from Pakistani handicraft micro-enterprises. Asian Bus. Manag. 2020, 19, 530–559. [Google Scholar] [CrossRef]
- Wu, X.; Sivalogathasan, V. Intellectual capital for innovation capability: A conceptual model for innovation. Int. J. Trade Econ. Financ. 2013, 4, 139–144. [Google Scholar] [CrossRef]
- Sulistyo, H.; Ayuni, S. Competitive advantages of SMEs: The roles of innovation capability, entrepreneurial orientation, and social capital. Contaduría Adm. 2020, 65, 10. [Google Scholar] [CrossRef]
- Sáenz, J.; Pérez-Bouvier, A. Knowledge Sharing, Innovation Networks, and Innovation Capability: The Case of Uruguayan Software Firms. Eur. Conf. Innov. Entrep. 2013, 2, 564–572. [Google Scholar]
- Liu, X.; Huang, Q.; Dou, J.; Zhao, X. The impact of informal social interaction on innovation capability in the context of buyer-supplier dyads. J. Bus. Res. 2015, 78, 314–322. [Google Scholar] [CrossRef]
- Tamayo-Torres, I.; Gutiérrez-Gutiérrez, L.J.; Llorens-Montes, F.J.; Martínez-Lopez, F.J. Organizational learning and innovation as sources of strategic fit. Ind. Manag. Data Syst. 2016, 116, 1445–1467. [Google Scholar] [CrossRef]
- Gomes, G.; Wojahn, R.M. Organizational learning capability, innovation and performance: Study in small and medium-sized enterprises (SMES). Rev. Adm. 2017, 52, 163–175. [Google Scholar] [CrossRef]
- Chen, M.; Yang, Z.; Dou, W.; Wang, F. Flying or dying? Organizational change, customer participation, and innovation ambidexterity in emerging economies. Asia Pac. J. Manag. 2018, 35, 97–119. [Google Scholar] [CrossRef]
- Hogan, S.J.; Soutar, G.N.; McColl-Kennedy, J.R.; Sweeney, J.C. Reconceptualizing professional service firm innovation capability: Scale development. Ind. Mark. Manag. 2011, 40, 1264–1273. [Google Scholar] [CrossRef]
- Olsson, A.; Wadell, C.; Odenrick, P.; Bergendahl, M.N. An action learning method for increased innovation capability in organizations. Action Learn. Res. Pract. 2010, 7, 167–179. [Google Scholar] [CrossRef]
- Laforet, S. A framework of organisational innovation and outcomes in SMEs. Int. J. Entrep. Behav. Res. 2011, 17, 380–408. [Google Scholar] [CrossRef]
- Weber, B.; Heidenreich, S. When and with whom to cooperate? Investigating effects of cooperation stage and type on innovation capabilities and success. Long Range Plan. 2018, 51, 334–350. [Google Scholar] [CrossRef]
- Keskin, H. Market orientation, learning orientation, and innovation capabilities in SMEs: An extended model. Eur. J. Innov. Manag. 2006, 9, 396–417. [Google Scholar] [CrossRef]
- Slater, S.F.; Hult, G.T.M.; Olson, E.M. Factors influencing the relative importance of marketing strategy creativity and marketing strategy implementation effectiveness. Ind. Mark. Manag. 2010, 39, 551–559. [Google Scholar] [CrossRef]
- Gloet, M.; Samson, D. Knowledge management and systematic innovation capability. Int. J. Knowl. Manag. (IJKM) 2016, 12, 54–72. [Google Scholar] [CrossRef]
- Martínez-Roman, J.A.; Gamero, J.; Tamayo, J.A. Analysis of innovation in SMEs using an innovative capability-based non-linear model: A study in the province of Seville (Spain). Technovation 2011, 31, 459–475. [Google Scholar] [CrossRef]
- Saunila, M. Performance measurement approach for innovation capability in SMEs. Int. J. Product. Perform. Manag. 2016, 65, 162–176. [Google Scholar] [CrossRef]
- Saunila, M.; Ukko, J. Facilitating innovation capability through performance measurement: A study of Finnish SMEs. Manag. Res. Rev. 2013, 36, 991–1010. [Google Scholar] [CrossRef]
- Saunila, M.; Ukko, J. Intangible aspects of innovation capability in SMEs: Impacts of size and industry. J. Eng. Technol. Manag. 2014, 33, 32–46. [Google Scholar] [CrossRef]
- Silva, M.J.M.; Simões, J.; Moreira, J.; Sousa, G. Investment and expenditure on innovation activities and innovative capability: Empirical evidence from Portuguese services firms and KIBS. Int. Bus. Res. 2012, 5, 114–122. [Google Scholar] [CrossRef][Green Version]
- Donate, M.J.; Guadamillas, F. Organizational factors to support knowledge management and innovation. J. Knowl. Manag. 2011, 15, 890–914. [Google Scholar] [CrossRef]
- Taherparvar, N.; Esmaeilpour, R.; Dostar, M. Customer knowledge management, innovation capability and business performance: A case study of the banking industry. J. Knowl. Manag. 2014, 18, 591–610. [Google Scholar] [CrossRef]
- Saenz, J.; Perez-Bouvier, A. Interaction with external agents, innovation networks, and innovation capability: The case of Uruguayan software firms. J. Knowl. Manag. 2014, 18, 447–468. [Google Scholar] [CrossRef]
- Barczak, G.; Lassk, F.; Mulki, J. Antecedents of team creativity: An examination of team emotional intelligence, team trust and collaborative culture. Creat. Innov. Manag. 2010, 19, 332–345. [Google Scholar] [CrossRef]
- Kucharska, W.; Kowalczyk, R. Trust, collaborative culture and tacit knowledge sharing in project management—A relationship model. In Proceedings of the 13th International Conference on Intellectual Capital, Knowledge Management & Organisational Learning: ICICKM 2016, Ithaca, NY, USA, 14–15 October 2016; pp. 159–166. [Google Scholar]
- Kobarg, S.; Stumpf-Wollersheim, J.; Welpe, I.M. More is not always better: Effects of collaboration breadth and depth on radical and incremental innovation performance at the project level. Res. Policy 2019, 48, 1–10. [Google Scholar] [CrossRef]
- Hall, B.H.; Lotti, F.; Mairesse, J. Evidence on the impact of R&D and ICT investments on innovation and productivity in Italian firms. Econ. Innov. New Technol. 2013, 22, 300–328. [Google Scholar]
- Audretsch, D.B.; Belitski, M. The role of R&D and knowledge spillovers in innovation and productivity. Eur. Econ. Rev. 2020, 123, 103391. [Google Scholar]
- Kumar, G.; Banerjee, R.N.; Meena, P.L.; Ganguly, K. Collaborative culture and relationship strength roles in collaborative relationships: A supply chain perspective. J. Bus. Ind. Mark. 2016, 31, 587–599. [Google Scholar] [CrossRef]
- Shafi, M. Sustainable development of micro firms: Examining the effects of cooperation on handicraft firm’s performance through innovation capability. Int. J. Emerg. Mark. 2020, 16, 1634–1653. [Google Scholar] [CrossRef]
- Saunila, M. Innovation capability for SME success: Perspectives of financial and operational performance. J. Adv. Manag. Res. 2014, 11, 163–175. [Google Scholar] [CrossRef]
- Gunday, G.; Ulusoy, G.; Kilic, K.; Alpkan, L. Effects of innovation types on firm performance. Int. J. Prod. Econ. 2011, 133, 662–676. [Google Scholar] [CrossRef]
- Colino, A.; Benito-Osorio, D.; Armengot, C.R. How much does innovation matter for economic growth? Manag. Decis. 2014, 52, 313–325. [Google Scholar] [CrossRef]
- Liao, S.H.; Chen, C.C.; Hu, D.C.; Chung, Y.C.; Liu, C.L. Assessing the influence of leadership style, organizational learning and organizational innovation. Leadersh. Organ. Dev. J. 2017, 38, 590–609. [Google Scholar] [CrossRef]
- Samson, D.; Gloet, M.; Singh, P. Systematic innovation capability: Evidence from case studies and a large survey. Int. J. Innov. Manag. 2017, 21, 1750058. [Google Scholar] [CrossRef]
- Mendoza-Silva, A. Innovation capability: A systematic literature review. Eur. J. Innov. Manag. 2020, 24, 707–734. [Google Scholar] [CrossRef]
- Chang, W.J.; Liao, S.H.; Wu, T.T. Relationships among organizational culture, knowledge sharing, and innovation capability: A case of the automobile industry in Taiwan. Knowl. Manag. Res. Pract. 2017, 15, 471–490. [Google Scholar] [CrossRef]
- Jones, J.; de Zubielqui, G.C. Doing well by doing good: A study of university-industry interactions, innovationess and firm performance in sustainability-oriented Australian SMEs. Technol. Forecast. Soc. Chang. 2017, 123, 262–270. [Google Scholar] [CrossRef]
- Kafetzopoulos, D.; Psomas, E. The impact of innovation capability on the performance of manufacturing companies: The Greek case. J. Manuf. Technol. Manag. 2015, 26, 104–130. [Google Scholar] [CrossRef]
- Hong, Y.; Niu, D.; Xiao, B.; Wu, L. Comprehensive evaluation of the technology innovation capability of China’s high-tech industries based on fuzzy borda combination method. Int. J. Innov. Sci. 2015, 7, 215–230. [Google Scholar] [CrossRef]
- Xu, J.; Sim, J.W. Characteristics of corporate R&D investment in emerging markets: Evidence from manufacturing industry in China and South Korea. Sustainability 2018, 10, 3002. [Google Scholar]
- Nivoix, S.; Nguyen, P. Characteristics of R&D Expenditures in Japan’s Pharmaceutical Industry. Asia Pac. Bus. Rev. 2012, 18, 225–240. [Google Scholar]
- Forsman, H. Innovation capacity and innovation development in small enterprises. A comparison between the manufacturing and service sectors. Res. Policy 2011, 40, 739–750. [Google Scholar] [CrossRef]
- Rasiah, R.; Shahrivar, R.B.; Yap, X.S. Institutional support, innovation capabilities and exports: Evidence from the semiconductor industry in Taiwan. Technol. Forecast. Soc. Chang. 2016, 109, 69–75. [Google Scholar] [CrossRef]
- Yam, R.C.; Lo, W.; Tang, E.P.; Lau, A.K. Analysis of sources of innovation, technological innovation capabilities, and performance: An empirical study of Hong Kong manufacturing industries. Res. Policy 2011, 40, 391–402. [Google Scholar] [CrossRef]
- Liao, S.H.; Fei, W.C.; Chen, C.C. Knowledge sharing, absorptive capacity, and innovation capability: An empirical study of Taiwan’s knowledge-intensive industries. J. Inf. Sci. 2007, 33, 340–359. [Google Scholar] [CrossRef]
- Sher, P.J.; Yang, P.Y. The effects of innovative capabilities and R&D clustering on firm performance: The evidence of Taiwan’s semiconductor industry. Technovation 2005, 25, 33–43. [Google Scholar]
- Delgado, V.M.; Martín de Castro, G.; Navas, L.J. Organizational knowledge assets and innovation capability: Evidence from Spanish manufacturing firms. J. Intellect. Cap. 2011, 12, 5–19. [Google Scholar] [CrossRef]
- Bellamy, M.A.; Ghosh, S.; Hora, M. The influence of supply network structure on firm innovation. J. Oper. Manag. 2014, 32, 357–373. [Google Scholar] [CrossRef]
- Nilsson, S.; Ritzén, S. Exploring the use of innovation performance measurement to build innovation capability in a medical device company. Creat. Innov. Manag. 2014, 23, 183–198. [Google Scholar] [CrossRef]
- Zawislak, P.A.; Fracasso, E.M.; Tello-Gamarra, J. Technological intensity and innovation capability in industrial firms. Innov. Manag. Rev. 2018, 15, 189–207. [Google Scholar] [CrossRef]
- Korea Ministry of Trade, Industry and Energy. Available online: http://www.motie.go.kr/motie/ne/Notice/bbs/bbsView.do?bbs_cd_n=83&bbs_seq_n=4475006 (accessed on 2 August 2022).
- Kallio, A.; Kujansivu, P.; Parjanen, S. Locating the weak points of innovation capability before launching a development project. Interdiscip. J. Inf. Knowl. Manag. 2012, 7, 21–38. [Google Scholar] [CrossRef] [PubMed]
- Lin, H.F. Knowledge sharing and firm innovation capability: An empirical study. Int. J. Manpow. 2007, 28, 315–332. [Google Scholar] [CrossRef]
- Podrug, N.; Filipović, D.; Kovač, M. Knowledge sharing and firm innovation capability in Croatian ICT companies. Int. J. Manpow. 2017, 38, 632–644. [Google Scholar] [CrossRef]
- Yeşil, S.; Büyükbeşe, T.; Koska, A. Exploring the link between knowledge sharing enablers, innovation capability and innovation performance. Int. J. Innov. Manag. 2013, 17, 1350018. [Google Scholar] [CrossRef]
- Liu, S. Determinants of service innovative dimensions in knowledge intensive business services: Evidence from PR China. Int. J. Technol. Manag. 2009, 48, 95–114. [Google Scholar] [CrossRef]
- Schilling, M.A.; Shankar, R. Strategic Management of Technological Innovation, 6th ed.; McGraw-Hill Education: New York, NY, USA, 2019. [Google Scholar]


Disclaimer/Publisher’s Note: The statements, opinions and data contained in all publications are solely those of the individual author(s) and contributor(s) and not of MDPI and/or the editor(s). MDPI and/or the editor(s) disclaim responsibility for any injury to people or property resulting from any ideas, methods, instructions or products referred to in the content. |
© 2023 by the authors. Licensee MDPI, Basel, Switzerland. This article is an open access article distributed under the terms and conditions of the Creative Commons Attribution (CC BY) license (https://creativecommons.org/licenses/by/4.0/).