Article

Carbon Fixation and Soil Aggregation Affected by Biochar Oxidized with Hydrogen Peroxide: Considering the Efficiency of Pyrolysis Temperature

by
Mohammad Ghorbani
1,*,
Reinhard W. Neugschwandtner
2,
Gerhard Soja
3,4,
Petr Konvalina
1 and
Marek Kopecký
1
1
Department of Agroecosystems, Faculty of Agriculture and Technology, University of South Bohemia in Ceske Budejovice, Branišovská 1645/31A, 370 05 České Budějovice, Czech Republic
2
Institute of Agronomy, Department of Crop Sciences, University of Natural Resources and Life Sciences Vienna, Konrad-Lorenz-Straße 24, 3430 Tulln, Austria
3
Institute for Chemical and Energy Engineering, University of Natural Resources and Life Sciences, Muthgasse 107/I, 1190 Vienna, Austria
4
AIT Austrian Institute of Technology, Konrad-Lorenz-Straße 24, 3430 Tulln, Austria
*
Author to whom correspondence should be addressed.
Sustainability 2023, 15(9), 7158; https://doi.org/10.3390/su15097158
Submission received: 13 March 2023 / Revised: 19 April 2023 / Accepted: 24 April 2023 / Published: 25 April 2023

Abstract

:
Biochar, as a carbon-rich material, may have a notable influence on carbon balance, especially that in soil mediums. The oxidation of biochar modifies the biochar’s effects on the soil’s carbon dynamics. To evaluate the alteration in soil carbon storage, biochars derived from wheat straw (WS) and wood residues (WR) produced at 350, 450, and 550 °C (marked BWS350, BWS450, BWS550, BWR350, BWR450, and BWR550) were oxidized with hydrogen peroxide (H2O2) and applied on a loamy soil (2% d.m.) for a 180-day greenhouse incubation period. The highest organic carbon (OC) concentration and carbon pool index (CPI) were obtained from the oxidized BWS550, with 154% and 70% increases, respectively, compared to the unamended control. For both the WS and WR biochars, applying oxidation significantly improved the soil’s aggregation indices, i.e., the mean weight diameter (MWD), water stable aggregates (WSA), and fractal dimension (D). BWS350, BWS450, and BWS550 showed significantly higher WSAs, with percentages of 68, 74, and 76% compared to the control (41%). The fractal dimensions decreased with an increasing pyrolysis temperature in both the biochar types. All the biochar treatments significantly decreased the soil bulk density (BD), while for both the pristine and oxidized biochars, the lowest BD was related to the biochars produced at high temperatures. The structural qualities of the biochars were enhanced by oxidation, particularly their specific surface areas and porosities, and this had a substantial impact on the soil structure and carbon status. The wheat straw biochar was more effective than the wood residue biochar and a higher pyrolysis temperature was more effective than lower ones for supporting the enhancement of the soil carbon pool.

1. Introduction

A healthy environment requires full soil functionalities and a beneficial organic carbon (OC) status in the soil [1]. An alteration in the physical, chemical, and biological properties of the soil could cause notable changes in the soil’s C sequestration, C cycling, CO2 emission into the atmosphere, and consequently climate change conditions [2,3]. There are many natural and anthropogenic factors that can affect soil carbon storage and eventually disrupt the Earth’s carbon cycle, including soil erosion, pH shifts, heavy metal pollution, excessive fertilization, and soil mismanagement [4,5,6]. The linking of intricate human nature processes related to soil conservation requires interdisciplinary research. Meanwhile, the current understanding of soil dynamics is divided across a multitude of fields and lacks integrated perspectives on the appropriate management of soil resources [7]. Therefore, the use of proper soil C management methods to maintain stable organic C levels in the soil and reduce CO2 emissions, in order to create a carbon balance, has always been of special interest to researchers.
Globally, the sum of organic and inorganic carbon up to a depth of 1 m of the soil is about 2500 petagram, two thirds of which is organic carbon (OC) [8]. Therefore, the C balance and soil quality evaluation depend greatly on the amount of OC, which is the major portion of the soil carbon pool [9]. Additionally, soil OC is divided into two categories: (1) labile OC, which has a residence time of less than a hundred years, and (2) recalcitrant OC, which is not decomposed for hundreds or thousands of years [10]. An adequate amount of OC must be kept in the soil in order to secure the soil’s fertility. Therefore, numerous optimization techniques, such as the incorporation of agricultural residues, green soil cover, crop rotation, minimum soil tillage, and organic fertilization, have been suggested.
Biochar, as a by-product of biomass carbonization, has received special attention due to its ability to fix carbon in soil for thousands of years [11]. Due to its inherent physical and chemical properties, including its specific surface area and the variety of functional groups within its structure, biochar is able to effectively increase soil fertility [12], conserve water resources [13], sequester carbon [14], immobilize heavy metals [15], increase plant productivity [16], and reduce the greenhouse gas emissions from the soil [17]. The effect of biochar on carbon sequestration is considered to be a key factor in improving soil fertility. Although their mechanisms are not completely understood, the fundamental changes in the physical and chemical structure of biochars, such as the functional groups present on the surface of these biochars, are among the reasons discussed [18]. On the other hand, changes in the carbonization conditions, such as the pyrolysis temperature and type of feedstock, cause variable intrinsic properties in biochars [19]. Additionally, the carbon in biochars is resistant to biological decomposition, making biochars an effective carbon sink. Therefore, adding biochar production as a negative carbon emission technology is an effective contribution to reducing greenhouse gas emissions [20]. It has been shown that the stabilization of OC by biochars in the long term has caused a decrease in soil CO2 emissions via negative priming [21]. The trapping of organic materials and the formation of organo-mineral bridges between these materials and the soil’s mineral particles, leading to soil aggregation, is one of the reasons for the stabilization of OC in biochar-treated soils [22]. On the other hand, soils treated with biochars provide a suitable environment for biological activities in the soil, which is the basis for the decomposition of labile organic carbon, improving the soil structure and ultimately the soil fertility [23].
Biochar oxidation, as a new technique, aims to change the intrinsic properties of biochars in order to strengthen their effectiveness in the environment [24]. The adsorption properties of biochars after oxidation can be significantly increased, which can be very important from the aspect of immobilizing the soil and water pollutants [25]. An increase in the specific surface area of a biochar, the diversity of the oxygen functional groups on the surface of a biochar, and an increase in the cation exchange capacity are assumed to be the reasons involved [26]. However, a decrease in the specific surface area of biochar oxidized with FeCl3, as a result of the pore blocking of the biochar via Fe3+, has also been reported [27]. Different oxidizing agents and processes can be used for this biochar oxidation. According to our previous meta-analysis study resulting from 64 studies, acidic agents have a significant effect on biochar properties (such as oxygen functional groups and specific surface area, etc.) when compared to most oxidative agents, i.e., alkaline, metal oxides, or water vapor [28]. The development of carboxyl groups on the surface of biochars as a result of acidic oxidation increases the specific surface area by forming bonds with free soil cations [29]. Cu2+ and Cd are immobilized by the development of carboxylic groups on the surface of an oxidized biochar treated with HNO3 and HCl [26,30]. Some studies have reported that H2O2-modified biochar will also boost the specific surface area, oxygen-containing functional groups, and sorption capacity of biochar [31,32].
Despite the studies conducted on the effect of oxidation on biochar properties, many aspects of this modification technique remain unexplored. On the other hand, there are conflicting results regarding a wide range of oxidizing agents, oxidation methods, and even types of biochars. Most studies conducted on biochar oxidation have investigated the ability to absorb pollutants and heavy elements in soil and water environments [26,30,31]. Meanwhile, the effect of an oxidized biochar on the many properties of soil, as well as the mechanisms of this effect, are still unclear. The carbon status of the soil, considering its importance in physical, chemical, and biological functions, and finally, the quality of the soil, can be significantly affected by structural changes in the properties of the biochar after oxidation. Therefore, the main aim of this study was to understand the effect of pyrolyzed biochars oxidized with hydrogen peroxide at three different temperatures on soil carbon status in a 180-day incubation period. Our hypothesis was that modifying the biochar may possibly cause changes in the soil’s physical characteristics, which would then affect the soil’s carbon status. For this purpose, several soil analyses, such as analyses on the soil organic carbon, carbon pool index (CPI), bulk density, soil aggregation, and fractal dimension of the soil aggregates, were evaluated at the end of the period. Additionally, the intrinsic properties of the oxidized and non-oxidized biochars were analyzed to interpret the changes in the treatments.

2. Materials and Methods

2.1. Experimental Design

A greenhouse experiment was conducted to investigate the effect of pristine and oxidized biochars on soil carbon status in the Department of Agroecosystems, University of South Bohemia in České Budějovice, Czechia. The soil sample was collected from the experimental arable site of the University’s Faculty of Agriculture and Technology (48°58′31.0″ N 14°26′50.3″ E), which has a loam texture (sand: 44.8%, silt: 24.1%, and clay: 31.1%) and a pH of 6.82. The used soil had a total nitrogen content of 3.12%. Additionally, the available potassium and phosphorous in the used soil were 2.26 and 4.68 mg kg−1, respectively. The soil was collected from 0–20 cm depth at the site in September 2022. After passing the soil through a 5 mm sieve, it was ready for mixing with treatments, filling in one kg pots, and the 180-day incubation period.

2.2. Treatments Preparation

Biochars with different characteristics were used as the study treatments. First of all, wheat straw (WS) and wood residues (WR) were selected as our feedstocks for the biochar production. Each biomass was pyrolyzed using an electric muffle furnace (Nabertherm Medlin, Germany) at three temperatures (350, 450, and 550 °C), all with a heating rate of 10 °C min−1, a 2 h residence time, and nitrogen used as the flush gas. Therefore, in the end, this resulted in six biochars, as follows: BWS350, BWS450, BWS550, BWR350, BWR450, and BWR550. To remove impurities, all six biochar samples were rinsed two times with deionized water and dried at 105 °C in an oven for 24 h. The dried samples were then ground and sieved into a uniform size fraction of 0.5–1.0 mm. Then, each biochar sample was divided into two portions: (1) the first portion was stored as a pristine biochar, and (2) the second one was kept for the application of the H2O2 oxidation to achieve the oxidized biochars.
To obtain the oxidized biochars, about 10 g of the final biochar sample was exposed to 50 mL of a 10% H2O2 solution (purchased from Penta Chemical) in a 100 mL glass beaker and was stirred for 2 h at a constant temperature of 70 °C. Each sample was filtered through Whatman filter paper No. 42 and rinsed with deionized water to remove any residual H2O2 [33]. The samples were then dried in an oven at 105 °C for 24 h. Therefore, the obtained oxidized biochars were labeled as follows: O-BWS350, O-BWS450, O-BWS550, O-BWR350, O-BWR450, and O-BWR550.
To prepare the treatments, 1 kg of the soil was mixed well with a 2% dry weight of each of the biochars (20 g) in the pots. All the samples were mixed in the same way and at the same time. Additionally, a treatment without any type of biochar was considered as a control. All the treatments were prepared in triplicate. The environmental temperature was kept at 25 °C and the soil moisture was kept at field capacity plus 30%, with regular weighing every week. After a six-month incubation period, the soil samples were collected for a laboratory analysis.

2.3. Biochar Characterization

The chemical analyses of the 12 used biochars are shown in Table 1. The pH of the biochars was determined using a 1:10 (w/v) biochar-to-water ratio. An elemental analyzer was used to detect the total carbon, hydrogen, and nitrogen (TruSpec Micro CHN, Leco, St. Joseph, MI, USA). The ammonium acetate technique was used to determine the CEC and exchangeable cations. The Brunner, Emmett, and Teller (BET) method was used to calculate the specific surface area of the biochars. The biochar bulk density and porosity were measured via mercury porosimetry (AutoPore IV 9500 M, Micromeritics, Norcross, GA, USA). An SEM scanning electron microscope (HITACHI, Tokyo, Japan, TM3030) was used to visualize the structure of the biochars. Before imaging, a steady layer of platinum coating was applied to the surface of the samples using a vacuum coater (LEICA, Wetzlar, Germany, EM ACE200), with the purpose of obtaining high-resolution images of the biochar structures using the SEM.

2.4. Soil Carbon Pool Analysis

A Primacs SLC Analyzer (SKALAR, Netherlands) was used for determining the soil carbon status, including the total carbon (TC), total organic carbon (TOC), and total inorganic carbon (TIC).
The carbon pool index was calculated as follows [34]:
Carbon   pool   index   ( CPI ) = SOC b SOC c
where SOCb and SOCc are the soil organic carbon content of the biochar treatments and the control, respectively. The potential for carbon sequestration following the application of the biochars was then explained using the CPI, which shows the impact of the biochars on the storage of the total soil carbon. A greater OC formation or loss is indicated by a higher CPI (CPI > 1) or a lower CPI (CPI < 1).

2.5. Soil Aggregation

The aggregate size distribution was investigated using the wet sieving procedure. For this purpose, 10 g of soil was dried in an oven at 105 °C for 12 h, then wetted with tap water for around 24 h. Once the soil had rested in a water container, it was sieved for 10 min at a rate of 35 cycles per minute, using a set of sieves with holes that were 2, 1, 0.5, 0.25, and 0.053 mm in size. The remnant particles in each sieve were wet shaken, collected gently, and dried at 105 °C for 24 h. To calculate the aggregate size distribution, the weight ratio of the materials from each sieve to the total weight of the materials was determined. Additionally, the mean weight diameter (MWD) of the soil aggregates was obtained using following equation [35]:
Mean   weight   diameter   ( MWD ) = Σ   n i = 1 X i _ · W i
where X _ is the average diameter of the aggregates on each sieve, Wi is the weight ratio of the aggregates per sieve to the total weight of the soil, and n is the number of used sieves.
To evaluate the water-stable aggregates (WSA), 4 g of 1–2 mm air-dried aggregates were placed on a 0.26 mm sieve and then shaken in a water container for 3 min, with a speed of 35 times min−1 at a distance of 1.5 cm [35]. After drying the samples in the oven at 105 °C for 24 h, the water-stable aggregates (WSA) were calculated using the following equation:
Water   stable   aggregate   ( WSA ) = W a W c W o W c × 100
where Wa is the weight of the material on the sieve after the wet sieving, Wc is the weight of the sand particles, and Wo is the weight of the aggregates placed on the sieve prior to the wet sieving.
The fractal dimension (D) is known as an index for evaluating the degree of the crushing of large soil aggregates into smaller ones. The fractal dimension was calculated as one of the important indicators of the stability of the soil aggregates by weighing the aggregates left on each sieve, using following equation [36]:
M ( x < X i ) M T = ( X i X m a x ) 3 D
where Xi is the diameter of the i size aggregate and Xmax is the diameter of the largest aggregate in the sieve series. M(x < Xi) represents the cumulative weight of the aggregates smaller than Xi in the sieve series and MT indicates the total aggregates left on the sieve series. D is the fractal dimension.
With transferring Equation (4) into logarithmic form, the calculation of D relies on the following equation:
l o g [ M ( x < X i ) M T ] = ( 3 D ) log ( X i X m a x )

2.6. Soil pH, EC, BD

The soil pH and EC were determined through a suspension sample with a soil-to-water (w/v) ratio of 1:2.5 and measured with a pH meter (APERA, pH20, China) and an EC meter (APERA, EC20, China).
The soil bulk density (BD) was measured by the clod method [37]. Additionally, the theoretical bulk densities of each biochar-treated soil were calculated as follows [38]:
Theoretical   bulk   density   ( TBD ) = 1 ( 1 BD s × A s ) + ( 1 BD b × A b )
where BDs and BDb are the bulk density of the soil and biochar, respectively. Additionally, As and Ab are the application rate by weight, which is 98% for the soil and 2% for the biochar.

2.7. Data Analysis

A one-way analysis of variance (ANOVA) was performed to examine the significance of the differences in the soil parameters that were affected by the oxidized and pristine biochar treatments. The lowercase letters in the figures indicate the statistically significant differences after the least significant difference (LSD) test at p < 0.05. Existing correlations between the pyrolysis temperature and carbon pool index, as well as between the fractal dimension and soil properties, were analyzed using a linear regression model with Fisher–Snedecor test significance. SPSS 26.0 was used to analyze the data and Excel 2020 was used to extract the figures.

3. Results

3.1. Biochar SEM Results

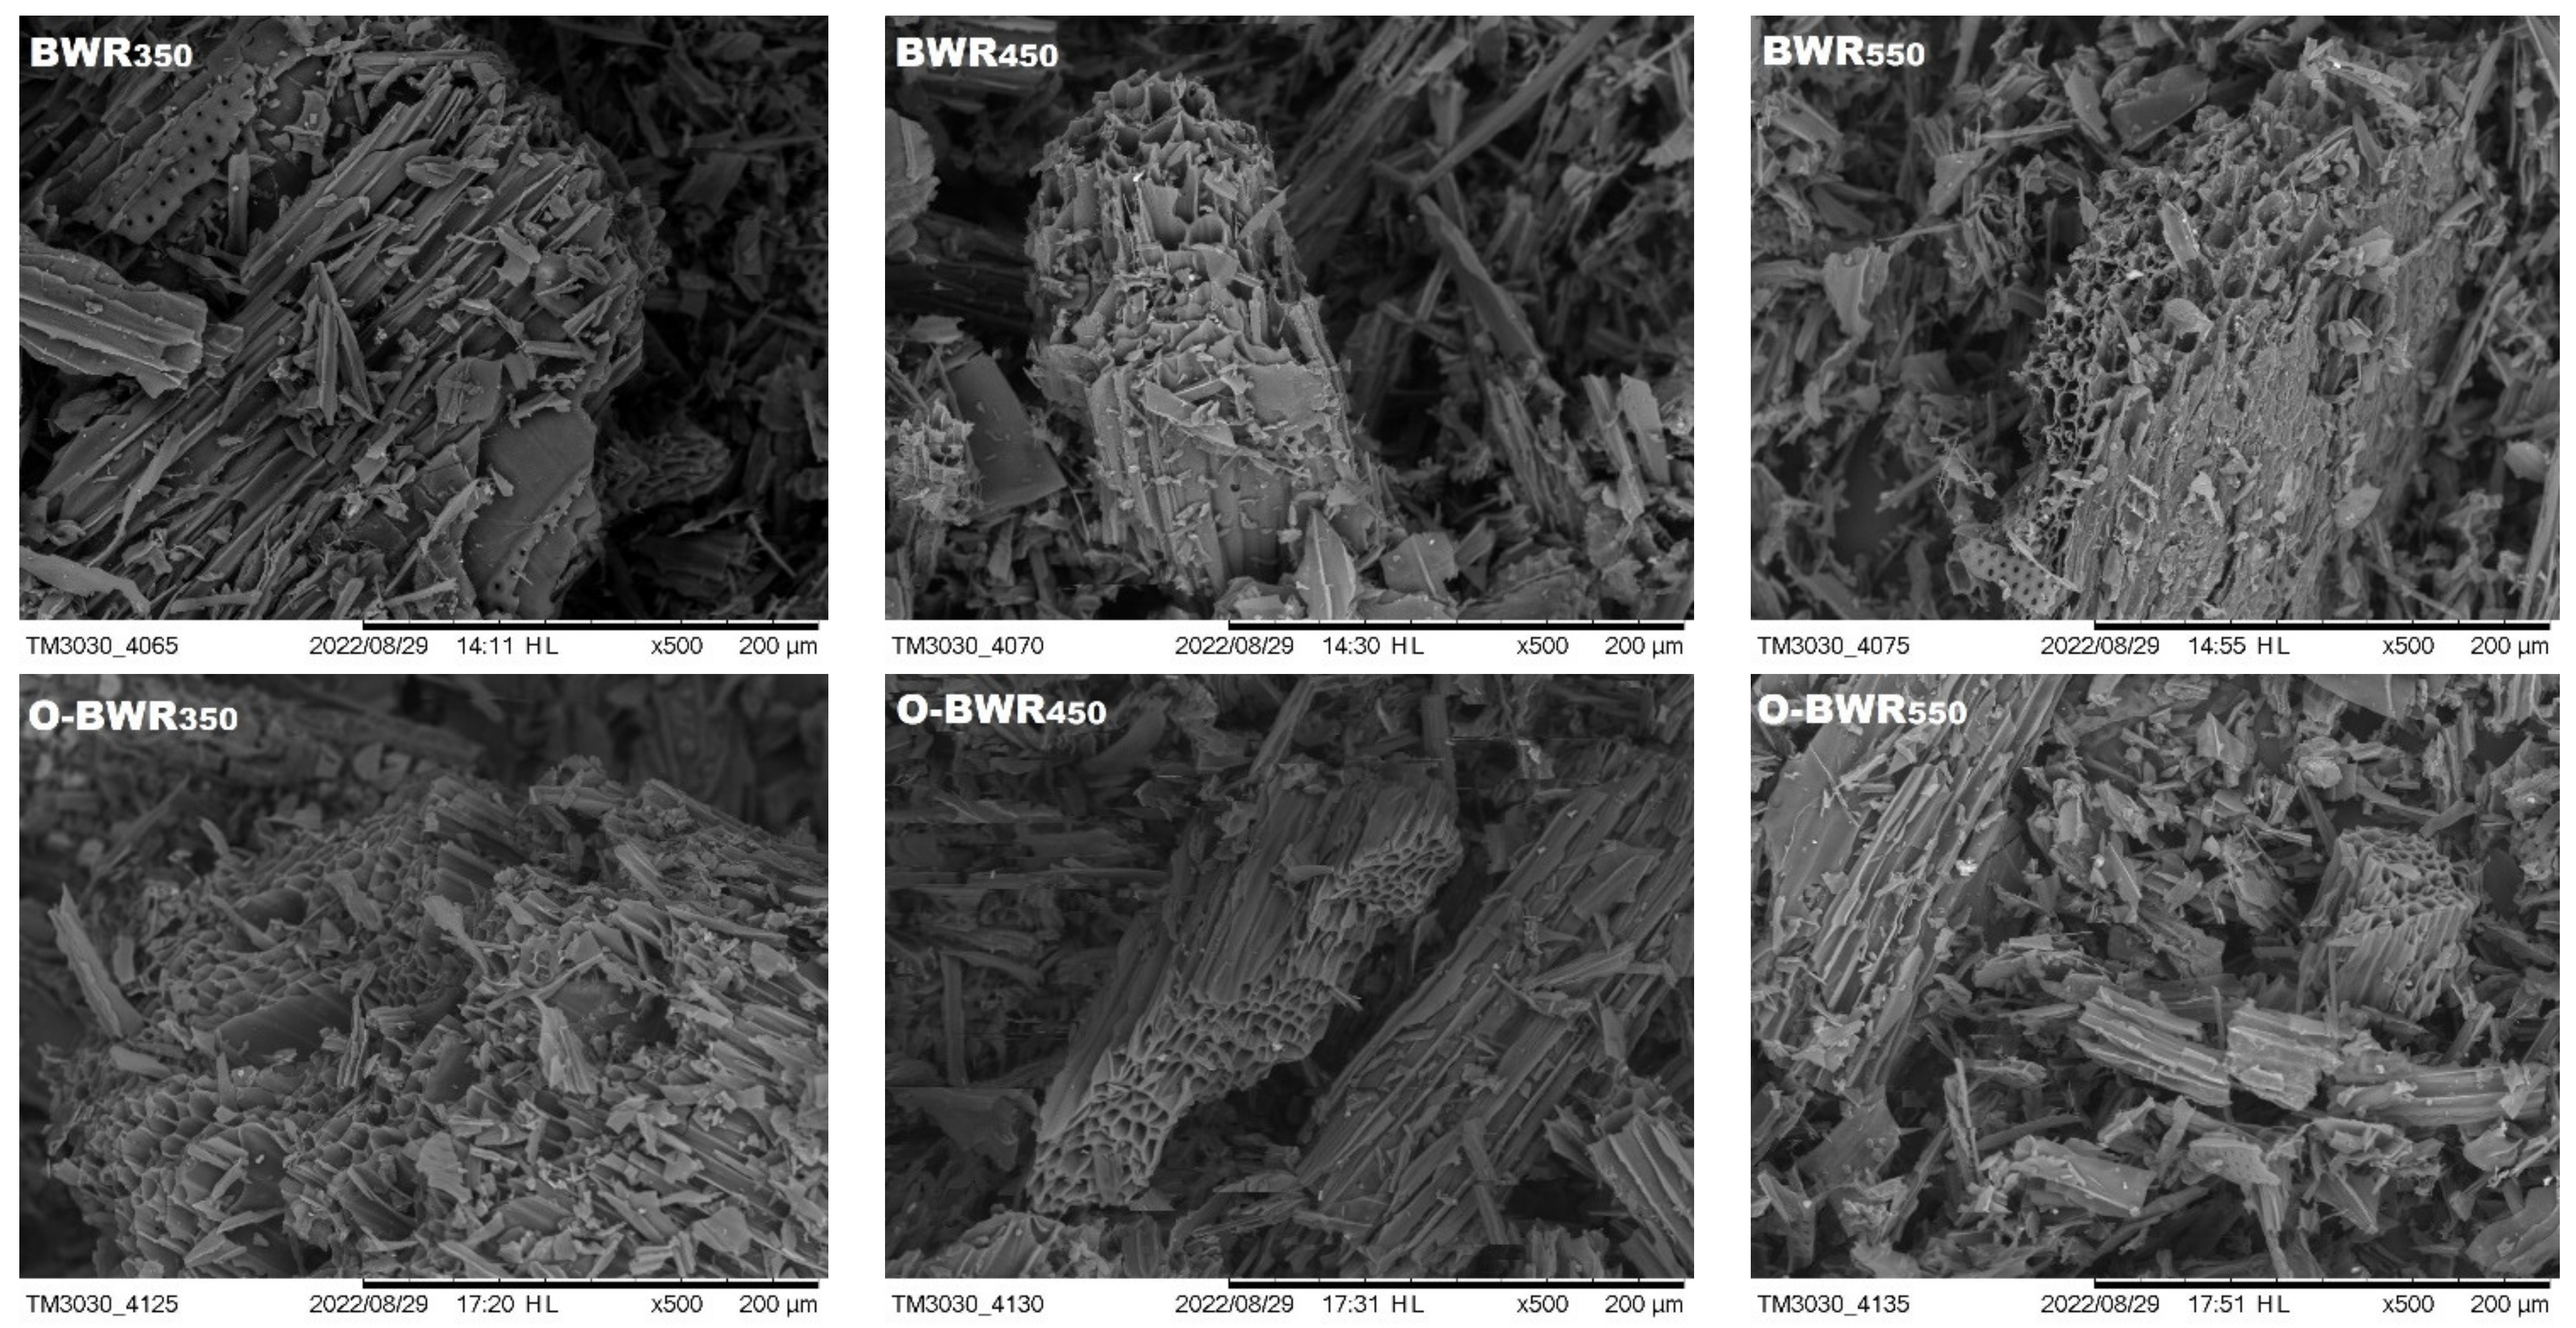
Figure 1 shows the results of the visualization of the biochar structures. Compared to the wood residue biochar, the SEM results clearly demonstrate the prevalence of pores smaller than 10 microns on the surface of the wheat straw biochar. As illustrated, these pores developed considerably after being exposed to the H2O2 in the wheat straw.

3.2. C Sequestration

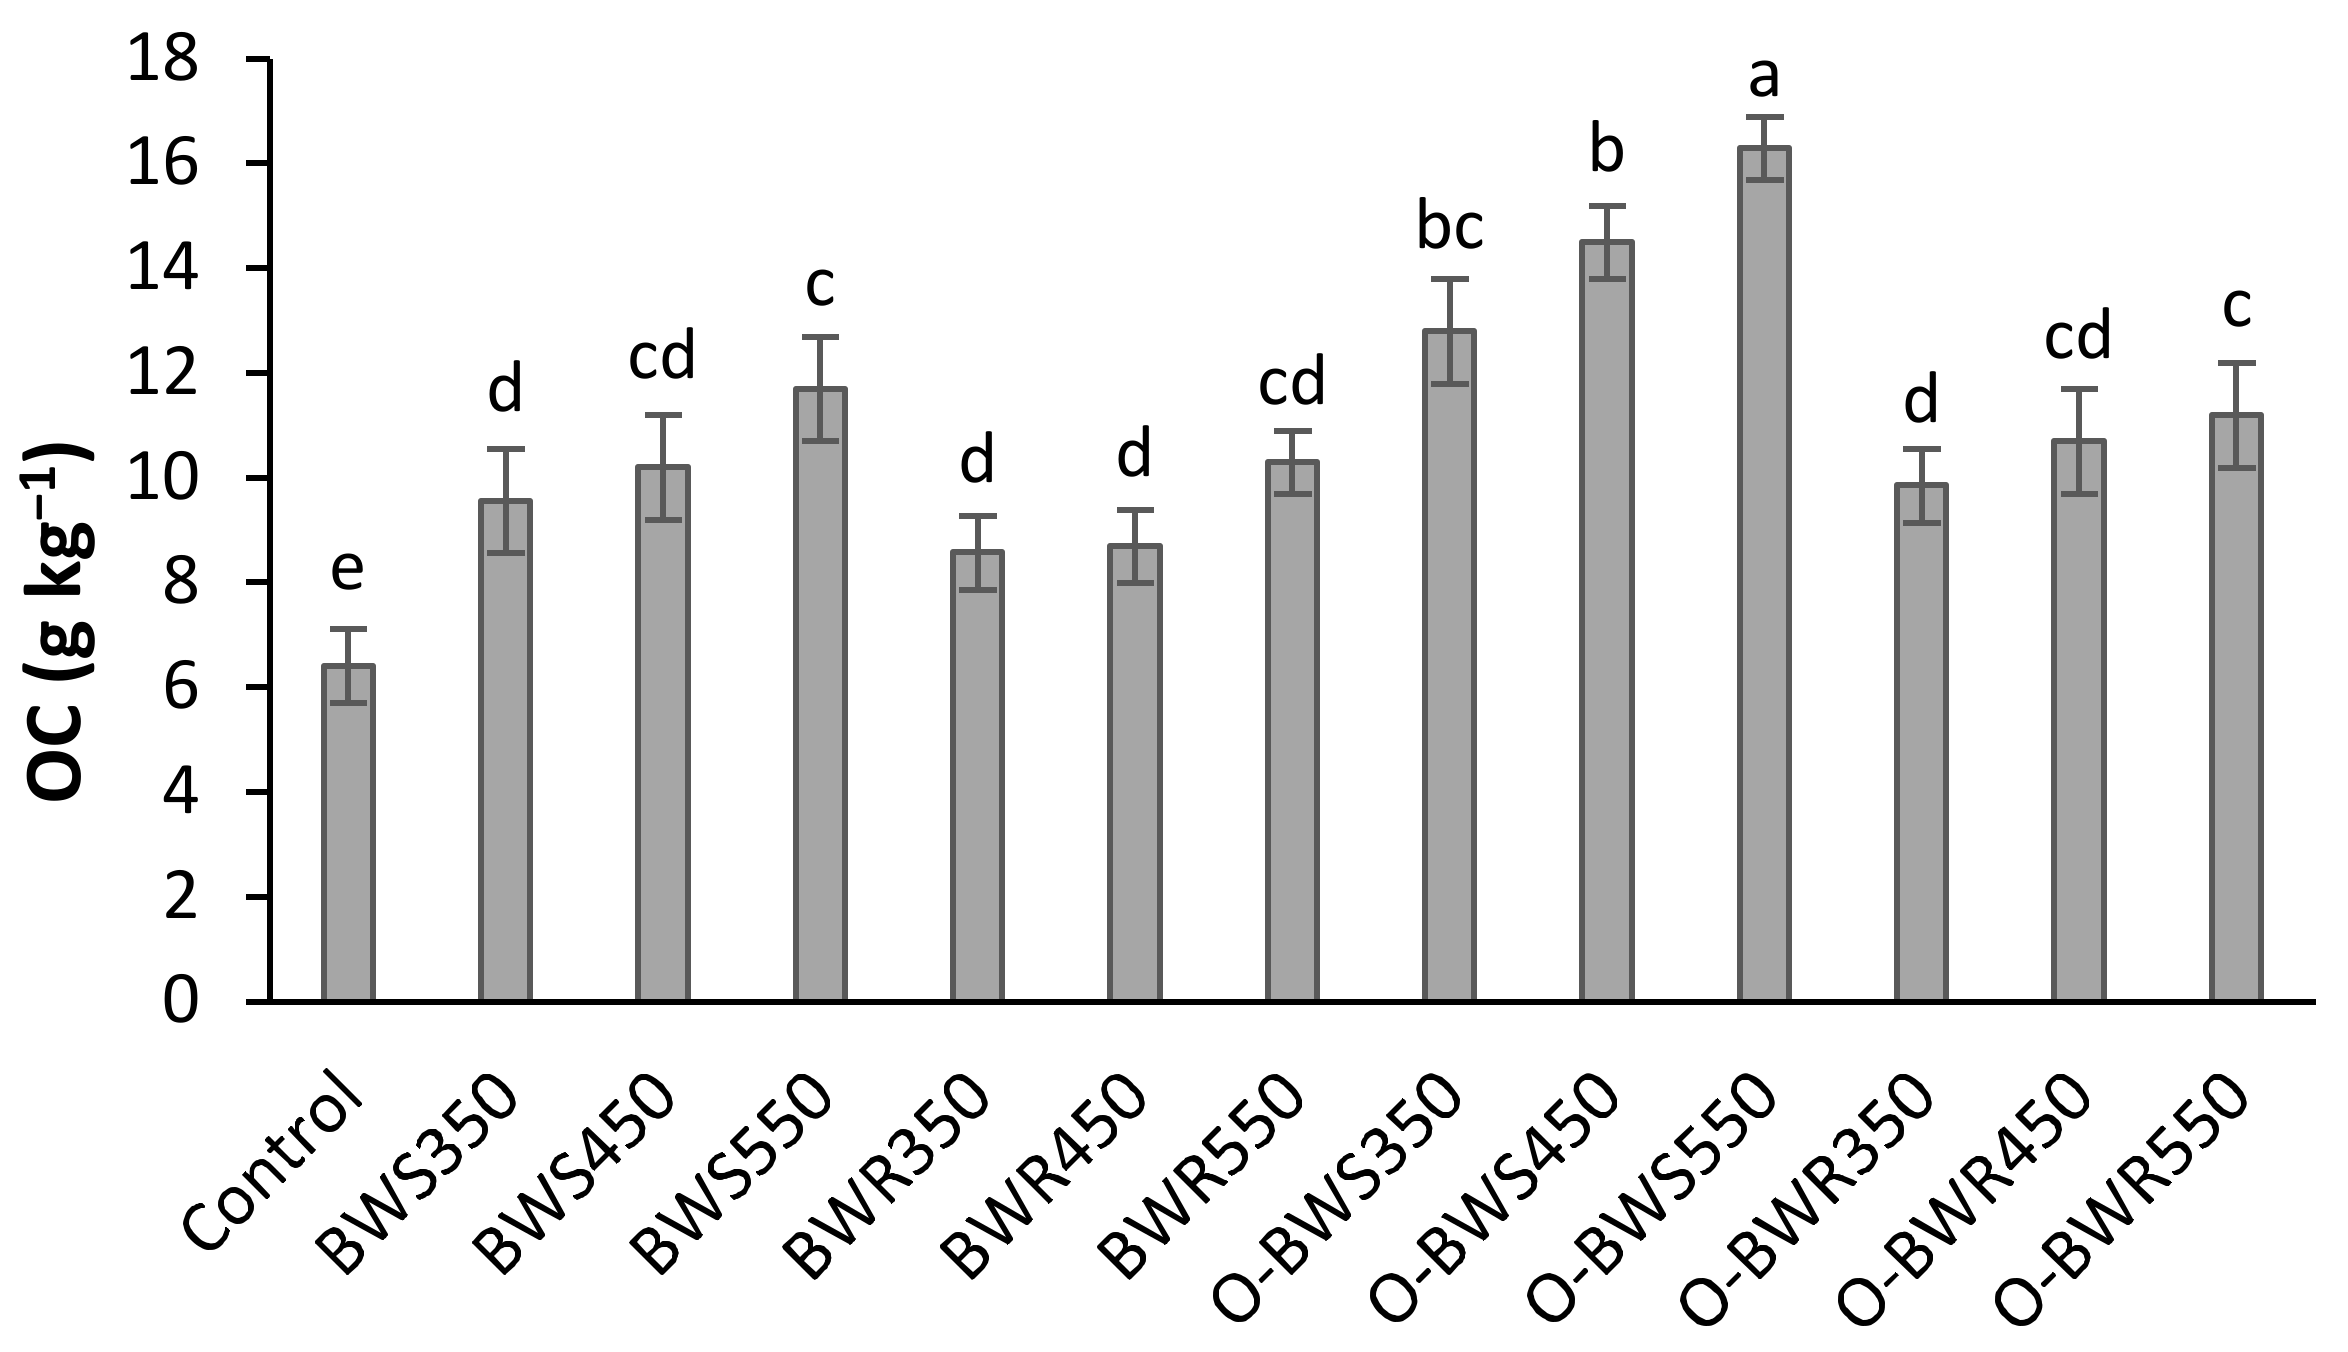
The oxidation of the biochars and the type of feedstock significantly changed the soil carbon pool (p < 0.05) (Figure 2). All the biochar treatments significantly increased the soil’s organic carbon and the wheat straw biochar showed better results compared to the wood residue biochar in both the oxidized and pristine forms. The highest OC was obtained from the soil which was treated with O-BWS550, with a 154% increase compared to the control. Additionally, an increase in the pyrolysis temperature caused a significantly high OC in both the oxidized and pristine biochars.
The results of the carbon pool index (CPI) affected by the biochar treatments are shown in Figure 3. The CPI value in the oxidized wheat straw biochar was much higher than that for the other treatments and had a rising trend with an increase in the pyrolysis temperature. There was a significant difference between the different temperatures of O-BWS for the CPI value, and O-BWS550 showed the highest CPI (2.62), being 52% higher than the averages of the other treatments (1.73) (Figure 3a). Additionally, the regression analysis between the CPI and pyrolysis temperature showed a positive correlation between them with R2 = 0.55 (Figure 3b).

3.3. Soil Aggregation

The application of all the biochar amendments significantly changed the soil aggregate indices (p < 0.05) (Figure 4). Among the pristine biochar treatments, BWS550 caused the highest MWD (1.56), with a 280% increase compared to the control. However, there was no significant difference between the pristine wheat straw biochars. Although both the wheat and wood pristine biochars significantly increased the MWD values, the average MWD for the wheat straw was 55% higher than that for the wood residues. The same results were obtained from the oxidized biochars of corresponding treatments. All three oxidized wheat straw treatments showed a significant increase in their pristine corresponding treatments, while the pristine and oxidized wood biochars did not show significant differences from each other.
With regard to the WSA percentages, both the pristine and oxidized biochars caused a significant increase in comparison to the control. However, O-BWS350, O-BWS450, and O-BWS550 showed significantly higher values, with percentages of 68, 74, and 76% compared to the control (41%). In the case of the biochar temperatures, 450 and 550 °C caused significant increases in the WSA for both the pristine and oxidized wheat straw, while in the wood residue treatments, the pyrolysis temperature did not have a significant effect on the WSA.

3.4. Soil Fractal Dimension (D) and Bulk Density (BD)

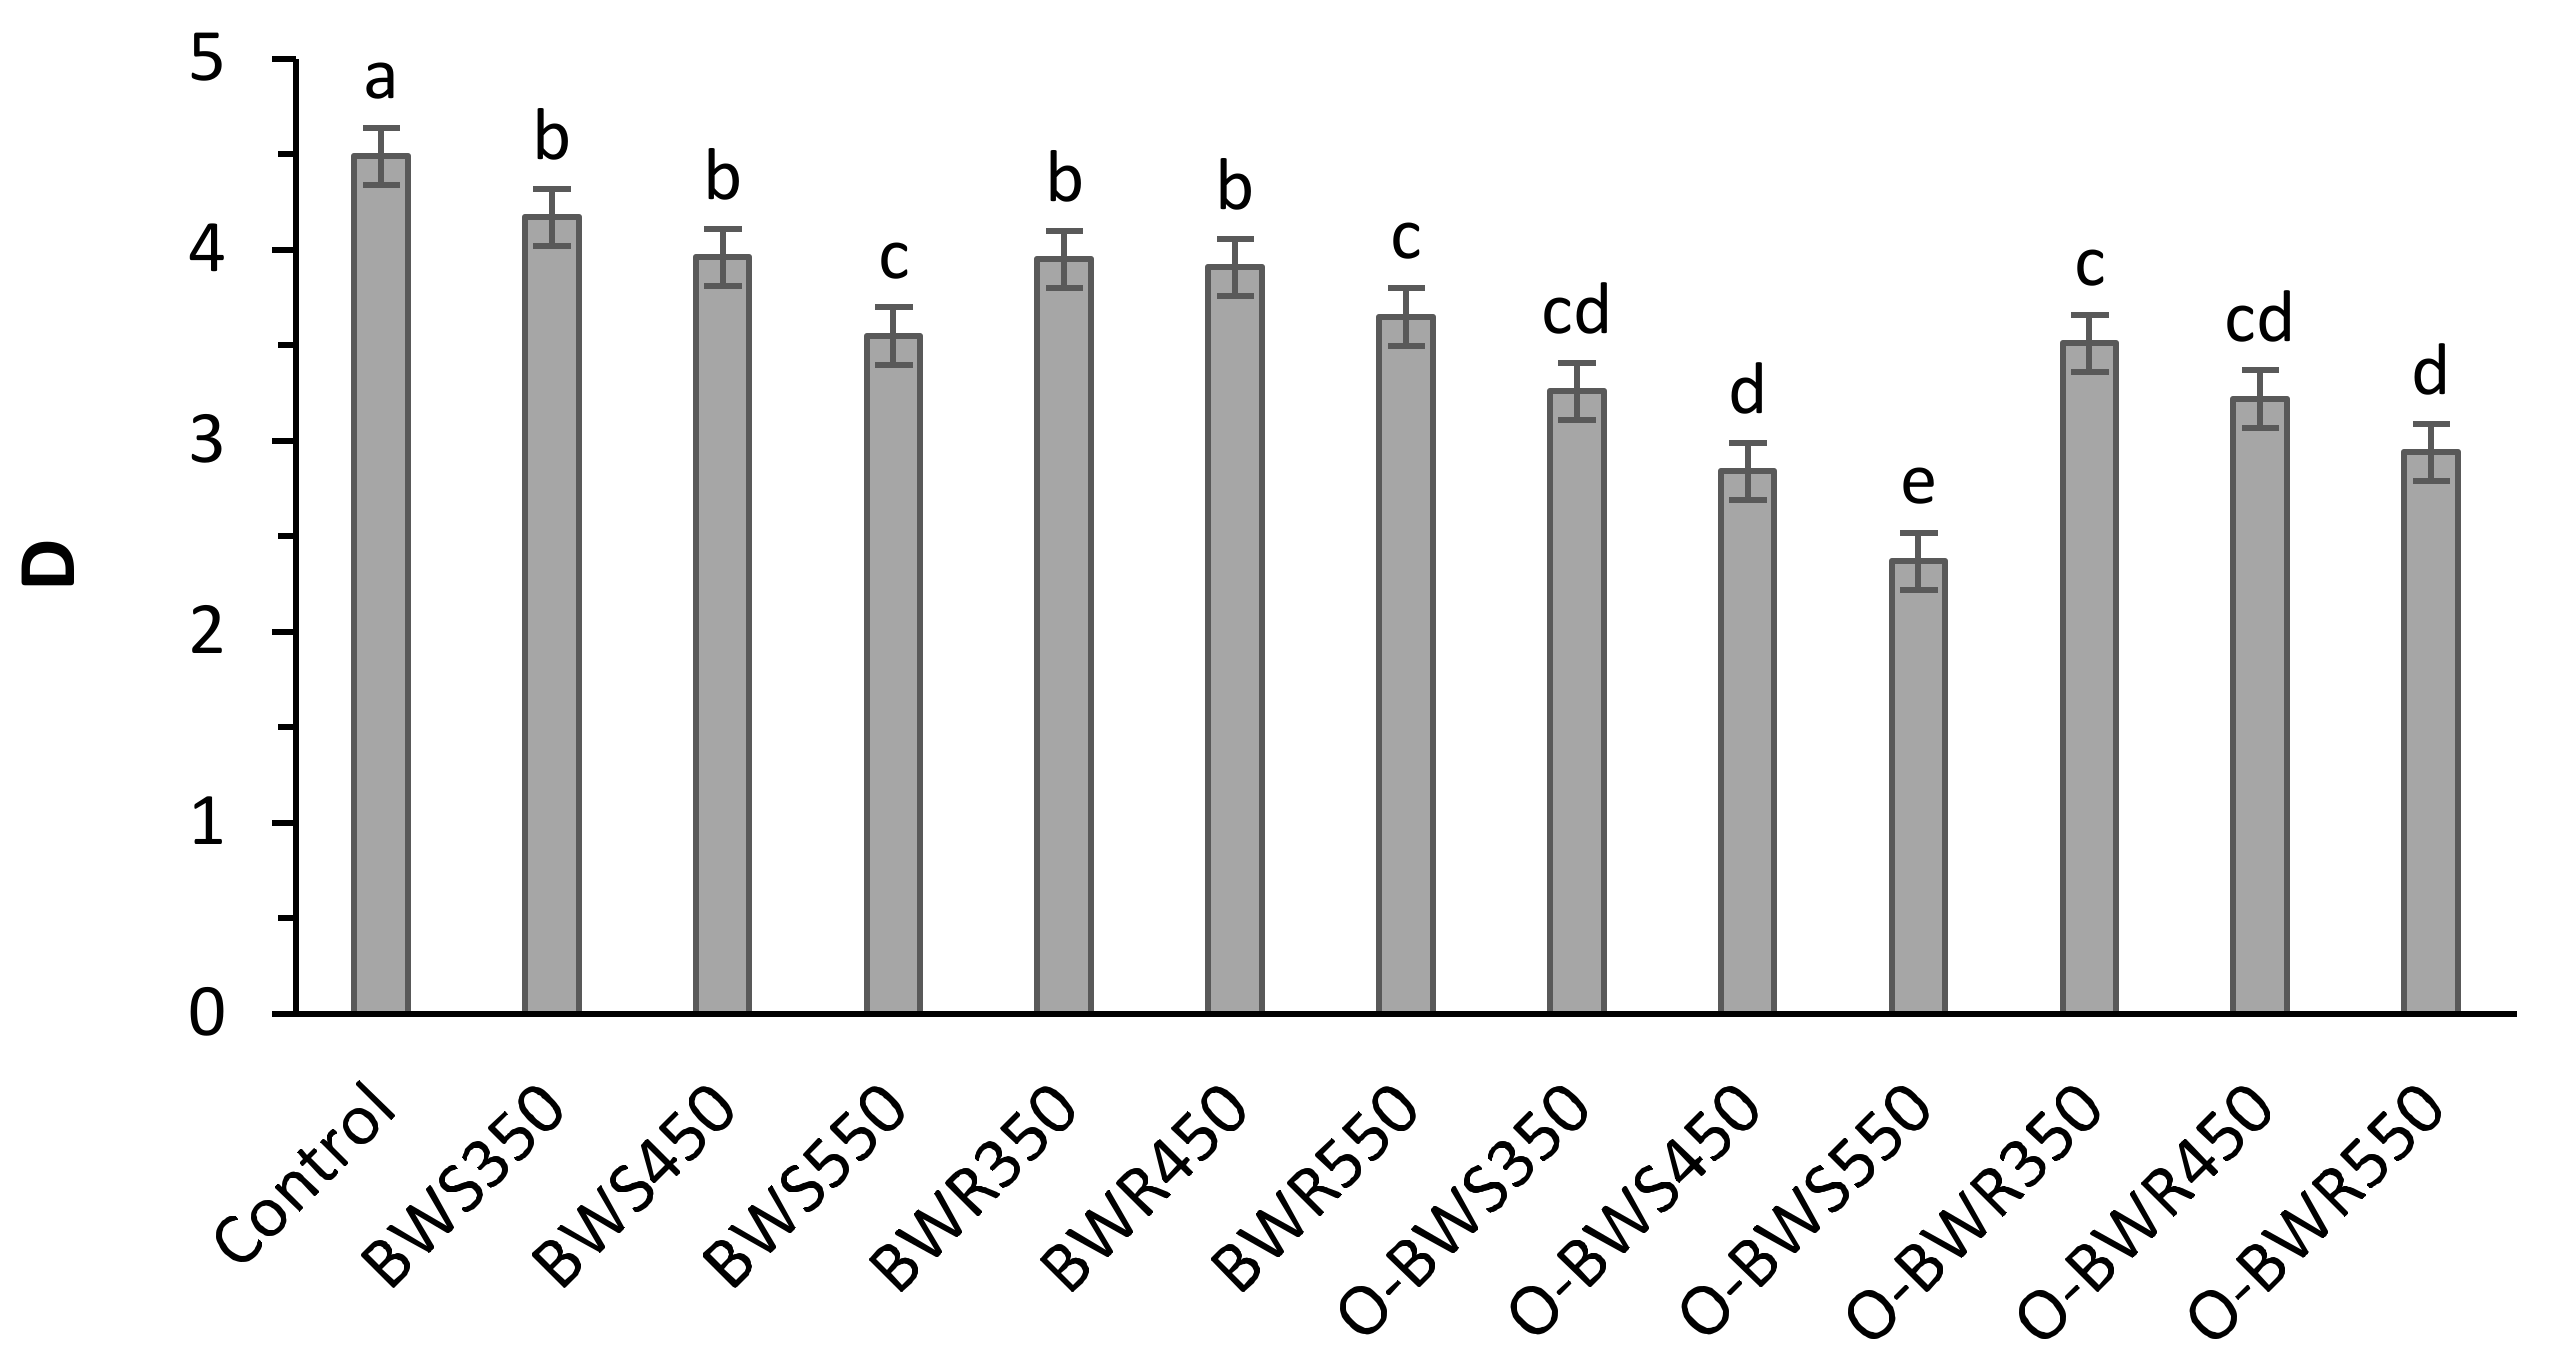
The results showed that the fractal dimension of the soil aggregates was significantly changed by the different biochar treatments (p < 0.05) (Figure 5). In general, there was a significant descending trend in the D with an increasing pyrolysis temperature for both biochar types. The oxidized biochar treatments significantly decreased the D value and the lowest D value was obtained by O-BWS550, with a 47% decrease in comparison to the control. Additionally, for the pristine treatments, both BWS and BWR at 550 °C showed the lowest D values, with 21% and 18% decreases, respectively, in comparison to the control.
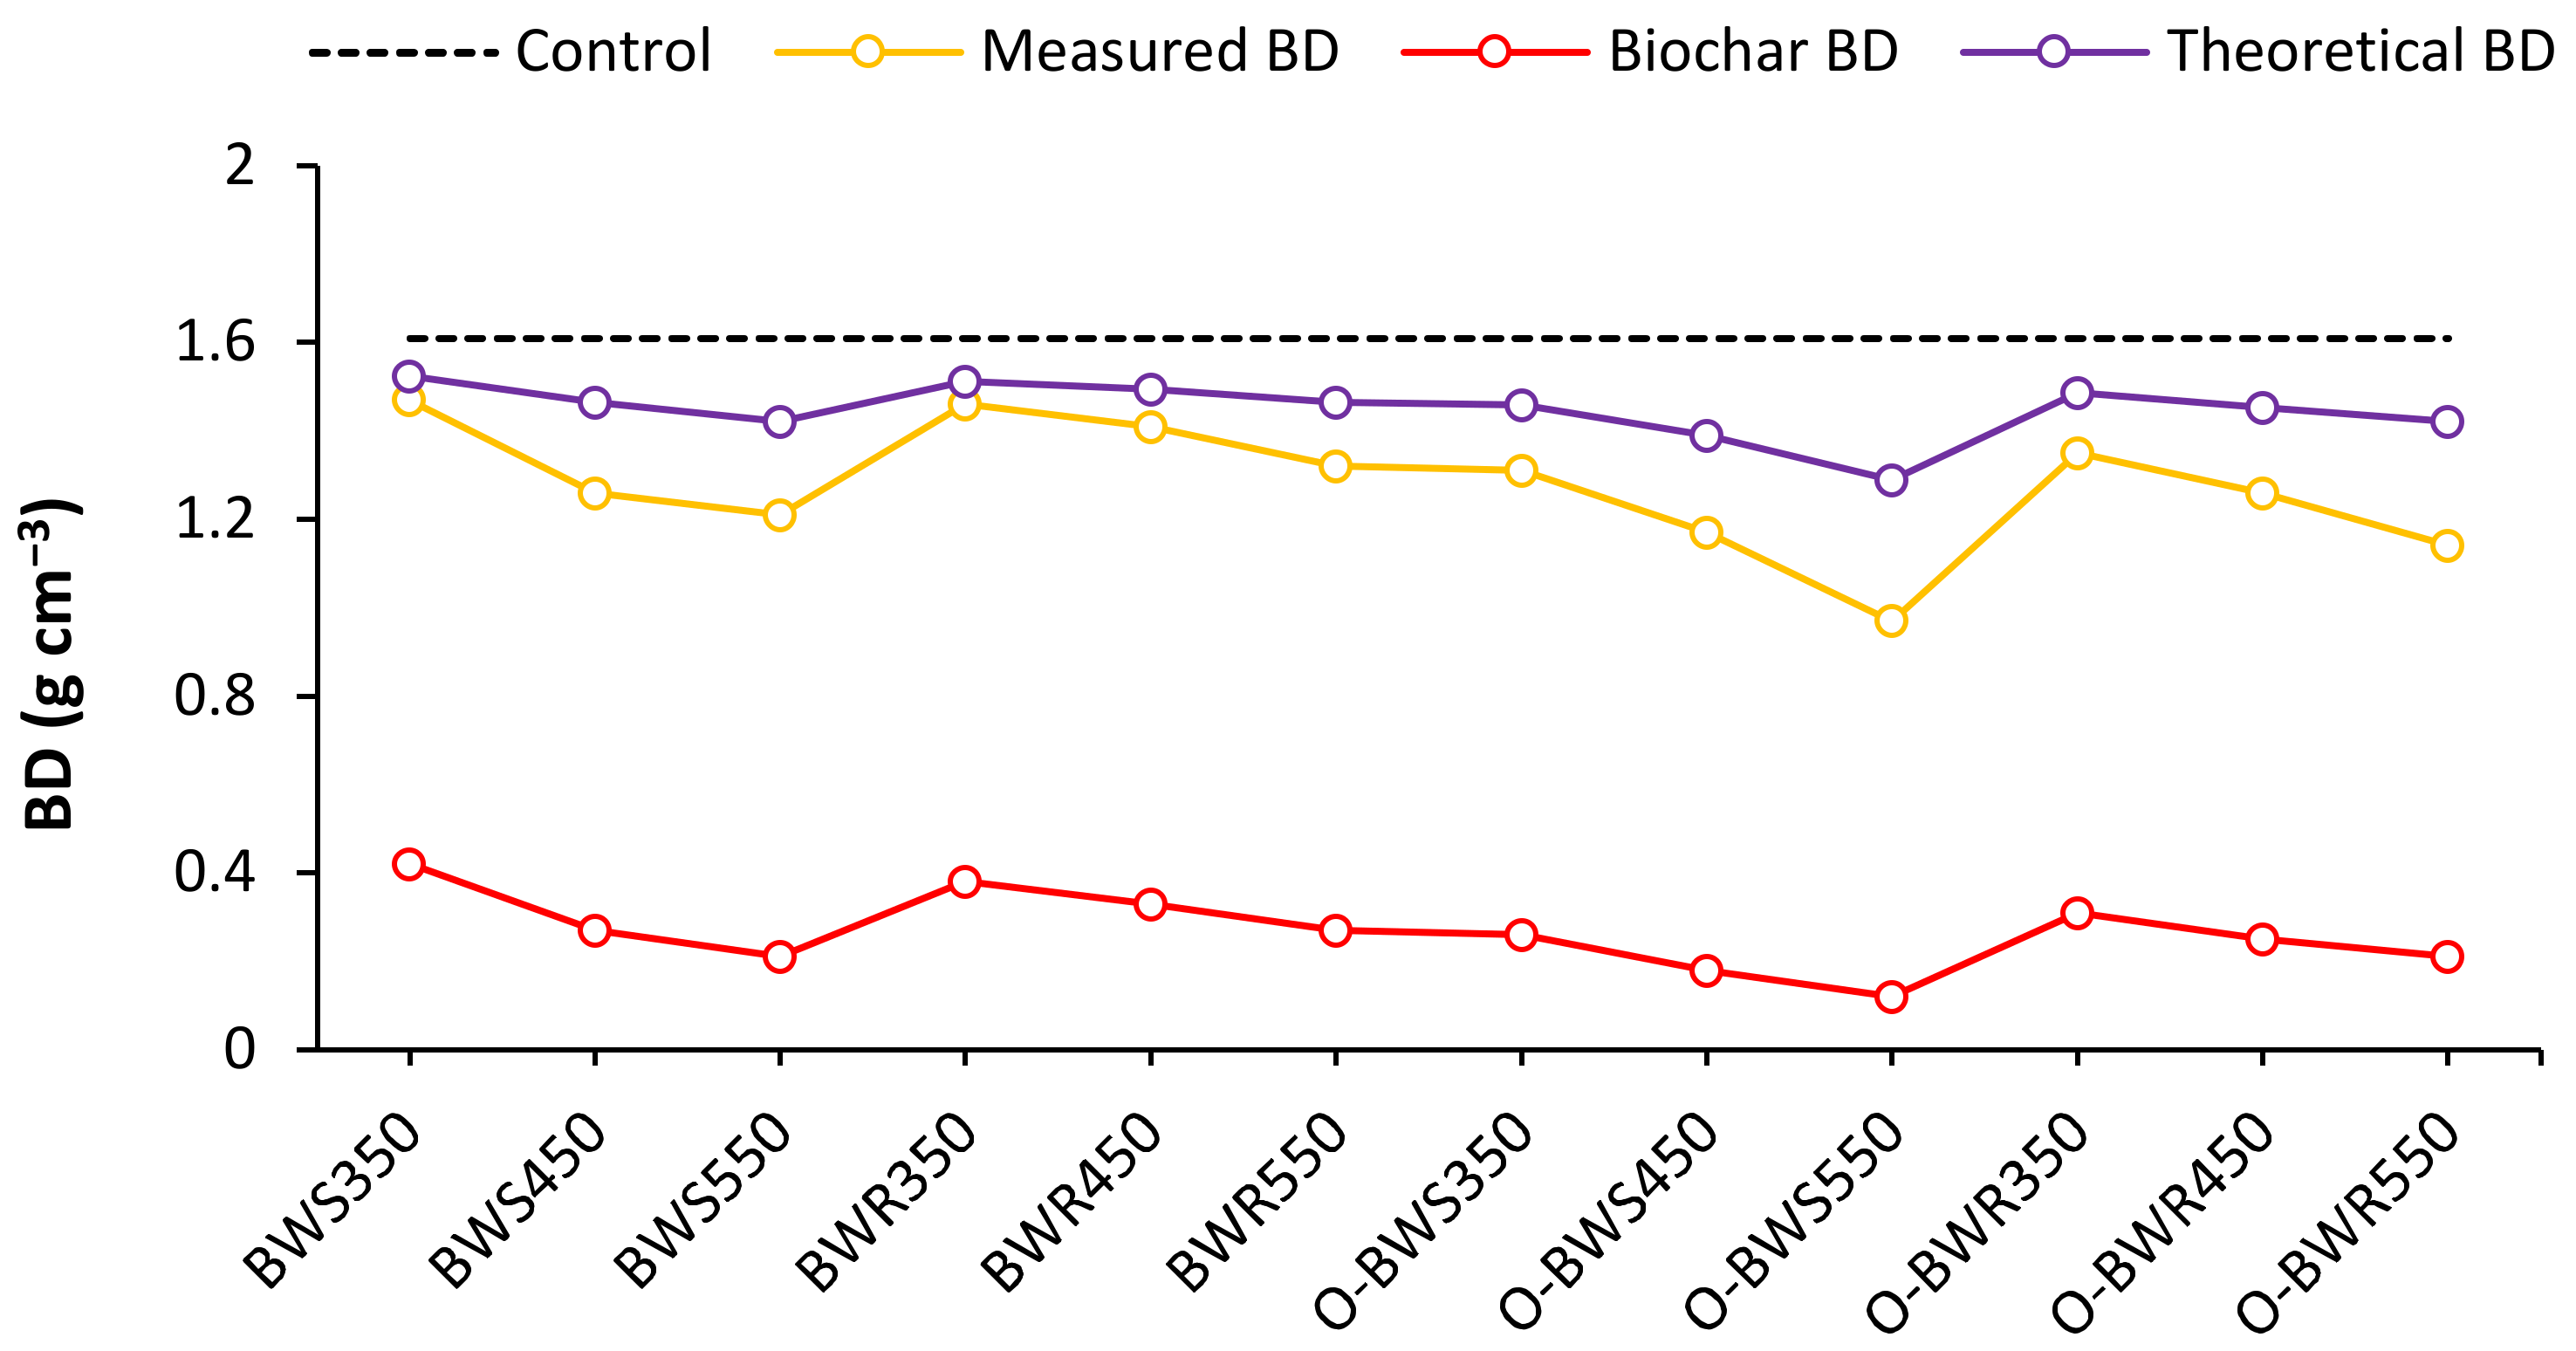
Figure 6 represents a comparison between the measured and theoretical BD affected by the different treatments. Overall, the BD was significantly affected by the oxidation and pyrolysis conditions (p < 0.05). Based on the results, the biochars produced at high temperatures had a significant effect on the soil BD. The lowest BD was obtained for O-BWS550, with a 40% decrease compared to the control. On the other hand, O-BWS550 caused the highest soil total porosity, with a 62% increase in comparison to the control. The theoretical BD in all the biochar-treated soils, which was calculated using Equation (6), showed higher BD values in comparison to the measured BD at the end of the experiment.
The correlations between the fractal dimension and soil parameters are shown in Figure 7. The fractal dimension and soil BD with R2 = 0.63 showed a significant positive correlation (p < 0.05). There was also a significant negative correlation between the MWD vs. D with R2 = 0.42, the WSA vs. D with R2 = 0.69, and the OC vs. D with R2 = 0.55.

4. Discussion

Based on the results, the addition of any biochar increased the soil OC. In general, the amount of soil OC has a direct interaction with the activities of mineralizing microorganisms [23]. The decomposition of organic matter and, consequently, an increase in the soil OC will improve due to the presence of decomposing microorganisms in the soil [22]. However, the released OC due to mineralization does not guarantee an increase in the soil quality until it is not fixed in the soil. This means that, without the mechanism of OC stabilization in the soil, a significant part of the carbon storage would be lost in the form of water-soluble carbon [39]. As a result, soils that lack OC stabilization mechanisms will become poor in OC in the long term. Considering the importance of this, biochar plays the role of an effective soil conditioner by stabilizing the OC in the soil due to its specific surface area and high porosity [40]. It has been shown that increasing the specific surface area of biochar is the basis for establishing linking bridges between the carbon materials and soil particles, which ultimately leads to the stabilization of OC and soil aggregation in the soil [38,41]. This is why all the biochar treatments significantly increased the soil OC (Figure 2). However, the pyrolysis conditions and the type of feedstock affected the role of the biochar on the soil OC fixation. The results of the carbon pool index (CPI) (Figure 3a) showed notable effects of biochar oxidation on increasing the soil carbon stock. Taking a closer look at Table 1, it can be seen that increasing the pyrolysis temperature of the biochars effectively increased the porosity and specific surface area and decreased the bulk density of the biochar. At lower pyrolysis temperatures, there was probably still a significant amount of volatile substances on the biochar surface, preventing the creation of more pores. However, at higher temperatures, most of the low-molecular-weight hydrocarbons and additional H and O were volatilized, eventually forming more pores [29]. Additionally, the positive correlation between the CPI and pyrolysis temperature (Figure 3b) indicated that, due to the high levels of aromatic carbon in the biochars pyrolyzed at high temperatures, they have a resistant structure, which is a crucial quality for boosting the soil C sequestration potential [12]. As a result, the biochars produced at high temperatures contained more recalcitrant aromatic carbon and may have had a better capacity for mitigating carbon emissions, particularly when oxidized.
According to earlier research, biochars with higher pyrolysis temperatures have a greater capacity for sequestering carbon than biochars with lower pyrolysis temperatures [13,42]. It should be mentioned that adding biochars produced at high temperatures to the soil, in addition to increasing the soil porosity, increased the accumulation of microorganisms due to the provision of proper aeration and a suitable substrate for microbial activities. However, the key point here is that the processes of organic matter mineralization via these microorganisms take place in a stable soil complex with a high efficiency of carbon fixation [39]. Additionally, wheat straw biochars have significantly higher porosity and specific surface area in comparison to wood residue biochars. This could be due to the presence of less ash in wheat straw biochars, which is a pore-blocking factor [43]. The scanning microscope electron images clearly show the abundance of tiny pores smaller than 10 microns on the surface of the wheat straw biochars in comparison to the wood residues biochar (Figure 1). As shown, these pores increased significantly after the oxidation in wheat straw. As a result, an increase in the specific surface area and porosity, as well as a decrease in the bulk density of the oxidized biochars would have been expected (Table 1). In fact, oxidation significantly strengthened the intrinsic properties of the pristine biochars in the carbon fixation, especially in the wheat straw. The main reason for this could be the change in the oxygenated functional groups on the surface of the biochars affected by oxidation [44]. Applying oxidation to a biochar by increasing several functional groups, such as the hydroxyl, carbonyl, and carboxyl groups, etc., on its surface causes the adsorption of polar organic substances and the fixing of the free inorganic ions of the soil solutions on the surface of the biochar [28].
The soil aggregation results greatly helped to clarify the reasons for the increase in the OC due to the addition of oxidized biochars (Figure 4 and Figure 5). Several studies have shown that increases in soil OC have a very close interaction with increases in water stable aggregates (WSA) and the strengthening of soil structure [45,46]. On the other hand, the porous structures of biochars and their surfaces become rich in functional groups by creating organo-mineral interaction bridges, which can strengthen this complex and, at the same time, stabilize the soil OC and prevent soil loss [40]. It has been reported that the addition of biochars, due to their porous structures and high specific surfaces, increases the labile OC, enzyme activities, percentage of WSA, and eventually soil quality [47]. Biochars can act as a basic substance through the adsorption of soil cations on the surface of their structures to create stable organo-mineral complexes [39]. Various aggregate sizes have diverse functions in the conservation of OC. In general, the OC retained in micro aggregates demonstrates a better resistance to breakdown in comparison to large aggregates [46]. The average decomposition period of the OC held in micro aggregates (<250 μm) is 200 years, whereas this period in macro aggregates (>250 μm) is assumed to be around 20 years [48]. Clay soil particles (<53 μm) receive additional OC from biochars, which also encourages the mobility of the soil OC from macro aggregates to micro aggregates [49]. Moreover, it has been demonstrated that adding biochars considerably improves aggregate stability by increasing the mean weight diameter (MWD) by roughly 170% [50]. This is mostly because the biochars physically protect the OC by trapping it within macro aggregates. This not only boosts carbon sequestration but also strengthens the resilience of the aggregates [39]. With this in mind, biochar oxidation can greatly enhance this functionality by introducing a diversity of oxygen functional groups to its surface. It has been shown that fine intra-aggregate OC dramatically increases in conjunction with the development of the C=O groups in soil aggregates [51]. Therefore, the increases in the percentages of the WSA and MWD due to the addition of pristine and oxidized biochar treatments can be justified by the role of biochars in the accumulation of OC soil particles providing its surface functional groups (Figure 4).
The results obtained from the fractal dimension (D) calculations positively supported the interaction between the biochars and soil aggregates. The D was significantly lower in all the treatments containing biochars than in the control. In general, a larger fractal dimension has a positive correlation with the amount of soil micro aggregates. As much as the fractal dimension decreases, it indicates a decrease in the fraction of micro aggregates and an increase in the fraction of macro aggregates [36]. The potential of soil to fill empty volumes with mineral particles or crushed aggregates is indicated by the fractal dimensions of the soil. Therefore, a smaller soil aggregate size, a lower OC, and a greater soil bulk density correspond with a greater soil fractal dimension [52]. With regard to the relation of resistance OC and macro aggregates mentioned above, a lower D supports a high MWD and WSA, or in other words, the formation of more macro aggregates as a result of stronger complexes between the biochars and OC. The obtained regression relations between the D and WSA, MWD, and BD confirmed this claim (Figure 7). Additionally, biochar oxidation, by increasing the specific surface area and porosity of the soil, enhanced the capacity for the formation of macro aggregates, which was associated with increased carbon stabilization in the soil. It has been reported that the addition of biochars can notably increase soil aggregation due to an improvement in the soil porosity and surface area [53,54].
The biochar treatments significantly reduced the soil’s bulk density and the oxidized treatments were more effective (Figure 6). A decrease in the soil bulk density affected by a high porosity of the biochars has been reported [55]. Since the bulk density and soil porosity are directly related to each other, the addition of porous biochars to the soil can dramatically improve these two parameters as well [43]. The biochar effect on the soil bulk density is considerably dependent on the type of foodstock and the pyrolysis temperature. Biochars produced by corn straw at high pyrolysis temperatures significantly reduced the soil bulk density and increased the porosity in comparison to lower temperatures [56]. One of the most important reasons for the low bulk density of the biochars at low temperatures was that, at a lower temperature, less material had been volatilized and therefore less pores had been formed, thereby decreasing the inner volume of the biochar [43]. The descending trend in the bulk density of the biochars with a rise in the pyrolysis temperature in Figure 6 supports this claim. This function was strengthened by the loss of volatile matter, the condensation of the primary carbon groups to (poly-)aromatic carbon groups, and an increase in the porosity through the oxidation of the biochar [29]. This is why the treatments containing the oxidized biochars had a lower bulk density than their corresponding pristine biochars (Figure 7). Additionally, the difference between the measured density and the calculated density in Figure 7 revealed that the changes in the soil density were directly affected by the type of biochar, pyrolysis temperature, and oxidation conditions. This shows that the adjustment of the porosity by enhancing it with oxidation or pyrolysis conditions can dramatically increase the performance of biochar as a porous amendment in soil.

5. Conclusions

The ability of biochars to improve physical soil characteristics can be increased, especially by oxidizing biochars made from various feedstocks and at various temperatures. During the oxidation process, a biochar’s structural carbon form changes, creating more micro-pores, a larger specific surface area, and ultimately trapping more organic carbon in the amended soils. An increase in the soil aggregation, a decrease in the fractal dimensions of the soil aggregates, and finally, an improvement in the soil structure are all facilitated by the organo-mineral bridges built in the soils treated with oxidized biochars. An increase in the soil organic carbon and soil aggregation can be supported by using oxidatively modified biochars in soil. Additionally, the type of feedstock and pyrolysis temperature were recognized as important factors for increasing the efficiency of biochars for the maintenance of soil organic carbon, with regard to the high efficiency of wheat straw biochars in comparison to wood residue biochars and a pyrolysis temperature of 550 °C. Therefore, there is a need to continue research in this area, especially through long-term studies, given the variety of feedstocks and, on the other hand, the insufficiency of existing studies on the impact of oxidized biochars on soil carbon storage. On the other hand, in order to improve the intrinsic qualities of biochars, a wide variety of oxidizing agents, such as acids, alkalis, metal oxides, etc., are now expected. However, this is still unclear and requires further investigation into how effectively modified biochars might enhance soil performance in terms of carbon sequestration, nutrient storage, and resilience to moisture stress and pollution.

Author Contributions

Conceptualization, M.G.; methodology, M.G.; software, M.G.; validation, M.G., R.W.N., P.K., M.K. and G.S.; formal analysis, M.G.; investigation, M.G.; resources, P.K. and R.W.N.; data curation, M.G. and M.K.; writing—original draft preparation, M.G.; writing—review and editing, M.G., R.W.N. and G.S.; visualization, M.G.; supervision, M.G.; project administration, R.W.N.; funding acquisition, P.K. All authors have read and agreed to the published version of the manuscript.

Funding

This research was funded by the University of South Bohemia in České Budějovice (GAJU 085/2022/Z).

Informed Consent Statement

Not applicable.

Data Availability Statement

Not applicable.

Acknowledgments

The authors sincerely appreciate the University of Bohemia in České Budějovice, Faculty of Agriculture and Technology, Department of Agroecosystems for supporting the research goals and laboratory facilities. Additionally, the authors are grateful to the University of Natural Resources and Life Sciences in Vienna (BOKU University) for providing the possibility of biochar production.

Conflicts of Interest

The authors declare no conflict of interest.

References

  1. Luo, Z.; Feng, W.; Luo, Y.; Baldock, J.; Wang, E. Soil Organic Carbon Dynamics Jointly Controlled by Climate, Carbon Inputs, Soil Properties and Soil Carbon Fractions. Glob. Chang. Biol. 2017, 23, 4430–4439. [Google Scholar] [CrossRef]
  2. Ge, X.; Cao, Y.; Zhou, B.; Wang, X.; Yang, Z.; Li, M.-H. Biochar Addition Increases Subsurface Soil Microbial Biomass but Has Limited Effects on Soil CO2 Emissions in Subtropical Moso Bamboo Plantations. Appl. Soil Ecol. 2019, 142, 155–165. [Google Scholar] [CrossRef]
  3. Doyeni, M.O.; Baksinskaite, A.; Suproniene, S.; Tilvikiene, V. Effect of Animal Waste Based Digestate Fertilization on Soil Microbial Activities, Greenhouse Gas Emissions and Spring Wheat Productivity in Loam and Sandy Loam Soil. Agronomy 2021, 11, 1281. [Google Scholar] [CrossRef]
  4. De Oliveira Silva, B.; Moitinho, M.R.; de Araujo Santos, G.A.; Teixeira, D.D.B.; Fernandes, C.; La Scala, N. Soil CO2 Emission and Short-Term Soil Pore Class Distribution after Tillage Operations. Soil Tillage Res. 2019, 186, 224–232. [Google Scholar] [CrossRef]
  5. Khan, N.; Jhariya, M.K.; Raj, A.; Banerjee, A.; Meena, R.S. Soil Carbon Stock and Sequestration: Implications for Climate Change Adaptation and Mitigation. In Ecological Intensification of Natural Resources for Sustainable Agriculture; Jhariya, M.K., Meena, R.S., Banerjee, A., Eds.; Springer: Singapore, 2021; pp. 461–489. ISBN 978-981-334-202-6. [Google Scholar]
  6. Ma, J.; Ullah, S.; Niu, A.; Liao, Z.; Qin, Q.; Xu, S.; Lin, C. Heavy Metal Pollution Increases CH4 and Decreases CO2 Emissions Due to Soil Microbial Changes in a Mangrove Wetland: Microcosm Experiment and Field Examination. Chemosphere 2021, 269, 128735. [Google Scholar] [CrossRef] [PubMed]
  7. Ramesh, T.; Bolan, N.S.; Kirkham, M.B.; Wijesekara, H.; Kanchikerimath, M.; Srinivasa Rao, C.; Sandeep, S.; Rinklebe, J.; Ok, Y.S.; Choudhury, B.U.; et al. Soil Organic Carbon Dynamics: Impact of Land Use Changes and Management Practices: A Review. In Advances in Agronomy; Elsevier: Amsterdam, The Netherlands, 2019; Volume 156, pp. 1–107. ISBN 978-0-12-817598-9. [Google Scholar]
  8. Lal, R. Carbon Sequestration. Philos. Trans. R. Soc. B Biol. Sci. 2008, 363, 815–830. [Google Scholar] [CrossRef]
  9. Wu, L.; Zhang, W.; Wei, W.; He, Z.; Kuzyakov, Y.; Bol, R.; Hu, R. Soil Organic Matter Priming and Carbon Balance after Straw Addition Is Regulated by Long-Term Fertilization. Soil Biol. Biochem. 2019, 135, 383–391. [Google Scholar] [CrossRef]
  10. Cheng, L.; Leavitt, S.W.; Kimball, B.A.; Pinter, P.J.; Ottman, M.J.; Matthias, A.; Wall, G.W.; Brooks, T.; Williams, D.G.; Thompson, T.L. Dynamics of Labile and Recalcitrant Soil Carbon Pools in a Sorghum Free-Air CO2 Enrichment (FACE) Agroecosystem. Soil Biol. Biochem. 2007, 39, 2250–2263. [Google Scholar] [CrossRef]
  11. Joseph, S.; Cowie, A.L.; Van Zwieten, L.; Bolan, N.; Budai, A.; Buss, W.; Cayuela, M.L.; Graber, E.R.; Ippolito, J.A.; Kuzyakov, Y.; et al. How Biochar Works, and When It Doesn’t: A Review of Mechanisms Controlling Soil and Plant Responses to Biochar. GCB Bioenergy 2021, 13, 1731–1764. [Google Scholar] [CrossRef]
  12. Khadem, A.; Raiesi, F.; Besharati, H.; Khalaj, M.A. The Effects of Biochar on Soil Nutrients Status, Microbial Activity and Carbon Sequestration Potential in Two Calcareous Soils. Biochar 2021, 3, 105–116. [Google Scholar] [CrossRef]
  13. Ghorbani, M.; Amirahmadi, E.; Neugschwandtner, R.W.; Konvalina, P.; Kopecký, M.; Moudrý, J.; Perná, K.; Murindangabo, Y.T. The Impact of Pyrolysis Temperature on Biochar Properties and Its Effects on Soil Hydrological Properties. Sustainability 2022, 14, 14722. [Google Scholar] [CrossRef]
  14. Gupta, D.K.; Gupta, C.K.; Dubey, R.; Fagodiya, R.K.; Sharma, G.; Keerthika, A.; Noor Mohamed, M.B.; Dev, R.; Shukla, A.K. Role of Biochar in Carbon Sequestration and Greenhouse Gas Mitigation. In Biochar Applications in Agriculture and Environment Management; Singh, J.S., Singh, C., Eds.; Springer International Publishing: Cham, Switzerland, 2020; pp. 141–165. ISBN 978-3-030-40996-8. [Google Scholar]
  15. Chen, D.; Liu, X.; Bian, R.; Cheng, K.; Zhang, X.; Zheng, J.; Joseph, S.; Crowley, D.; Pan, G.; Li, L. Effects of Biochar on Availability and Plant Uptake of Heavy Metals—A Meta-Analysis. J. Environ. Manag. 2018, 222, 76–85. [Google Scholar] [CrossRef]
  16. Ghorbani, M.; Neugschwandtner, R.W.; Konvalina, P.; Asadi, H.; Kopecký, M.; Amirahmadi, E. Comparative Effects of Biochar and Compost Applications on Water Holding Capacity and Crop Yield of Rice under Evaporation Stress: A Two-Years Field Study. Paddy Water Environ. 2023, 21, 47–58. [Google Scholar] [CrossRef]
  17. Yin, Y.; Yang, C.; Li, M.; Zheng, Y.; Ge, C.; Gu, J.; Li, H.; Duan, M.; Wang, X.; Chen, R. Research Progress and Prospects for Using Biochar to Mitigate Greenhouse Gas Emissions during Composting: A Review. Sci. Total Environ. 2021, 798, 149294. [Google Scholar] [CrossRef]
  18. Hossain, M.Z.; Bahar, M.M.; Sarkar, B.; Donne, S.W.; Ok, Y.S.; Palansooriya, K.N.; Kirkham, M.B.; Chowdhury, S.; Bolan, N. Biochar and Its Importance on Nutrient Dynamics in Soil and Plant. Biochar 2020, 2, 379–420. [Google Scholar] [CrossRef]
  19. Ippolito, J.A.; Cui, L.; Kammann, C.; Wrage-Mönnig, N.; Estavillo, J.M.; Fuertes-Mendizabal, T.; Cayuela, M.L.; Sigua, G.; Novak, J.; Spokas, K.; et al. Feedstock Choice, Pyrolysis Temperature and Type Influence Biochar Characteristics: A Comprehensive Meta-Data Analysis Review. Biochar 2020, 2, 421–438. [Google Scholar] [CrossRef]
  20. Zheng, H.; Wang, X.; Luo, X.; Wang, Z.; Xing, B. Biochar-Induced Negative Carbon Mineralization Priming Effects in a Coastal Wetland Soil: Roles of Soil Aggregation and Microbial Modulation. Sci. Total Environ. 2018, 610–611, 951–960. [Google Scholar] [CrossRef]
  21. Wang, J.; Xiong, Z.; Kuzyakov, Y. Biochar Stability in Soil: Meta-analysis of Decomposition and Priming Effects. GCB Bioenergy 2016, 8, 512–523. [Google Scholar] [CrossRef]
  22. Yang, F.; Xu, Z.; Huang, Y.; Tsang, D.C.W.; Ok, Y.S.; Zhao, L.; Qiu, H.; Xu, X.; Cao, X. Stabilization of Dissolvable Biochar by Soil Minerals: Release Reduction and Organo-Mineral Complexes Formation. J. Hazard. Mater. 2021, 412, 125213. [Google Scholar] [CrossRef]
  23. Gorovtsov, A.V.; Minkina, T.M.; Mandzhieva, S.S.; Perelomov, L.V.; Soja, G.; Zamulina, I.V.; Rajput, V.D.; Sushkova, S.N.; Mohan, D.; Yao, J. The Mechanisms of Biochar Interactions with Microorganisms in Soil. Environ. Geochem. Health 2020, 42, 2495–2518. [Google Scholar] [CrossRef]
  24. Zhou, X.; Zhu, Y.; Niu, Q.; Zeng, G.; Lai, C.; Liu, S.; Huang, D.; Qin, L.; Liu, X.; Li, B.; et al. New Notion of Biochar: A Review on the Mechanism of Biochar Applications in Advannced Oxidation Processes. Chem. Eng. J. 2021, 416, 129027. [Google Scholar] [CrossRef]
  25. Nidheesh, P.V.; Gopinath, A.; Ranjith, N.; Praveen Akre, A.; Sreedharan, V.; Suresh Kumar, M. Potential Role of Biochar in Advanced Oxidation Processes: A Sustainable Approach. Chem. Eng. J. 2021, 405, 126582. [Google Scholar] [CrossRef]
  26. Fan, Q.; Sun, J.; Chu, L.; Cui, L.; Quan, G.; Yan, J.; Hussain, Q.; Iqbal, M. Effects of Chemical Oxidation on Surface Oxygen-Containing Functional Groups and Adsorption Behavior of Biochar. Chemosphere 2018, 207, 33–40. [Google Scholar] [CrossRef]
  27. Sizmur, T.; Fresno, T.; Akgül, G.; Frost, H.; Moreno-Jiménez, E. Biochar Modification to Enhance Sorption of Inorganics from Water. Bioresour. Technol. 2017, 246, 34–47. [Google Scholar] [CrossRef]
  28. Ghorbani, M.; Konvalina, P.; Kopecký, M.; Kolář, L. A Meta-analysis on the Impacts of Different Oxidation Methods on the Surface Area Properties of Biochar. Land Degrad. Dev. 2023, 34, 299–312. [Google Scholar] [CrossRef]
  29. Leng, L.; Xiong, Q.; Yang, L.; Li, H.; Zhou, Y.; Zhang, W.; Jiang, S.; Li, H.; Huang, H. An Overview on Engineering the Surface Area and Porosity of Biochar. Sci. Total Environ. 2021, 763, 144204. [Google Scholar] [CrossRef]
  30. Cui, X.; Fang, S.; Yao, Y.; Li, T.; Ni, Q.; Yang, X.; He, Z. Potential Mechanisms of Cadmium Removal from Aqueous Solution by Canna Indica Derived Biochar. Sci. Total Environ. 2016, 562, 517–525. [Google Scholar] [CrossRef]
  31. Wei, Y.; Yang, W.; Wang, Z.; Yin, K.; Chen, T.; Liu, C. Enhanced Removal of As(III) by Heterogeneous Catalytic Oxidation of As(III) on Fe-Biochar Fibers with H2O2 and Hydroxylamine. Chem. Eng. J. 2022, 428, 131200. [Google Scholar] [CrossRef]
  32. Bian, S.; Xu, S.; Yin, Z.; Liu, S.; Li, J.; Xu, S.; Zhang, Y. An Efficient Strategy for Enhancing the Adsorption Capabilities of Biochar via Sequential KMnO4-Promoted Oxidative Pyrolysis and H2O2 Oxidation. Sustainability 2021, 13, 2641. [Google Scholar] [CrossRef]
  33. Tomczyk, A.; Szewczuk-Karpisz, K. Effect of Biochar Modification by Vitamin C, Hydrogen Peroxide or Silver Nanoparticles on Its Physicochemistry and Tetracycline Removal. Materials 2022, 15, 5379. [Google Scholar] [CrossRef]
  34. Blair, G.; Lefroy, R.; Lisle, L. Soil Carbon Fractions Based on Their Degree of Oxidation, and the Development of a Carbon Management Index for Agricultural Systems. Aust. J. Agric. Res. 1995, 46, 1459. [Google Scholar] [CrossRef]
  35. Kemper, W.D.; Chepil, W.S. Size Distribution of Aggregates. In Agronomy Monographs; Black, C.A., Ed.; American Society of Agronomy, Soil Science Society of America: Madison, WI, USA, 2015; pp. 499–510. ISBN 978-0-89118-203-0. [Google Scholar]
  36. Tyler, S.W.; Wheatcraft, S.W. Fractal Scaling of Soil Particle-Size Distributions: Analysis and Limitations. Soil Sci. Soc. Am. J. 1992, 56, 362–369. [Google Scholar] [CrossRef]
  37. Xu, L.; He, N.; Yu, G. Methods of Evaluating Soil Bulk Density: Impact on Estimating Large Scale Soil Organic Carbon Storage. CATENA 2016, 144, 94–101. [Google Scholar] [CrossRef]
  38. Burrell, L.D.; Zehetner, F.; Rampazzo, N.; Wimmer, B.; Soja, G. Long-Term Effects of Biochar on Soil Physical Properties. Geoderma 2016, 282, 96–102. [Google Scholar] [CrossRef]
  39. Li, M.; Xiong, Y.; Cai, L. Effects of Biochar on the Soil Carbon Cycle in Agroecosystems: An Promising Way to Increase the Carbon Pool in Dryland. IOP Conf. Ser. Earth Environ. Sci. 2021, 693, 012082. [Google Scholar] [CrossRef]
  40. El-Naggar, A.; Awad, Y.M.; Tang, X.-Y.; Liu, C.; Niazi, N.K.; Jien, S.-H.; Tsang, D.C.W.; Song, H.; Ok, Y.S.; Lee, S.S. Biochar Influences Soil Carbon Pools and Facilitates Interactions with Soil: A Field Investigation. Land Degrad. Dev. 2018, 29, 2162–2171. [Google Scholar] [CrossRef]
  41. Obia, A.; Mulder, J.; Martinsen, V.; Cornelissen, G.; Børresen, T. In Situ Effects of Biochar on Aggregation, Water Retention and Porosity in Light-Textured Tropical Soils. Soil Tillage Res. 2016, 155, 35–44. [Google Scholar] [CrossRef]
  42. Nan, H.; Yin, J.; Yang, F.; Luo, Y.; Zhao, L.; Cao, X. Pyrolysis Temperature-Dependent Carbon Retention and Stability of Biochar with Participation of Calcium: Implications to Carbon Sequestration. Environ. Pollut. 2021, 287, 117566. [Google Scholar] [CrossRef]
  43. Singh, H.; Northup, B.K.; Rice, C.W.; Prasad, P.V.V. Biochar Applications Influence Soil Physical and Chemical Properties, Microbial Diversity, and Crop Productivity: A Meta-Analysis. Biochar 2022, 4, 8. [Google Scholar] [CrossRef]
  44. Zhao, W.; Yang, H.; He, S.; Zhao, Q.; Wei, L. A Review of Biochar in Anaerobic Digestion to Improve Biogas Production: Performances, Mechanisms and Economic Assessments. Bioresour. Technol. 2021, 341, 125797. [Google Scholar] [CrossRef]
  45. Li, H.; Zhu, H.; Liang, C.; Wei, X.; Yao, Y. Soil Erosion Significantly Decreases Aggregate-Associated OC and N in Agricultural Soils of Northeast China. Agric. Ecosyst. Environ. 2022, 323, 107677. [Google Scholar] [CrossRef]
  46. Xiao, S.; Zhang, W.; Ye, Y.; Zhao, J.; Wang, K. Soil Aggregate Mediates the Impacts of Land Uses on Organic Carbon, Total Nitrogen, and Microbial Activity in a Karst Ecosystem. Sci. Rep. 2017, 7, 41402. [Google Scholar] [CrossRef] [PubMed]
  47. Demisie, W.; Liu, Z.; Zhang, M. Effect of Biochar on Carbon Fractions and Enzyme Activity of Red Soil. CATENA 2014, 121, 214–221. [Google Scholar] [CrossRef]
  48. Grunwald, D.; Kaiser, M.; Ludwig, B. Effect of Biochar and Organic Fertilizers on C Mineralization and Macro-Aggregate Dynamics under Different Incubation Temperatures. Soil Tillage Res. 2016, 164, 11–17. [Google Scholar] [CrossRef]
  49. Fungo, B.; Lehmann, J.; Kalbitz, K.; Thionģo, M.; Okeyo, I.; Tenywa, M.; Neufeldt, H. Aggregate Size Distribution in a Biochar-Amended Tropical Ultisol under Conventional Hand-Hoe Tillage. Soil Tillage Res. 2017, 165, 190–197. [Google Scholar] [CrossRef] [PubMed]
  50. Wang, D.; Fonte, S.J.; Parikh, S.J.; Six, J.; Scow, K.M. Biochar Additions Can Enhance Soil Structure and the Physical Stabilization of C in Aggregates. Geoderma 2017, 303, 110–117. [Google Scholar] [CrossRef]
  51. Grunwald, D.; Kaiser, M.; Junker, S.; Marhan, S.; Piepho, H.-P.; Poll, C.; Bamminger, C.; Ludwig, B. Influence of Elevated Soil Temperature and Biochar Application on Organic Matter Associated with Aggregate-Size and Density Fractions in an Arable Soil. Agric. Ecosyst. Environ. 2017, 241, 79–87. [Google Scholar] [CrossRef]
  52. Xu, G.; Li, Z.; Li, P. Fractal Features of Soil Particle-Size Distribution and Total Soil Nitrogen Distribution in a Typical Watershed in the Source Area of the Middle Dan River, China. CATENA 2013, 101, 17–23. [Google Scholar] [CrossRef]
  53. Albanese, L.; Baronti, S.; Liguori, F.; Meneguzzo, F.; Barbaro, P.; Vaccari, F.P. Hydrodynamic Cavitation as an Energy Efficient Process to Increase Biochar Surface Area and Porosity: A Case Study. J. Clean. Prod. 2019, 210, 159–169. [Google Scholar] [CrossRef]
  54. Kamali, M.; Sweygers, N.; Al-Salem, S.; Appels, L.; Aminabhavi, T.M.; Dewil, R. Biochar for Soil Applications-Sustainability Aspects, Challenges and Future Prospects. Chem. Eng. J. 2022, 428, 131189. [Google Scholar] [CrossRef]
  55. Omondi, M.O.; Xia, X.; Nahayo, A.; Liu, X.; Korai, P.K.; Pan, G. Quantification of Biochar Effects on Soil Hydrological Properties Using Meta-Analysis of Literature Data. Geoderma 2016, 274, 28–34. [Google Scholar] [CrossRef]
  56. Lu, S.; Zong, Y. Pore Structure and Environmental Serves of Biochars Derived from Different Feedstocks and Pyrolysis Conditions. Environ. Sci. Pollut. Res. 2018, 25, 30401–30409. [Google Scholar] [CrossRef]
Figure 1. SEM visualization of microstructure changes in pristine and oxidized biochars with magnitude of 500×. Arrows in first and second rows of images are pointing tiny pores on the surface of wheat straw biochars.
Sustainability 15 07158 g001aSustainability 15 07158 g001b
Figure 2. Effect of oxidized and pristine biochars derived from wheat straw and wood residues and produced at three pyrolysis temperatures (350, 450, and 550 °C) on soil organic carbon (OC). Different lowercase letters indicate a significant difference between treatments at p < 0.05. Bars represent standard errors (n = 3).
Sustainability 15 07158 g002
Figure 3. (a) Effect of oxidized and pristine biochars derived from wheat straw and wood residues and produced at three pyrolysis temperatures (350, 450, and 550 °C) on carbon pool index (CPI). Different lowercase letters indicate a significant difference between treatments at p < 0.05. Bars represent standard errors (n = 3). (b) Regression relation between CPI and pyrolysis temperature.
Sustainability 15 07158 g003
Figure 4. Effect of oxidized and pristine biochars derived from wheat straw and wood residues and produced at three pyrolysis temperatures (350, 450, and 550 °C) on mean weight diameter (MWD), and water stable aggregate (WSA). Different lowercase letters indicate a significant difference between treatments at p < 0.05. Bars represent standard errors (n = 3).
Sustainability 15 07158 g004
Figure 5. Effect of oxidized and pristine biochars derived from wheat straw and wood residues and produced at three pyrolysis temperatures (350, 450, and 550 °C) on fractal dimension (D). Different lowercase letters indicate a significant difference between treatments at p < 0.05. Bars represent standard errors (n = 3).
Sustainability 15 07158 g005
Figure 6. Comparison of measured and theoretical bulk density (BD) affected by oxidized and pristine biochars derived from wheat straw and wood residues and produced at three pyrolysis temperatures (350, 450, and 550 °C).
Sustainability 15 07158 g006
Figure 7. Regression relations between fractal dimension (D) and (a) bulk density (BD), (b) mean weight diameter (MWD), (c) water stable aggregate (WSA), and (d) organic carbon (OC).
Sustainability 15 07158 g007
Table 1. Characteristics of pristine and oxidized biochars made from wheat straw and wood residues at three different pyrolysis temperatures (350, 450, and 550 °C).
Feedstocks/
Biochars
pHCEC
(cmol(+)kg−1)
C
(%)
H
(%)
N
(%)
O
(%)
SSA
(m2 g−1)
TP
(cm3 g−1)
BD
(g cm−3)
Wheat straw7.01 ± 0.0412.7 ± 1.3477.1 ± 3.476.13 ± 0.362.53 ± 0.061.68 ± 0.2135.16 ± 1.230.006 ± 0.000.76 ± 0.02
Wood residue7.29 ± 0.039.08 ± 1.2580.8 ± 3.115.24 ± 0.281.91 ± 0.062.13 ± 0.4318.21 ± 1.010.003 ± 0.000.57 ± 0.01
BWS3507.04 ± 0.0362.7 ± 5.1255.4 ± 2.214.32 ± 0.242.31 ± 0.0721.2 ± 1.03103.9 ± 9.970.031 ± 0.000.42 ± 0.02
BWS4507.75 ± 0.0251.8 ± 3.8965.8 ± 3.523.04 ± 0.131.24 ± 0.0515.1 ± 0.98132.4 ± 12.10.037 ± 0.000.27 ± 0.01
BWS5509.02 ± 0.0139.1 ± 3.7266.9 ± 2.613.72 ± 0.320.81 ± 0.049.35 ± 0.53166.5 ± 15.30.043 ± 0.000.21 ± 0.01
BWR3508.41 ± 0.0445.7 ± 4.2968.5 ± 3.824.23 ± 0.221.36 ± 0.0618.3 ± 1.1289.62 ± 3.130.012 ± 0.000.38 ± 0.02
BWR4508.89 ± 0.0334.8 ± 4.1172.8 ± 2.063.84 ± 0.410.84 ± 0.0312.1 ± 0.9596.81 ± 8.020.015 ± 0.000.33 ± 0.01
BWR5509.41 ± 0.0525.3 ± 3.0178.1 ± 2.143.27 ± 0.210.58 ± 0.036.87 ± 0.26108.1 ± 9.840.022 ± 0.000.27 ± 0.01
O-BWS3504.22 ± 0.0574.2 ± 3.5252.2 ± 3.694.24 ± 0.361.38 ± 0.0926.3 ± 2.31136.1 ± 15.20.039 ± 0.000.26 ± 0.02
O-BWS4504.68 ± 0.0668.4 ± 4.8162.6 ± 5.213.15 ± 0.351.29 ± 0.0817.2 ± 2.04159.8 ± 10.10.045 ± 0.000.18 ± 0.01
O-BWS5504.89 ± 0.0553.1 ± 2.9868.9 ± 4.263.03 ± 0.241.12 ± 0.0913.5 ± 1.68191.5 ± 13.40.051 ± 0.000.12 ± 0.02
O-BWR3504.91 ± 0.0351.7 ± 3.4263.7 ± 5.124.17 ± 0.141.24 ± 0.0922.1 ± 2.1198.25 ± 6.240.019 ± 0.000.31 ± 0.01
O-BWR4505.34 ± 0.0643.5 ± 5.2866.8 ± 5.383.94 ± 0.230.95 ± 0.0618.2 ± 1.28113.7 ± 12.80.024 ± 0.000.25 ± 0.01
O-BWR5506.63 ± 0.0434.6 ± 3.5875.5 ± 5.143.18 ± 0.120.66 ± 0.0410.3 ± 1.36158.4 ± 14.70.036 ± 0.000.21 ± 0.02
CEC: cation exchange capacity, C: carbon, H: hydrogen, N: nitrogen, O: oxygen, SSA: Specific surface area, TP: total porosity, and BD: bulk density.
Disclaimer/Publisher’s Note: The statements, opinions and data contained in all publications are solely those of the individual author(s) and contributor(s) and not of MDPI and/or the editor(s). MDPI and/or the editor(s) disclaim responsibility for any injury to people or property resulting from any ideas, methods, instructions or products referred to in the content.