Article

Refined Simulation Study on the Effect of Scour Environments on Local Scour of Tandem Bridge Piers

College of Water Conservancy and Civil Engineering, Inner Mongolia Agricultural University, Hohhot 010018, China
*
Author to whom correspondence should be addressed.
Sustainability 2023, 15(9), 7171; https://doi.org/10.3390/su15097171
Submission received: 20 March 2023 / Revised: 19 April 2023 / Accepted: 23 April 2023 / Published: 25 April 2023

Abstract

:
Ice cover is a natural phenomenon unique to rivers in cold regions, and its existence is one of the reasons for the collapse of structural foundations of bridge piers across rivers. In order to understand the influence of different scouring environments on the hydrodynamics and sand bed morphology in the local scour holes around bridge pier foundations, this paper simulates the dynamic evolution process of the local scouring of tandem combination piers under open-flow and ice-cover environments, based on a turbulence model using the Reynolds-averaged Navier Stokes (RANS) method and a sediment transport model considering the slope collapse effect, respectively. This study also takes the vortex flow and shear stress distribution at different characteristic moments of the pier perimeter section as the penetration point to analyze the effect of the influence law of the scouring environment on the morphology and relative time scale of the scour hole, and makes a detailed comparison with the results of the indoor flume test. The results of this study show that: for local scouring in open-flow conditions, sediment initiation is doubly inhibited and the hydrodynamic forces in the scouring hole are weakened; the local scouring caused by ice cover contributes to the total scouring of the submerged pier within its coverage area, which significantly increases the depth and range of the local scouring hole; and, although the interaction of turbulent eddies and shear stress on the pier side is the main dynamic mechanism of the scouring generated around the pier, the two have a strong correlation. The results of this study, obtained by accurately quantifying the amount of eddies and shear stress around the pier, are the basis for the reasonable estimation of the maximum local scouring depth, which can provide a reference for the study of the evolution of the riverbed around submerged structures in cold areas and is essential to avoid structural damage to the piers and reduce the economic loss of traffic..

1. Introduction

Local scour due to water flow around submerged structures is one of the leading factors causing their degradation and is the result of the synergistic effect of the riverbed structure and the flow field of the fluid and the sediment particles. While bed shear stress and the vortex system structure are the fundamental driving forces for scour around column buildings [1,2,3], in view of the complexity regarding multiscale transport during the movement of both, empirical formulas are mostly used to predict the scour depth around submerged buildings in practical engineering [4,5]. Therefore, an in-depth study of bed shear stress and the vortex system structure, as well as of other characteristic quantities near the piers, can help us to understand the scouring process, explain the scouring mechanism, and provide a reliable reference for the engineering design of scouring depth.
Numerous scholars carrying out pier vicinity local scour research mainly base their studies on the hydraulic model test, as the physical model test is restricted by the scale effect and similar criterion; in addition, the research based on numerical simulations has received much attention [6,7,8]. Most of the refined simulations of natural riverbeds use Reynolds time-averaged methods to construct dynamic-bed simulation models and explore the influence of each turbulence model on the boundary layer flow field region, vortex system structure, and other characteristic quantities, among which the renormalized group (RNG) model, based on the RANS method, considers the multiple scales of vortices and has certain advantages for capturing turbulent motion with a high strain rate. Compared to the standard κ ε and κ ω models, they are characterized by a high computational accuracy, good solution stability, and fast solution speed [9,10,11].
The current knowledge on the local scour mechanism around bridge piers is in a transitional stage. Many scholars [12,13,14] have studied equilibrium scour around piers using numerical simulations, focusing on the evolution of the scour depth over time under open-flow conditions, whereas relatively few studies have been performed under ice-cover conditions. The presence of river ice alters the flow characteristics, which in turn, can have a potential impact on submerged sediment transport [15]. Roulund et al. [16] simulated the development and evolution of scour holes around cylindrical piers based on the k–w model and analyzed the influence of horseshoe eddies on scour in front of piers; Burkow et al. [17] performed scour simulations under open-flow conditions considering the bed-load factor, while Dixen et al. [18] made an enhanced correction for bed turbulent shear stress on the basis of Burkow and explored the contribution of bed load to scour; and Sui et al. [19] focused on the effect of changes in ice cover on the flow velocity distribution and turbulence characteristics and showed that ice cover has a large influence on the submerged bed shear stress and the sediment transport rate.
In order to study the scouring characteristics of the submerged pier circumference, this paper takes the Yellow River Special Bridge in Tuoketuo County, Inner Mongolia, a tandem equal-diameter pier (see Figure 1), as the prototype, and conducts numerical simulation studies under open-flow conditions and ice-cover conditions using the RNG turbulence model. The transient shear stress of the bed surface and the vorticity of the cross-section were selected to study the evolution of the scour topography characteristics around the piers and the structural characteristics of the scour holes, to construct the scour depth as a function of time development, and to verify the applicability of the numerical simulation by combining the scaled model test, with the aim of clarifying the foundation scour mechanism around the piers. There is a lack of numerical simulation studies on bridge pier scour applicable to an ice-cover environment, and the simulation results of this paper are good and can supplement the research gaps in related fields.
The remainder of this article is structured as follows: Section 2 presents the types of architectures of the studied numerical model; Section 3 presents the validation of the applicability of the model; Section 4 presents the analysis of the studied characteristic quantities, which are further discussed in Section 5. Finally, the conclusions stemming from this study are presented.

2. Numerical Model

The reliability of the computational fluid dynamics (CFD) simulation of scour is limited by the current characteristics of the flow field around the submerged bridge piers and the effective estimation of sediment transport. Therefore, the reasonable selection of a turbulence model is the key to capturing the flow field characteristics, and the accurate application of the sediment transport equation is the main point for carrying out the scour depth calculation.

2.1. Hydraulics Model

2.1.1. Governing Equation

The hydrodynamic calculations use the continuity equations for incompressible Newtonian fluids based on the Sabbagh-Yazdi assumptions as well as the equations of motion, both of which confine the flow motion, and the area and volume parameter terms are introduced in the two types of equations that simulate the fluid motion through the software’s built-in fractional area/volume obstacle representation (FAVOR) grid technology. The governing equation expressions [20] are as follows:
d i v ( V ) = 0
u t + d i v ( u V ) = 1 ρ [ P x + d i v ( μ   g r a d   u ) ]
v t + d i v ( v V ) = 1 ρ [ P y + d i v ( μ   g r a d   v ) ]
w t + d i v ( w V ) = 1 ρ [ P z + d i v ( μ   g r a d   w ) ]
where V is the velocity field; ρ is the mass density of the fluid; P is the pressure; t is the time; μ is the dynamic viscosity; u , v , and w are the coordinates of the velocity vector(field), respectively.

2.1.2. Turbulence Model

In CFD, a unique discretization method is usually used to discretize the Navier–Stokes (N-S) equations on the computational grid to obtain an approximation of the flow field parameters at spatially discrete points; since the N-S equations are not closed and the simulation solution process is averaged on the spatio-temporal scale, which leads to their non-closure, a turbulence model is needed to simulate the complex boundary field, which is then solved to obtain the discrete equations [21].
In the riverbed scour problem, influenced by the coupling of many factors, the base scour of submerged structures is involved in a dynamic evolution process with a high Reynolds number, and most of the flow field is turbulent. The use of turbulence models in different problems dealing with energetic water flow is highly important, has been the topic of a great number of studies, and has received the attention of researchers over last decade, as discussed by Tavakoli et al. [22]; thus, an accurate simulation of the turbulence characteristics of the flow field domain is the key to calculating the scour depth. Currently, the main turbulence simulations can be broadly classified as a direct numerical simulation (DNS), large eddy simulation (LES), and Reynolds average numerical simulation (RANS) [23,24,25].
In order to finely capture the development process of scour holes around the bridge piers and obtain the non-constant characteristics of the circumferential flow around the piers, the RNG model based on the RANS equation is chosen in this paper. Compared with other models, the RNG model has lower computational cost and higher computational efficiency. Its control equation [26] is as follows:
k t + u j k x j = x j [ α κ ν k x j + 2 ν t S i j ε ]
ε t + u j ε x j = x j [ α ε ν ε x j ] + 2 c 1 ν t S i j ε k R c 2 ε 2 k
where k is the Reynolds average kinetic energy; ε is the turbulent kinetic energy dissipation rate; v is the fluid viscosity coefficient; v t is the vortex viscosity coefficient; S is the strain rate tensor; and c 1 and c 2 are model coefficients.

2.2. Riverbed Deformation Model

2.2.1. Sediment Incipient Motion

Sediment initiation is usually determined using shear stress and flow rate discriminant criteria. The local Shields number on the horizontal bed is solved with the dimensionless form of the bottom shear stress as follows [26]:
θ s = τ ( ρ s ρ f ) g d s
where τ is the bottom shear stress; ρ s and ρ f are the sediment and fluid density, respectively; d s is the sediment particle size; and g is the gravitational acceleration.
With the development of local scour, the change in bed slope affects the bed-load transport, which in turn, affects the critical sediment starting conditions and bed shear stress; thus, the critical shear stress relationship when considering the change in slope is expressed by introducing a coefficient as follows [27]:
τ c r = r τ 0
r = 1 ( 1 η tan ϕ ) tan ϕ { ( cos β sin θ + sin β sin α + η tan 2 ϕ cos 2 θ sin 2 α ) + [ ( cos β sin θ + sin β sin α + η tan 2 ϕ cos 2 θ sin 2 α ) 2 + ( 1 η 2 tan 2 ϕ ) × ( cos 2 θ tan 2 ϕ sin 2 α tan 2 ϕ sin 2 θ sin 2 α ) ] 0.5 }
where τ c r and τ 0 are the critical shear stress in the sloping bed and the critical shear stress in the flat bed, respectively; r is the correction factor; θ is the longitudinal slope; α is the transverse slope; β is the angle of inclination of flow with respect to the longitudinal axis of the channel; η is the ratio of lift force to drag force; and ϕ is the sediment repose angle.
The calculation of the critical Shields number θ c s for sediment particles is then determined by solving for the dimensionless particle size [26]:
d , s = d s [ ρ f g / μ f 2 ] 1 / 3
where d , s is dimensionless particle size of the sediment; d s is sediment particle size; μ f is the hydrodynamic viscosity coefficient; and g is the magnitude of the acceleration of gravity.
Most of the software modules use the dimensionless critical Shields number as a condition for judging sediment initiation (default value is 0.05), and in this paper, the critical Shields number is calculated based on the Soulsby–Whitehouse equation [28].
θ c r , s = 0.3 1 + 1.2 d , s + 0.055 [ 1 exp ( 0.02 d , s ) ]
Considering that the settling of sediment particles on the bed is influenced by the slope and is prone to a down-slope motion under the interaction of water flow, the slope correction of Equation (11) is made according to the repose angle of sediment particles as follows [25]:
θ c r , s = θ c r , s [ cos ψ sin β + cos 2 β tan 2 ϕ sin 2 ψ sin 2 β ] / tan ϕ
where β and ψ are the angle of the slope of the river bed and the angle between the direction of water movement on the sloping bed and the reverse slope direction, respectively, and ϕ is the sediment repose angle (the default value of 32° is taken in this paper).

2.2.2. Sediment Transport

In the process of the local scouring of bridge piers, the movement of sediment particles around the piers occurs in two forms, suspended sand and sedimentary sand, and the relative importance of the two is influenced by the non-uniformity of the sediment particles, the riverbed structure, and the water flow conditions. For the complex water and sand conditions of a natural riverbed, the movement of sediment particles is bounded by the critical particle size: when the particle size exceeds a certain limit, the sediment transport form is dominated by the bed load, and when it is below this limit, it is dominated by the suspended load. The expression is [29]:
D c = U 2 / 360 g
where U is the mean approach flow velocity, and g is the acceleration of gravity.
In the calculation domain of this model, the average current velocity is 0.30 m/s, and the sediment particle size chosen for the hydraulic model test is 0.65 mm, which is much larger than the critical particle size of 0.026 mm; thus, the main form focused on in this research is the bed load, and the influence of the suspended load is not considered for the time being.

2.2.3. Sediment Scour Model

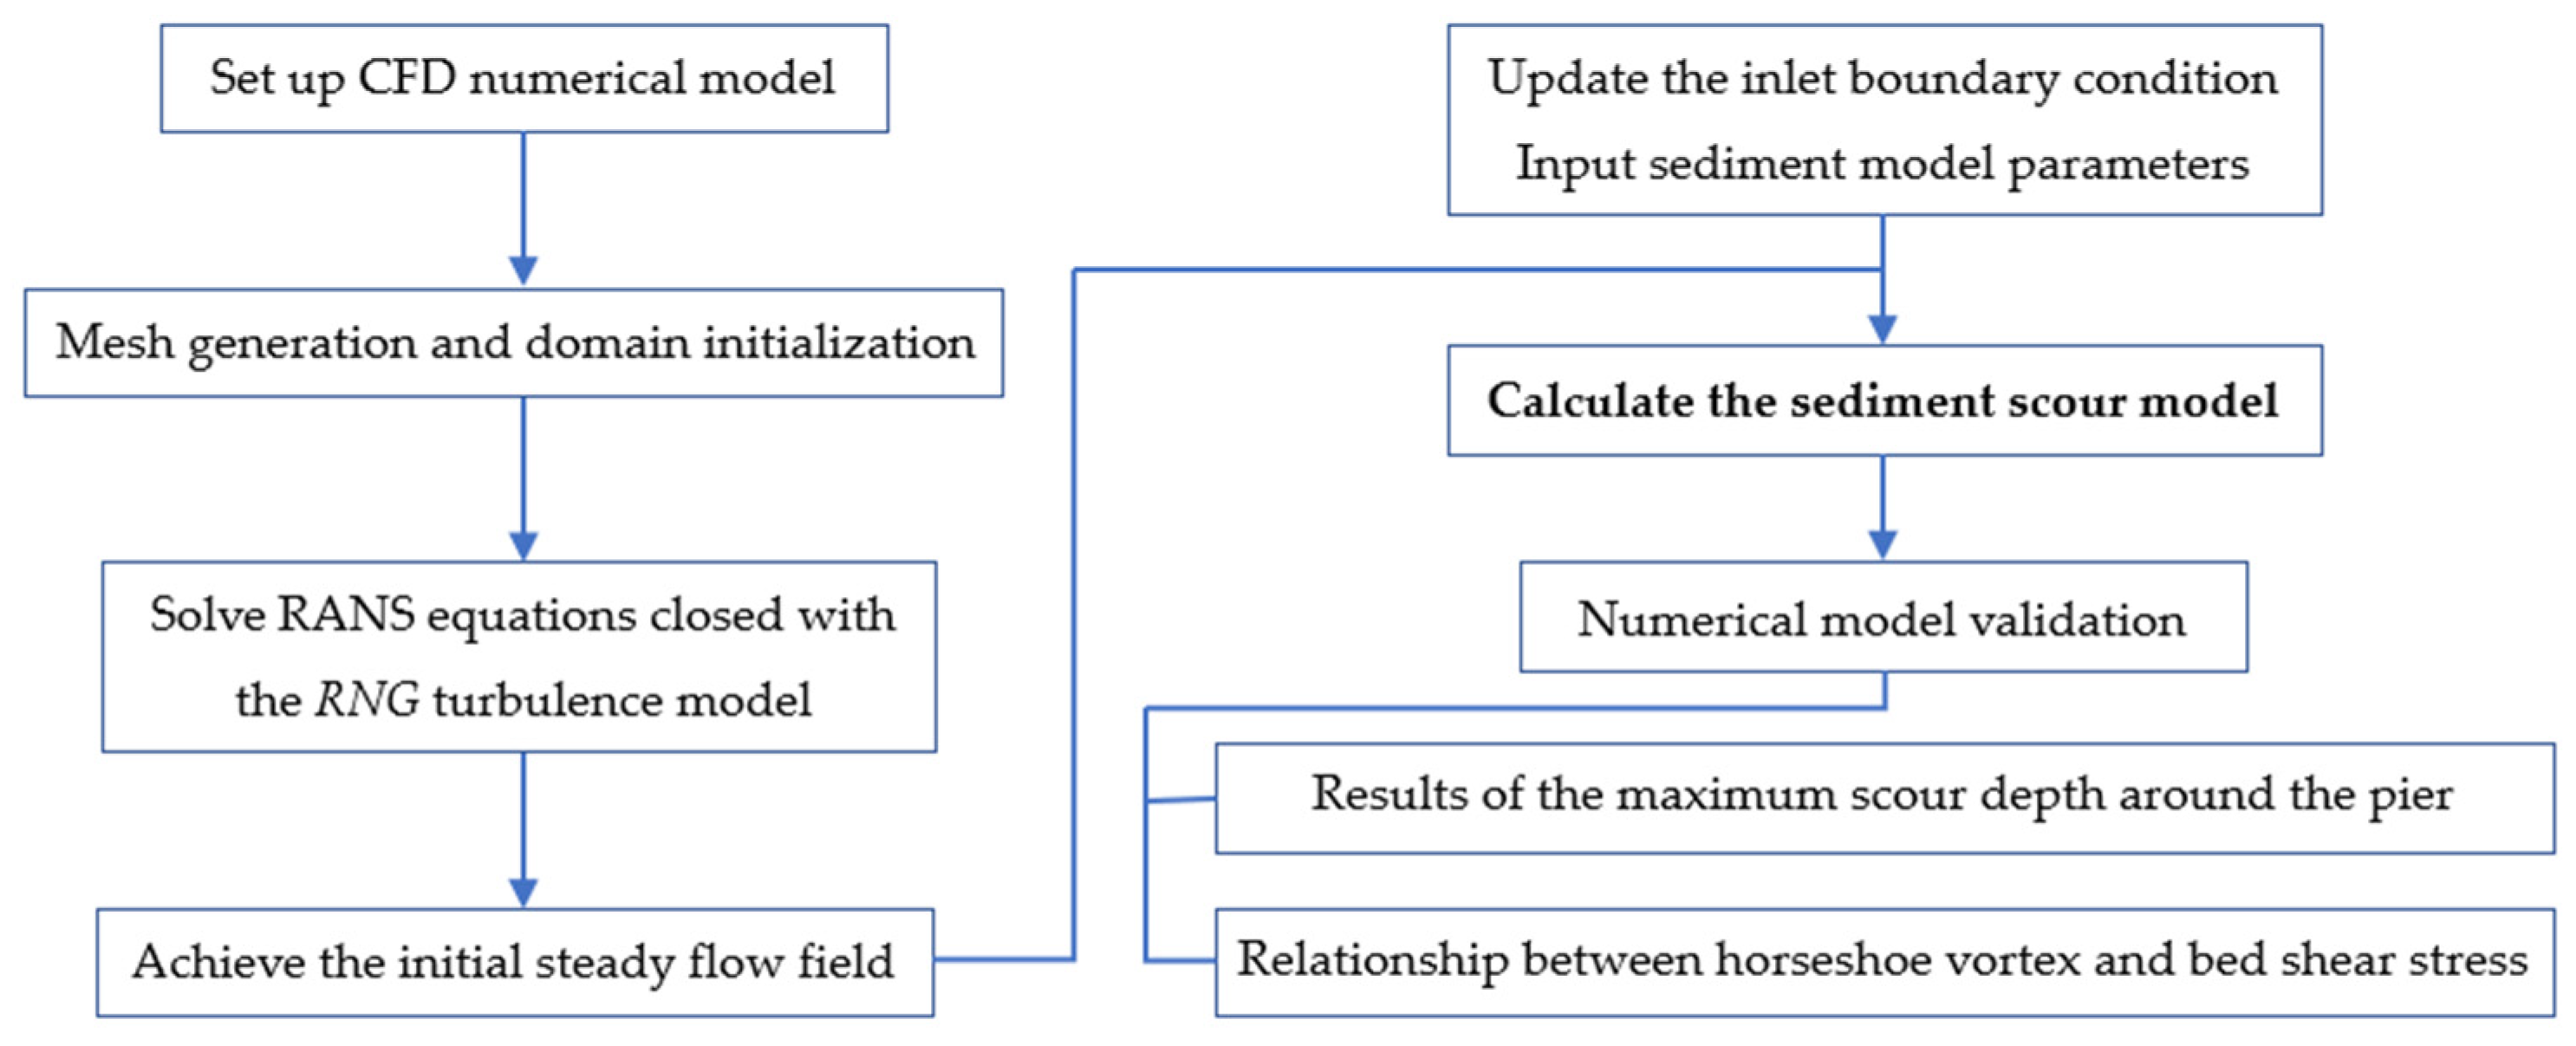
The suspension, sedimentation, and transport of sediment is a complete system, and the sediment starting suspension, as the initial condition and basic link, is the key to exploring the coupled transport movement of water and sand, where Figure 2 illustrate the calculation process of the numerical model.
  • Sediment entrainment and sedimentation calculation
The turbulent diffusion of water flow leads to the entrainment and sedimentation movement of submerged sediment particles. A sediment entrainment and sedimentation calculation model was constructed based on the theoretical framework proposed by Mastbergen [30], and Zhang [31] used this model to simulate the scouring of three arrangements of upright cylindrical pier circumferences, achieving better results. Therefore, this model is selected for the calculation of sediment entrainment and settlement in this paper, in which the lifting velocity of the sediment particles held by the water is calculated with the following equation [30]:
u r = α i n s d , s 0.3 ( θ s θ c r , s ) 1.5 d 50 ( ρ s ρ ) g / ρ
where d , s is dimensionless particle size of the sediment; d 50 is the median sediment grain size; ρ s is the density of the sediment species; ρ is the fluid density; α i is the entrainment coefficient of sediment particles (the default value in this paper is 0.018); and n s is the outer normal vector of the bed-load surface.
The sedimentation and entrainment of sediment particles are two relative processes, which are often synchronous. In this paper, the settlement velocity calculation formula of Soulsby [28] is adopted:
u d = v [ ( 10.36 2 + 1.049 d , s 3 ) 0.5 10.36 ] / d 50
where v is the kinematic viscosity coefficient of the fluid.
2.
Bed-load transport equation
The strong stochasticity, multi-scalability, and polymorphism of the bed-load transport process lead to high-frequency coupling between the water flow and sediment particles near the bottom bed, which significantly affects the transport process of the bed-load sediment. Therefore, the key to considering the sediment transport characteristics is to calculate the bed-load sediment transport rate. The scour module in this paper adopts the Meyer-Peter [32] bed-load sediment transport rate equation:
Φ s = q b / ( g d 3 ) 0.5 = B s ( θ s θ c s ) 1.5
where Φ s is the dimensionless sediment transport intensity; B s is the bed-load coefficient (the default value in this paper is 8.0); q b is the volume transfer rate per unit width of the bed surface; and = ( ρ s ρ ) / ρ , that is, the relative density of bed sand.
The thickness of the bed-load transport layer is estimated with the van Rijn [33] formula:
δ s = 0.3 d s d * , s 0.7 [ ( θ s θ c r , s ) / θ c r , s ] 0.5
To solve the movement of sediment particles on the bed surface per unit volume, the bed-load flow rate is converted using the following formula [33]:
u b , s = q b / δ s f s c b , s
where f s is the critical accumulation percentage of the bed load, and c b , s is the volume percentage of particles on the bed surface.
The bed-load sediment movement is more active in the near-bottom riverbed area around the pier, and the interaction between water and sediment is judged by calculating the mass concentration of the bed-load sediment.
c b , s = u b , s / ρ s

3. Model Validation

3.1. Verification Conditions

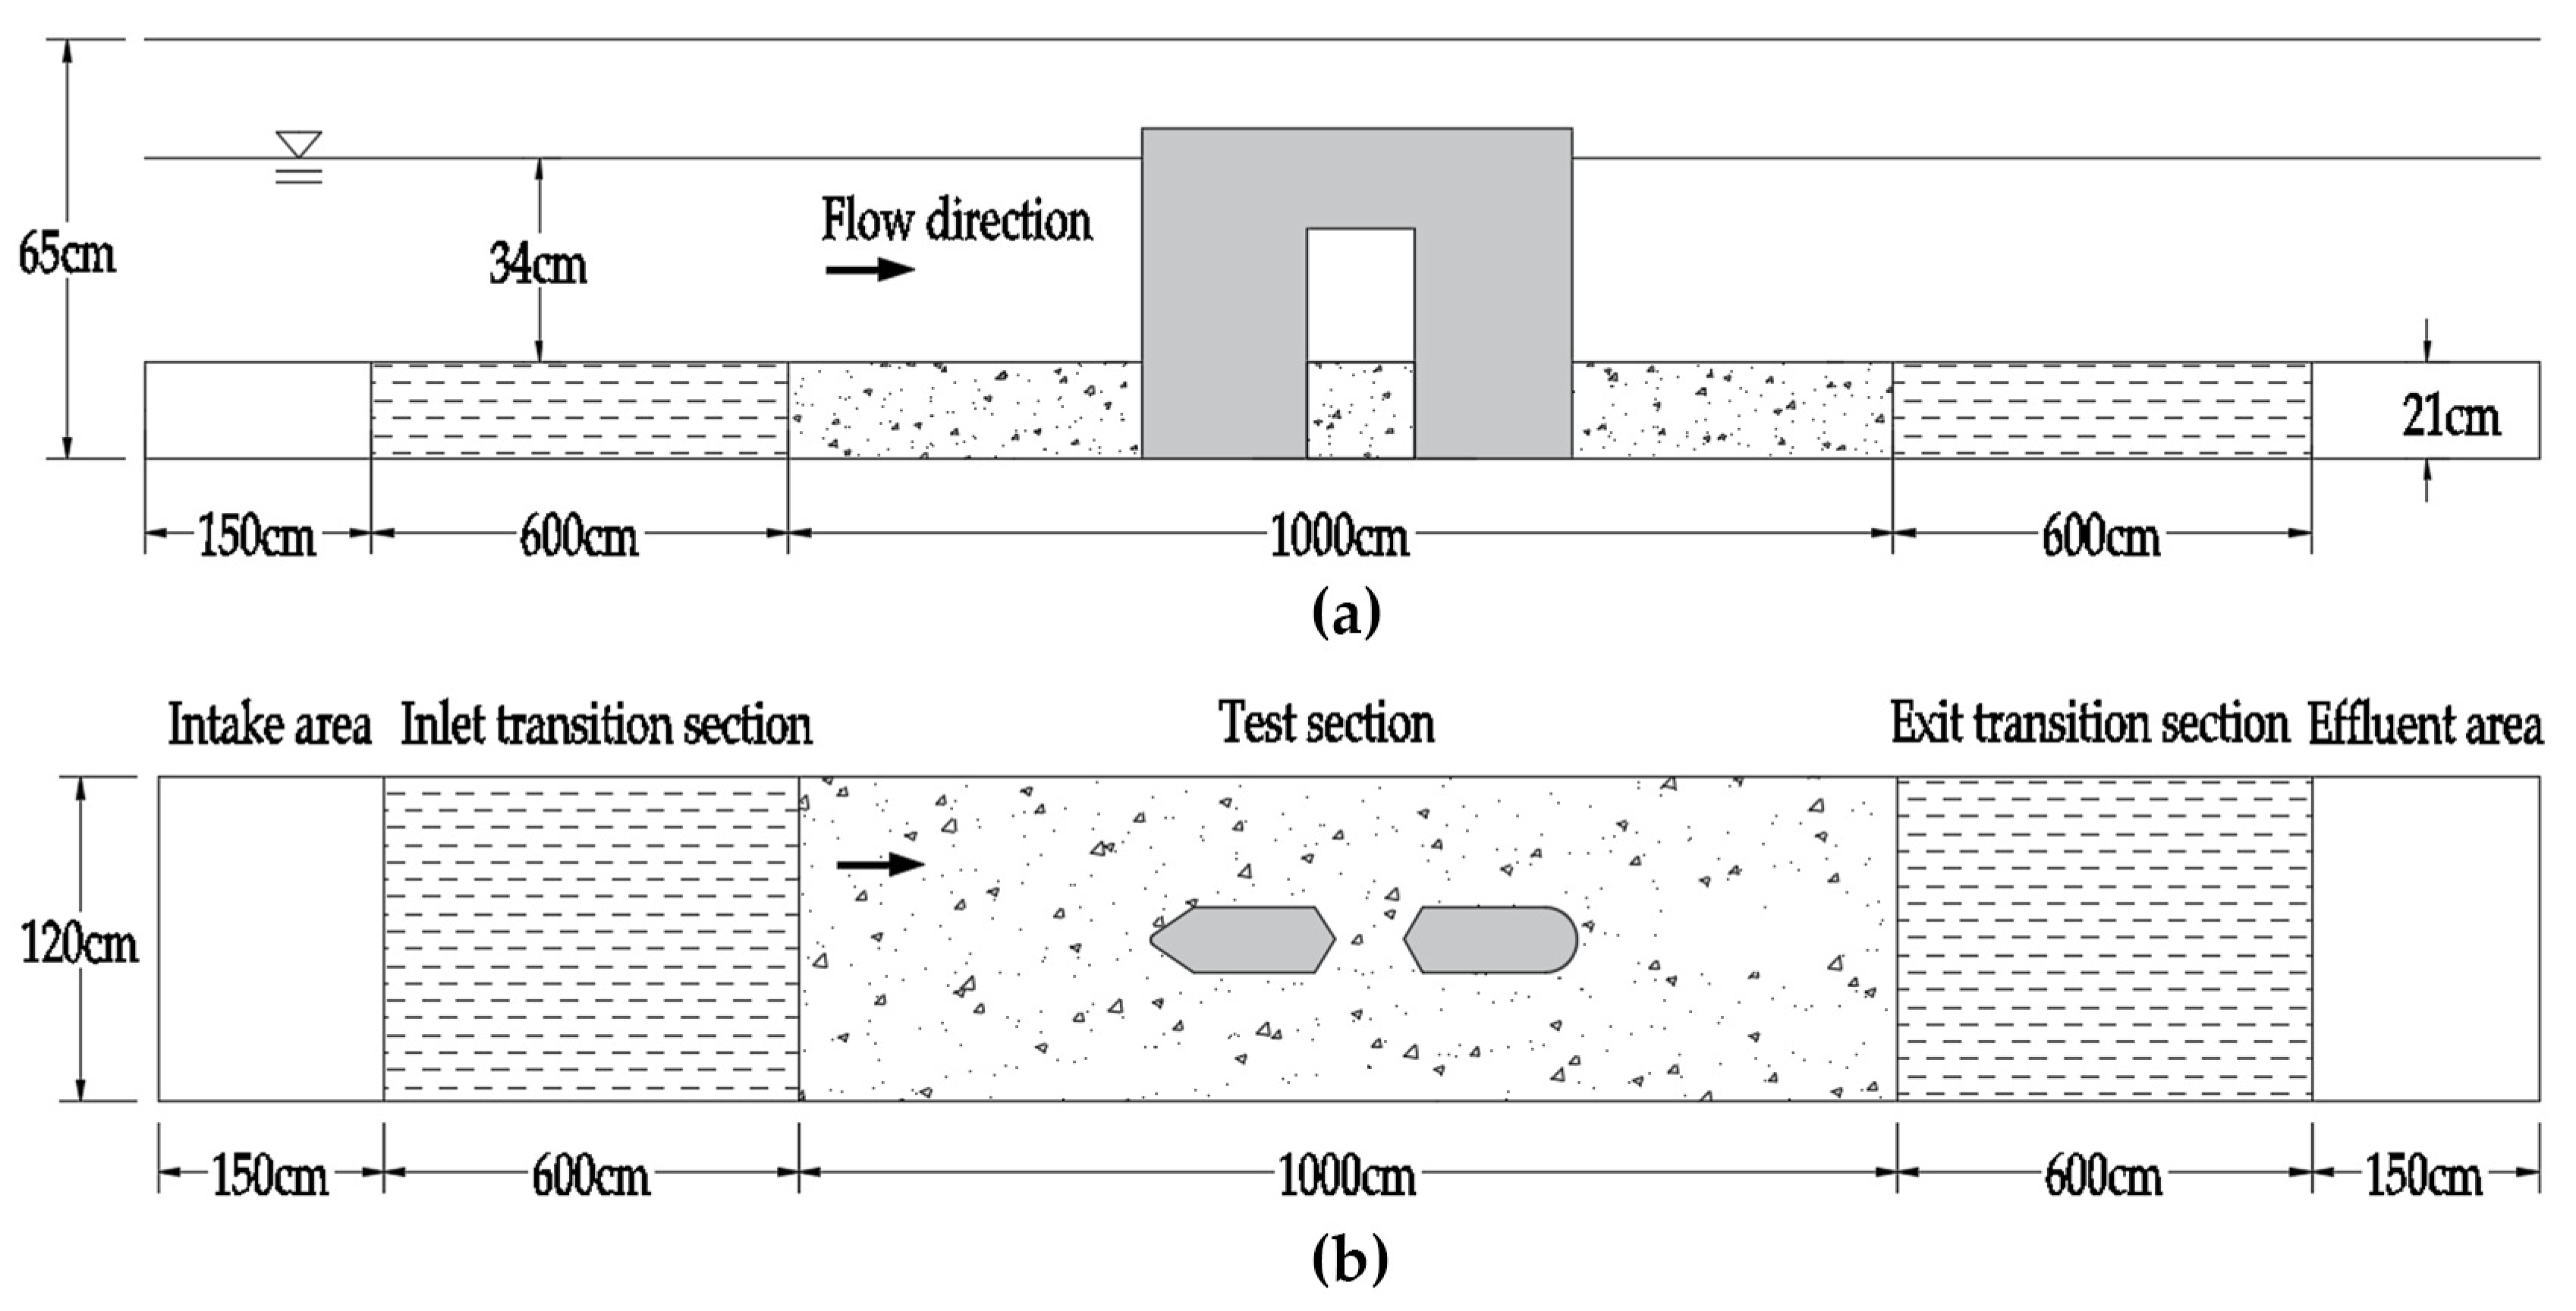
In this paper, the numerical simulation results were selected to verify the indoor dynamic-bed scouring test. The dynamic-bed test was carried out in the hydraulic model laboratory of Inner Mongolia Agricultural University, and the test flume was arranged as shown in Figure 3. The straight-walled measuring flume was 2500 cm long, 120 cm wide and 65 cm deep, of which the central dynamic-bed test section was 1000 cm long and 21 cm deep, and the front and rear fixed-bed test sections were 600 cm long so that the approach flow could be smoothly transitioned to the front of the pier.
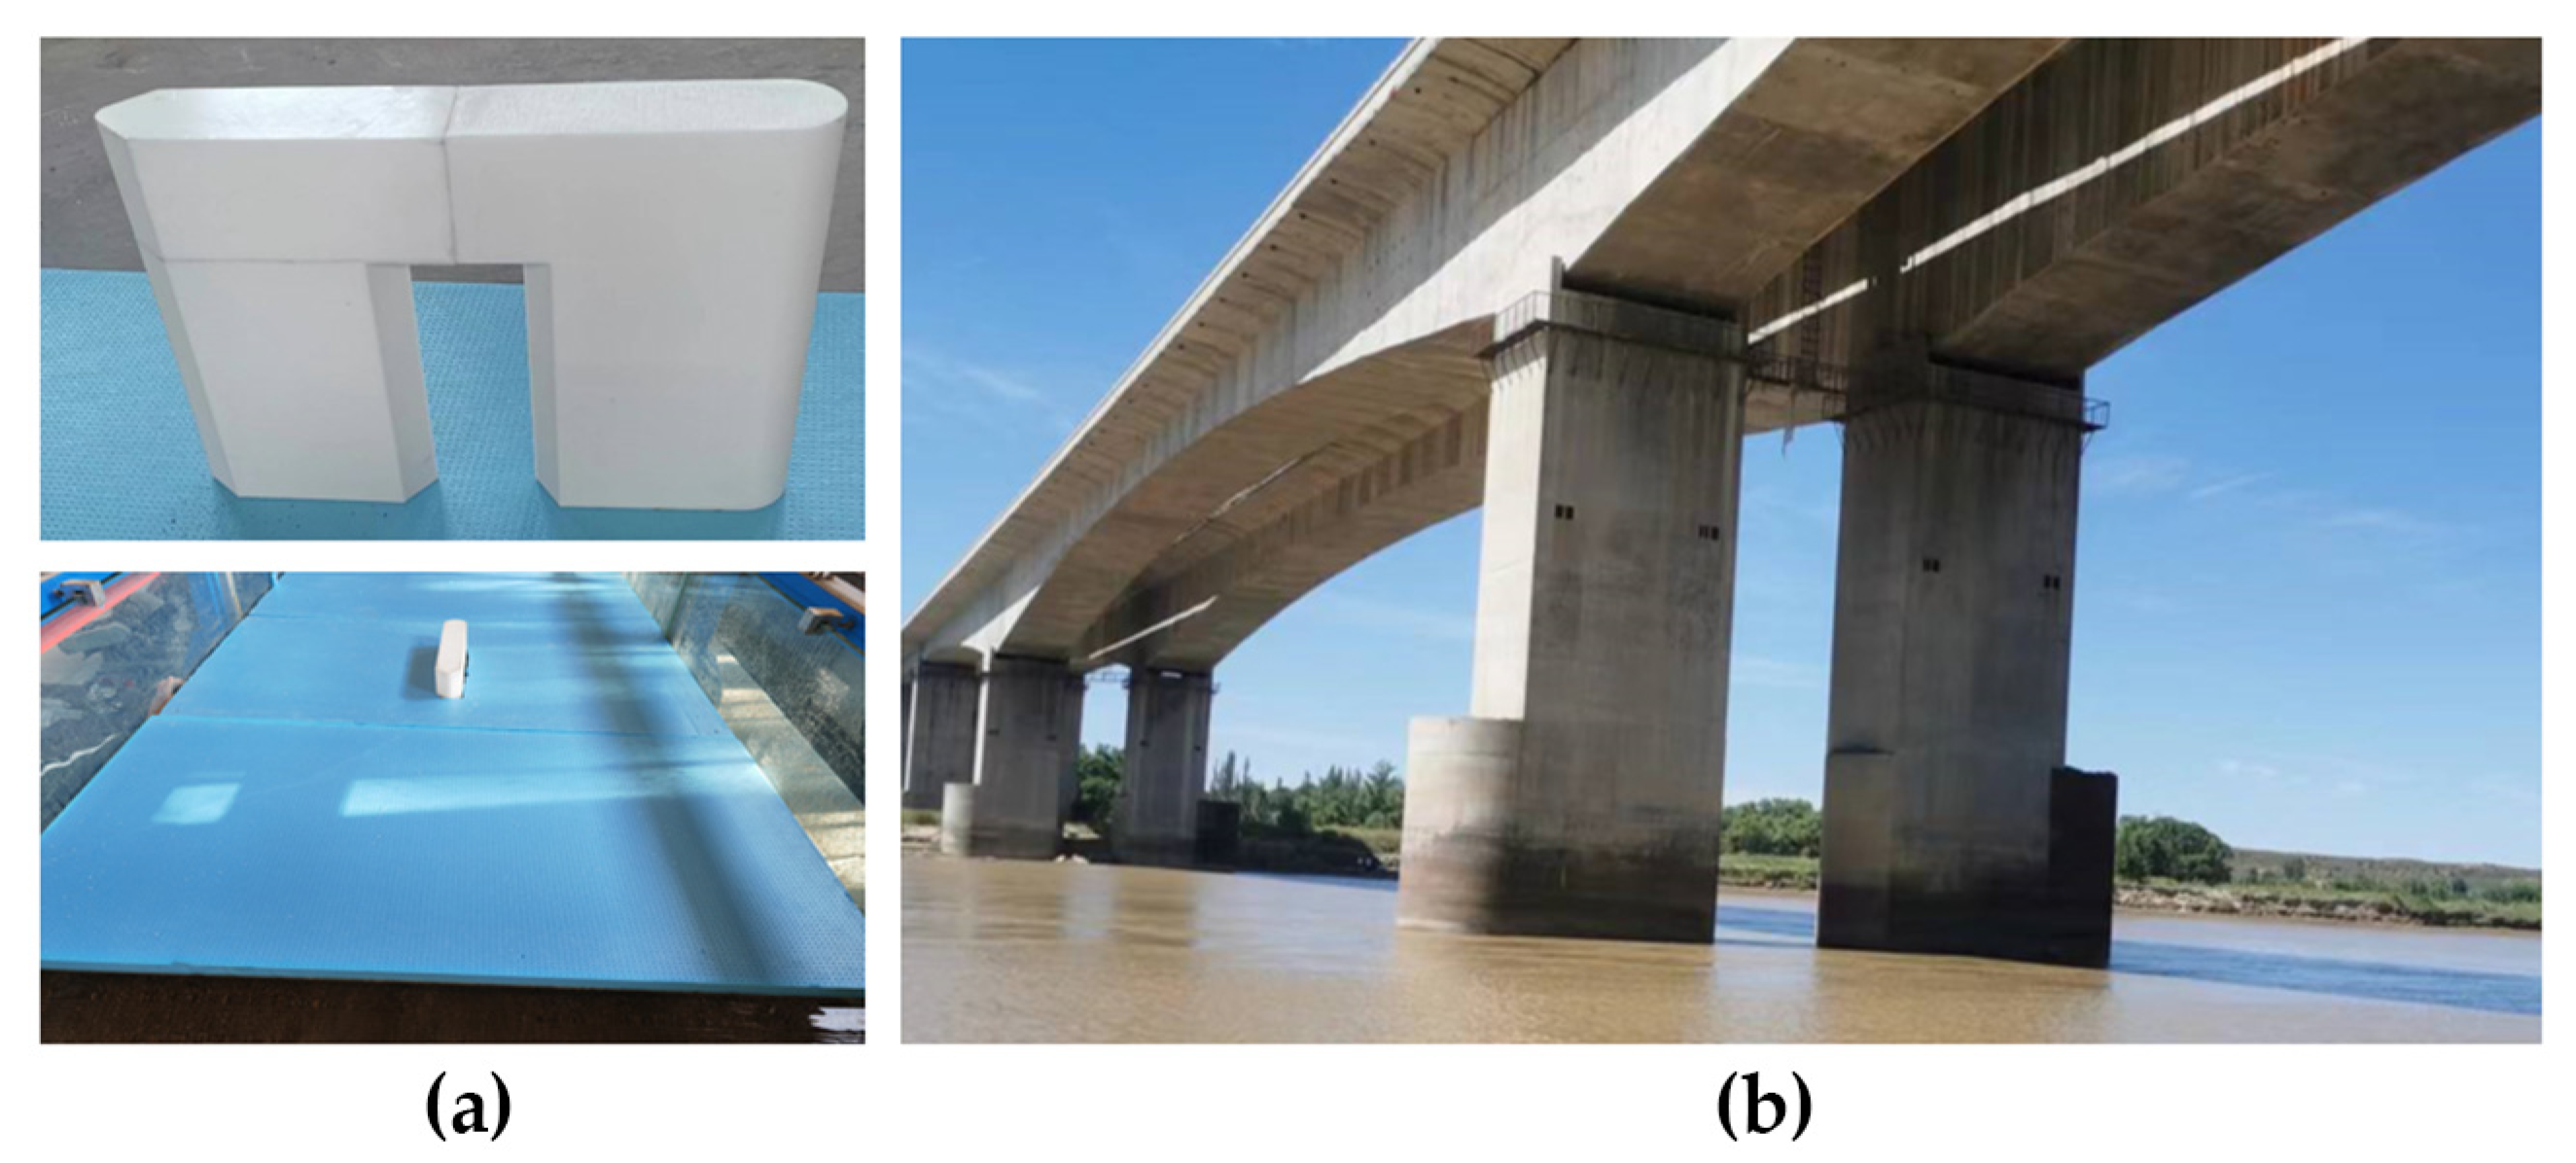
The model of the bridge pier in the dynamic-bed test section for the field measurements was based on the combination of equal-diameter piers, according to the 1:150 scaled-down model; the model pier diameter width D was 4.8 cm, the front and rear pier spacing was 8.6 cm, and the overall pier length was 24.3 cm, as shown in Figure 4. The non-homogeneous sand with a median particle size of 0.51 mm and 0.63 mm (geometric standard deviation [34] greater than 1.2) was laid at the bottom of the test section to simulate the riverbed conditions; the test was conducted under open-flow conditions and ice-cover conditions for scour simulation, and under ice-cover conditions, polystyrene foam sheets (with a thickness of 3 cm) were used at the top of the test section to simulate the fixed ice cover. and the maximum scour depth around the pier during the test run. If the increase rate does not exceed 5% of the pier diameter width in 24 h, the local scour of the pier is considered to have reached a quasi-equilibrium state [35].

3.2. Computational Domain and Grid Information

Considering the timeliness and accuracy of the numerical model calculation, the corresponding three-dimensional turbulence model was constructed in this paper with reference to the modeling method of Farooq [36] (see Figure 5). The test piers were kept dimensionally consistent between the numerical model and the physical model, where the X-axis length was 24.3 cm, the Y-axis width was 4.8 cm, and the Z-axis height was 60 cm. The overall geometric model was divided into computational domains based on the hierarchical architecture, where the bed sand domain z = −21–0 cm, the water domain z = 0–34 cm, the air domain (open-flow conditions) z = 34–44 cm, and the ice-cover domain (ice-cover conditions) z = 31–34 cm. For the fixed-bed or dynamic-bed numerical model tests, the size of the entire computational domain was limited by the diameter of the model piers; the computational domain established in this study fully accounted for the hydrodynamic characteristics, with a total longitudinal length of 29D, a distance of 8D from the inlet boundary to the front pier and a distance of 16D from the outlet boundary to the rear pier, allowing for the water flow in the area in front of and behind the pier to fully develop and the flow pattern to not be disturbed. The pier was located in the center of the computational domain, and the total transverse width was 13D; the flow pattern in the pier-side area was not affected by the side wall contraction effect. In order to avoid the sand bed at the entrance/exit boundary from being scoured by the approach flow, the high and wide scour prevention plates of equal height were laid in the front and rear sections of the model sand bed as the bed fixing area, and their surface roughness was consistent with that of the sand bed.
The quality of the grid division is directly related to the identification of the turbulent vortex strength and the accuracy of the shear layer feature extraction. In this paper, a structured grid was used for the non-constant calculation of local scour, in which the finite volume method was used for spatial discretization and the second-order implicit function was used for temporal discretization. The nested grid form (see Figure 6) was used for local encryption of the pier circumference, which not only effectively compresses the number of grids to improve the convergence speed, but also finely simulates the flow pattern changes and sediment transport process. The entire grid area was divided into two layers symmetrically along the longitudinal axis of the bridge pier, and the ratio of the inner-layer to outer-layer grid size was 1:2, where the inner-layer encrypted area side length was 21D × 8D × 9D and the grid size was 0.08D. According to the two-stage design operation, in the first stage of pure flow turbulence development, the total number of grids in the area was 900,000; in the second stage of the bridge pier local scour, the total number of inner-layer and outer-layer grids was 1.51 million, of which the number of inner-layer nested grids was 1.35 million.

3.3. Numerical Solutions and Boundary Conditions

The strategy for numerical solution is to discretize the grid nodes in the computational domain in time and space by resolving their strain relations; in this study, the finite difference method was chosen to discretize the algebraic equations, and the system of control equations with specific boundary conditions was solved by expanding the Taylor series to retain the higher-order difference terms. The specific expansion [37] is as follows:
Φ n = Φ n + 1 Δ x 1 ! ( Φ x ) 2 + 1 2 ! ( Δ x ) 2 ( 2 Φ x 2 ) 2
Φ n + 2 = Φ n + 1 + Δ x 1 ! ( Φ x ) 2 + 1 2 ! ( Δ x ) 2 ( 2 Φ x 2 ) 2 +
A suitable domain boundary can simulate the realistic flow field around the pier. In order to make the turbulent flow in the inlet boundary layer reach the steady state after sufficient development, the grid-covered boundary was chosen to solve the problem in this paper, as it characteristically allows for the results of the flow operation in the previous stage to be assigned to the domain boundary in the current stage [38]. Therefore, the dynamic-bed scour simulation in this study was based on the fixed-bed bypass simulation for the continuation calculation, whose inlet boundary was the grid-covered boundary, the outlet boundary was the free outflow boundary, the top boundary was the pressure boundary and the other boundary was the no-slip boundary (see Figure 5).

3.4. Validation Results

The reliability and accuracy of the scour model calculation results were verified based on the dynamic-bed scour test of the numerical and physical models under the open-flow conditions, and Figure 7 shows the comparison of the scour hole shape at the scour equilibrium. It can be seen visually that the final scour hole shape obtained from the numerical simulation of this paper is almost the same as that of the physical model test. The scour holes around the upstream and downstream piers have a whole shape and do not keep their own independent scour holes, but only form a small scour volume separation zone between the front and rear piers. The topography along both sides of the scour holes around the piers is flat, and sand dunes at the end of the downstream piers obviously accumulate and are “tail fin shaped”. Overall, the distribution trends of the model piers are basically consistent, and the simulation results can be an approximate substitute for the measured results.
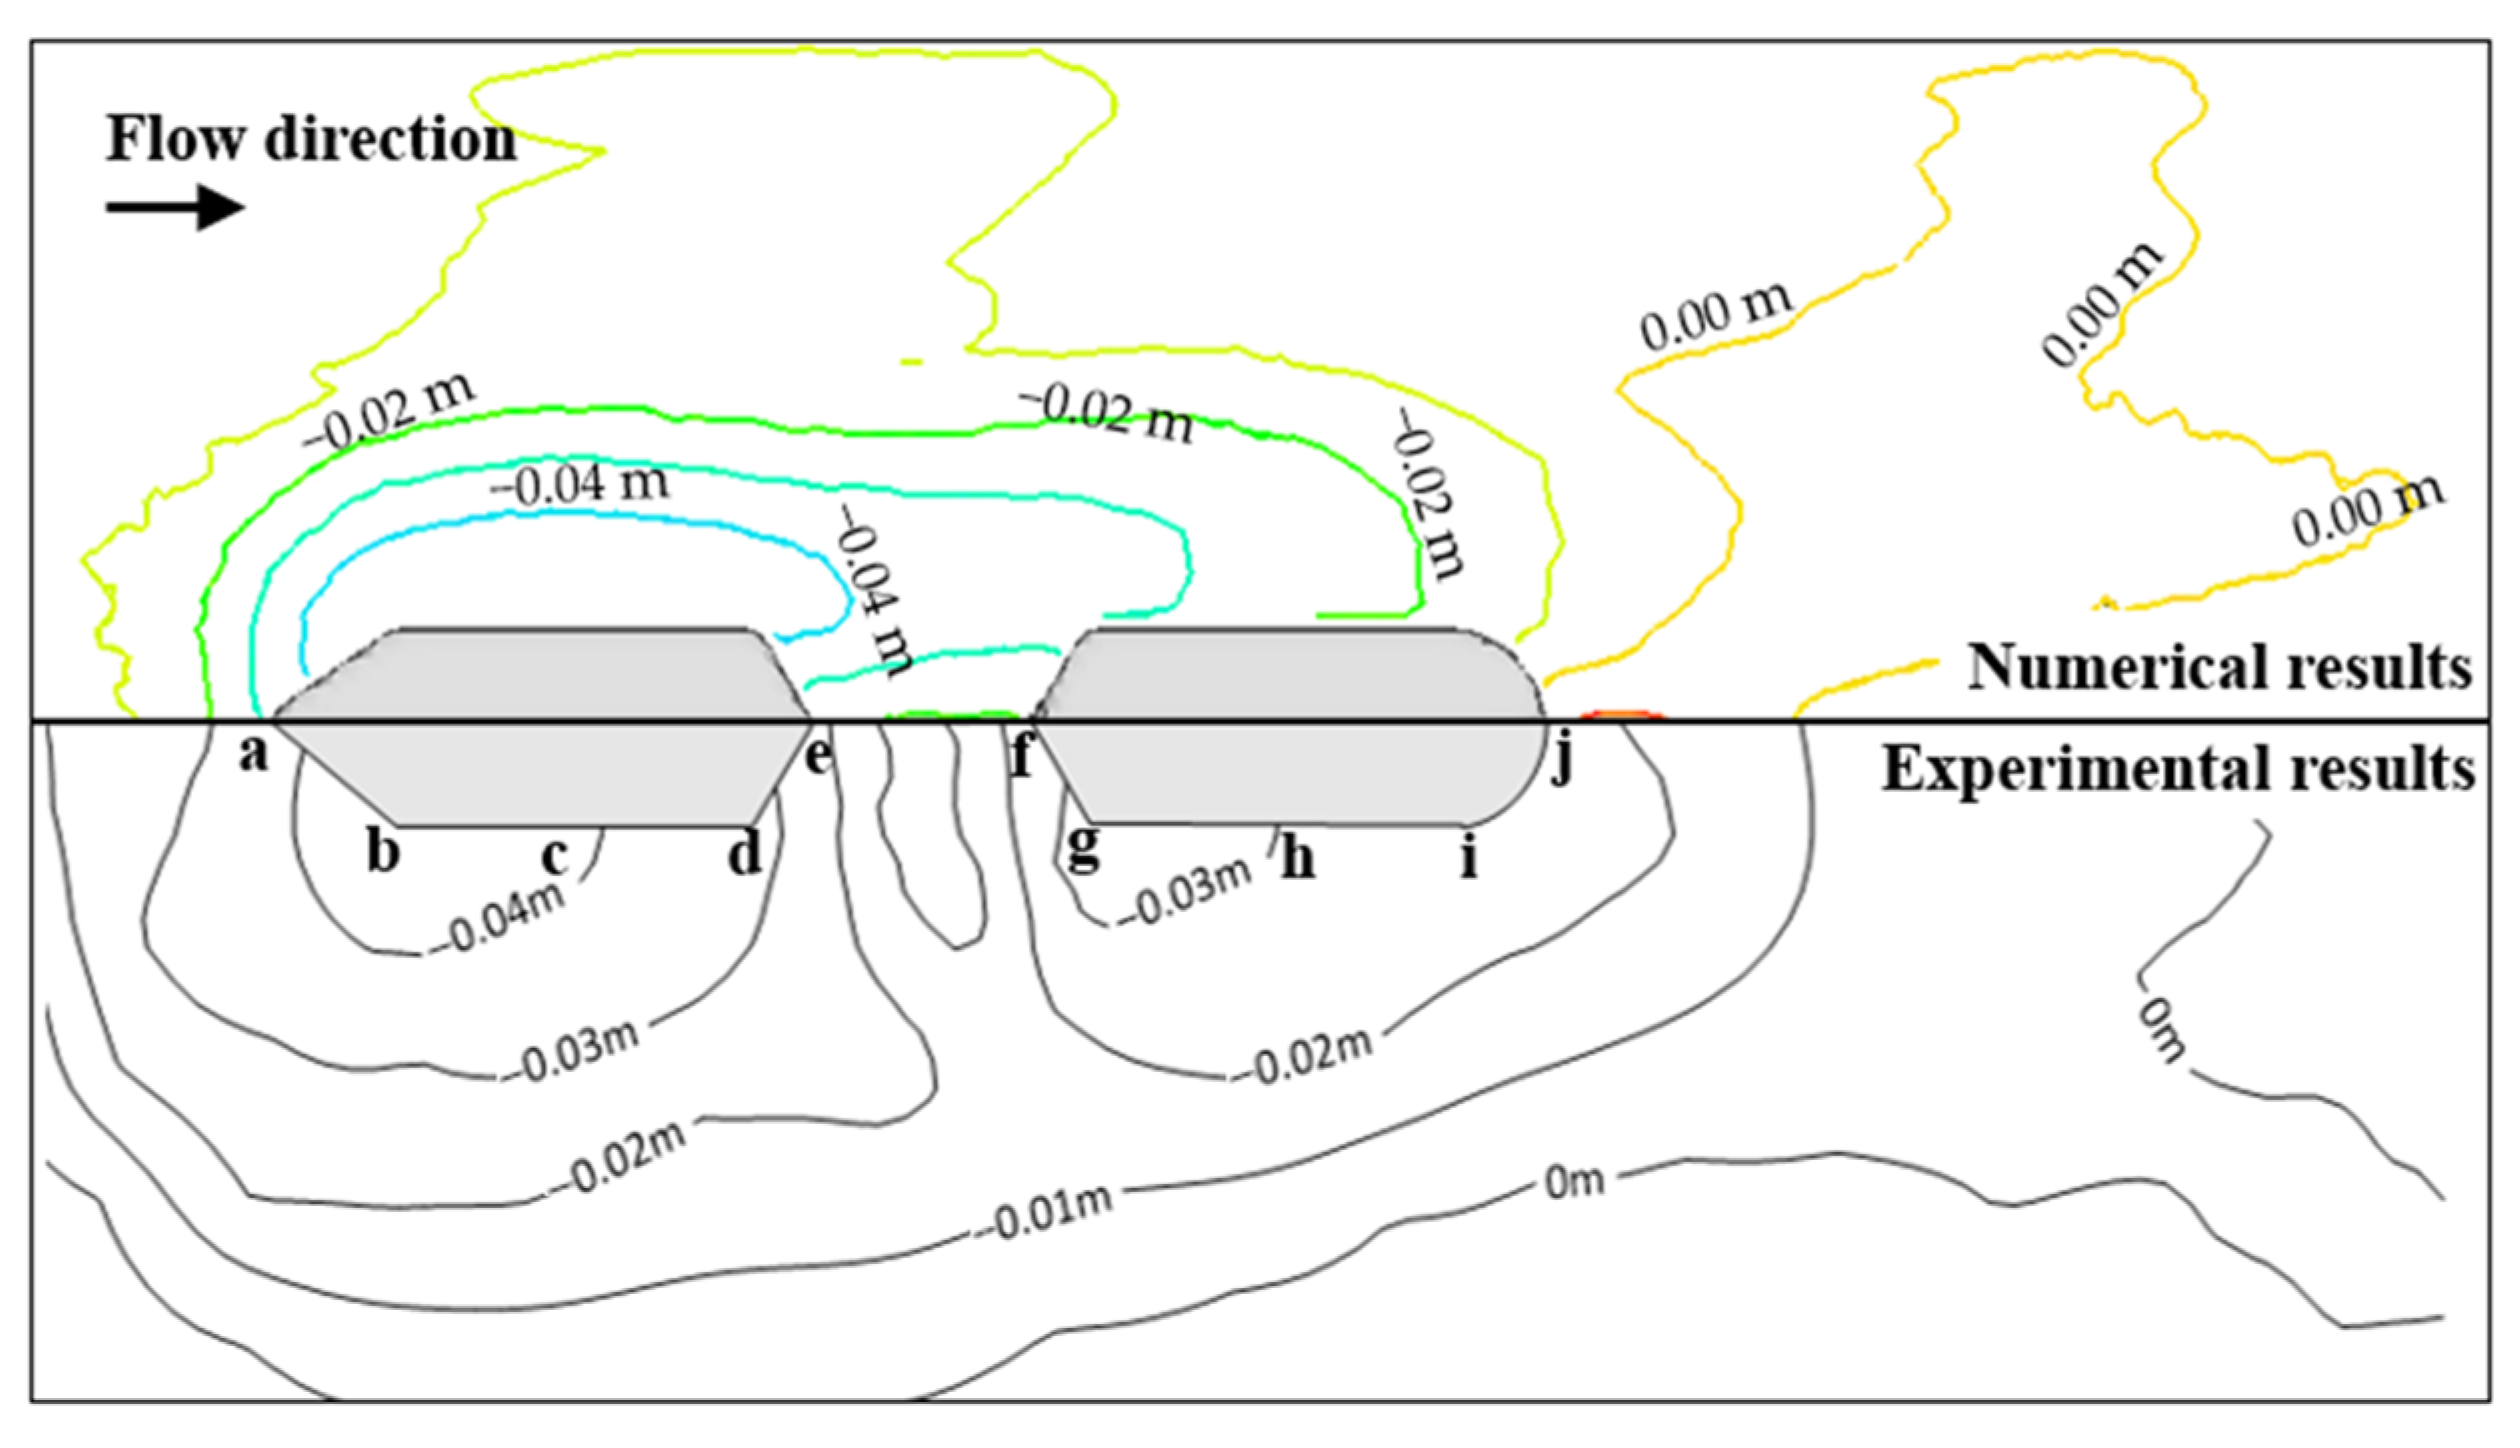
Figure 8 shows a schematic diagram of the topographic contours of the pier surrounding the scour based on the numerical simulation and physical test results in this paper. The results show that the overall scour geomorphology of both is similar and the core area of the scour is basically the same, despite the development of scour holes in front of the upstream pier being limited by the simulation results, which is a difficult problem faced by the current simulation scour field [39]. The maximum value of the scour zone appears at the location of point b on the upstream pier side, and the maximum depth of scour predicted by the model is 4.9 cm, with a relative error of 9.3% compared with the maximum depth of scour measured by the experiment of 5.4 cm. The maximum value of the siltation zone appears at the location of point j on the downstream pier end, and the maximum height of siltation predicted by the model is 1.7 cm, with a relative error of 19.1% compared with the maximum height of siltation measured by the experiment of 2.1 cm. The model prediction results are slightly lower than the test measurement results, which proves the applicability of the simulation, meaning that we can predict the bypass scour of the bridge pier more accurately.
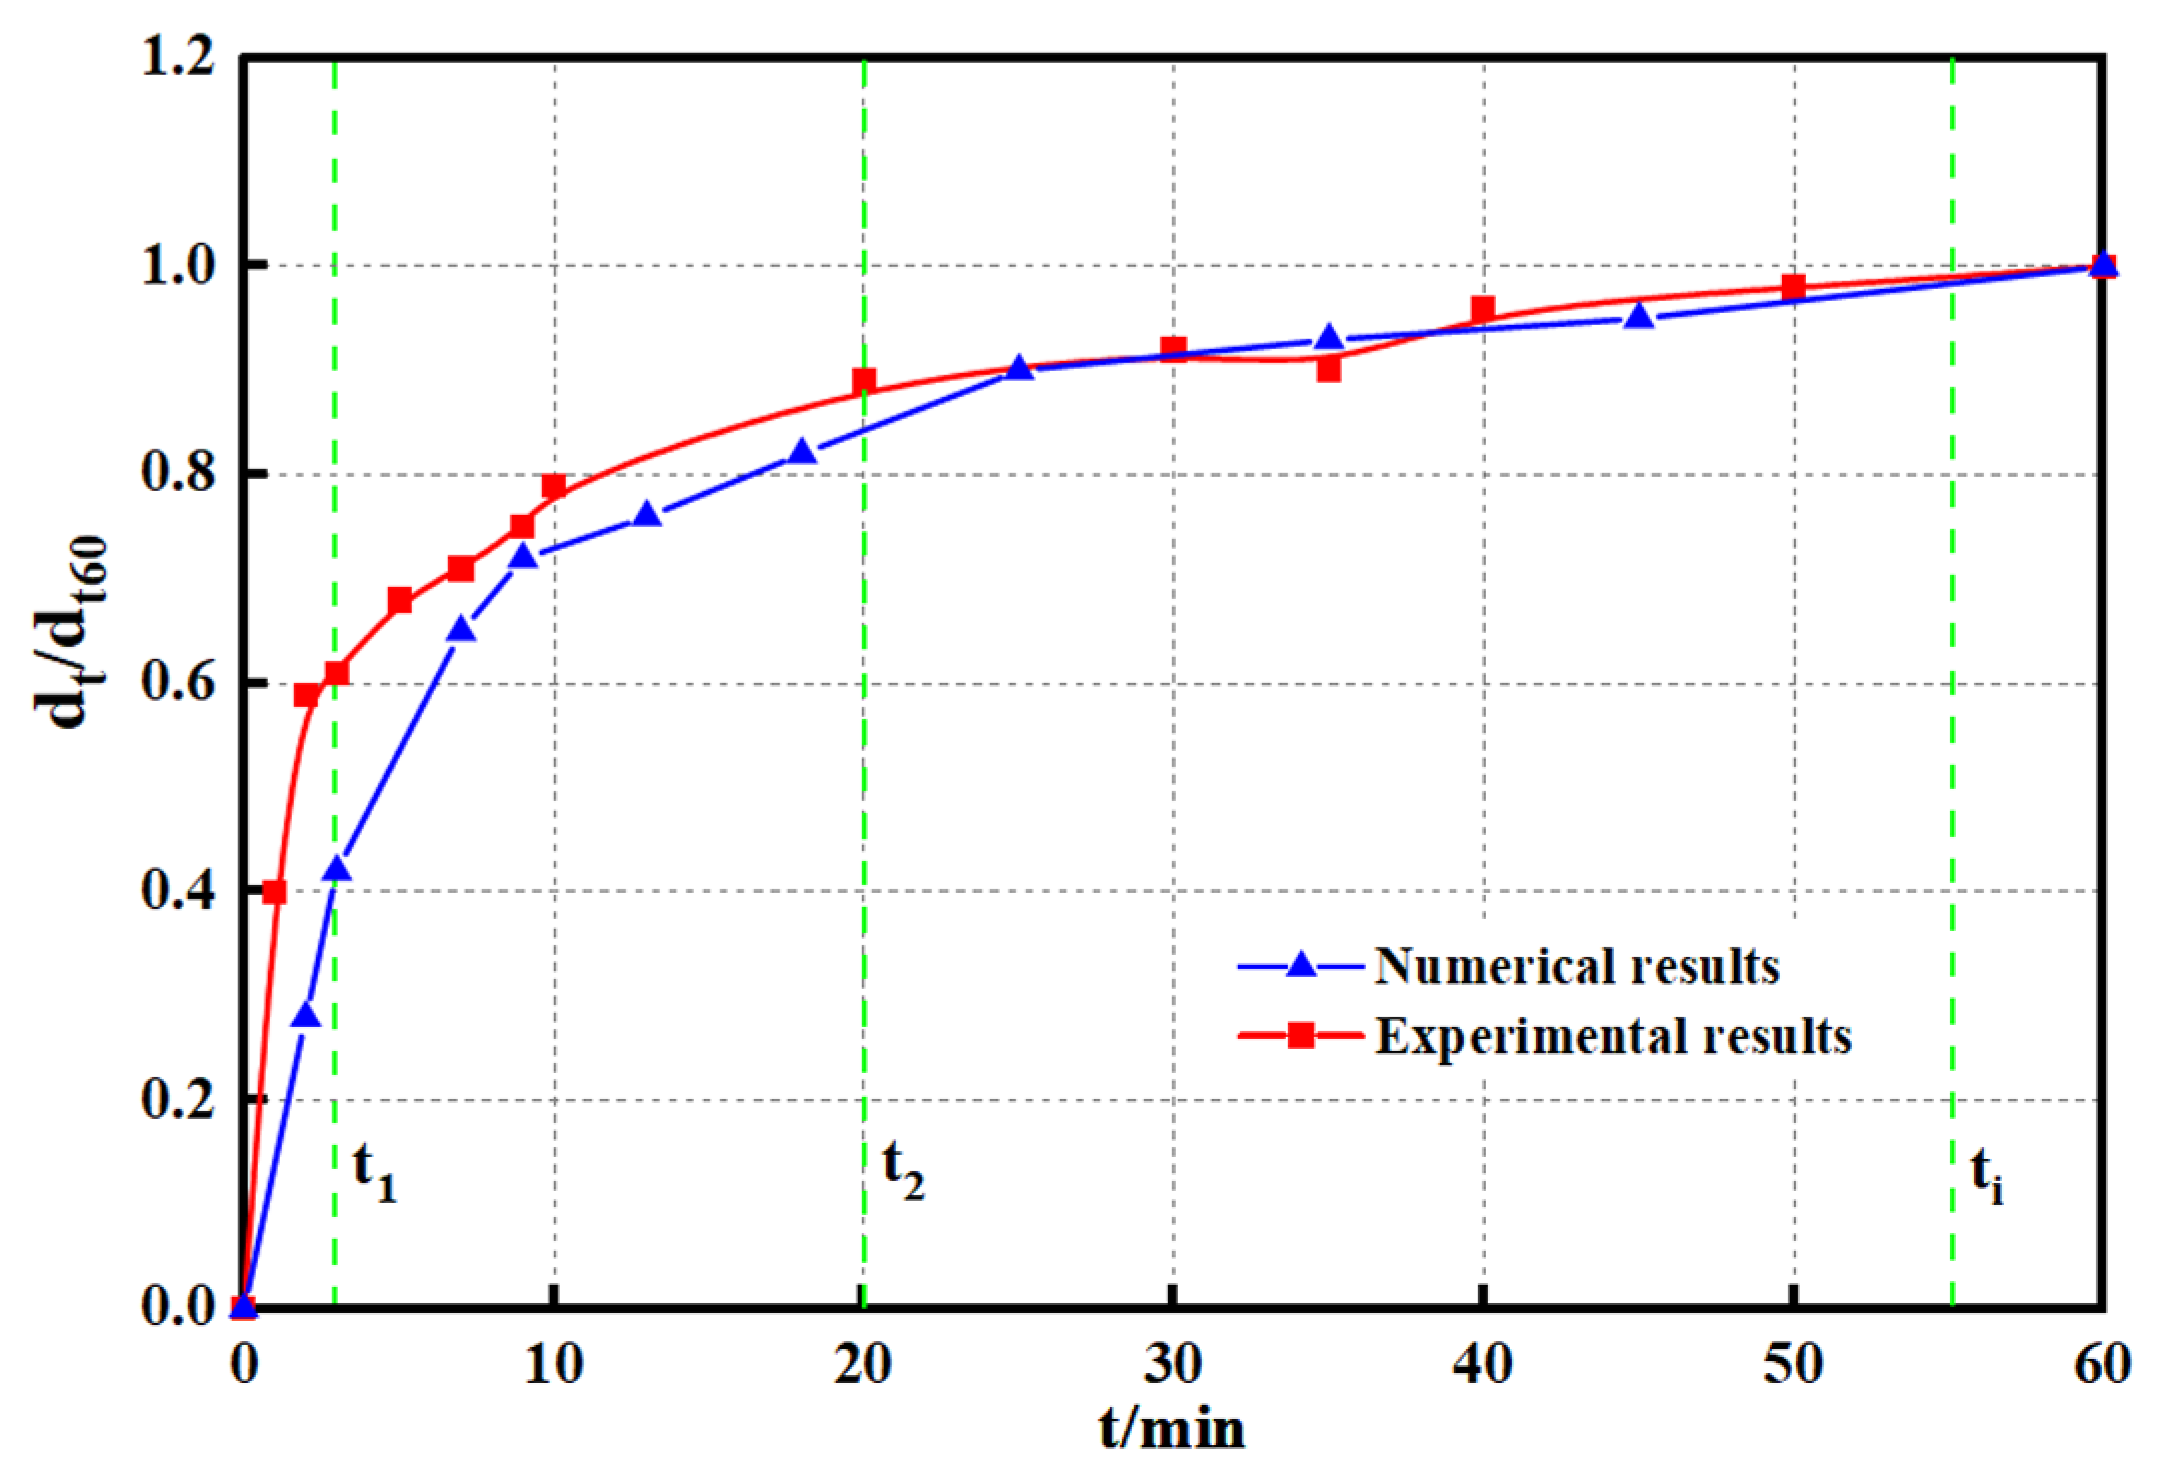
To further verify the reasonableness of the simulation results, the time-dependent curve of scour development can be used to quantify the analysis. Define the extreme value of the pier surrounding the scour depth with the time development defined as d t , the time increment defined as the horizontal coordinate, and dimensionless scour depth d t / d t 60 defined as the vertical coordinate; the trend of the scour depth over 60 min is plotted in Figure 9. As can be seen from the figure, after 1 h of scour, stable local scour holes developed around the piers under both model calculations; the scour holes of the physical model developed more rapidly before the t 1 moment compared with the simulation model, and the growth rate of the scour depth of both slowed down from the t 2 to t i moments, which was less than 5% of the pier width and basically reached a stable state [35]. The results of the numerical and physical models agreed well, as judged from the scour ephemeral curve.

4. Characteristic Quantity Analysis

In the two-phase flow model, both sediment and flow are classified as Eulerian continuous phases, and the Euler method is applied to solve for the coupled water–sand motion; the characteristic quantities, such as vortex kinetic energy and shear stress, between the two phases are derived from the control equations of each phase in the grid [40,41]. Due to the complexity of the turbulent vortex around the pier and the large difference in bed shear stress increments, it is difficult to solve the model and not easy to capture accurately; therefore, this paper focuses on the kinematic characteristics for systematic study, such as the annular strength of the vortex around the pier and the shear strength of the bed shear stress under two types of scouring conditions.

4.1. Pier-Side Vortex Effect

The turbulence effect of fluid interacts with the transport motion of sediment, and whether the fluid motion produces vortices is directly related to the motion state of the sediment particles; thus, from the perspective of the sub-microstructure, turbulence is formed by the superposition and aggregation of vortices of different scales. Additionally, the process of vortex formation, development and decay is accompanied by the material exchange with the boundary layer, and the evolution area of the internal vortex with the flow field is used to quantitatively analyze the vortex’s apparent physical characteristics and volume intensity changes.
In this paper, based on the vortex identification method, the vortex core line is used to characterize the eddy characteristics and structural changes, and the vortex quantity is used to measure the intensity of the vortex, which together, build a turbulent vortex structure that can accurately describe the influence of the vortex characteristics on the scour holes around the pier. Therefore, the Q criterion, which is widely used at present, is selected for the vortex identification study, and is combined with the simulation test observation to qualitatively assess the impact of local scour on the bridge pier.
Q = 0.5 ( B 2 A 2 )
A = 0.5 ( v + v T )
B = 0.5 ( v v T )
Here, v is the velocity gradient tensor, and A and B are the Helmholtz velocity decomposition of the velocity gradient tensor, as usually there is turbulent vortex motion in the region of Q > 0.
By defining the vortex scale as the vortex intensity and the vortex kernel line as a circular curve tangent to the vortex vector, it can be described specifically through the characteristic equation as follows:
ω i = u j x k u k x j
| ω | = ω i 2 ¯
where | ω | is the absolute value of the vortex volume. When it is greater than a certain threshold value, the region can be identified as a vortex.
In order to study the effect of the vortex on the depth of the scour holes around the pier, the internal vortex distribution was analyzed by capturing the scour hole profiles at different characteristic moments (see Figure 10 and Figure 11) at the upstream pier headwater in the 1-1 section (see Figure 6). The vortex volume can represent the swirling and sucking of sediment particles around the pier caused by the vortex. From Figure 10, it can be seen that under the state of open flow, with the diffusion of the vortex scale around the pier in the cross-section, the scale of the scouring hole keeps expanding the brush depth and the scouring flux keeps increasing. It can be observed from Figure 11 that under the ice-cover condition, the existence of ice cover leads to the high vortex area on both sides of the pier’s surrounding boundary, and the positive and negative vortex areas change alternately along the vertical displacement. With the dynamic evolution of the flow solid-phase coupling transport process, the vortex extreme area at the bottom of the scour hole gradually shifts to the edge, and the vortex kinetic energy exchange between the positive and negative vortices is intense. Overall, comparing the same characteristic moments of the two types of scour conditions, the sediment transport rate on the pier side under the ice-cover condition is more significant than that under the open-flow condition, and the depth of the scour hole formed under the ice-cover condition is deeper and wider in scale until the scour equilibrium stage is reached (60 min moment).

4.2. Bed Surface Shear Stress

Due to the blocking effect of the submerged combined piers, the vortex generated around their piers will cause the flow field area to change, and any change in the flow field domain will lead to a subsequent change in bed shear stress. In essence, the continuous increase in shear stress around the pier is the main cause of local scour. Therefore, the local scour around the pier is quantitatively analyzed by profiling the bed shear stress distribution.
The specific expression for the stream shear stress [42] is:
τ 0 = ρ w λ u 2 / 8
where ρ w is the fluid density; u is the mean flow velocity; and λ is the friction coefficient.
In the dynamic-bed scour simulation process, with the development of scour holes, the increase in the slope of the pit affects the starting shear stress; thus, the correction factor introduced by Dey was chosen to consider the effect of slope, and the critical shear stress was expressed [27] as:
τ c r = r τ 0
where τ c r and τ 0 are the critical shear stress in the sloping bed and the critical shear stress in the flat bed, respectively, and r is the correction factor.
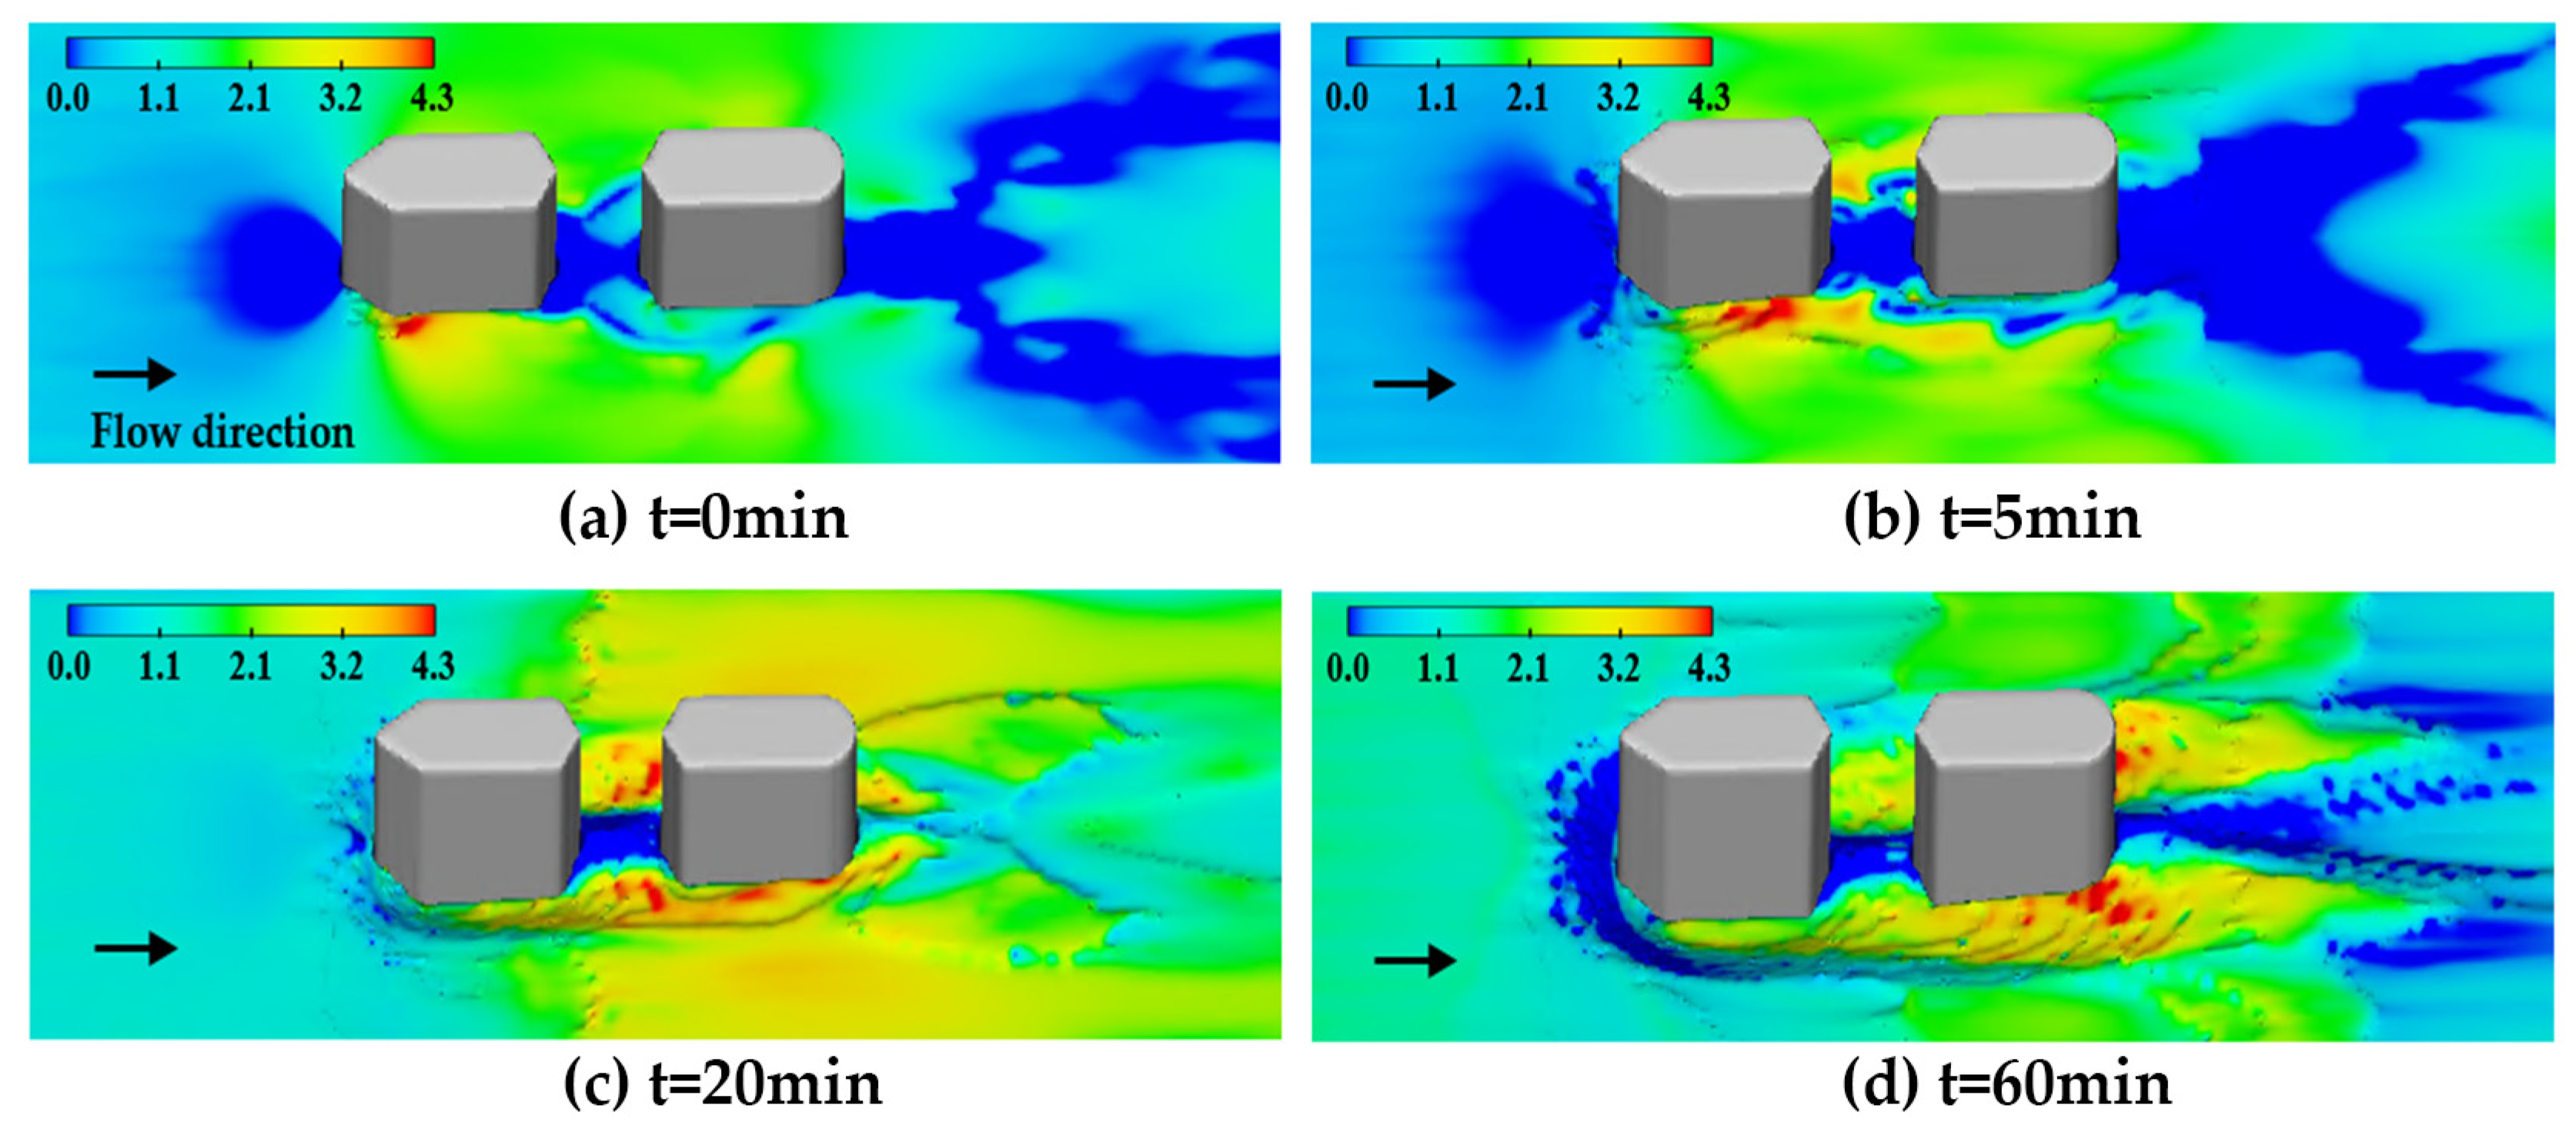
The distribution of water flow shear stress determines the evolution of the section shape of the scour hole around the pier, and the faster development of the section shape is often due to a larger value of shear stress. This paper captures the process of changing shear stresses on the sand bed surface under two types of scour conditions (see Figure 12 and Figure 13). Comparing the two scouring conditions, it can be observed that the development trend of shear stress is generally consistent, and the maximum shear stress area (red area) initially appears at the location of point b (see Figure 8) on the waterward side of the upstream pier. It gradually shifts to the location of point i (see Figure 8) at the end of the downstream pier, where the maximum shear stress is approximately 4.3 Pa in Figure 12 and 4.6 Pa in Figure 13, and the increase in shear stress in the latter is 6.9%; at the same characteristic moment, the local shear stress of the additional ice cover is higher and the scouring area is wider. The local scouring of the additional ice cover at the same characteristic time has a greater intensity of the undercutting flow compared with that in the open-flow condition, and it has a stronger impact on the sand bed and a wider scouring range. This study shows that the emergence of ice cover has a greater impact on sediment particle initiation, which significantly increases the shear stress on the bed surface around the pier. The development of the scour hole depends on the undercutting force of the water flow and the collapse adjustment of the inner wall of the hole; thus, the relationship between the scour hole scales is specifically analyzed below.
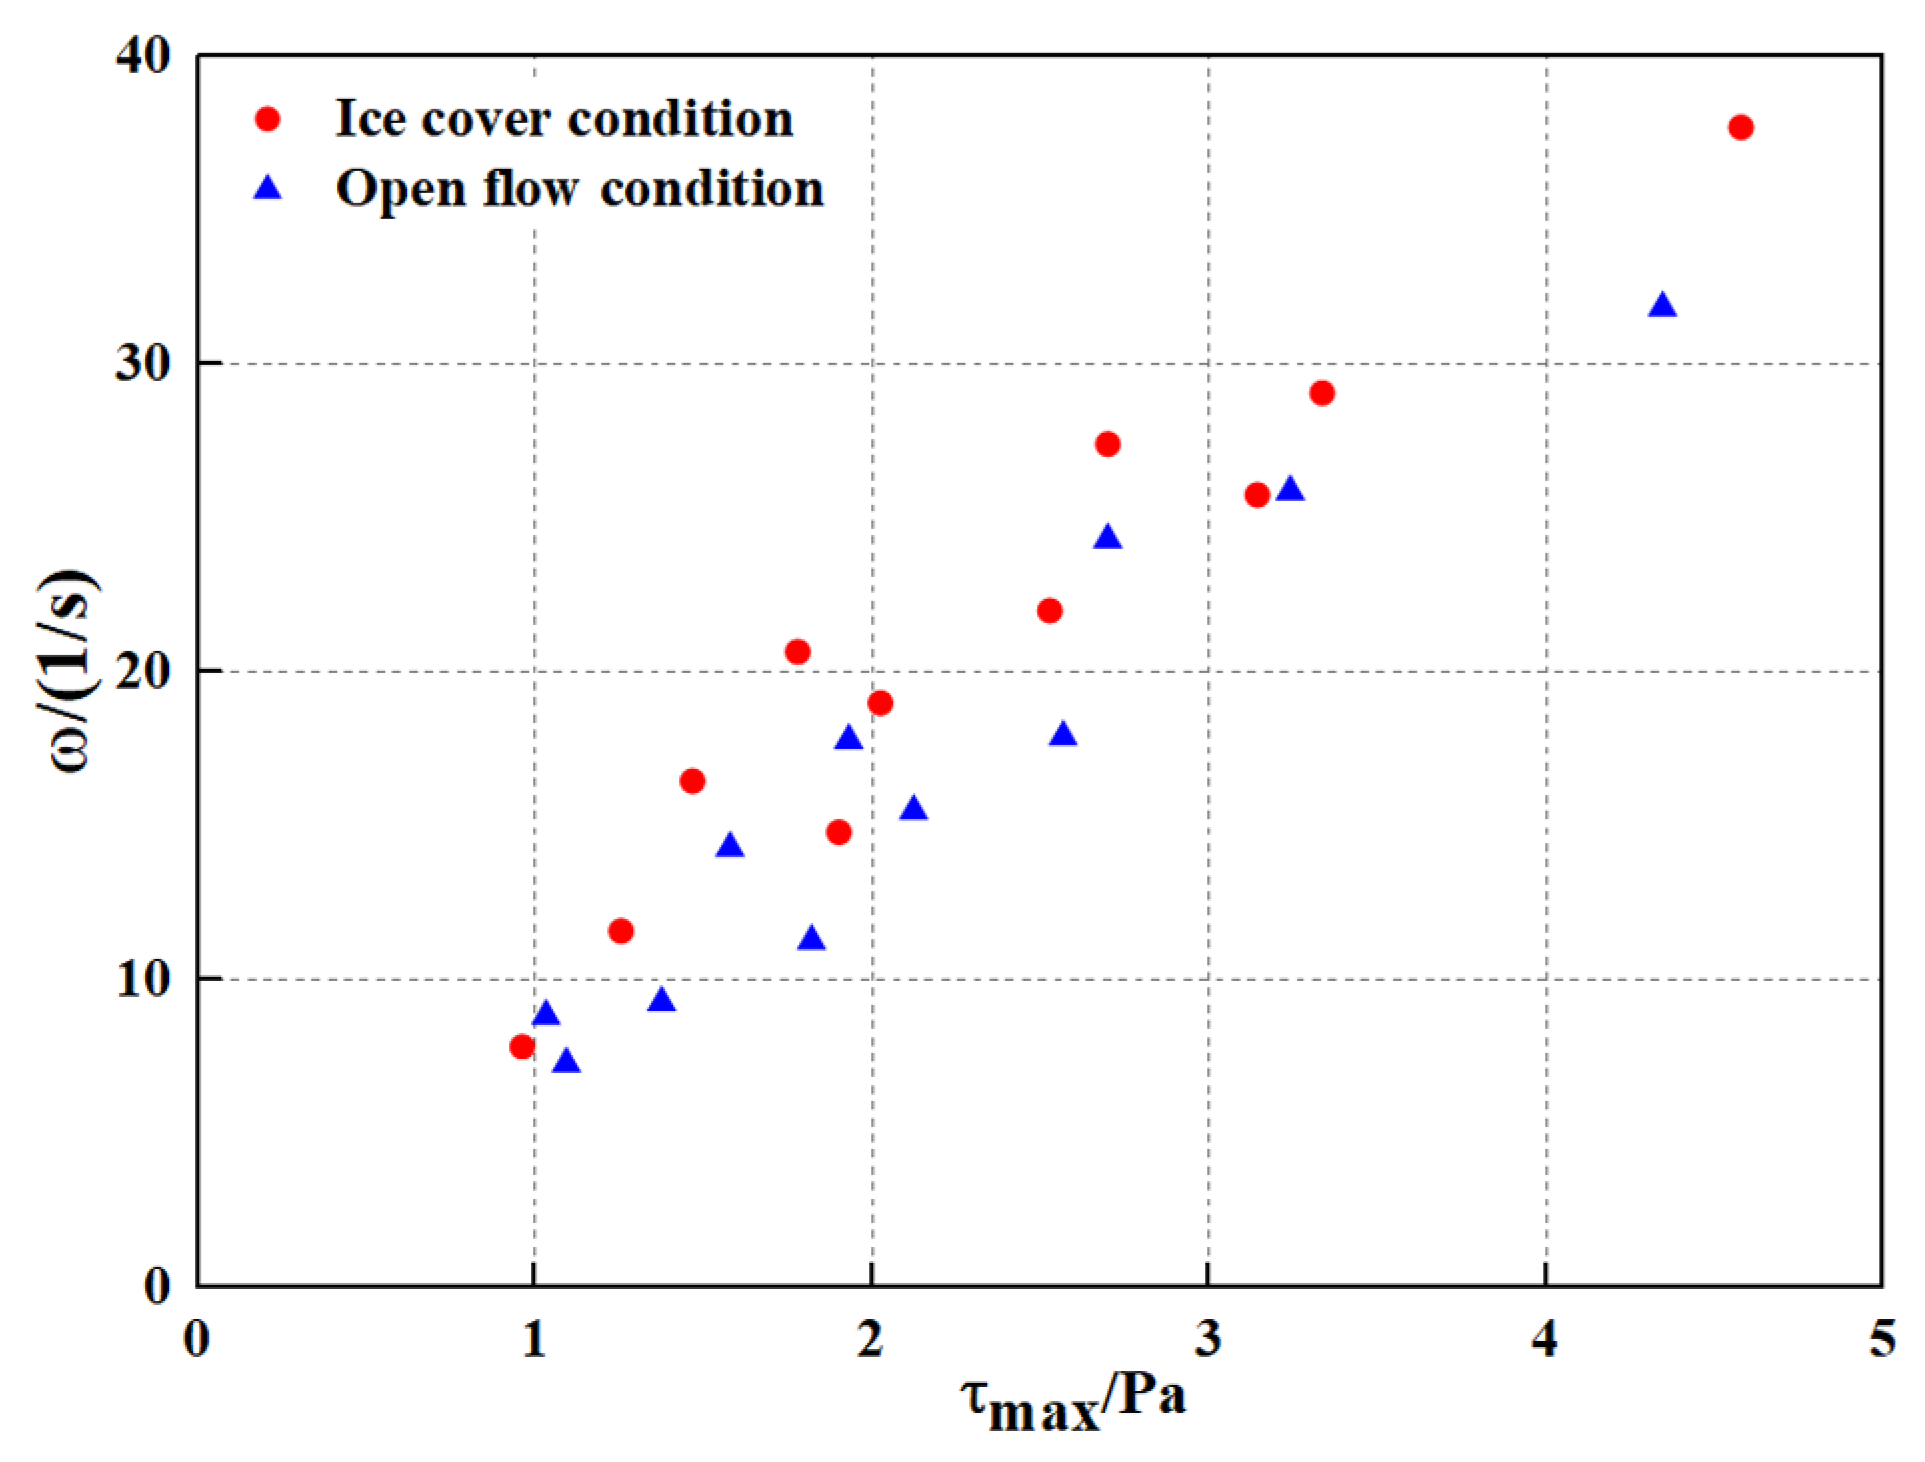
Since most studies focus on the effect of the vorticity or bed shear stress on scouring, this paper addresses the relationship between these two characteristic quantities. Pier circumferential-section vortex kinetic energy and bed shear stress changes are closely related. According to the above calculation of the section vortex and shear stress distribution, we analyzed the quantitative relationship between the two, as shown in Figure 14, where the selected vertical position of point b (see Figure 8) is in the vortex influence area. As can be seen from the figure, the correlation between vorticity and shear stress under the two scouring conditions is basically the same, and both show a positive correlation; under the ice-cover scouring conditions, the average maximum vorticity in the vertical line is approximately 38 s 1 , whereas the maximum average vorticity in the vertical line under the open-flow conditions is 32 s 1 . The increase ratio is 18.7%, and the increase ratio of the maximum shear stress is 6.9% at the same time, which indicates that the ice cover has a significant influence on both, meaning that the contribution of the sediment transport rate around the pier value is larger. This study shows that the local scour of the bridge pier mainly originates from the interaction between the vortex system and the shear stress, whereas the turbulent vortex leads to a strong transient flow field around the pier, and the bed shear stress is gradually enhanced with the sharp change in the flow field; thus, there is a strong correlation between the two.

5. Example Analysis

5.1. Scouring Terrain Feature Pattern

In order to reasonably predict the development pattern of local scour holes of bridge piers and elucidate the influence of different scour conditions on the morphological characteristics of the holes, this study conducted a qualitative analysis by simulating the three-dimensional morphological map of bed scour.
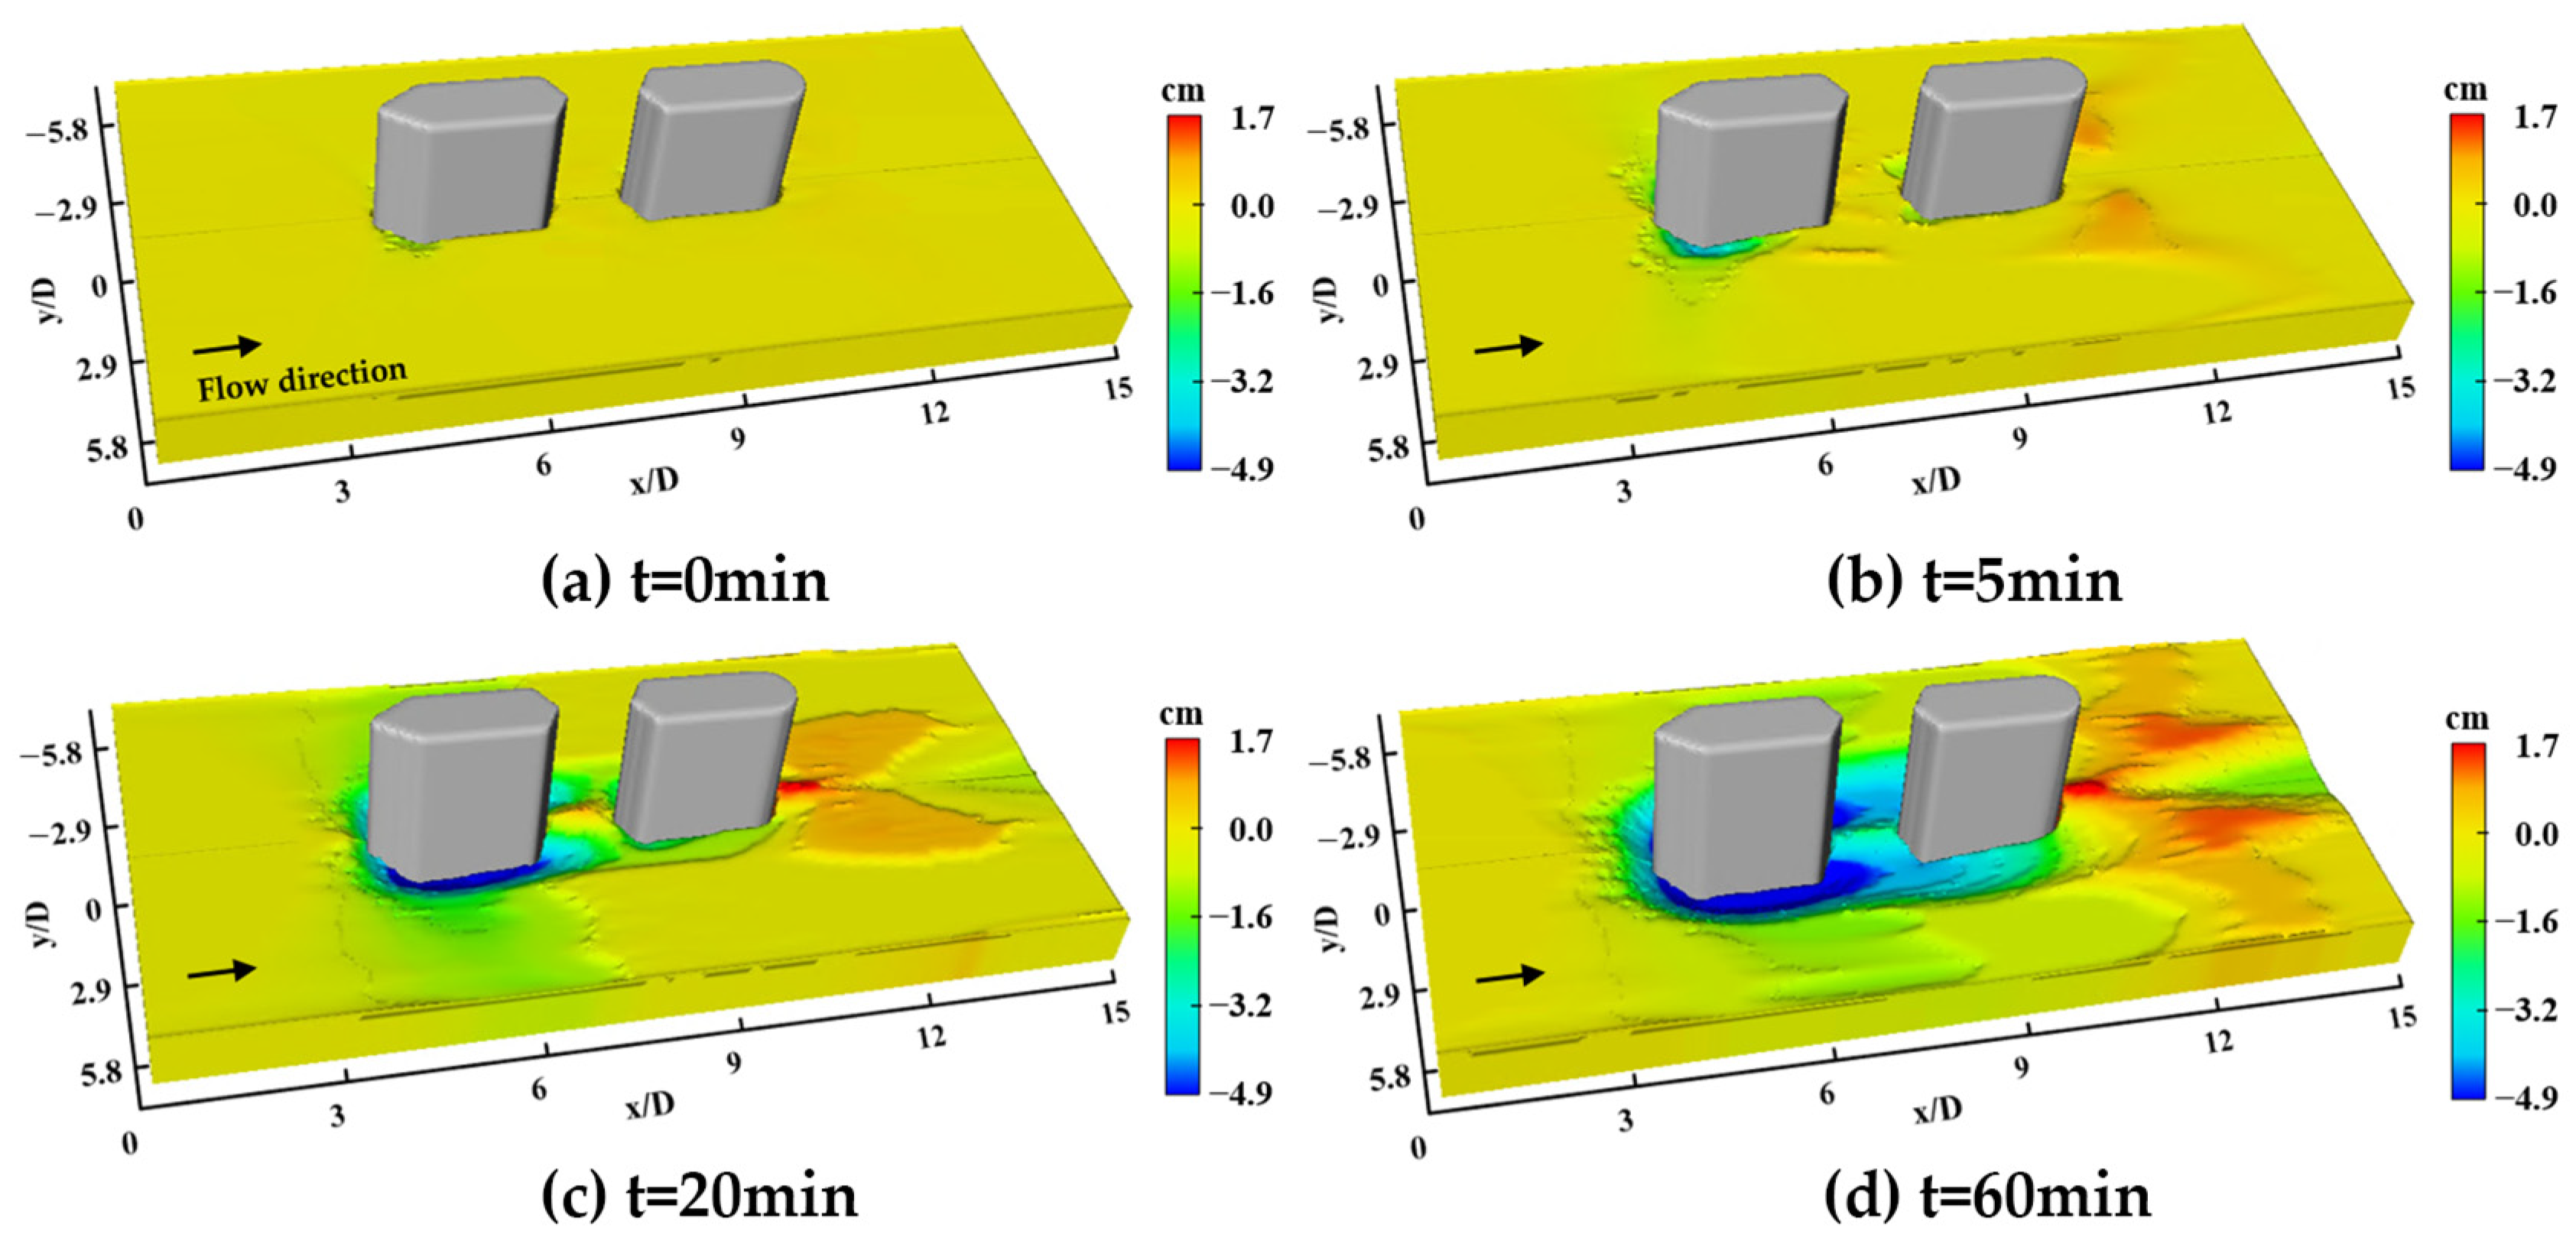
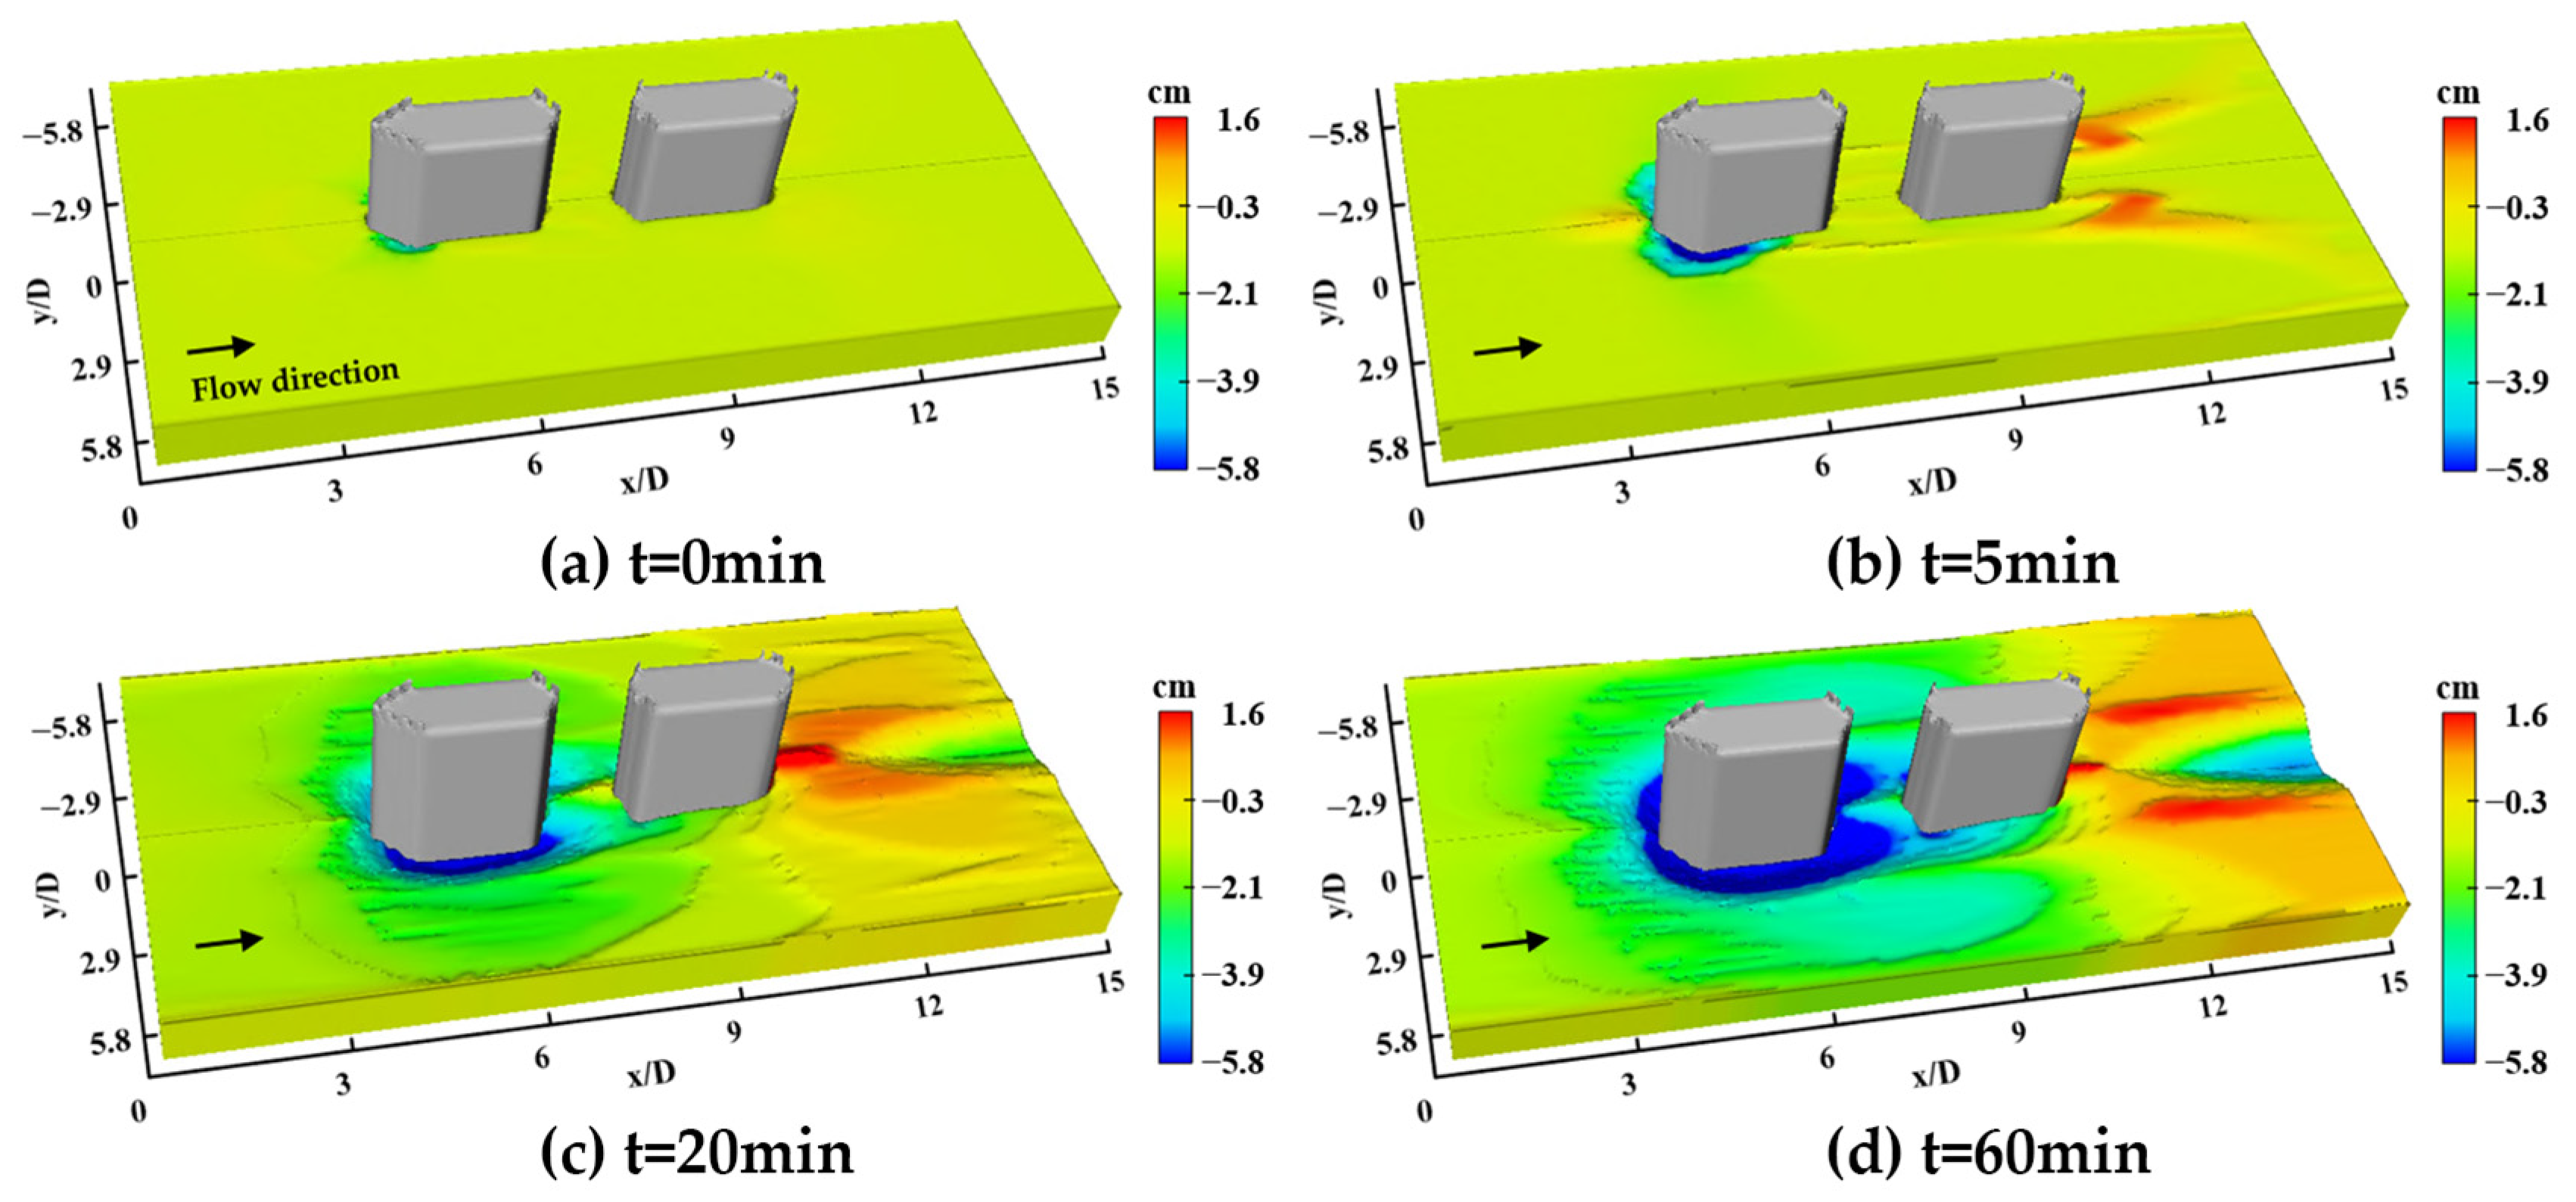
From Figure 15 and Figure 16, we can observe the evolution of the scour hole shape over time. Its development process goes through three stages, including the initial, development, and equilibrium stages, in which the development of scour holes under the action of water flow is mainly concentrated in the development stage. Each stage shows the following characteristics: (1) For the initial stage of scouring, as seen in Figure 15 and Figure 16a,b, it can be found that due to the tip-shaped structure of the waterfront pier diversion, there was separation of the front boundary layer. Thus, the location of the pier side first appeared in the scouring holes and gradually expanded (blue area). At the end of the pier, due to the enrichment of the wake vortex, the negative pressure area gradually formed a “figure-of-eight” dune (red area). (2) For the scour development stage, as seen in Figure 15 and Figure 16b,c, it can be found that the sediment transport and deposition rate under ice-cover conditions is significantly faster than that of open-flow scour, and the overall sand bed area around the pier is in a flowing state. (3) In the equilibrium stage of scouring, when comparing Figure 15d and Figure 16d, it can be seen that the shapes of the scour holes formed under the two scouring conditions are roughly the same, but the depth and range of the scour holes due to ice-cover scouring are large, whereas the bed surface due to open-flow scouring is relatively flat. Qualitative analysis shows that the evolution of scour holes under open-flow conditions significantly lags behind that of scour formed under ice-cover conditions at the same characteristic time, which originates from the wider width of the turbulent zone and the stronger turbulence on the pier side under ice-cover conditions.
To quantify the scour hole scale, the elevation distribution along the scour equilibrium moment was plotted, where the x-z profile of the pier centerline was taken in the downstream flow direction, and the b-b′ profile and g-g′ profile of the scour hole were taken in the vertical flow direction (see Figure 8) to quantitatively analyze the differences in scour patterns under ice-cover and open-flow conditions.
Comparing Figure 17a,b, it can be found that the maximum local scour depth of the bridge pier occurs at point b (see Figure 8) on the pier side of the upstream pier under both types of scour conditions, and the scour depth at this location is significantly greater than the scour depth in front of the pier; among them, the relative equilibrium scour depths at the locations of the scour hole b-b′ and g-g′ profiles under ice-cover conditions are 1.2D and 0.8D, respectively, and the relative equilibrium scour depths at the locations of the scour hole b-b′ and g-g′ profiles are 2.8D and 2.6D, respectively. The relative equilibrium depths at the b-b′ and g-g′ profiles are 1.2D and 0.8D, and the relative scour hole radii are 2.8D and 2.6D, respectively; the relative equilibrium depths at the b-b′ and g-g′ profiles are 1.0D and 0.6D, and the relative scour hole radii are 2.4D and 2.3D, respectively, under the open-flow condition. The existence of ice cover makes the maximum relative equilibrium scour depth of the front and rear piers brush deeper by 18.4% and 32.4%, respectively, and the relative scour hole radius widens by 18.1% and 14.3%, respectively, which is caused by the ice-covered river section reducing the scour resistance of the sediment particles at the bottom of the bed, resulting in the loss of bed sediment stability and making it more prone to start, as well as leading to the intermittent collapse of sediment in the scour hole, resulting in a larger fluctuation of the scour hole. Quantitative analysis shows that the presence of ice cover contributes to the development of a local scour hole around the pier and contributes more to the sediment transport around the pier.
As the bridge pier foundation and substructure are influenced by the scouring environment, the ice-cover environment contributes to the durability damage (e.g., increased erosion) and force damage (e.g., shear stress) caused by the bridge pier foundation. The research in this paper can further improve the safety assurance and evaluation technology system for the bridge pier foundation across the river, which can provide technical support and theoretical experience for the design and construction of the bridge across the river.

5.2. Scale Relationship of the Scour Hole Structure

Ettema et al. [7] pointed out that pier circumferential scour belongs to the category of a local large deformation, and throughout the bypass scour process, whenever the inner wall slope of the scour hole reaches the threshold value of the submerged sediment rest angle, the inner wall sediment particles will slow down the local slope by collapsing, and then reach a new dynamic equilibrium. In order to study the different changes in the scour hole structure scale in different scouring environments, the x-z profile of the centerline of the pier column in the downstream flow direction and the b-b′ profile in the vertical flow direction were selected to compare and analyze the influence of two types of scouring conditions on the slope of the scour hole.
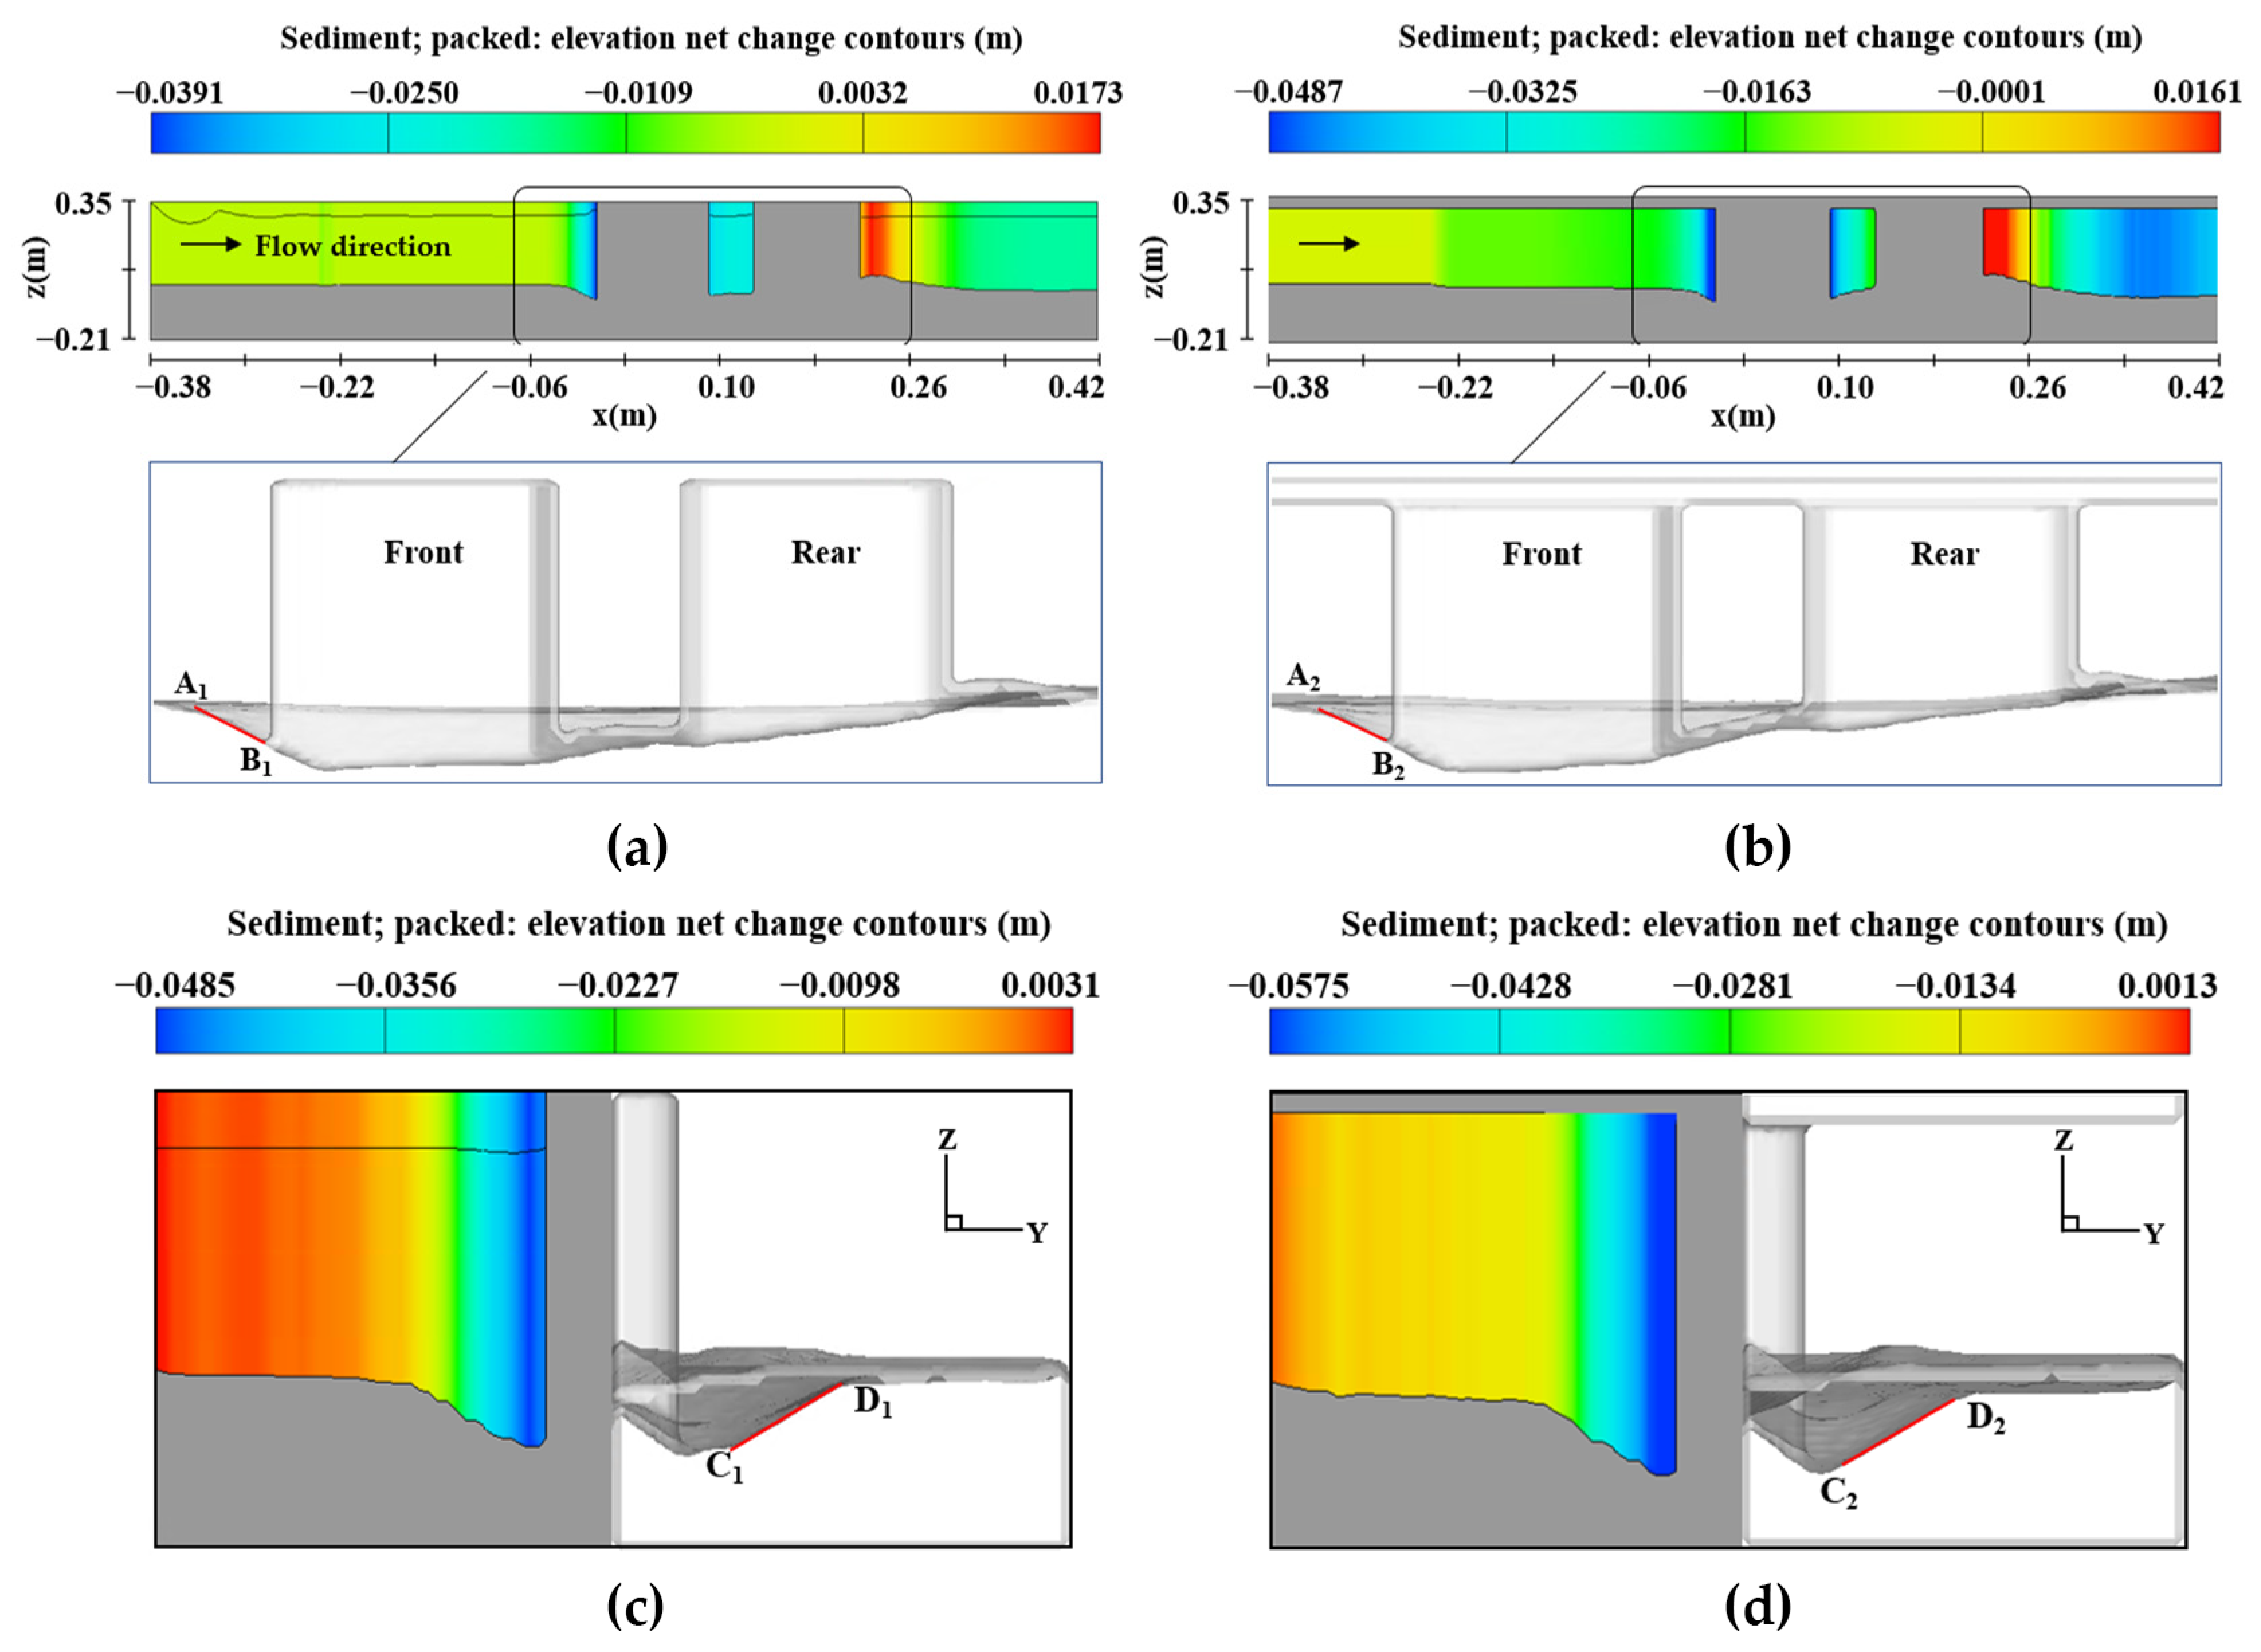
Figure 18 shows the comparison of scour hole slopes for two types of scouring conditions. Under the open-flow scouring condition, the scour hole slope in front of the upstream pier ( A 1 B 1 dip angle in the figure) is approximately 29°, and the scour hole slope at point b (see Figure 8) on the pier side ( C 1 D 1 dip angle in the figure) is approximately 30°; under the ice-cover scouring condition, the scour hole slope in front of the upstream pier ( A 2 B 2 dip angle in the figure) is approximately 26°, and the scour hole slope at point b on the pier side ( C 2 D 2 dip angle in the figure) is approximately 28°. Through calculation, it was found that the longitudinal-section and transverse-section equivalent slopes of all scour holes are basically the same. The slope of all scour holes is basically the same, indicating that when the scouring enters the equilibrium stage, the bed surface around the submerged pier and the sediment particles inside the wall of the scour hole are no longer moving and transporting, and the shape of the scour hole tends to be relatively stable.
The research shows that (1) the equilibrium scour hole slope obtained from the simulation is smaller than the underwater sediment repose angle because the sediment particles are susceptible to shear stress and eddy currents in the dynamic water environment, whereas the underwater repose angle is not disturbed based on the static water condition measurement; and (2) the equivalent slope of the scour hole under the ice-cover condition is slightly slower than the slope under the open-current condition, indicating that its scour hole side slope extends to the periphery and that the scouring range is significantly affected by the shear stress.

5.3. Time Scale of Scouring Characteristics

According to the experiment results of the local scouring of bridge piers in two types of scouring environments, it can be determined that the maximum stable scouring depth of a bridge pier foundation under the action of a unidirectional constant flow depends on the geometric characteristics of bridge piers, water flow, sediment movement characteristics parameters, etc. Therefore, the following equation is listed to describe the local scouring problem:
F ( D , H , v , v c , d s , g , ρ i , t e ) = 0
where D is the water-blocking width of the bridge pier; H is the water depth; ρ i is the density parameter; g is the gravitational acceleration; v is the flow velocity; v c is the critical flow velocity; d s is the scouring depth; and t e is the duration.
Based on Buckingham’s theory [43,44], considering that the principle of dimensional harmony, D , v , and ρ are chosen as the basic variables, and the other factors are dimensionlessly simplified, Equation (27) can be expressed as:
F ( H D , v v c , d s D , ρ s ρ w , t t e ) = 0
Since the scouring of the bridge pier foundation is carried out under fully developed turbulent conditions, the influence of the Reynolds number on the scouring depth can be ignored [45]. The flow intensity v / v c takes the value of 0.82 in the scouring test, and the pier width and water depth and density are constants in the model, and thus, Equation (28) can be simplified as:
F ( d s D , t t e ) = 0
In the above equation, the relative time scale t / t e is a characteristic quantity that measures the rapidity of the local scouring rate and is obtained by subjecting the characteristic time scale [46] to a dimensionless process as follows:
t * = t e [ ( ρ s / ρ w 1 ) g d 50 3 ] 0.5 / D 2
Cardoso [47] improved the empirical formula proposed by Whitehouse [48] to study the evolution of scour depth over time under clear water scour conditions, and in this paper, based on the scour prediction formula of Cardoso [47], the relative equilibrium scour depth formulas applicable to open-flow and ice-cover environments were established by regression.
Open-flow scouring environment:
d s D = 1 exp [ 0.134 ( t t e ) 1.104 ]
Ice-cover scouring environment:
d s D = 1 exp [ 0.369 ( t t e ) 0.846 ]
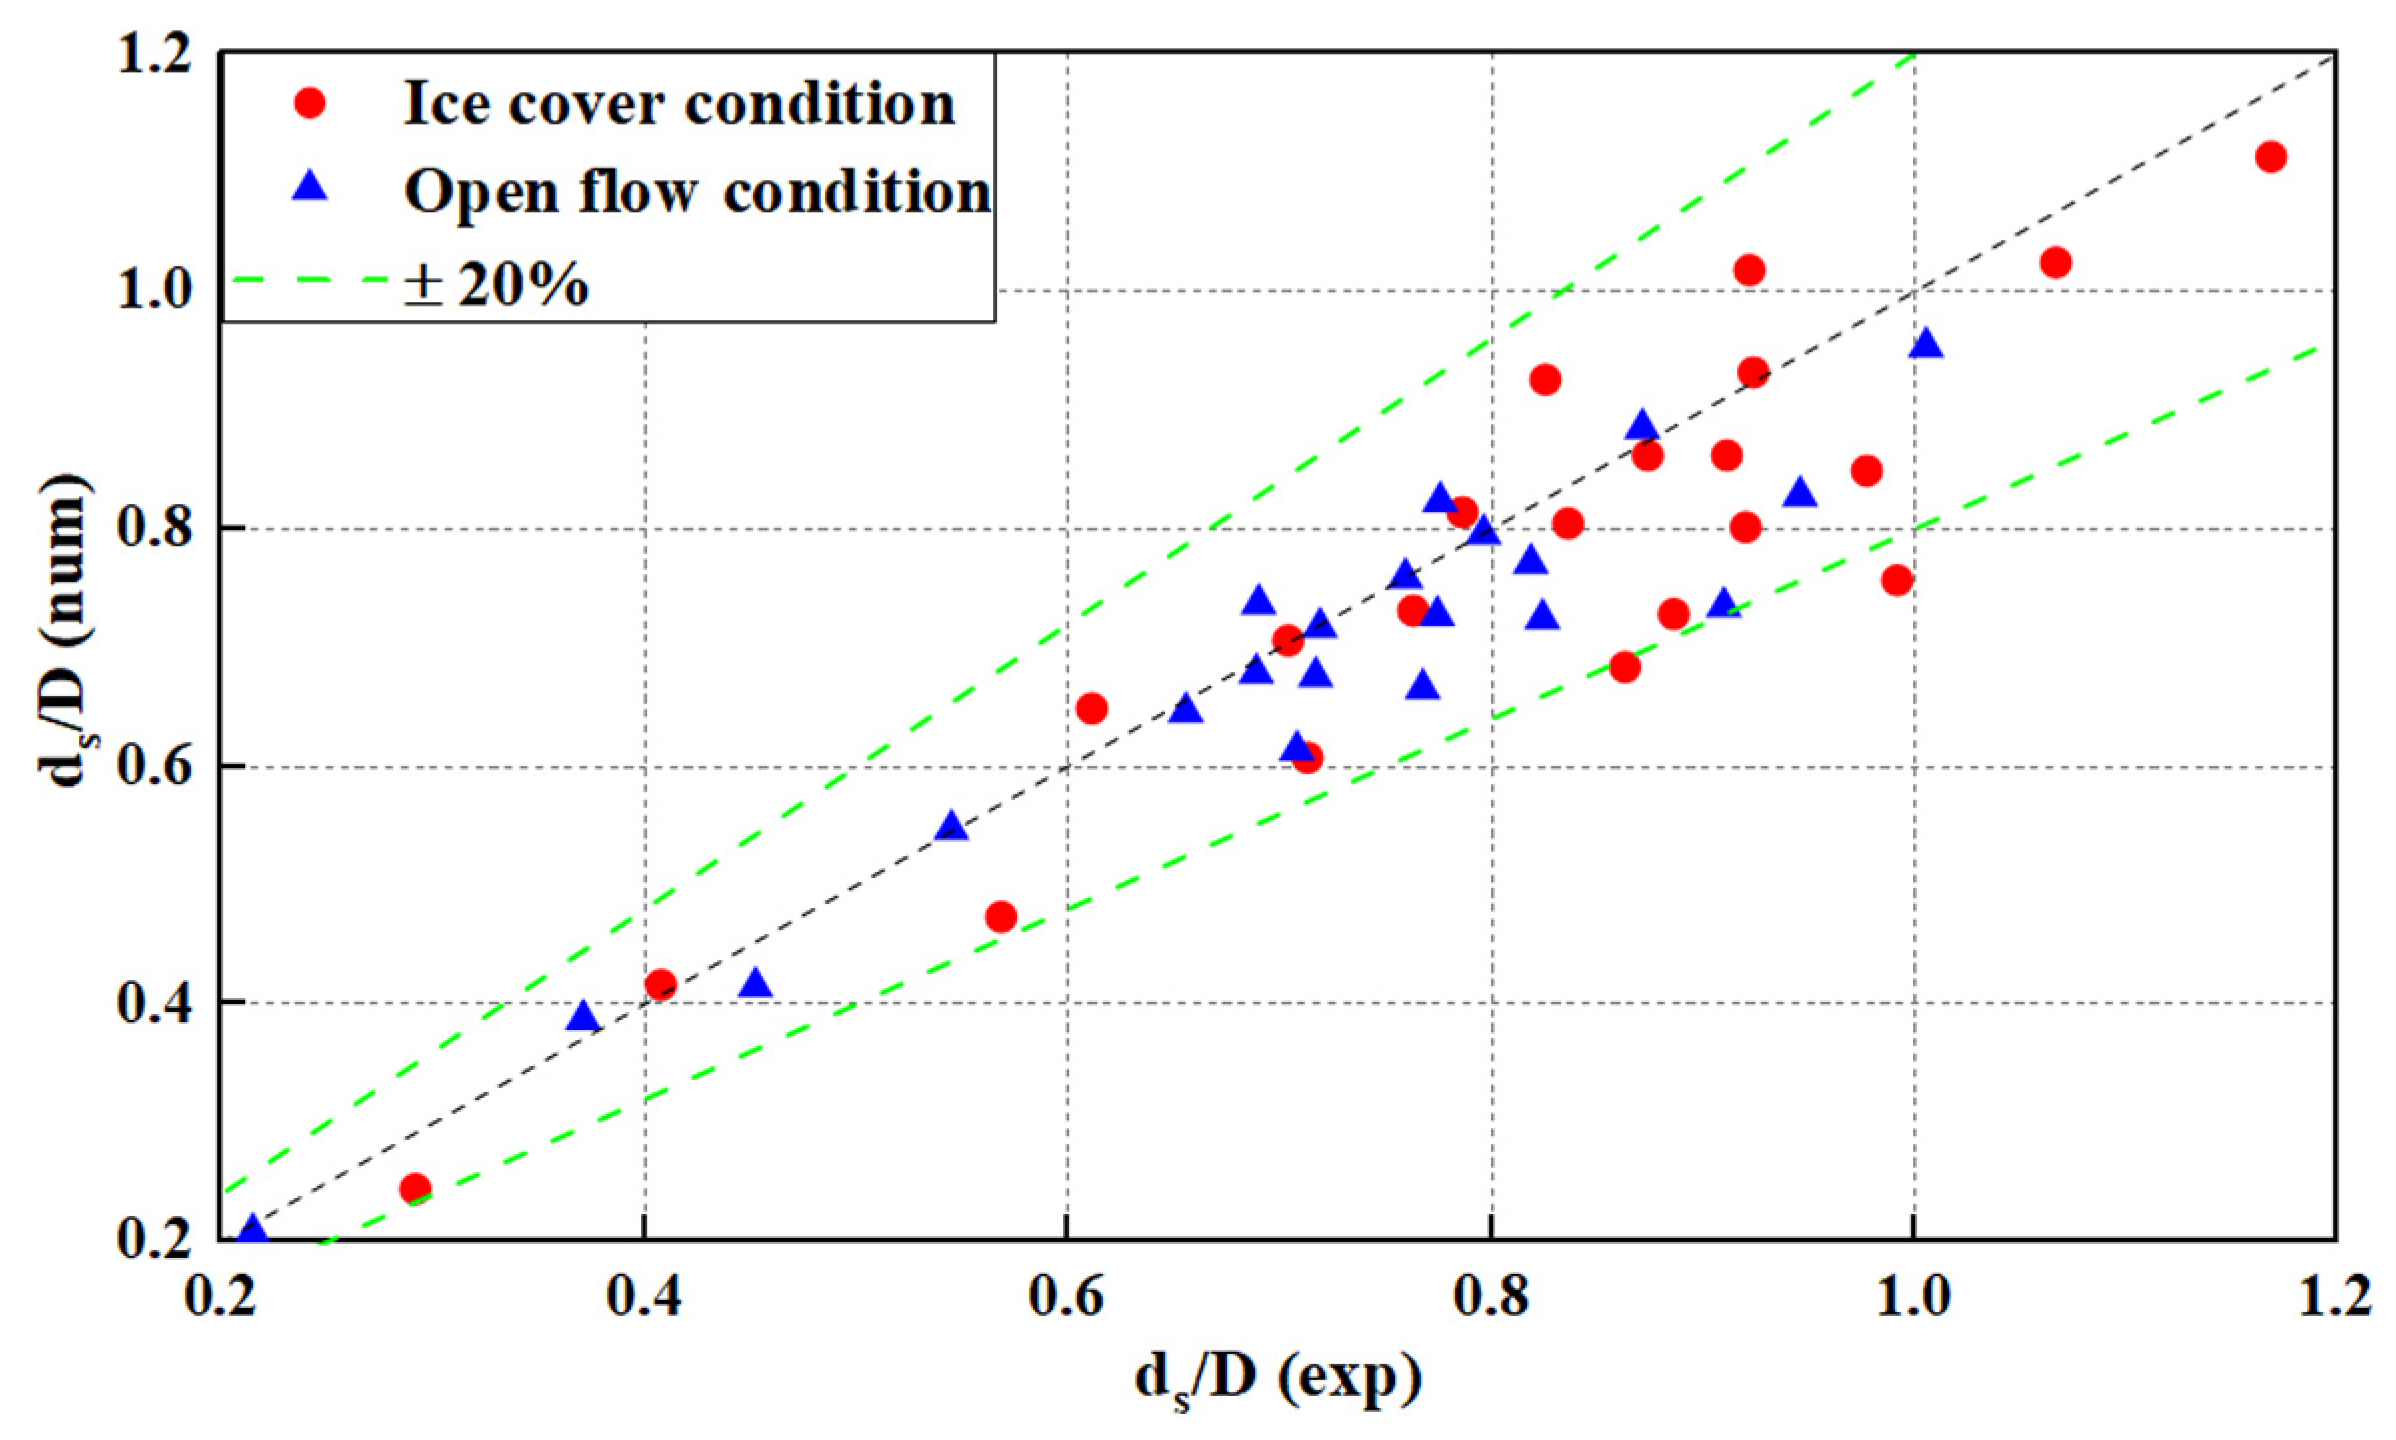
In order to verify the reliability and applicability of the regression formula, Figure 19 gives a comparison between the calculated values of the local scour simulation and the experimental measured values of the pier column in this paper. From the overall distribution, it can be seen that the relative errors of both types of scour depth results are limited to ±20%, and the relevant data are in good agreement, indicating that the regression formula can represent the calculated and measured results and can objectively reflect the evolution of the scour depth over time; among them, the results of the ice-cover scour depth are larger than those of the open-flow scour depth, and they are mostly concentrated on the side of the indoor test values, further indicating that the existence of ice cover makes a significant contribution to the local scour depth.

6. Conclusions

Using numerical simulation methods and comparing them with experimental data, the characteristic law and scale relationships of local scour around the combined bridge piers under the influence of different scouring environments, as well as the contribution of the pier-side vortex and bed shear stress to sediment particles, were investigated, and the following conclusions were drawn:
(1)
The local scouring caused by ice cover contributes to the total scouring around the submerged pier within its coverage area, significantly increasing the depth and extent of the local scouring holes. For the local scouring under open-flow conditions, the sediment initiation is doubly inhibited and the hydrodynamic forces in the scouring holes are weakened; compared with the two types of scouring environments, the relative maximum equilibrium scouring depth under ice-cover conditions is 11% deeper than that under open-flow conditions, and the relative maximum scouring hole radius is widened by 5%.
(2)
The local scour simulation results show that the three-dimensional morphology of scour holes under two types of scour conditions are symmetrically similar, and the back row of piers is affected by the shading and reinforcement effect of the front row of piers. The development of scour holes around the piers lags behind that of the front row of piers, and the scour holes before and after the equilibrium stage are in a coherent shape, which is basically consistent with the shape of scour holes in the physical model test. This proves the reliability of the numerical simulation and the application of the present research in environmental and engineering aspects.
(3)
The transport of sediment particles in the scour hole is the cause of local scouring around the pier, whereas the interaction between the vortex and shear stress on the pier side is the main dynamic mechanism of scouring around the pier. The characteristic quantity analysis shows that the maximum mean vortex increase ratio of the vertical line is approximately 3% and the maximum shear stress increase ratio is approximately 6% under the ice-cover condition compared with the open-flow condition at the same time, and the two have a strong correlation, which helps to deepen the understanding of the scouring mechanism by quantifying the influence of the vortex and shear stress on the development of scouring holes.
(4)
The formula for calculating the scour depth is obtained by regression fitting on the basis of considering different scour environment factors, and is verified by using hydraulic model test data. This proves its reliability and accuracy and its suitability for the prediction of local scour depth of bridge piers in wide pier and shallow flow type riverbeds. It can be used as a reference application for the selected field prototype bridge piers.
(5)
Different scour forms in natural riverbeds often occur simultaneously and affect each other. This paper only simulated and analyzed the local scour of bridge piers under flat-bed conditions, and more numerical simulations may be conducted in the future to provide more solutions for the sustainable development of engineering environment, and thus, subsequent studies will focus on the coupling relationship between relevant characteristic quantities under sand-wave-bed scour conditions.

Author Contributions

Conceptualization, X.M. and H.J.; methodology, P.G.; software, P.G.; validation, P.G.; formal analysis, P.G.; investigation, P.G.; resources, P.G.; data curation, P.G.; writing—original draft preparation, P.G.; writing—review and editing, P.G.; visualization, P.G.; supervision, X.M.; project administration, X.M.; funding acquisition, X.M. All authors have read and agreed to the published version of the manuscript.

Funding

This research was funded by the National Natural Science Foundation of China, grant number 52169017; National Natural Science Foundation of China, grant number 51969020; and Inner Mongolia Autonomous Region Natural Science Foundation, grant number 2022ZD08.

Institutional Review Board Statement

Not applicable.

Informed Consent Statement

Not applicable.

Data Availability Statement

The data presented in this study are available on request from the corresponding author or the first author.

Conflicts of Interest

The authors declare no conflict of interest.

References

  1. Unger, J.; Hager, W.H. Down-flow and horseshoe vortex characteristics of sediment embedded bridge piers. Exp. Fluids 2006, 42, 1–19. [Google Scholar] [CrossRef] [Green Version]
  2. Dey, S.; Raikar, R.V. Characteristics of Horseshoe Vortex in Developing Scour Holes at Piers. J. Hydraul. Eng. 2007, 133, 399–413. [Google Scholar] [CrossRef]
  3. Wang, B.; Xu, Y.J.; Xu, W.; Cheng, H.; Chen, Z.; Zhang, W. Riverbed Changes of the Uppermost Atchafalaya River, USA—A Case Study of Channel Dynamics in Large Man-Controlled Alluvial River Confluences. Water 2020, 12, 2139. [Google Scholar] [CrossRef]
  4. Qi, M. Riverbed scouring around bridge piers in river section with sand pits. J. Hydraul. Eng. 2005, 36, 835–839. [Google Scholar] [CrossRef]
  5. Hu, H.; Wang, J.; Cheng, T.; Hou, Z.; Sui, J. Channel Bed Deformation and Ice Jam Evolution around Bridge Piers. Water 2022, 14, 1766. [Google Scholar] [CrossRef]
  6. Cheng, Z.; Koken, M.; Constantinescu, G. Approximate methodology to account for effects of coherent structures on sediment entrainment in RANS simulations with a movable bed and applications to pier scour. Adv. Water Resour. 2018, 120, 65–82. [Google Scholar] [CrossRef]
  7. Ettema, R.; Constantinescu, G.; Melville, B.W. Flow-Field Complexity and Design Estimation of Pier-Scour Depth: Sixty Years since Laursen and Toch. J. Hydraul. Eng. 2017, 143. [Google Scholar] [CrossRef]
  8. Qi, M.; Li, J.; Chen, Q. Comparison of existing equations for local scour at bridge piers: Parameter influence and validation. Nat. Hazards 2016, 82, 2089–2105. [Google Scholar] [CrossRef]
  9. Paik, J.; Ge, L.; Sotiropoulos, F. Toward the simulation of complex 3D shear flows using unsteady statistical turbulence models. Int. J. Heat Fluid Flow 2004, 25, 513–527. [Google Scholar] [CrossRef]
  10. Rodi, W. Turbulence Modeling and Simulation in Hydraulics: A Historical Review. J. Hydraul. Eng. 2017, 143. [Google Scholar] [CrossRef]
  11. Stoesser, T. Large-eddy simulation in hydraulics: Quo Vadis? J. Hydraul. Res. 2014, 52, 441–452. [Google Scholar] [CrossRef]
  12. Jia, Y.; Altinakar, M.; Guney, M.S. Three-dimensional numerical simulations of local scouring around bridge piers. J. Hydraul. Res. 2017, 56, 351–366. [Google Scholar] [CrossRef]
  13. Chen, S.-C.; Tfwala, S.; Wu, T.-Y.; Chan, H.-C.; Chou, H.-T. A Hooked-Collar for Bridge Piers Protection: Flow Fields and Scour. Water 2018, 10, 1251. [Google Scholar] [CrossRef] [Green Version]
  14. Yang, Y.; Qi, M.; Li, J.; Ma, X. Evolution of Hydrodynamic Characteristics with Scour Hole Developing around a Pile Group. Water 2018, 10, 1632. [Google Scholar] [CrossRef] [Green Version]
  15. Wu, P.; Balachandar, R.; Sui, J. Local Scour around Bridge Piers under Ice-Covered Conditions. J. Hydraul. Eng. 2016, 142. [Google Scholar] [CrossRef]
  16. Roulund, A.; Sumer, B.M.; Fredsøe, J.; Michelsen, J. Numerical and experimental investigation of flow and scour around a circular pile. J. Fluid Mech. 2005, 534, 351–401. [Google Scholar] [CrossRef]
  17. Burkow, M.; Griebel, M. A full three dimensional numerical simulation of the sediment transport and the scouring at a rectangular obstacle. Comput. Fluids 2016, 125, 1–10. [Google Scholar] [CrossRef]
  18. Dixen, M.; Sumer, B.M.; Fredsøe, J. Numerical and experimental investigation of flow and scour around a half-buried sphere. Coast. Eng. 2013, 73, 84–105. [Google Scholar] [CrossRef]
  19. Sui, J.; Wang, J.; He, Y.; Krol, F. Velocity profiles and incipient motion of frazil particles under ice cover. Int. J. Sediment Res. 2010, 25, 39–51. [Google Scholar] [CrossRef]
  20. Sabbagh-Yazdi, S.-R.; Bavandpour, M. Numerical experiments on using incline collar rings for controlling mean and fluctuating forces on circular bridge piers. J. Fluids Struct. 2019, 91. [Google Scholar] [CrossRef]
  21. Shi, H.; Yu, X.; Dalrymple, R.A. Development of a two-phase SPH model for sediment laden flows. Comput. Phys. Commun. 2017, 221, 259–272. [Google Scholar] [CrossRef]
  22. Tavakoli, S.; Khojasteh, D.; Haghani, M.; Hirdaris, S. A review on the progress and research directions of ocean engineering. Ocean Eng. 2023, 272. [Google Scholar] [CrossRef]
  23. Nagata, N.; Hosoda, T.; Nakato, T.; Muramoto, Y. Three-Dimensional Numerical Model for Flow and Bed Deformation around River Hydraulic Structures. J. Hydraul. Eng. 2005, 131, 1074–1087. [Google Scholar] [CrossRef]
  24. Olsen, N.R.B.; Skoglund, M. Three-dimensional numerical modeling of water and sediment flow in a sand trap. J. Hydraul. Res. 1994, 32, 833–844. [Google Scholar] [CrossRef]
  25. Zhu, Z.-W.; Liu, Z.-Q. CFD prediction of local scour hole around bridge piers. J. Cent. South Univ. 2012, 19, 273–281. [Google Scholar] [CrossRef]
  26. Jalal, H.K.; Hassan, W.H. Three-dimensional numerical simulation of local scour around circular bridge pier using Flow-3D software. IOP Conf. Ser. Mater. Sci. Eng. 2020, 745, 012150. [Google Scholar] [CrossRef]
  27. Dey, S. Threshold of sediment motion on combined transverse and longitudinal sloping beds. J. Hydraul. Res. 2010, 41, 405–415. [Google Scholar] [CrossRef]
  28. Soulsby, R.L. Dynamics of Marine Sand; Thomas Telford Publications: London, UK, 1997. [Google Scholar]
  29. Zhu, Z.; Liu, Z. Three-dimensional Numerical Simulation for Local Scour Around Cylindric Bridge Pier. China J. Highw. Transp. 2011, 24, 42–48. [Google Scholar] [CrossRef]
  30. Mastbergen, D.R.; Van Den Berg, J.H. Breaching in fine sands and the generation of sustained turbidity currents in submarine canyons. Sedimentology 2003, 50, 625–637. [Google Scholar] [CrossRef]
  31. Zhang, Q.; Zhou, X.-L.; Wang, J.-H. Numerical investigation of local scour around three adjacent piles with different arrangements under current. Ocean Eng. 2017, 142, 625–638. [Google Scholar] [CrossRef]
  32. Meyer-Peter, E. Formulas for bed-load transport. Proc Congr. Iahr 1948, 3, 39–64. [Google Scholar]
  33. Rijn, V.; Leo, C. Sediment Transport, Part I: Bed Load Transport. J. Hydraul. Eng. 1985, 110, 1431–1456. [Google Scholar] [CrossRef] [Green Version]
  34. Sang, L.; Wang, J.; Cheng, T.; Hou, Z.; Sui, J. Local Scour around Tandem Double Piers under an Ice Cover. Water 2022, 14, 1168. [Google Scholar] [CrossRef]
  35. Khaple, S.; Hanmaiahgari, P.R.; Gaudio, R.; Dey, S. Interference of an upstream pier on local scour at downstream piers. Acta Geophys. 2017, 65, 29–46. [Google Scholar] [CrossRef]
  36. Farooq, R.; Ghumman, A.R. Impact Assessment of Pier Shape and Modifications on Scouring around Bridge Pier. Water 2019, 11, 1761. [Google Scholar] [CrossRef] [Green Version]
  37. Tang, J.-H.; Puspasari, A.D. Numerical Simulation of Local Scour around Three Cylindrical Piles in a Tandem Arrangement. Water 2021, 13, 3623. [Google Scholar] [CrossRef]
  38. Williams, P.; Balachandar, R.; Bolisetti, T. Examination of Blockage Effects on the Progression of Local Scour around a Circular Cylinder. Water 2019, 11, 2631. [Google Scholar] [CrossRef] [Green Version]
  39. Valela, C.; Sirianni, D.A.B.; Nistor, I.; Rennie, C.D.; Almansour, H. Bridge Pier Scour under Ice Cover. Water 2021, 13, 536. [Google Scholar] [CrossRef]
  40. Chen, X.; Li, Y.; Niu, X.; Li, M.; Chen, D.; Yu, X. A general two-phase turbulent flow model applied to the study of sediment transport in open channels. Int. J. Multiph. Flow 2011, 37, 1099–1108. [Google Scholar] [CrossRef] [Green Version]
  41. Le Minor, M.; Bartzke, G.; Zimmer, M.; Gillis, L.; Helfer, V.; Huhn, K. Numerical modelling of hydraulics and sediment dynamics around mangrove seedlings: Implications for mangrove establishment and reforestation. Estuar. Coast. Shelf Sci. 2019, 217, 81–95. [Google Scholar] [CrossRef]
  42. Briaud, J.L.; Ting, F.C.K.; Chen, H.C.; Cao, Y.; Han, S.W.; Kwak, K.W. Erosion Function Apparatus for Scour Rate Predictions. J. Geotech. Geoenviron. Eng. 2001, 127, 105–113. [Google Scholar] [CrossRef]
  43. Buckingham, E. On Physically Similar Systems; Illustrations of the Use of Dimensional Equations. Phys. Rev. 1914, 4, 345–376. [Google Scholar] [CrossRef]
  44. Thompson, D.A.W. Galileo and the Principle of Similitude. Nature 1915, 95, 426–427. [Google Scholar] [CrossRef] [Green Version]
  45. Ettema, R.; Melville, B.W.; Barkdoll, B. Scale Effect in Pier-Scour Experiments. J. Hydraul. Eng. 1998, 124, 639–642. [Google Scholar] [CrossRef]
  46. Briaud, J.-L.; Ting, F.C.K.; Chen, H.C.; Gudavalli, R.; Perugu, S.; Wei, G. SRICOS: Prediction of Scour Rate in Cohesive Soils at Bridge Piers. J. Geotech. Geoenviron. Eng. 1999, 125, 237–246. [Google Scholar] [CrossRef]
  47. Cardoso, A.H.; Bettess, R. Effects of Time and Channel Geometry on Scour at Bridge Abutments. J. Hydraul. Eng. 1999, 125, 388–399. [Google Scholar] [CrossRef]
  48. Whitehouse, R.J.S.; Mitchener, H.J. Observations of the morphodynamic behaviour of an intertidal mudflat at different timescales. Geol. Soc. Lond. Spec. Publ. 2022, 139, 255–271. [Google Scholar] [CrossRef]
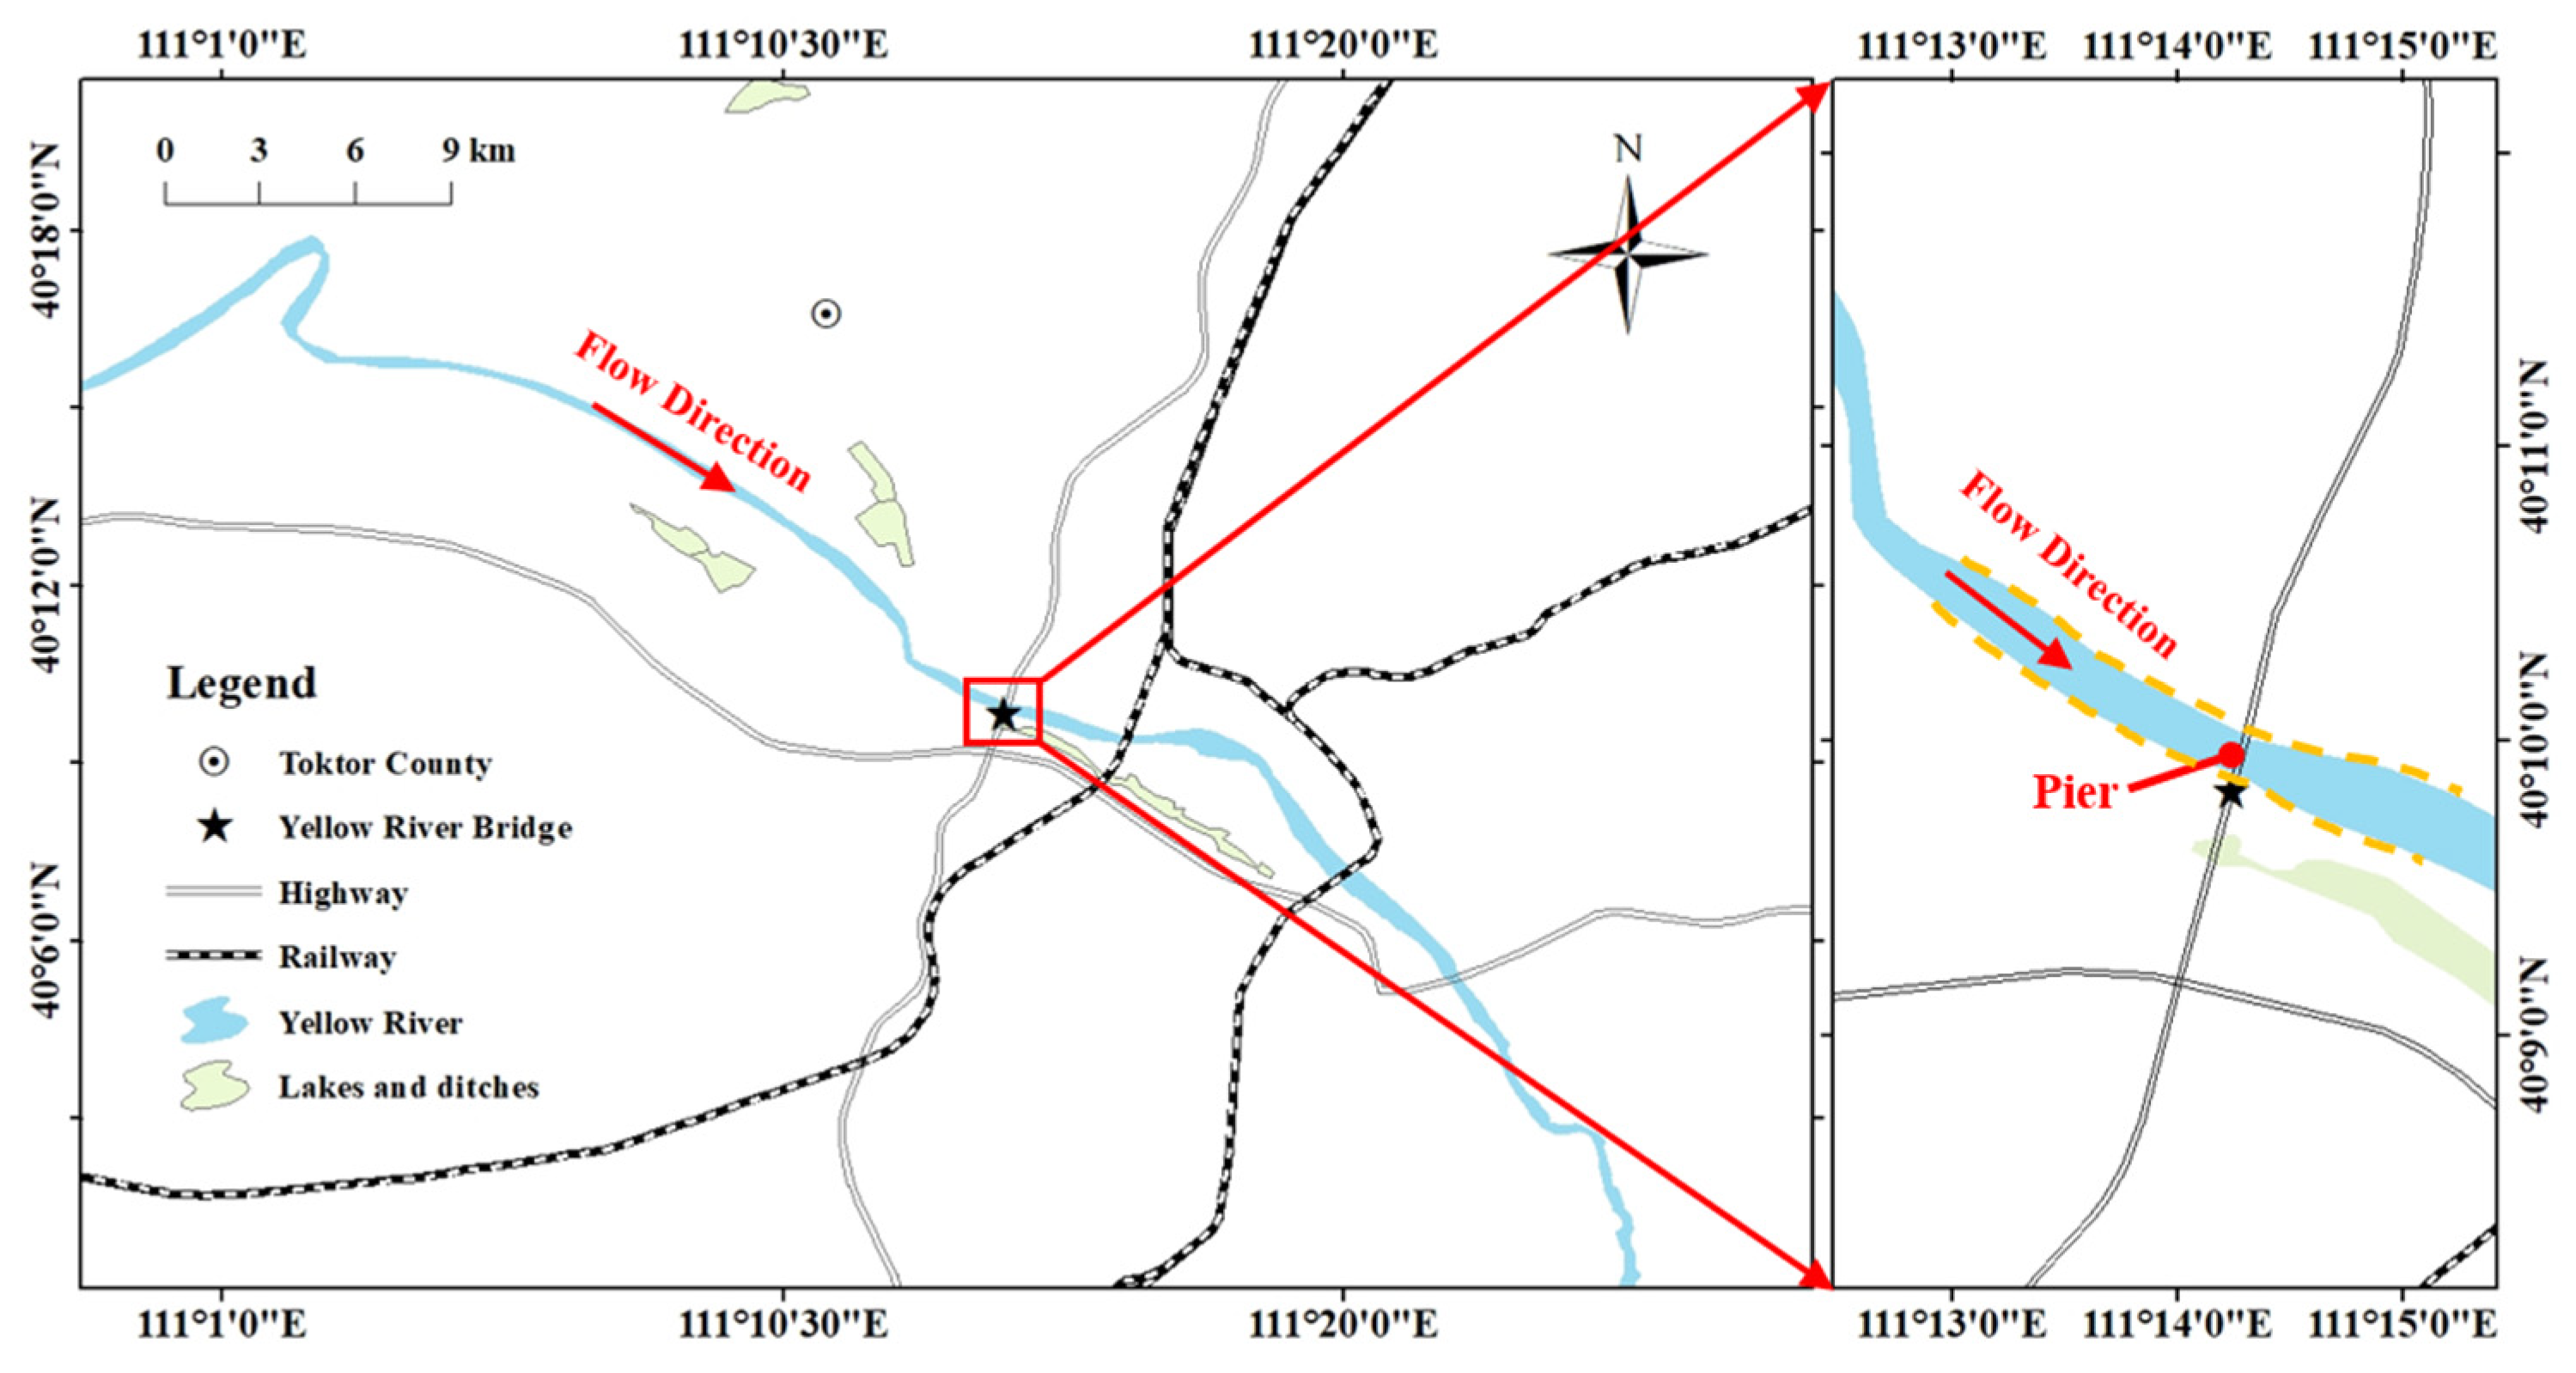
Figure 1. Schematic diagram of the location of the study area (an enlarged view of the study area is shown on the right, where the wading piers are located in the middle of the straightened river channel).
Sustainability 15 07171 g001
Figure 2. Calculation process of the numerical model.
Sustainability 15 07171 g002
Figure 3. Experimental layout: (a) side view; (b) top view.
Sustainability 15 07171 g003
Figure 4. Schematic diagram of the combined piers: (a) model pier and ice cover; (b) prototype pier.
Sustainability 15 07171 g004
Figure 5. Three-dimensional numerical model: (a) open-flow condition; (b) ice-cover condition.
Sustainability 15 07171 g005
Figure 6. Schematic diagram of computational meshing and nesting: (a) mesh planar division; (b) 1-1 profile mesh vertical division.
Sustainability 15 07171 g006
Figure 7. Schematic diagram of the comparison of scour hole morphology around the pier: (a) numerical results; (b) experimental results.
Sustainability 15 07171 g007
Figure 8. Schematic diagram of scouring terrain contours (a–j is the location of measurement points around the bridge pier).
Sustainability 15 07171 g008
Figure 9. Temporal development of the relative scour depth.
Sustainability 15 07171 g009
Figure 10. Cross-sectional eddies on the upstream pier side under open-flow conditions (letter "b" is the measuring line, unit: 1/s).
Sustainability 15 07171 g010
Figure 11. Cross-sectional eddies on the upstream pier side under ice-cover conditions (letter "b" is the measuring line, unit: 1/s).
Sustainability 15 07171 g011
Figure 12. Distribution of shear stress on the bed surface around the pier under open-flow conditions (unit: Pa).
Sustainability 15 07171 g012
Figure 13. Distribution of shear stress on the bed surface around the pier under ice-cover conditions (unit: Pa).
Sustainability 15 07171 g013
Figure 14. Correlation between pier circumferential vorticity and shear stress.
Sustainability 15 07171 g014
Figure 15. Three-dimensional morphology of bed scouring and silting under open-flow conditions (unit: cm).
Sustainability 15 07171 g015
Figure 16. Three-dimensional morphology of bed scouring and silting under ice-cover conditions (unit: cm).
Sustainability 15 07171 g016
Figure 17. Distribution of scour elevation along the bridge pier: (a) longitudinal-section elevation; (b) transverse-section elevation.
Sustainability 15 07171 g017
Figure 18. Comparison of scour hole sidewall slopes: (a,c) open-flow condition; (b,d) ice-cover condition.
Sustainability 15 07171 g018
Figure 19. Comparison of experimental measured values and regression empirical equation values.
Sustainability 15 07171 g019
Disclaimer/Publisher’s Note: The statements, opinions and data contained in all publications are solely those of the individual author(s) and contributor(s) and not of MDPI and/or the editor(s). MDPI and/or the editor(s) disclaim responsibility for any injury to people or property resulting from any ideas, methods, instructions or products referred to in the content.