1. Introduction
As the supplying place of basic energy, mineral-resource-based cities have made great contributions to China’s economic and social development [
1,
2]. The goafs formed by the long-term mining of coal occupy a number of land resources and restrict the development of cities [
3,
4]. If the land resources above a goaf can be reasonably developed and utilized, it can not only reduce the waste of resources and turn waste into treasure but also help to promote the transformation and development of resource-based cities [
5,
6]. For example, the InterContinental Shimao Wonderland Hotel in Shanghai is the first natural ecological hotel built on an abandoned goaf site in China [
7], the Dawang Mountain Mine Pit in Changsha has been turned into an ice and snow theme park and a water park according to its geological conditions and regional development characteristics [
8], and the Jiaozuo Seam Mountain National Mine Park is a comprehensive mine park that focuses on displaying the landscape of coal mining relics [
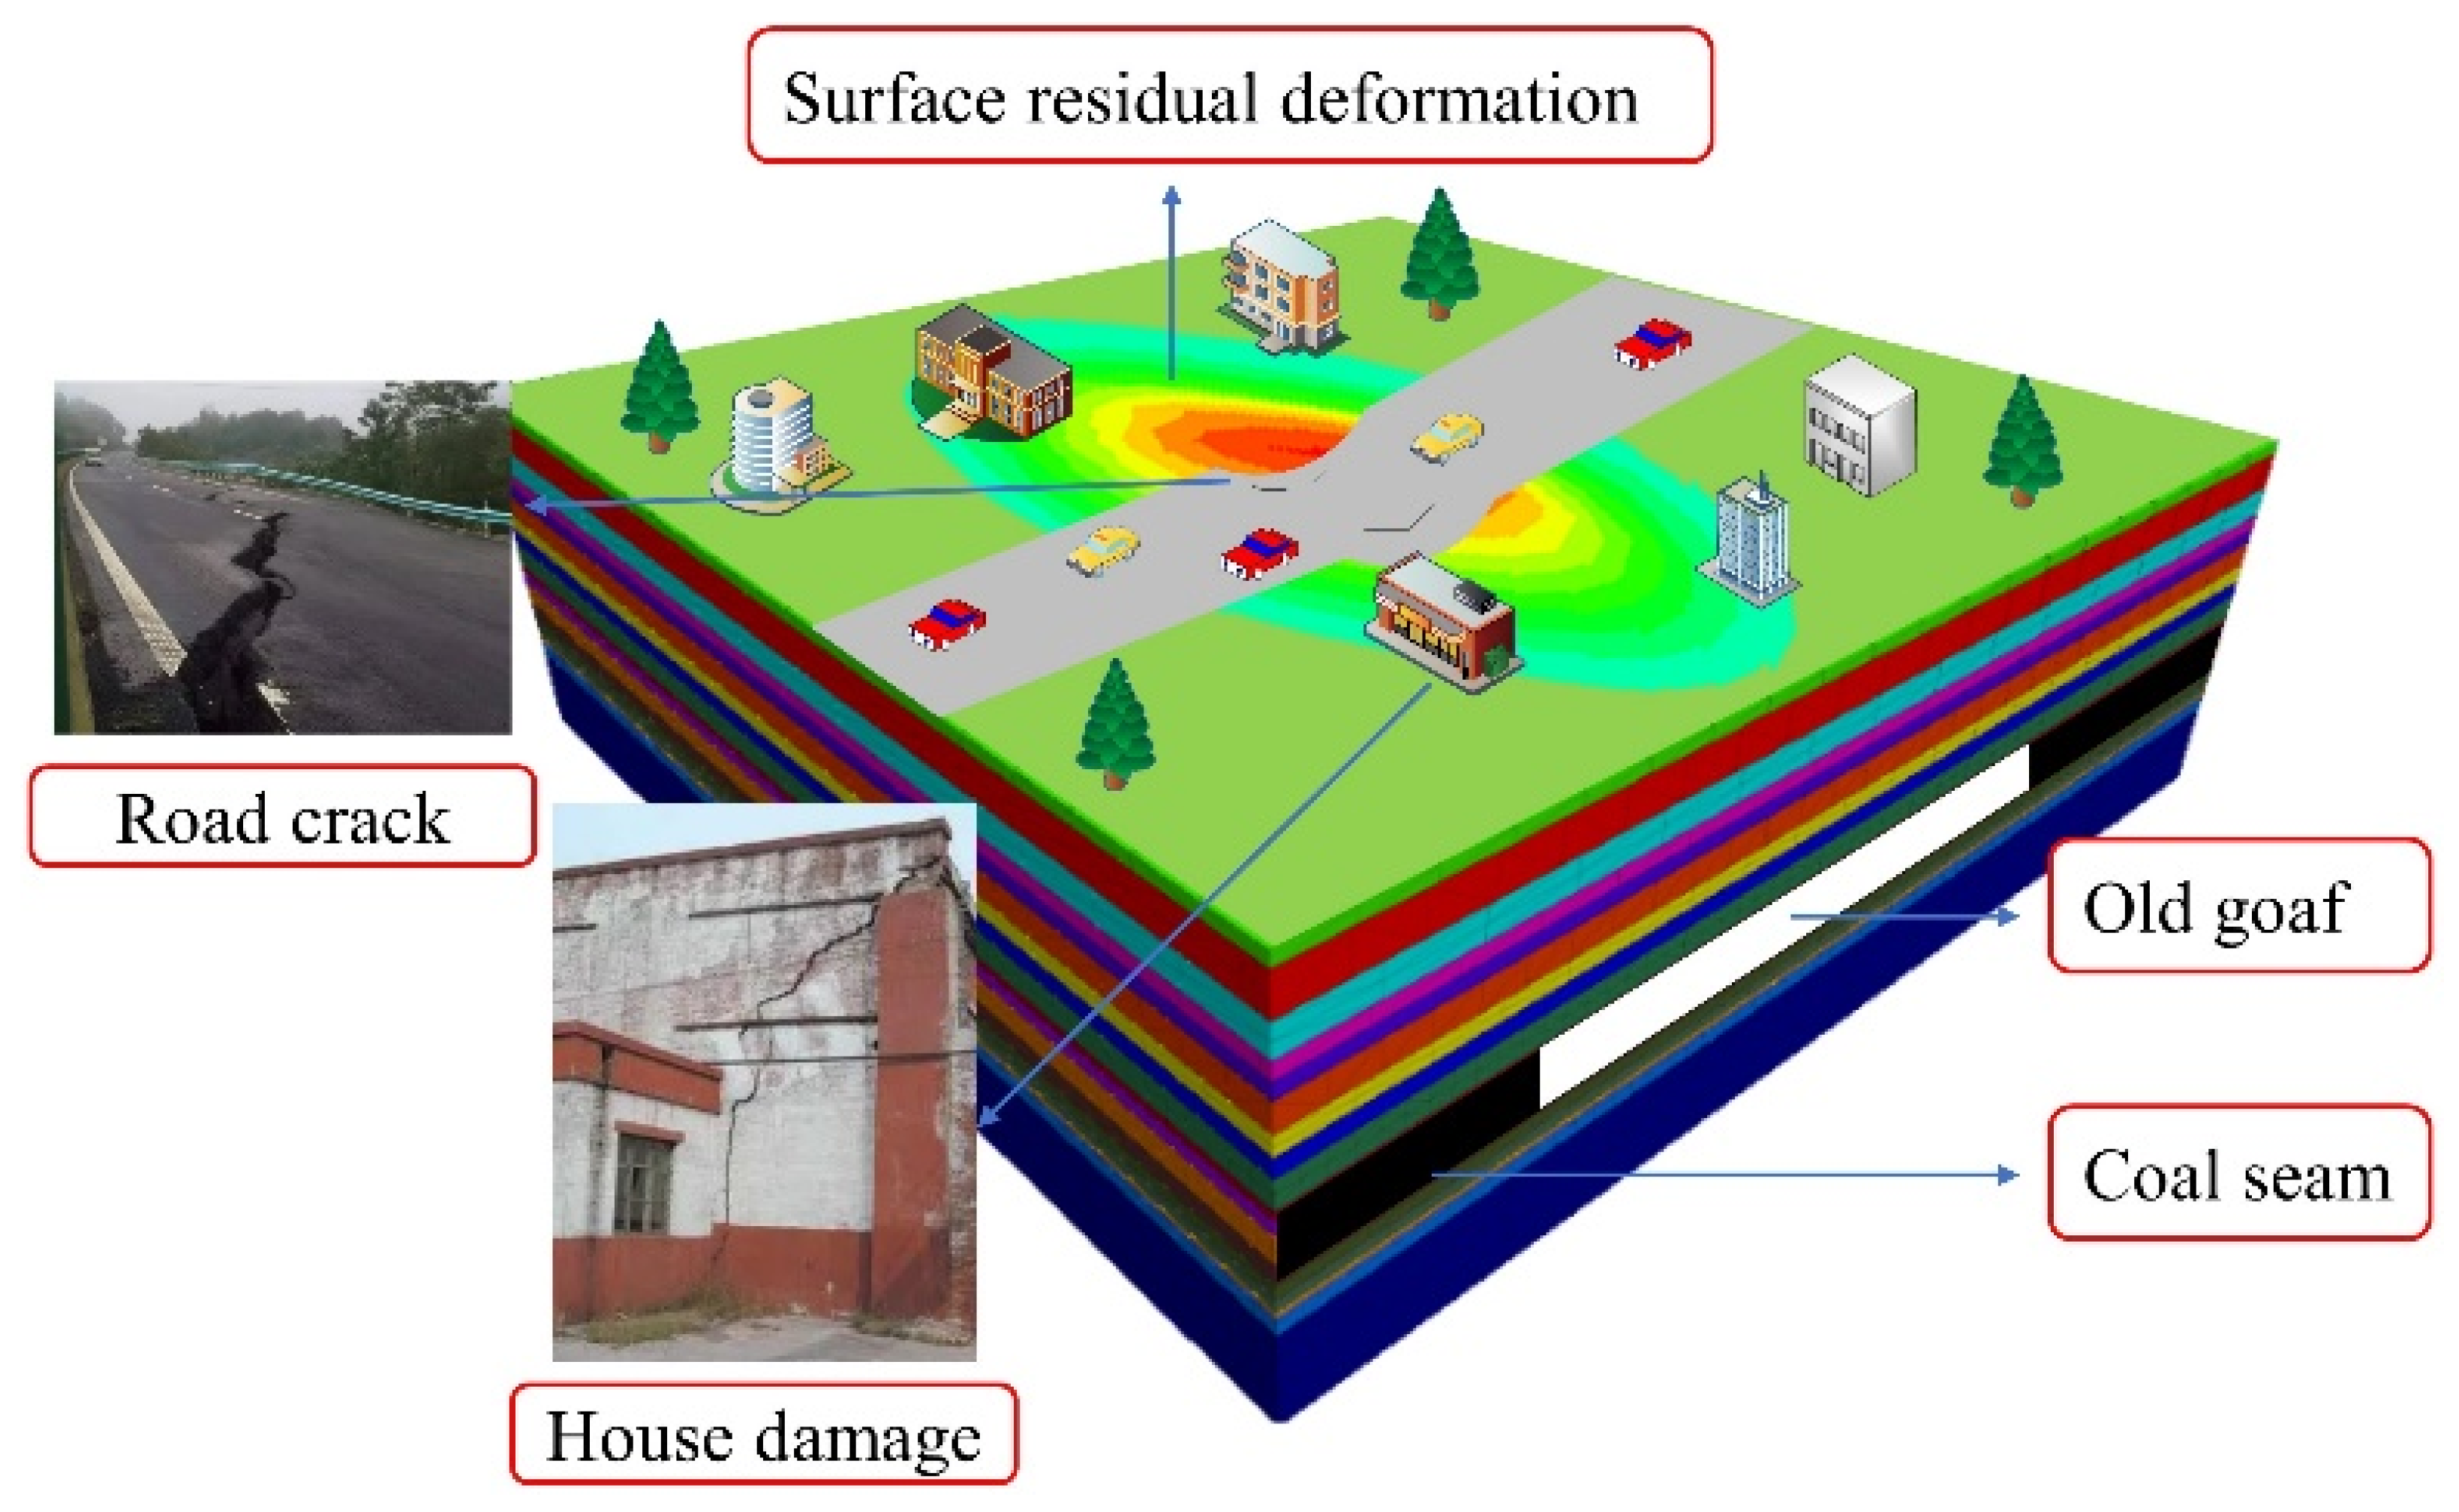
9]. When a building is built over a goaf, the internal rock strata will produce secondary deformation under the action of building load stress, which will lead to residual deformation on the surface and damage to the building [
10,
11], including road damage and house cracking, as shown in
Figure 1. Therefore, the study on the stability of the construction site above a goaf is the basis for the reuse of land resources above abandoned goafs [
12,
13].
Many scholars have carried out research around this topic using to different theories. By analyzing the overburden failure and structure formation conditions, Bai et al. (2022) proposed a regional division method and concluded that the residual surface deformation of a goaf was closely related to the mining time [
14]. Xu et al. (2023) evaluated the stability of a goaf through numerical simulations, and then classified the suitability of the site based on the simulation results and proposed different ecological restoration schemes [
15]. Kalantari et al. (2023) combined a finite element method with a geostatistical method and evaluated the influence of borehole location on the stability of a sloped construction site by selecting effective soil parameters with significant influence [
16]. Jia et al. (2022) combined field monitoring data with numerical simulation to achieve deformation and failure of a goaf over time and made a comprehensive evaluation of its stability [
17]. Tao et al. (2022) selected 15 indexes to analyze the site selection for the development and utilization of abandoned goafs, obtained the weight of the indexes by using a triangular intuitionistic fuzzy number and then determined the optimal site-selection decision-making framework by using the multi-criteria decision theory [
18]. Dai et al. (2022) established an evaluation system for the stability of a goaf based on AHP and conducted a case study by obtaining evaluation cloud maps through cloud models. The evaluation results were consistent with reality, which could provide reference for the subsequent management work [
19].
The above methods have achieved good evaluation results, but the numerical simulation is too complex, the workload is large, and the evaluation results rely too much on the reliability of the parameters. The mathematical methods are easily affected by subjective factors in the process of evaluation, ignoring the randomness of the system. Considering that the stability evaluation of a construction site is a complex nonlinear problem, nonlinear scientific theory can scientifically assess the risk of complex fuzzy system engineering.
It should be noted that when solving problems with nonlinear science, the weights and memberships are important parameters to determine the correctness of the evaluation results; however, the existing index weight determination method is singular, and only comprehensive weight can more comprehensively express the importance of the indexes. The memberships are determined by expert experience in the past, and it is highly subjective. At the same time, how to determine the level of stability scientifically and reasonably also needs to be solved at present. The normal cloud model can unify the randomness of the evaluation index and improve the accuracy and reliability of the results.
In view of this, this paper will firstly build a construction site stability evaluation index system combined with the existing research and use improved AHP, rough set and CRITIC to weigh the evaluation index subjectively and objectively, and finally, it will be based on the normal connection cloud theory, which will establish a set of stability evaluation models. The model will conduct a case study for the Mianluan Expressway construction site to better illustrate the superiority of the proposed method.
2. Study Area
The Mianluan Expressway is one of the 10 routes in the planning and adjustment scheme of the expressway network in Henan Province. The route adopts the technical standard of a four-lane highway. The section K4 + 800~K8 + 150 from Mianchi to Luoning passes through 14 working faces of the Qianqiu coal mine, and the length of the route above the mine field is 3.35 km in total (
Figure 2).
The terrain of Qianqiu is relatively undulating and the thickness of the stratum is 31.89 to 76.66 m. The surface is mostly covered by Quaternary brown-red clayey, there are near north-south trending valleys being developed, and the dip angle of the coal seam is 11~13°. In addition, it is a high gas mine with simple structure and is a medium hydrogeological type; the main coal seam is relatively stable.
3. Methodology
In this paper, an evaluation index system is constructed firstly, and the comprehensive weight is obtained based on the improved AHP, rough set and CRITIC methods. Then, the cloud model is applied to determine the stability level of study area, and finally, the evaluation results are verified. The research framework is shown in
Figure 3.
3.1. Construction of Index System
There are many indexes related to the stability of a construction site [
20]. According to the site conditions of the research area and through combing the relevant literature, the evaluation indexes are selected based on relevance, hierarchy, representativeness and feasibility [
21,
22,
23,
24]. Therefore, 10 indexes such as structural complexity, mining method and relative position are selected, as shown in
Figure 4. In order to better evaluate the construction site, the stability level is divided into grades I, II, III and IV, representing stable, basically stable, under stable and unstable, respectively [
25]. According to the relevant literature combined with the actual situation of the study area, the corresponding grade standard of each evaluation index is determined, as shown in
Table 1.
3.2. Index Weight Determination
After constructing the evaluation index system, due to the different degrees of influence of any index on the results and in order to fully reflect the importance of a single indicator in the evaluation model, corresponding weights to each index according to its importance degree need to be assigned. The weights of indexes are directly related to the overall evaluation results. Therefore, how to obtain the index weight reasonably and scientifically is another problem that needs to be solved in this paper.
3.2.1. Improved AHP
AHP determines the subjective weight by constructing the judgment matrix. If the matrix does not satisfy the consistency test, it needs to reconstruct the judgment matrix, which greatly increases the workload [
26]. Therefore, this paper improves the AHP based on the weight coefficient, establishes the judgment matrix through the optimal transfer matrix, removes the consistency-check process, and avoids the possible inconsistency problem [
27].
1. Judgment matrix. The improved AHP makes pairwise comparisons of the importance of evaluation indexes and uses a 1–9 scale (
Table 2) to quantify the relative importance [
28]. Then, matrix
A is constructed by Equation (1).
where
Aij is the relative importance between index
Ai and index
Aj and
n is the number of indexes.
2. Antisymmetric matrix. The judgment matrix
A is transformed into an antisymmetric matrix
G by Equation (2).
3. Quasi-optimal transitive matrix. The optimal transfer matrix
Fij is solved by Equation (3), and then the quasi-optimal transfer matrix
Eij is obtained by Equation (4).
4. Weight coefficient. The weight coefficient
bi for the data in the matrix
Eij is obtained by Equation (5), and then the subjective weight
Bi of the index is obtained by Equation (6).
3.2.2. Improved Rough Set
A rough set can deal with the expression and induction of incomplete and uncertain data. The results obtained are objective and reliable and can effectively avoid the influence of subjective factors [
29]. In this theory, data information is expressed in the form of a decision table. In general, an information table belongs to an expression system,
H, as shown in Equation (7) [
30].
where
U is the set of evaluation objects,
C is the set of conditional attributes,
D is the set of decision attributes,
V is the set of attribute values, and
f is the attribute value.
However, in the previous process of calculating attribute weight by using rough set theory, there will be the case that the index weight is 0. To solve this problem, conditional entropy is introduced to improve rough set theory [
31].
In decision information table
H, the conditional entropy
D (
U/
D = {
D1,
D2, …,
Dm}) relative to
C (
U/
C = {
C1,
C2, …,
Cn}) can be expressed by Equation (8).
where
I(
D|
C) is the conditional entropy, and
n and
m represent the number of indexes and objects to be evaluated, respectively.
In the decision information table, the importance degree
New Sig(
Ci) of the conditional attribute
Ci can be expressed by Equation (9).
where
New Sig (
Ci) is the change degree of the attribute set after removing conditional attribute
Ci.
Then the weight
P(
Ci) of each condition attribute can be obtained by Equation (10).
where
I(
D|
Ci) is the importance of the condition attribute
Ci itself in the decision table.
3.2.3. Improved CRITIC
Criteria Importance Though Intercriteria Correlation (CRITIC) not only considers the amount of information between indexes but also considers the correlation between indexes [
32]; however, the dimension and order of magnitude between different indexes are often different, and there are some shortcomings in using standard deviation to reflect the difference of indexes in the CRITIC method [
33]. Therefore, the coefficient of variation is adopted to improve the CRITIC method to better realize the index weight assignment [
34].
1. Matrix
X is established with the original evaluation index value:
where
xij is the
ith evaluation object and the
jth index value.
2. The elements in matrix
X are standardized by Equation (12), and the standardized matrix
X* = (
) is obtained.
where
is the average value and
is the mean square error of index
j.
3.
vj is the variation coefficient of the
jth index, which can be calculated by Equation (13):
4. Pearson correlation coefficient of each index in matrix
X* can be calculated by SPSS software, and the correlation coefficient matrix
R = (
rkj)
n×n can be constructed [
35]. Then, the independence coefficient
ηj is calculated by Equation (14).
5. According to the results of Equations (13) and (14), the importance coefficient
Cj is calculated by Equation (15).
From Equation (15), the larger the
θj value, the stronger the reference value of the index
j, and the higher its importance, which should be given greater weight. Therefore, the weight
Qj can be calculated by Equation (16).
3.2.4. Game Theory
Based on game theory, the comprehensive weight can be obtained by combining the subjective weight and objective weight [
36]. For multi-index evaluation systems, it is assumed that
L methods are adopted to determine the weight, namely, the weight vector
W, which is shown in Equation (17).
Therefore, a weight set
W can be obtained, and the linear combination of
L weight vectors can be expressed by Equation (18).
where
αl is the linear combination coefficient.
In order to select the most appropriate weight vector
W, the linear combination coefficient should be optimized to minimize the deviation between
W and each
wl, and its objective function can be derived by Equation (19) [
37].
Based on the differential properties, the optimal first-order derivative conditions equivalent to the above equation are shown in Equation (20).
The available coefficient vectors (
α1,
α2, …,
αL) are obtained by solving the Equation (21). Then, the comprehensive weight
W* can be obtained by Equation (22):
3.3. Cloud Model
3.3.1. Basic Concepts
The cloud model was first proposed in 1995 to solve the uncertainty transition between qualitative concepts and quantitative descriptions [
38], which can be used to obtain the membership degree of evaluation indexes, mainly using the forward Gaussian cloud generator as the medium [
39]. Three cloud digital features (expectation
Ex, entropy
En and hyper entropy
He) are input so as to output the membership degree of cloud droplets [
40]. The specific algorithms are as follows:
1. Three digital features can be calculated by Equation (23).
where
Hmin and
Hmax are the upper and lower boundary values of the index range, respectively.
λ is a constant, and it can be changed with randomness and the actual situation of the index. In this paper,
λ = 0.02 [
41].
2. The normal numbers
En′, with
En as the expectation and
He2 as the variance, are generated randomly by Equation (24) [
42]:
3. Normal numbers
xi, with
Ex as the expectation and
En′2 as the variance, are generated randomly by Equation (25):
4. Membership
μ is calculated by Equation (26):
3.3.2. Determination of Stability Grade
Before calculating the membership degree of the indexes, three cloud digital features need to be calculated, as shown in
Table 3. The cloud model of each evaluation index is shown in
Figure 5. The digital characteristics of the indexes are the same where
i = 1, 2, 3, 4, 5, 6, 10 in order to reduce the space and do not repeat the expression.
By compiling the program of the normal cloud generator, the membership degree can be obtained, and the fuzzy operator is used to multiply it with the corresponding index weight by Equation (27). Finally, the value of each working face construction site belonging to each stability grade can be obtained [
43].
where
φj is the membership degree of the
jth level, and
μij is the membership degree of the
ith index at the corresponding level
j.
4. Results
In order to verify the feasibility and reliability of the established model, 14 working faces traversed by the Mianluan Expressway are taken as the stability objects, and the stability of the sites are evaluated. The specific index values of each working face are in
Table 4.
4.1. Stability Evaluation Results
Firstly, according to the improved AHP theory, matrix
A is constructed by pairwise comparison of 10 evaluation indexes, as shown in Equation (28). Then the subjective weight
W1 is calculated according to Equation (1) to Equation (6)
Then, according to the improved rough set theory and the grading standards in
Table 1, attribute reduction is carried out on the index values in
Table 4 to construct the decision table, as shown in
Table 5. The calculation results of conditional entropy, importance and index weight
W2 are in
Table 6.
The correlation coefficients of the indexes are calculated according to the improved CRITIC method, and the heat map of the correlation coefficient is shown in
Figure 6. Then, according to Equation (14) to Equation (16), the weight W3 can be obtained, as shown in
Table 7.
In addition, according to the combination principle of game theory, the normalized linear combination coefficient was obtained as
α1 = 0.6430,
α2 = 0.0343,
α3 = 0.3227, so the comprehensive weight
W* can be obtained, which can reflect that the comprehensive weight not only considers the judgment of experts’ subjective factors but also takes into account the characteristics of the index itself, as shown in
Table 7.
According to the cloud model theory, the membership degree of each evaluation index is calculated, and then the certainty degree of each working face construction site belonging to each stability level is calculated by Equation (27). The results are shown in
Figure 7 and in columns 3 to 6 in
Table 8. From
Table 8, the membership degree of the stability level of the irregular goaf is
φ = (0.0112, 0.1223, 0.0940, 0.0032) based on the principle of maximum membership degree, concluding that the state of the irregular goaf is basically stable. Similarly, stability levels of other sites can be obtained, as shown in column 7 of
Table 8.
It can be seen intuitively from
Figure 7 that the stability levels of the construction site of the Mianluan Expressway are different and that there are two states: stable and basically stable. Considering that the stable site is also easily affected by the disturbance of mining hydrogeology and engineering geology, the subgrade should be paved with geotechnical materials to improve its safety when developing and utilizing the construction site.
4.2. Sensitivity Analysis of Subjective Weights
In this paper, the improved AHP is used to determine the subjective weight of an indexes, which can effectively improve the accuracy of the subjective weight; however, there will inevitably be human subjective factors that affect the credibility of the evaluation. Therefore, this paper uses the OAT (one at a time) method to test the sensitivity of the subjective weight, which can reflect the impact of the changes in the index weights on the evaluation results by changing the weight value of an evaluation index at a given time while keeping the weights of other indexes unchanged [
44,
45]. The steps of the OAT method are as follows:
1. Defining the RPC (range of percent change). The RPC is the variation range of the subjective weight of the evaluation index.
2. Defining the IPC (increment of percent change). The IPC represents each percentage change in the subjective weight within the RPC range.
3. An index
Cm in the index system is selected as the target index. Under the premise of defined the RPC and IPC, its weight will generate different simulated weights after changing the percentage pc, as shown in Equation (29):
where
pc is the percentage of weight change,
W(
Cm, 0) is the initial value of the weight of the index
Cm,
W(
Cm,
pc) is the simulated weight of the index
Cm after changing the percentage
pc,
W(
Ci, 0) is the initial value of the weight of the
ith index
Ci, and
W(
Ci,
pc) is the changed weight of other indexes.
4. Calculating the evaluation score value after the weight change, as shown in Equation (31).
where
R(
Cm,
pc) is the evaluation score obtained as the weight of
Cm changes,
Am is the weight ranking score of index
Cm,
W(
Cj,
pc) is the weight of other indexes, and
Aj is the ranking score value of other indexes.
5. Calculating the rate of score change
Rate(
Cm,
pc).
where
Rate(
Cm,
pc) is the change rate of score after the weight of index
Cm changes.
In this paper, the RPC and IPC are set to ±100% and ±5% respectively and applied to all indexes. A total of 410 sets of weight values are generated for the 10 indexes and the results of the corresponding rate of change of scores are shown in
Figure 8.
From the
Figure 8, the score change rate presents a centrosymmetric distribution at 0% and an approximate linear increase with the increase in the absolute value of the weight change rate. The higher the slope of the evaluation index, the higher its sensitivity. The sensitivity of index
C9 (stopping time) to weight changes is the highest, and when the weight changes by 100%, the corresponding rate value is 12.44%, which is much smaller than the degree of weight change, indicating that the subjective weights determined in this paper are reasonable and effective and can objectively reflect the stability of the construction site above the goaf.
4.3. Validation of Model Correctness
To verify the correctness of the model, settlement observation points are arranged in the study area, and the first settlement observation began on 6 May 2019. As of 15 November 2019, it had been monitored 6 times, with a cumulative observation duration of 6 months, as shown in
Figure 9. The corresponding evaluation standard for each stability level is shown in
Table 9 [
46,
47].
It can be seen from
Figure 9 that there is still residual settlement on the surface, but the maximum subsidence in 6 months is less than 3 mm, and the maximum subsidence velocity is less than 0.2 mm/d. According to
Table 9, it is judged that the study area is stable as a whole, which further proves the reliability of the established model.
5. Discussion
In this study, improved AHP, rough set and CRITIC methods are used to determine the weights of evaluation indexes, which can effectively reduce the deviation caused by a single-weight determination method, and based on the game theory, the two weights are combined to increase the accuracy and rationality of the weight determination. In addition, so as to obtain the stability state of the study area, a cloud model is used as the medium to determine the membership degree of each index by calculating the cloud digital characteristics, which effectively solves the problem of uncertainty conversion between the qualitative concepts and quantitative values in the evaluation process. Furthermore, the stability level can be intuitively seen form
Figure 7, and the degree of favoritism to the adjacent two levels can be clearly seen, which makes the evaluation level more intuitive.
Although the reliability of the evaluation results can be improved by this model, there are some disadvantages. In the process of constructing the evaluation index system, the correlation and redundancy between the indexes should be fully considered, and the results of the index system construction should be different for different research areas. Therefore, future research will focus on the establishment of a universally applicable stability evaluation index system. Moreover, it is also necessary to improve the quantitative standards of qualitative indexes.
6. Conclusions
In this study, the subjective and objective combination weighting method and the cloud model are combined to obtain the stability state of the construction site and it is applied to a specific case. Several main conclusions are discovered in this paper:
1. Based on the principles of relevance, hierarchy, representativeness and feasibility of index selecting, 10 indexes are selected to construct an evaluation index system, which not only avoids the repetition of information expressed by evaluation indexes, but also method ensures that the index system can fully reflect the data characteristics.
2. In view of the singleness of the weight determination method, an improved AHP method is used to determine the subjective weight, and improved rough set and CRITIC models are adopted to determine the objective weight, which not only reduces the unreasonable influence of the index weight caused by the objective weight being too sensitive to the data but also avoids the problem of excessive subjectivity caused by subjective weights. Then, the subjective and objective weights are combined based on game theory, which can increase the accuracy and rationality of the weight determination.
3. The qualitative concepts are quantified by the cloud model, and the cloud digital features are obtained according to the evaluation index grading standards. Then the stability grade of each working face is determined based on the principle of maximum membership degree, which improves the reliability of the evaluation results.
4. The evaluation results show that the stability level of the study area is not uniform and that there are two states: stable and basically stable. According to the high-resolution leveling results, the reliability of the results is further verified.
Author Contributions
Conceptualization, L.W. and Q.G.; methodology, L.W.; software, L.W.; validation, Q.G. and X.Y.; formal analysis, L.W.; writing—original draft preparation, L.W.; writing—review and editing, Q.G. and X.Y. All authors have read and agreed to the published version of the manuscript.
Funding
This research was funded by the Natural Science Foundation of China (No. 52274164), the Open Fund of State Key Laboratory of Water Resource Protection and Utilization in Coal Mining (No. GJNY-21-41-15), the Graduate Innovation Fund Project of Anhui University of Science and Technology (No. 2022CX2162), the Key Project on Research and Development of Anhui Province (No. 202104a07020001), and the Provincial graduate academic innovation program (No. 2022xscx079).
Institutional Review Board Statement
Not applicable.
Informed Consent Statement
Not applicable.
Data Availability Statement
Not applicable.
Conflicts of Interest
The authors declare no conflict of interest.
References
- Wang, X.; Duan, Q.Q. Improved AHP–TOPSIS model for the comprehensive risk evaluation of oil and gas pipelines. Pet. Sci. 2019, 16, 1479–1492. [Google Scholar] [CrossRef]
- Li, W.W.; Yi, P.T.; Zhang, D.N.; Zhou, Y. Assessment of coordinated development between social economy and ecological environment: Case study of resource-based cities in northeastern China. Sustain. Cities Soc. 2020, 59, 102208. [Google Scholar] [CrossRef]
- Dong, S.C.; Samsonov, S.; Yin, H.W.; Huang, L.L. Two-dimensional ground deformation monitoring in Shanghai based on SBAS and MSBAS InSAR methods. J. Earth Sci. 2018, 29, 960–968. [Google Scholar] [CrossRef]
- Xu, X.; Xing, Y.C.; Guo, Z.; Huang, Y. Stability analysis of rainfall-triggered Toe-Cut slopes and effectiveness evaluation of Pile-Anchor structures. J. Earth Sci. 2021, 32, 1104–1112. [Google Scholar] [CrossRef]
- Kazançoglu, Y.; Ada, E.; Ozturkoglu, Y.; Ozbiltekin, M. Analysis of the barriers to urban mining for resource melioration in emerging economies. Resour. Policy 2020, 68, 101768. [Google Scholar] [CrossRef]
- Liu, Y.; Zhang, W.G.; Zhang, L.; Zhu, Z.R.; Hu, J.; Wei, H. Probabilistic stability analyses of undrained slopes by 3D random fields and finite element methods. Geosci. Front. 2018, 9, 1657–1664. [Google Scholar] [CrossRef]
- Dahlgren, K. The final voids: The ambiguity of emptiness in Australian coal mine rehabilitation. J. R. Anthropol. Inst. 2022, 28, 537–555. [Google Scholar] [CrossRef]
- Tan, F.; Jiao, Y.Y.; Wang, H.; Liu, Y.; Tian, H.N.; Chen, Y. Reclamation and reuse of abandoned quarry: A case study of Ice World & Water Park in Changsha. Tunn. Undergr. Space Technol. 2019, 85, 259–267. [Google Scholar] [CrossRef]
- Lyu, X.; Yang, K.; Fang, J.J. Utilization of resources in abandoned coal mines for Carbon Neutrality. Sci. Total Environ. 2022, 822, 153646. [Google Scholar] [CrossRef]
- Guo, Q.B.; Meng, X.R.; Li, Y.M.; Lv, X.; Liu, C. A prediction model for the surface residual subsidence in an abandoned goaf for sustainable development of resource-exhausted cities. J. Clean. Prod. 2021, 279, 123803. [Google Scholar] [CrossRef]
- Schuchová, K.; Lenart, J. Geomorphology of old and abandoned underground mines: Review and future challenges. Prog. Phys. Geogr. 2020, 44, 791–813. [Google Scholar] [CrossRef]
- Guo, Q.B.; Guo, G.L.; Lv, X.; Zhang, W.X.; Lin, Y.K.; Qin, S.Y. Strata movement and surface subsidence prediction model of dense solid backfilling mining. Environ. Earth Sci. 2016, 75, 1426. [Google Scholar] [CrossRef]
- Jiskani, I.M.; Han, S.; Rehman, A.U.; Shahani, N.M.; Tariq, M.; Brohi, M.A. An Integrated entropy weight and grey clustering method–based evaluation to improve safety in mines. Min. Metall. Explor. 2021, 38, 1773–1787. [Google Scholar] [CrossRef]
- Bai, E.; Guo, W.B.; Tan, Y.; Guo, M.J.; Wen, P.; Liu, Z.Q.; Ma, Z.B.; Yang, W.Q. Regional division and its criteria of mining fractures based on overburden critical failure. Sustainability 2022, 14, 5161. [Google Scholar] [CrossRef]
- Xu, Z.; Xu, W.; Zhou, P.; Zhu, Z.; Zhao, J.; Gao, P. Research on coal mine goaf restoration based on stability of overlying rocks and numerical simulation analysis: A case study of Jingmen garden expo park. Sustainability 2023, 15, 1464. [Google Scholar] [CrossRef]
- Kalantari, A.R.; Johari, A.; Zandpour, M.; Kalantari, M. Effect of spatial variability of soil properties and geostatistical conditional simulation on reliability characteristics and critical slip surfaces of soil slopes. Transp. Geotech. 2023, 39, 100933. [Google Scholar] [CrossRef]
- Jia, H.W.; Yan, B.X.; Guan, K.; Liu, H.L.; Wu, Q.Z.; Yin, Y.T.; Liu, X.H. Stability analysis of shallow goaf based on field monitoring and numerical simulation: A case study at an Open-Pit Iron Mine, China. Front. Earth Sci. 2022, 10, 897779. [Google Scholar] [CrossRef]
- Tao, Y.; Luo, X.; Zhou, J.; Wu, Y.N.; Zhang, L.H.; Liu, Y.X. Site selection for underground pumped storage plant using abandoned coal mine through a hybrid multi-criteria decision-making framework under the fuzzy environment: A case in China. J. Energy Storage 2022, 56, 105957. [Google Scholar] [CrossRef]
- Dai, X.W.; Wu, X.W.; Hong, Y.; Xie, J.L.; Lin, D.Y.; Chen, Y.F. Safety and stability evaluation of the uranium tailings impoundment dam: Based on the improved AHP-cloud model. J. Radiat. Res. Appl. Sci. 2022, 15, 21–31. [Google Scholar] [CrossRef]
- Guo, Q.B.; Guo, G.L.; Li, Y.M.; Wang, L.; Zhao, X.W. Stability evaluation of an expressway construction site above an abandoned coal mine based on the overlay and index method. Sustainability 2019, 11, 5163. [Google Scholar] [CrossRef]
- Dobrow, M.J.; Hagens, V.; Chafe, R.; Sullivan, T.; Rabeneck, L. Consolidated principles for screening based on a systematic review and consensus process. Cmaj 2018, 190, E422–E429. [Google Scholar] [CrossRef] [PubMed]
- Qu, D.X.; Luo, Y.; Li, X.P.; Wang, G.; Zhang, G.; Xu, K. Study on the stability of rock slope under the coupling of stress field, seepage field, temperature field and chemical field. Arab. J. Sci. Eng. 2020, 45, 8315–8329. [Google Scholar] [CrossRef]
- Sun, D.L.; Xu, J.H.; Wen, H.J.; Wang, Y. An optimized random forest model and its generalization ability in landslide susceptibility mapping: Application in two areas of Three Gorges Reservoir, China. J. Earth Sci. 2020, 31, 1068–1086. [Google Scholar] [CrossRef]
- Zhang, Q.M.; Wang, E.Y.; Feng, X.J.; Wang, C.; Qiu, L.M.; Wang, H. Assessment of rockburst risk in deep mining: An improved comprehensive index method. Nat. Resour. Res. 2021, 30, 1817–1834. [Google Scholar] [CrossRef]
- Xue, Y.G.; Liu, H.T.; Bai, C.H.; Su, M.X.; Qiu, D.H.; Zhou, B.H.; Yu, Y.H.; Jiang, X.D. Extension prediction model of soft rock tunnel deformation grade based on entropy weight method and rough set. Environ. Earth Sci. 2022, 81, 24. [Google Scholar] [CrossRef]
- Castelló-Sirvent, F.; Meneses-Eraso, C.; Alonso-Gómez, J.; Peris-Ortiz, M. Three decades of fuzzy AHP: A bibliometric analysis. Axioms 2022, 11, 525. [Google Scholar] [CrossRef]
- Taheri, K.; Missimer, T.M.; Taheri, M.; Moayedi, H.; Mohseni-Pour, F. Critical zone assessments of an alluvial aquifer system using the multi-influencing factor (MIF) and analytical hierarchy process (AHP) models in Western Iran. Nat. Resour. Res. 2020, 29, 1163–1191. [Google Scholar] [CrossRef]
- Ruan, Z.; Li, C.P.; Wu, A.X.; Wang, Y. A new risk assessment model for underground mine water inrush based on AHP and D–S evidence theory. Mine Water Environ. 2019, 38, 488–496. [Google Scholar] [CrossRef]
- Rathi, R.; Acharjya, D.P. A framework for prediction using rough set and real coded genetic algorithm. Arab. J. Sci. Eng. 2018, 43, 4215–4227. [Google Scholar] [CrossRef]
- Močkoř, J. Cut systems with relational morphisms for semiring-valued fuzzy structures. Axioms 2023, 12, 153. [Google Scholar] [CrossRef]
- Ma, B.C.; Tan, F.; Jiao, Y.Y.; Gan, Q. Construction method of geological suitability evaluation model of underground space development based on rough set and AHP. Saf. Environ. Eng. 2020, 27, 153–159. [Google Scholar]
- Mitrović-Simić, J.; Stević, Ž.; Zavadskas, E.K.; Bogdanović, V.; Subotić, M.; Mardani, A. A novel CRITIC-Fuzzy FUCOM-DEA-Fuzzy MARCOS model for safety evaluation of road sections based on geometric parameters of road. Symmetry 2020, 12, 2006. [Google Scholar] [CrossRef]
- Krishnan, A.R.; Kasim, M.M.; Hamid, R.; Ghazali, M.F. A modified critic method to estimate the objective weights of decision criteria. Symmetry 2021, 13, 973. [Google Scholar] [CrossRef]
- Tu, S.W.; Zhao, Z.H.; Deng, M.X.; Wang, B. Safety risk assessment of blasting construction in rock high slope engineering based on the cloud matter-element model. Saf. Environ. Eng. 2021, 28, 102–108. [Google Scholar]
- Guo, J.; Zhang, W.X.; Zhao, Y. A Multidimensional cloud model for rockburst prediction. Chin. J. Rock Mech. Eng. 2018, 37, 1199–1206. [Google Scholar]
- Liang, W.Z.; Zhao, G.Y.; Wu, H.; Chen, Y. Assessing the risk degree of goafs by employing hybrid TODIM Method under uncertainty. Bull. Eng. Geol. Environ. 2019, 78, 3767–3782. [Google Scholar] [CrossRef]
- Wu, D.F.; Yang, Z.P.; Wang, N.L.; Li, C.Z.; Yang, Y.P. An integrated Multi-Criteria decision making model and AHP weighting uncertainty analysis for sustainability assessment of coal-fired power units. Sustainability 2018, 10, 1700. [Google Scholar] [CrossRef]
- Li, D.Y.; Meng, H.J.; Shi, X.M. Membership clouds and membership cloud generators. Comput. Res. Dev. 1995, 6, 15–20. [Google Scholar]
- Hassen, O.A.; Darwish, S.M.; Abu, N.A.; Abidin, Z.Z. Application of cloud model in qualitative forecasting for stock market trends. Entropy 2020, 22, 991. [Google Scholar] [CrossRef]
- Shan, B.Y.; Guo, S.S.; Wang, Y.Z.; Li, H.; Guo, P. Vine copula and cloud model-based programming approach for agricultural water allocation under uncertainty. Stoch. Environ. Res. Risk Assess. 2021, 35, 1895–1915. [Google Scholar] [CrossRef]
- Wen, X.X.; Nie, Y.; Du, Z.X.; Huang, L.K. Operational safety assessment of straddle-type monorail vehicle system based on cloud model and improved CRITIC method. Eng. Fail. Anal. 2022, 139, 106463. [Google Scholar] [CrossRef]
- Ferry, N.; Chauvel, F.; Song, H.; Rossini, A.; Lushpenko, M.; Solberg, A. Cloudmf: Model-driven management of multi-cloud applications. ACM Trans. Internet Technol. 2018, 18, 16. [Google Scholar] [CrossRef]
- Guo, Q.B.; Li, Y.M.; Meng, X.R.; Guo, G.L.; Lv, X. Instability risk assessment of expressway construction site above an abandoned goaf: A case study in China. Environ. Earth Sci. 2019, 78, 588. [Google Scholar] [CrossRef]
- Alamoodi, A.H.; Albahri, O.S.; Zaidan, A.A.; AlSattar, H.A.; Ahmed, M.A.; Pamucar, D.; Zaidan, B.B.; Albahri, A.S.; Mahmoud, M.S. New extension of fuzzy-weighted zero-inconsistency and fuzzy decision by opinion score method based on cubic pythagorean fuzzy environment: A benchmarking case study of sign language recognition systems. Int. J. Fuzzy Syst. 2022, 24, 1909–1926. [Google Scholar] [CrossRef]
- Fildes, S.G.; Bruce, D.; Clark, I.F.; Raimondo, T.; Keane, R.; Batelaan, O. Integrating spatially explicit sensitivity and uncertainty analysis in a multi-criteria decision analysis-based groundwater potential zone model. J. Hydrol. 2022, 610, 127837. [Google Scholar] [CrossRef]
- Wang, L.; Guo, Q.B.; Luo, J.; Zhang, Y.Y.; Wan, Z.S.; Wang, X.B. A novel evaluation method for the stability of construction sites on an abandoned goaf: A case study. KSCE J. Civ. Eng. 2022, 26, 2835–2845. [Google Scholar] [CrossRef]
- Liu, X.P. Progress in investigation technology for coal mine goafs under buildings and structures in China. Coal Geol. Explor. 2022, 52, 139–146. [Google Scholar]
| Disclaimer/Publisher’s Note: The statements, opinions and data contained in all publications are solely those of the individual author(s) and contributor(s) and not of MDPI and/or the editor(s). MDPI and/or the editor(s) disclaim responsibility for any injury to people or property resulting from any ideas, methods, instructions or products referred to in the content. |
© 2023 by the authors. Licensee MDPI, Basel, Switzerland. This article is an open access article distributed under the terms and conditions of the Creative Commons Attribution (CC BY) license (https://creativecommons.org/licenses/by/4.0/).


