Abstract
This research focuses on the analysis of the travel behaviour of paid members of a professional sports organisation (PSO) on the route taken between their areas of residence to the stadium. The aim of this study is to evaluate the relationship between the type of transport, fuel, and number of occupants members selected for this displacement. An online survey was distributed among PSO’s paid members, and a total of 5694 responses were obtained. Data were analysed through descriptive and inferential statistical analysis. Most members travel to the stadium by car (66%); public transport (subway, train, and bus) is used by 23.5%, and only 5.1% use vehicles powered by more environmentally friendly energies. There is a relationship between the distance travelled between members’ residences and the selected means of transport, the fuel used, and the number of people transported. Globally, it is necessary to define policies that promote the use of public transport to the detriment of an individual vehicle. Individually, paid members are required to become aware of the pollution generated when travelling to the stadium, promoting new behaviours (e.g., using a car with more occupants). PSOs can generate new forms of communication to attract new members and alternative sources of income.
1. Introduction
The sports industry faces enormous challenges concerning sustainability [1]. Creating new knowledge and effective communication with the stakeholders that make up the sports industry is required [2]. Professional sports organizations (PSOs) are responsible for knowing their sustainability level [3]. Clubs are essential in terms of how they can promote more sustainable supporter behaviour during events and daily conduct [4]. Recent studies show that the PSOs have much to gain from carrying out and effectively communicating the promoted sustainability initiatives [5]. However, it still needs to demonstrate the sustainability campaigns’ effectiveness [6]. The travels made by supporters on their way to the stadium are one of the most significant sources of pollution [7]. PSO members, as a specific and highly identified community, have an enormous preponderance in the execution of the defined strategy [8]. Sport is an enabler of sustainable development, and achieving sustainable development goals (SDGs) should be an objective for sports organizations [9]. Major sporting events move many communities and are primarily held in cities (SDG 11) with a direct impact on climate action (SDG 13).
In sports management, the lack of more appropriate quantitative research to assess environmental impacts has already been denounced [10]. More significant planning is pertinent; namely, detailed travel plans and educational actions, raising spectators’ awareness to make more environmentally friendly trips [11]. More quantitative studies on the environmental impacts of trips made to attend the event are essential and need to be carried out rigorously, analysing patterns and looking for how to reduce the impact of trips [12]. For example, considering carpooling, a common means of travel by football fans [13], it is so often overlooked in studies [12]. Investigations on members should be continued [14]. Greater coordination is needed between academia and sports authorities to generate knowledge and subsequently apply it through pragmatic measures [3].
This study’s main objective is to find the relationship between the type of transport used, the number of people transported, and the fuel employed by PSO members travelling to home games from their residences. No previous study has illustrated the association between these elements. To do so, we first inquired about the type of displacement. Having defined the car as the primary means of travel, we wanted to know the fuel used and the number of occupants. The sum of the research questions and the corresponding study hypotheses were aligned with the study’s goals.
The structure of the paper follows a logical sequence, opening the theme under analysis through the literature review subdivided into several topics that include aspects related to travel to the stadium, means of travelling, and the importance of being a member. The methodology and materials focus on the research design, highlighting the specific objectives of the study, the questions that guided the research, and the study hypotheses. This section also describes the entire process of the empirical study, including the research instrument, primary data collection procedure, and data analysis. The results are discussed; limitations of the study and proposals for future research are highlighted. Finally, the study’s main conclusions are indicated, as well as its theoretical and practical contribution.
2. Theoretical Framework and Literature Review
2.1. Travel to the Stadium
The environmental dimension has been the most studied by researchers due to the greater complexity of assessing the social and economic dimensions [5]. Concerning sustainability, several studies refer to distance as a common element (for a review, see [15]). A game in a stadium is an event that, by its very nature, contributes undeniably to environmental degradation [16].
It is essential to know how people travel to sporting events as more and more people interested in the sporting phenomenon are concerned with sustainability [17]. Since transport is one of the major contributors to pollution, the presence of thousands of fans every week at the most diverse sporting events is an enormous source of pollution [18]. The importance of transport is seen in its global dimension, representing 1/5 of global emissions of greenhouse gas (GHG) [19]. The transport of people is the most direct contributor to these emissions, and analysing this factor can help make sporting events more sustainable [7].
Understanding the behaviour patterns of sports participants permits to present frameworks to apply to realities other than sports [12]. A traveller’s behaviour changes in accessing sporting events can mean a decrease in GHG emissions, benefiting society as a whole [11]. Regarding environmental awareness, contradictory results from previous research provide new studies to understand consumer behaviour. If, on the one hand, there are positive results [4], on the other hand, they are not corroborated by another research [20].
The need for quantitative studies on the environmental impact of events is a fact. Some studies analyse how spectators move to stadiums, whether in an academic or professional sports context. In small-scale university sporting events held at a university, Dolf and Teehan (2015) [12] investigated the carbon footprint of spectators (n = 1413) and teams’ (n = 23) travel by analysing travel patterns. Results showed that although university spectators had a smaller footprint than teams per person, they had a larger overall carbon footprint. Increasing the vehicle occupancy rate is one of the measures suggested to reduce the footprint.
By studying 1649 football spectators from 8 senior divisions, Dosumu et al. (2017) [11] aimed to calculate GHG emissions as a result of trips made to attend events (i.e., games) to be able to extrapolate to a national level. Although the results obtained, in terms of total emissions, represent less than 1% of all emissions produced by transport, the authors recommend drawing up plans about supporter travel to educate spectators and higher benefits for society.
The carbon footprint generated by spectators using transport to access university sporting events has been studied by Triantafyllidis et al. (2018) [21]. One crucial factor is the area around the stadium’s location concerning the spectators’ zone of residence. The authors chose locations inside (n = 253) and outside (n = 235) the campus, defining them as high density and low population density, respectively. The type of transport chosen by the participants differs depending on the location. The metro is more employed in the high-density population area, with carpooling and the bus being more employed in the less densely populated area.
On the professional level, Loewen and Wicker (2021) [13] studied the movements of spectators (n = 539) from the Bundesliga, the German First Division, to access a sports event in the 2018/2019 season. A higher carbon footprint corresponds to a spectator that is a club member and shows an increased commitment to following the club of his devotion. The authors hope this data can be a basis for creating initiatives to reduce carbon dioxide emissions in professional sports teams. The fight against climate change is well documented in the United Nations’ Sustainable Development Goals. To what extent the trips made by spectators (n = 1605) to stadiums and daily behaviour in favour of a more environmentally friendly world can influence the subjective well-being of spectators was the study’s objective [3]. Although sustainable consumption increases well-being, only recycling contributes positively to happiness. Travelling to the stadium and energy-saving behaviour does not show the same effect. The authors conclude that behaviour in favour of the environment can accompany sustainable development goals, but only in some dimensions.
2.2. Means of Travelling
Regarding behaviour expressed as a means of travel, sportingly, this has been carried out in different contexts, such as spectators [7,22,23,24], tourists [25,26], or sportsmen [19,27]. The sports context varies from university [12] to semi-professional [11] and professional [13]. Most studies are carried out on large-scale events [25]. As for sports, studies range from various individual and team sports [12] to American football [7] and football [3].
Concerning the type of audience, investigations are mostly executed with spectators [3,7,11,12,13,21] except for a stakeholder study (i.e., members, sponsors, and collaborators) [28] and one for sports practitioners [19].
The means of transportation common to (almost) all investigations are the car, walking, the use of bicycles, and local transport, namely the city bus [3,11,12,13]. Only one study mentions the lack of knowledge about the fuel used [11], and this subject is omitted in all other investigations. Table 1 presents a summary of the means of transport for the investigations carried out.

Table 1.
Investigations into means of transport.
Given the lack of spectators in the stadiums as a result of the bans due to COVID-19, ref. [15] analysed the responses to a PSO sustainability initiatives questionnaire. The distance of members’ residences from the stadium was a factor considered about a possible greater or lesser knowledge of the sustainability initiatives performed. The results of this study indicate that distance has no impact on members’ awareness of sustainability initiatives. However, in members who are aware of the initiatives performed, a greater distance of residence reinforces the connection to the club through superior information and a subsequent greater appreciation of the initiatives achieved. Wicker (2019) [19] studied the annual carbon footprint of practitioners (n = 6537) of different sports. This seminal study went beyond reporting results and aimed at participating sportsmen, whether in individual or team sports.
In this way, based on previous research and through the study of the main stakeholders of the sporting phenomenon (i.e., members) [29], we analysed the relationship between the distance travelled (i.e., zone) and several factors (e.g., the type of transport used, the fuel, and the number of occupants in the car).
2.3. The Importance of Being a Member
Fan militancy “is a European-wide phenomenon” [30]. Being a fan is much more than going to sporting events [31]. Although football, as a commodity, is characterized by [32] as “fluid and unstable” (p. 410), its main stakeholders tend to have a constant behaviour with a massive presence in events held regularly [33]. A paid membership is a stable source of revenue, with members playing an important role due to its constant consumption [34]. Members spend more when compared to non-members, namely in terms of antecedents and actual behaviour [14,34]. The economic commitment, the obligation to pay the membership, is one of the reasons why the member feels a moral possession of his football club [32].
Being a member is an essential condition that translates into a way of being and behaviour [30], where loyalty is a critical factor, regardless of whether it is in the sports industry or any other [35]. Members are a group that is affected by their team’s results and, at the same time, influence the club’s goals [31]. Organizations (i.e., clubs) themselves help define their members’ identities [8]. Going to a sporting event is part of a journey, equated by some authors to a pilgrimage [7]. The more identified the member is with his club, the greater the possibility of having future behaviours [36]. Members have a more significant commitment to the club, follow the team more, and, as such, pollute more [13,19]. When we know the type of movement of this loyal consumer who is capable of influencing the club’s day-to-day [29], the result is more reliable depending on the attitude and behaviour he consistently demonstrates.
3. Research Design
The basis for the design of the conceptual research model was based on the calculation of the distance between the place of residence and the stadium, considering three main zones (Figure 1), which served as a basis for previous studies [15]. Thus, the same criteria were followed to establish the different groups of analysis based on geographical distances relative to the districts of residence of PSO members. A website [37] was used to estimate the distance between Porto city centre (Praça Mouzinho de Albuquerque) and the members’ places of residence [15]. Thus, we proceeded to divide the sample members by zones, thus making it possible to have a more accurate notion of the distance each member travels from the defined central point in the city of Oporto, and three zones were established: Zone 1 is the city of Oporto; Zone 2 goes up to 10 km away; and Zone 3 covers all areas beyond 10 km (see Figure 1).
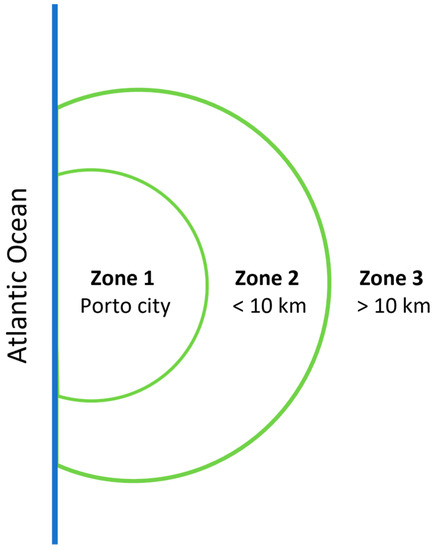
Figure 1.
Members’ zone of residence by district.
This research aims to evaluate the PSO members travelling between their zone zones of residence and their clubs’ matches (FC Porto) at their home stadium. The relationship between the transportation means, the type of fuel, and the number of people transported by car was explored to attain this goal. The sum of specific goals is as follows:
- G1—To identify the means of transport used by PSO members in commuting from their residence to the Stadium;
- G2—To ascertain the type of fuel used in that commuting, considering those who commute by car;
- G3—To verify the number of people transported by car in commuting between their residence area and the Stadium;
- G4—To examine the relationship between distance and behaviour of the members regarding the type of transport used;
- G5—To examine the relationship between distance and behaviour of the members regarding the type of fuel used by car;
- G6—To examine the relationship between distance and behaviour of the members regarding the number of people transported to the stadium by car.
Aligned with these specific goals were defined six main research questions (RQ) and three research hypotheses (H1, H2 and H3): RQ1—How do members travel to the stadium?; RQ2—Which is the type of fuel used by members using the car?; RQ3—What is the number of occupants transported in the car to the stadium?; RQ4—What is the relationship between the distance travelled and the type of transport used? and hypothesis H1—There is a relationship between the means of transport used and the members’ area of residence; RQ5—In members travelling by car, what is the relationship between the distance travelled and the type of fuel used?; Hypothesis H2—There is a relationship between the type of fuel used and the area of residence of the members when travelling by car; RQ6—For car travellers, what is the relationship between the distance travelled and the number of occupants?; RQ6 formulates hypothesis H3—There is a relationship between the number of occupants and the area of residence of the members when travelling by car.
4. Materials and Methods
4.1. The Professional Sports Organization (FC Porto)
This research was conducted on FC Porto, a professional sports team located in the Northern Region of Portugal [15,28]. Within the supporter’s group are the members that currently count about 140,000, placing FC Porto at the top of the Portuguese clubs with the largest number of members alongside Manchester United, with 150,000 members.
There is a sum of advantages to being an FC Porto member, such as tickets at more affordable prices for games at Estádio do Dragão, Dragão Arena, and Estádio Luís Filipe Menezes; tickets at more affordable prices on visits to Estádio do Dragão and Museu FC Porto by BMG; there are immediate discounts in the official FC Porto shops; there is a priority in the acquisition of tickets for other events in Estádio do Dragão [38].
In addition to these, there are other advantages to the acquisition of products or services of FC Porto Partners. To have access to the acquisition of the annual seat (Dragon Seat) at FC Porto, it is mandatory to be a member, contrary to other Portuguese clubs on which studies were conducted [37]. In the specific case of FC Porto, members have advantages over non-members in several ways (e.g., in the purchase of sports or other tickets, discounts in official shops, and in the club’s partners) [38].
4.2. Research Instrument
For the development of this study, a survey was designed, comprising a set of questions that enabled the identification of respondents’ places of residence and the means of transport used to travel to the stadium to watch the club’s matches, on the way to a home game in Liga Portugal (first division) in Portugal. Within those who use the car, the type of fuel used was also identified, as well as the number of people transported by PSO members, with a focus on the 2019/2020 season, the last season held regularly regarding the public’s presence in the stadiums before the onset of the COVID-19 pandemic.
4.3. Data Collection
The empirical study was based on a quantitative approach using the questionnaire survey method. The data collection method was based on the distribution of an online survey administered by the club’s office to FC Porto members during the month of July 2020, having collected a total of 5694 responses.
4.4. Data Treatment
To analyse the data collected through the administration of the questionnaires mentioned in the previous topic, descriptive statistical analysis was developed using SPSS 27.0, conducting frequency and mean analyses. The descriptive data allow us to identify the representativeness of the members by zones of residence (Table 2), the type of transport used by FC Porto members when travelling to the stadium (Table 3), the type of fuel used in that journey (Table 4), and the number of people transported to the stadium by car (Table 5).
Table 2.
Members’ residence zone.
Table 3.
Transportation means.
Table 4.
Types of fuel used in transportation by car.
Table 5.
Number of occupants by car.
The multivariate analysis was based on the establishment of correlations between the three variables considered for analysis in the study, considering the whole sample (n = 5694). Inferential statistics were calculated to test three research hypotheses presented in the previous topic.
5. Results and Discussion
The descriptive and multivariate analysis of the primary data collected during the empirical study allowed access to the main findings of the research. The data results are examined in the context of the literature, focusing on identifying the origin of PSO members distributed by three Zones of residence (Zone 1, 2, and 3) (see Figure 1). In line with previous studies [12], in absolute terms, there is a preponderance of members who have to travel a longer distance to reach the stadium (Table 2).
Regarding means of transport (Table 3), in responding to RQ1, “How do members travel to the stadium?”, the vast majority use the car (64.8%), and the Metro (20.4%) is the second option.
These results extend previous studies intending to know the type of travel made to access sporting events held frequently [3]. Car use (64.8%) in our specific study on members is in line with other studies carried out on spectators, with 67.5% [11] and 66% [12], respectively. There is a dependence on car use as a means of transport to access sporting events [11]. In this way, the predominance of car use concerning public transport in university environments [12] or professionals [3,13] does not corroborate the preferential use of public transport concluded in other studies [21].
RQ2 concerns the “Type of fuel used by members using the car.” Most people (95%, see Table 3) use cars powered by fossil fuels, namely diesel (76%) and gasoline (19%), respectively, which are highly polluting because they contain a high amount of carbon used to fuel combustion. The use of cars powered by clean energy (1.3%) and combined energy (2.8%) is residual (Table 4).
Cars are one of the most polluting means of travel [7]. The environmental impact felt by spectators’ travels has been recognized by entities that manage football at the highest level [39]. However, it appears that the studies performed on the move of spectators to the sporting event [3,11,12,13,21] do not seek to obtain knowledge of the fuel used in private transport utilization. To our knowledge, just one study [11] specifically refers to “car (unknown fuel)” (p. 3), and all others are omitted.
Regarding RQ3, “What is the number of occupants transported in the car to the stadium?”, most vehicles travel with two occupants (36.4%), with a high number (18%) with only one occupant. The remaining sample chooses to divide the transport by three (16%), five (15.8%), and four (13.8%) occupants, respectively (see Table 5). Considering the entire sample, each car that travels to the stadium transports, on average, 2.72 people.
As for carpooling, the results are similar to other studies implemented in different continents, countries, and sports regarding spectators. At a university in Canada, the average per vehicle is 2.7 passengers [12]. On the same continent, but in the USA, the average is 2.5 passengers in American football [40]. In the United Kingdom, the average is two people per car in football [11]. As for sports practitioners, the study carried out by [19] refers to 1.5 people per car, in line with other more general reflections on carpooling habits of the population, with 1.6 and 1.2 occupancies, respectively (for a review, see [12]). Interestingly, participants in sporting events (whether casual fans or members) have a much higher carpooling rate than in other situations, reinforcing the social character of attending a sporting event. Finally, it is noteworthy that the high number of solo travellers (18%) almost doubles that of other studies [41].
For RQ4, “What is the relationship between the distance travelled and the type of transport used?”, we established a correlation between the variables: (a) zone; and (b) means of transport used to travel to the stadium (see Table 6). The Spearman test confirmed H1, verifying that there is a strong positive correlation (p = 0.416) which is statistically significant between the two variables under analysis (p > 0.05). This result means that, as the distance increases (represented by the zone), the use of more polluting means of transport also increases (considering that the data were inserted in the database, according to a scale or order—from least polluting to the most polluting).
Table 6.
Test of Hypothesis 1.
An analysis of the total numbers as a type of travel by members (see Table 7) reveals that: the car is the dominant means of travel, with 66% preference; the metro represents 20% of all travels made; and walking accounts for 7% of all trips. Following the same path, a closer analysis shows that: (a) 90.8% of those who travel on foot are from Zone 1; (b) 49.3% of those travelling by metro are from Zone 2; and (c) 57.4% of those travelling by car are from Zone 3.
Table 7.
Crosstabulation: Transport and Zone.
In a more profound analysis relating the type of trip with the areas of residence where spectators of sporting events come from, (a) those who travel on foot represent 31.3% of all trips made in Zone 1; (b) those travelling by metro represent 28.2% and 29.9% of all trips made in Zone 1 and 2, respectively; (c) those travelling by car represent 81.3% of all journeys made in Zone 3; and (d) as the zone increases (i.e., the distance to be covered is more considerable), there is an intense dependence on the car in the trips made (34.9%, 63.5%, and 81.3% for Zones 1, 2, and 3, respectively).
There is a relationship between the area of residence and the type of travel carried out. For example, 90.8% of those travelling on foot are from Zone 1, while 81.3% of those travelling from Zone 3 use a car. The use of public transport needs to be improved, with residual numbers of bus use (1%).
“In members travelling by car, what is the relationship between the distance travelled and the type of fuel used?” (RQ5) A correlation was accomplished between the variables: (a) type of fuel in the cars used to travel to the stadium; and (b) zones (see Table 8). The test of H2 verifies that there is a positive correlation—although weak or non-linear (p = 0.062)—between the two variables under analysis. Despite the correlation value being negative (p = 0.062) and supposedly not statistically significant (p < 0.05), we can consider it significant, with the relationship between the variables also being directly proportional.
Table 8.
Test of Hypothesis 2.
Residents of the three zones travel mostly in diesel-powered cars (76.6%); gasoline cars represent 18.3%, and the use of vehicles powered by clean energy (hybrid and electric) corresponds to only 4.1%. As for fuel, there is a dominant tendency among residents of Zone 3. The data (Table 9) show that: (a) 59.2% use diesel, 51.2% use gasoline, and 48% use hybrids, and 55.3% of residents who use electric energy vehicles are from Zone 3. There is also a global trend in cars powered by gas or diesel, with the percentage of using diesel vehicles increasing according to the greater distance (i.e., zone); the opposite situation happens in cars powered by gasoline. In vehicles powered by clean energy or in hybrids, there is a tendency for Zone 1 to predominate, and in electric cars, there is a predominance of Zone 2.
Table 9.
Crosstabulation: Fuel and Zone.
The use of diesel fuel includes more than 75% of all car users, which is connected, among other factors, to the lower final price policy applied to this fuel.
Finally, in RQ6, “For car travellers, what is the relationship between the distance travelled and the number of occupants?”, we established a correlation between the variables: (a) area; and (b) the number of occupants per car travelling to the stadium (Table 10). The test of H3 confirms that there is a positive correlation between the two variables under analysis, albeit weak or non-linear (p = 0.106) but statistically significant (p > 0.05). As the distance increases (represented by the Zone), the number of occupants transported by car also increases (see Table 7).
Table 10.
Test of Hypothesis 3.
Usage by two occupants is the majority in all Zones (36.8%, 38.1%, and 35.7%, in ascending order of Zone, respectively). The highest percentage of car occupants (38.1%) concerns Zone 2, with two participants. The highest number of individual occupants (24.5%) is in Zone 1. In use with three or more occupants, there is a slight tendency for the percentage to increase, accentuated in Zone 3 for five occupants (17.1%) (see Table 11). An analysis of the total numbers as an occupation in the car reveals that the predominant number reported is two occupants (36.8%), with individual users being the second highest (18.4%).
Table 11.
Crosstabulation: Zone and Pax.
Zone 3 has the highest percentage of individual occupants (48%) and group occupants, with four elements (66.1%). In the relationship between the number of occupants and the zones from which they travel, we conclude that: (a) those travelling alone represent 24.5% of all trips made in Zone 1; (b) for two occupants per car, there is an enormous similarity in the numbers reached, with 36.8%, 38.15 and 35.7% for Zones 1, 2 and 3, respectively; (c) by area, there is a slight tendency that, as the distance travelled increases, the percentage of occupants in the car increases, which is more noticeable in the four elements (from 10.7% to 15.4%).
Although just over one-third of car occupancy is made up of two people, almost one-fifth of car users do so alone.
6. Limitations and Future Research
Future studies should contemplate these research limitations. First, this research is limited to a single sports organization, and future research should consider several sports organizations from different disciplines and, if possible, from other countries in different periods of time (sports seasons; national and/or international championships), providing comparative and longitudinal analysis. The second limitation is the restricted access to data regarding several elements that characterize the sample (e.g., gender, age, educational qualifications, attendance at the stadium, and the number of years of membership). Relating the data to the various variables would allow for a richer and more complex analysis. Third, it concerns each country’s policies regarding vehicle taxes. In Portugal, vehicle taxes were more favourable for diesel-powered vehicles to the detriment of others (e.g., gasoline, hybrid, or electric). Currently, in 2023, there is enormous support for the acquisition of electric vehicles [42], and diesel vehicles no longer have the benefits of the past, including the lower cost per litre compared to gasoline. In light of this reality, a study today may have different results. Finally, in the future, consumers’ travel to sporting events will be primarily impacted by autonomous vehicles’ importance (Van Brummelen, O’Brien, Gruyer, & Najjaran, 2018) [43], which requires new study paradigms.
7. Conclusions
This study’s main objective is to find the relationship between the type of transport used, the number of people transported, and the fuel employed by PSO members travelling to home games from their residences. The results indicate that, as in other studies [11], the car is the preferred means of transport, with an average occupancy of two people. Due to its complexity, the relationship between the type of transport and fuel used and the number of people transported requires deep analysis. Previous research reinforces the importance of accurate diagnoses and new mobility policies [3,12]. Our research features a study of 3689 member responses to a sustainability questionnaire before the onset of COVID-19.
The present study contributes to the theory and practice of sports management, including sustainability initiatives to be executed in the future. As a heterogeneous group [44], this members’ study allows analysis with possible transfers to other areas. First, it provides information on how members, the main stakeholders of a PSO, usually travel to home games. It is essential knowledge for sustainability initiatives’ success, including designing strategies to attract more members (e.g., 90% of members who travel on foot are from Zone 1). Second, by addressing fuel, it allows for a doubly positive approach. Globally, for society, this study provides a diagnosis in favour of future mobility policies by the authorities. Specifically, for PSOs, generating added value in future revenues unconventionally (e.g., electrical charging). Third, relating transport, fuel, and the number of occupants in the car provides insight into how a specific type of consumer behaves. The greater the distance from the stadium, the more dependence on car use increases exponentially. It should alert political authorities in the design of mobility strategies, even if only for event days (e.g., special buses, tickets with transport included). Finally, given the high numbers of individual car occupancy (around 48% from the most remote area, Zone 3) and low levels of public transport use, the promotion of measures to support public transport or a more significant number of occupants per individual transport is mandatory from the sustainability point of view. A possibility for greater sensitivity in this aspect could entail the involvement of organized member communities through mobility initiatives carried out for their members.
Author Contributions
Conceptualization, R.R.C.; data curation, T.S.; formal analysis, J.A.Q.; investigation, R.R.C.; methodology, J.A.Q.; resources, T.S.; software, J.A.Q.; supervision, R.R.C. and J.A.Q.; writing—original draft, R.R.C. and J.A.Q.; writing—review and editing, R.R.C. and J.A.Q. All authors have read and agreed to the published version of the manuscript.
Funding
This research was supported by the UIDB/05105/2020 Program Contract, funded by national funds through the FCT, I.P.
Institutional Review Board Statement
The present work complies with all criteria defined by the Ethics Committee. This work has been submitted under reference number CES-UPT-03/01/23.
Informed Consent Statement
Informed consent was obtained from all subjects involved in the study.
Data Availability Statement
Not applicable.
Conflicts of Interest
The authors declare no conflict of interest.
References
- Orr, M.; Inoue, Y. Sport versus climate: Introducing the climate vulnerability of sport organizations framework. Sport Manag. Rev. 2019, 22, 452–463. [Google Scholar] [CrossRef]
- Breitbarth, T.; Mccullough, B.P.; Collins, A.; Gerke, A.; David, M. Environmental matters in sport: Sustainable research in the academy. Eur. Sport Manag. Q. 2023, 23, 5–12. [Google Scholar] [CrossRef]
- Thormann, T.F.; Wicker, P.; Braksiek, M. Stadium Travel and Subjective Well-Being of Football Spectators. Sustainability 2022, 14, 7278. [Google Scholar] [CrossRef]
- Casper, J.M.; Pfahl, M.E.; McCullough, B.P. Intercollegiate sport and the environment: Examining fan engagement based on athletics department sustainability efforts. J. Issues Intercoll. Athl. 2014, 7, 65–91. [Google Scholar]
- Cayolla, R.R.; Escadas, M.; Biscaia, R.; Kellison, T.B.; Quintela, J.A.; Santos, T. Fans’ perceptions of pro-environmental sustainability initiatives in sport and triple bottom line benefits initiatives. Int. J. Sport. Mark. Spons. 2023. ahead of print. [Google Scholar] [CrossRef]
- Casper, J.M.; Pfahl, M.E. Environmental Behavior Frameworks of Sport and Recreation Undergraduate Students. Sport Manag. Educ. J. 2012, 6, 8–20. [Google Scholar] [CrossRef]
- Cooper, J.A. Making orange green? A critical carbon footprinting of Tennessee football gameday tourism. J. Sport Tour. 2020, 24, 31–51. [Google Scholar] [CrossRef]
- Wegner, C.E.; King, C.; Jordan, J.S. The role of organizational membership in overcoming dissonant sport activity identities. Sport Manag. Rev. 2020, 23, 455–468. [Google Scholar] [CrossRef]
- United Nations. The Sustainable Development Agenda. 2023. Available online: https://www.un.org/sustainabledevelopment/development-agenda/ (accessed on 14 January 2023).
- Collins, A.; Jones, C.; Munday, M. Assessing the environmental impacts of mega sporting events: Two options? Tour. Manag. 2009, 30, 828–837. [Google Scholar] [CrossRef]
- Dosumu, A.; Colbeck, I.; Bragg, R. Greenhouse gas emissions as a result of spectators travelling to football in England. Sci. Rep. 2017, 7, 6986. [Google Scholar] [CrossRef]
- Dolf, M.; Teehan, P. Reducing the carbon footprint of spectator and team travel at the University of British Columbia’s varsity sports events. Sport Manag. Rev. 2015, 18, 244–255. [Google Scholar] [CrossRef]
- Loewen, C.; Wicker, P. Travelling to Bundesliga matches: The carbon footprint of football fans. J. Sport Tour. 2021, 25, 253–272. [Google Scholar] [CrossRef]
- Wicker, P.; Breuer, C.; Pawlowski, T. Are sports club members big spenders? Findings from sport specific analyses in Germany. Sport Manag. Rev. 2010, 13, 214–224. [Google Scholar] [CrossRef]
- Cayolla, R.; Quintela, J.A.; Santos, T. “If You Don’t Know Me by Now”—The Importance of Sustainability Initiative Awareness for Stakeholders of Professional Sports Organizations. Sustainability 2022, 14, 4917. [Google Scholar] [CrossRef]
- Collins, A.; Potoglou, D. Factors influencing visitor travel to festivals: Challenges in encouraging sustainable travel. J. Sustain. Tour. 2019, 27, 668–688. [Google Scholar] [CrossRef]
- Porter, C.; May, A.; Kiernan, A. ‘Thinking long and wide’: Which communities have a future within the global game? Soccer Soc. 2016, 17, 661–665. [Google Scholar] [CrossRef]
- Thibault, L. Globalization of Sport: An Inconvenient Truth. J. Sport Manag. 2009, 23, 1–20. [Google Scholar] [CrossRef]
- Wicker, P. The carbon footprint of active sport participants. Sport Manag. Rev. 2019, 22, 513–526. [Google Scholar] [CrossRef]
- McCullough, B.P.; Cunningham, G.B. Recycling intentions among youth baseball spectators. Int. J. Sport Manag. Mark. 2011, 10, 104–120. [Google Scholar] [CrossRef]
- Triantafyllidis, S.; Ries, R.J.; Kaplanidou, K. Carbon Dioxide Emissions of spectators’ transportation in collegiate sporting events: Comparing on-campus and off-campus stadium locations. Sustainability 2018, 10, 241. [Google Scholar] [CrossRef]
- Collins, A.; Flynn, A.; Munday, M.; Roberts, A. Assessing the environmental consequences of major sporting events: The 2003/04 FA Cup Final. Urban Stud. 2007, 44, 457–476. [Google Scholar] [CrossRef]
- Collins, A.; Munday, M.; Roberts, A. Environmental Consequences of Tourism Consumption at Major Events: An Analysis of the UK Stages of the 2007 Tour de France. J. Travel Res. 2012, 51, 577–590. [Google Scholar] [CrossRef]
- Jones, C. Assessing the impact of a major sporting event: The role of environmental accounting. Tour. Econ. 2008, 14, 343–360. [Google Scholar] [CrossRef]
- Cooper, J.A.; McCullough, B.P. Bracketing sustainability: Carbon footprinting March Madness to rethink sustainable tourism approaches and measurements. J. Clean. Prod. 2021, 318, 128475. [Google Scholar] [CrossRef]
- Wicker, P. The carbon footprint of active sport tourists: An empirical analysis of skiers and boarders. J. Sport Tour. 2018, 22, 151–171. [Google Scholar] [CrossRef]
- Thormann, T.F.; Wicker, P. Determinants of pro-environmental behavior among voluntary sport club members. Ger. J. Exerc. Sport Res. 2021, 51, 29–38. [Google Scholar] [CrossRef]
- Cayolla, R.; Santos, T.; Quintela, J.A. Sustainable Initiatives in Sports Organizations—Analysis of a Group of Stakeholders in Pandemic Times. Sustainability 2021, 13, 9122. [Google Scholar] [CrossRef]
- Constandt, B.; Parent, M.M.; Willem, A. Does it really matter? A study on soccer fans’ perceptions of ethical leadership and their role as “stakeowners”. Sport Manag. Rev. 2020, 23, 374–386. [Google Scholar] [CrossRef]
- Cocieru, O.C.; Delia, E.B.; Katz, M. It’s our club! From supporter psychological ownership to supporter formal ownership. Sport Manag. Rev. 2019, 22, 322–334. [Google Scholar] [CrossRef]
- García, B.; Welford, J. Supporters and football governance, from customers to stakeholders: A literature review and agenda for research. Sport Manag. Rev. 2015, 18, 517–528. [Google Scholar] [CrossRef]
- Kennedy, P. Supporters Direct and supporters’ governance of football: A model for Europe? Soccer Soc. 2012, 13, 409–425. [Google Scholar] [CrossRef]
- Gwinner, K.; Swanson, S.R. A model of fan identification: Antecedents and sponsorship outcomes. J. Serv. Mark. 2003, 17, 275–294. [Google Scholar] [CrossRef]
- McDonald, H.; Shaw, R.N. Satisfaction as a predictor of football club members’ intentions. Int. J. Sport. Mark. Spons. 2005, 7, 75–81. [Google Scholar] [CrossRef]
- Xiong, L.; King, C.; Hu, C. Where is the love?: Investigating multiple membership and hotel customer loyalty. Int. J. Contemp. Hosp. Manag. 2014, 26, 572–592. [Google Scholar] [CrossRef]
- Biscaia, R.; Hedlund, D.P.; Dickson, G.; Naylor, M. Conceptualising and measuring fan identity using stakeholder theory. Eur. Sport Manag. Q. 2018, 18, 459–481. [Google Scholar] [CrossRef]
- Available online: www.distanciascidades.com (accessed on 6 October 2021).
- FC Porto. Vantagens de ser Sócio do Futebol Clube do Porto. 2023. Available online: https://www.fcporto.pt/pt/socios/socio (accessed on 12 December 2022).
- Collins, A.; Flynn, A. Measuring the environmental sustainability of a major sporting event: A case study of the FA Cup Final. Tour. Econ. 2008, 14, 751–768. [Google Scholar] [CrossRef]
- Ruback, R.B.; Collins, R.T.; Koon-Magnin, S.; Ge, W.; Bonkiewicz, L.; Lutz, C.E. People Transitioning Across Places: A Multimethod Investigation of How People Go to Football Games. Environ. Behav. 2013, 45, 239–266. [Google Scholar] [CrossRef]
- Trail, G.T. Marketing Sustainability through Sport; Sport Consumer Research Consultants LLC.: Seattle, WA, USA, 2016. [Google Scholar]
- Jornal “Expresso.”. Mercado de Veículos Elétricos Sobe 21.5% Até Novembro. 2022. Available online: https://expresso.pt/economia/2022-12-05-Mercado-de-veiculos-eletricos-sobe-215-ate-novembro-ec2ec374 (accessed on 5 December 2022).
- Van Brummelen, J.; O’Brien, M.; Gruyer, D.; Najjaran, H. Autonomous vehicle perception: The technology of today and tomorrow. Transp. Res. Part C Emerg. Technol. 2018, 89, 384–406. [Google Scholar] [CrossRef]
- Biscaia, R.; Ross, S.; Yoshida, M.; Correia, A.; Rosado, A.; Marôco, J. Investigating the role of fan club membership on perceptions of team brand equity in football. Sport Manag. Rev. 2016, 19, 157–170. [Google Scholar] [CrossRef]

Disclaimer/Publisher’s Note: The statements, opinions and data contained in all publications are solely those of the individual author(s) and contributor(s) and not of MDPI and/or the editor(s). MDPI and/or the editor(s) disclaim responsibility for any injury to people or property resulting from any ideas, methods, instructions or products referred to in the content. |
© 2023 by the authors. Licensee MDPI, Basel, Switzerland. This article is an open access article distributed under the terms and conditions of the Creative Commons Attribution (CC BY) license (https://creativecommons.org/licenses/by/4.0/).