
Difference in Surface Damage between Deep and Shallow Mining of Underground Coal Resources in China


Abstract
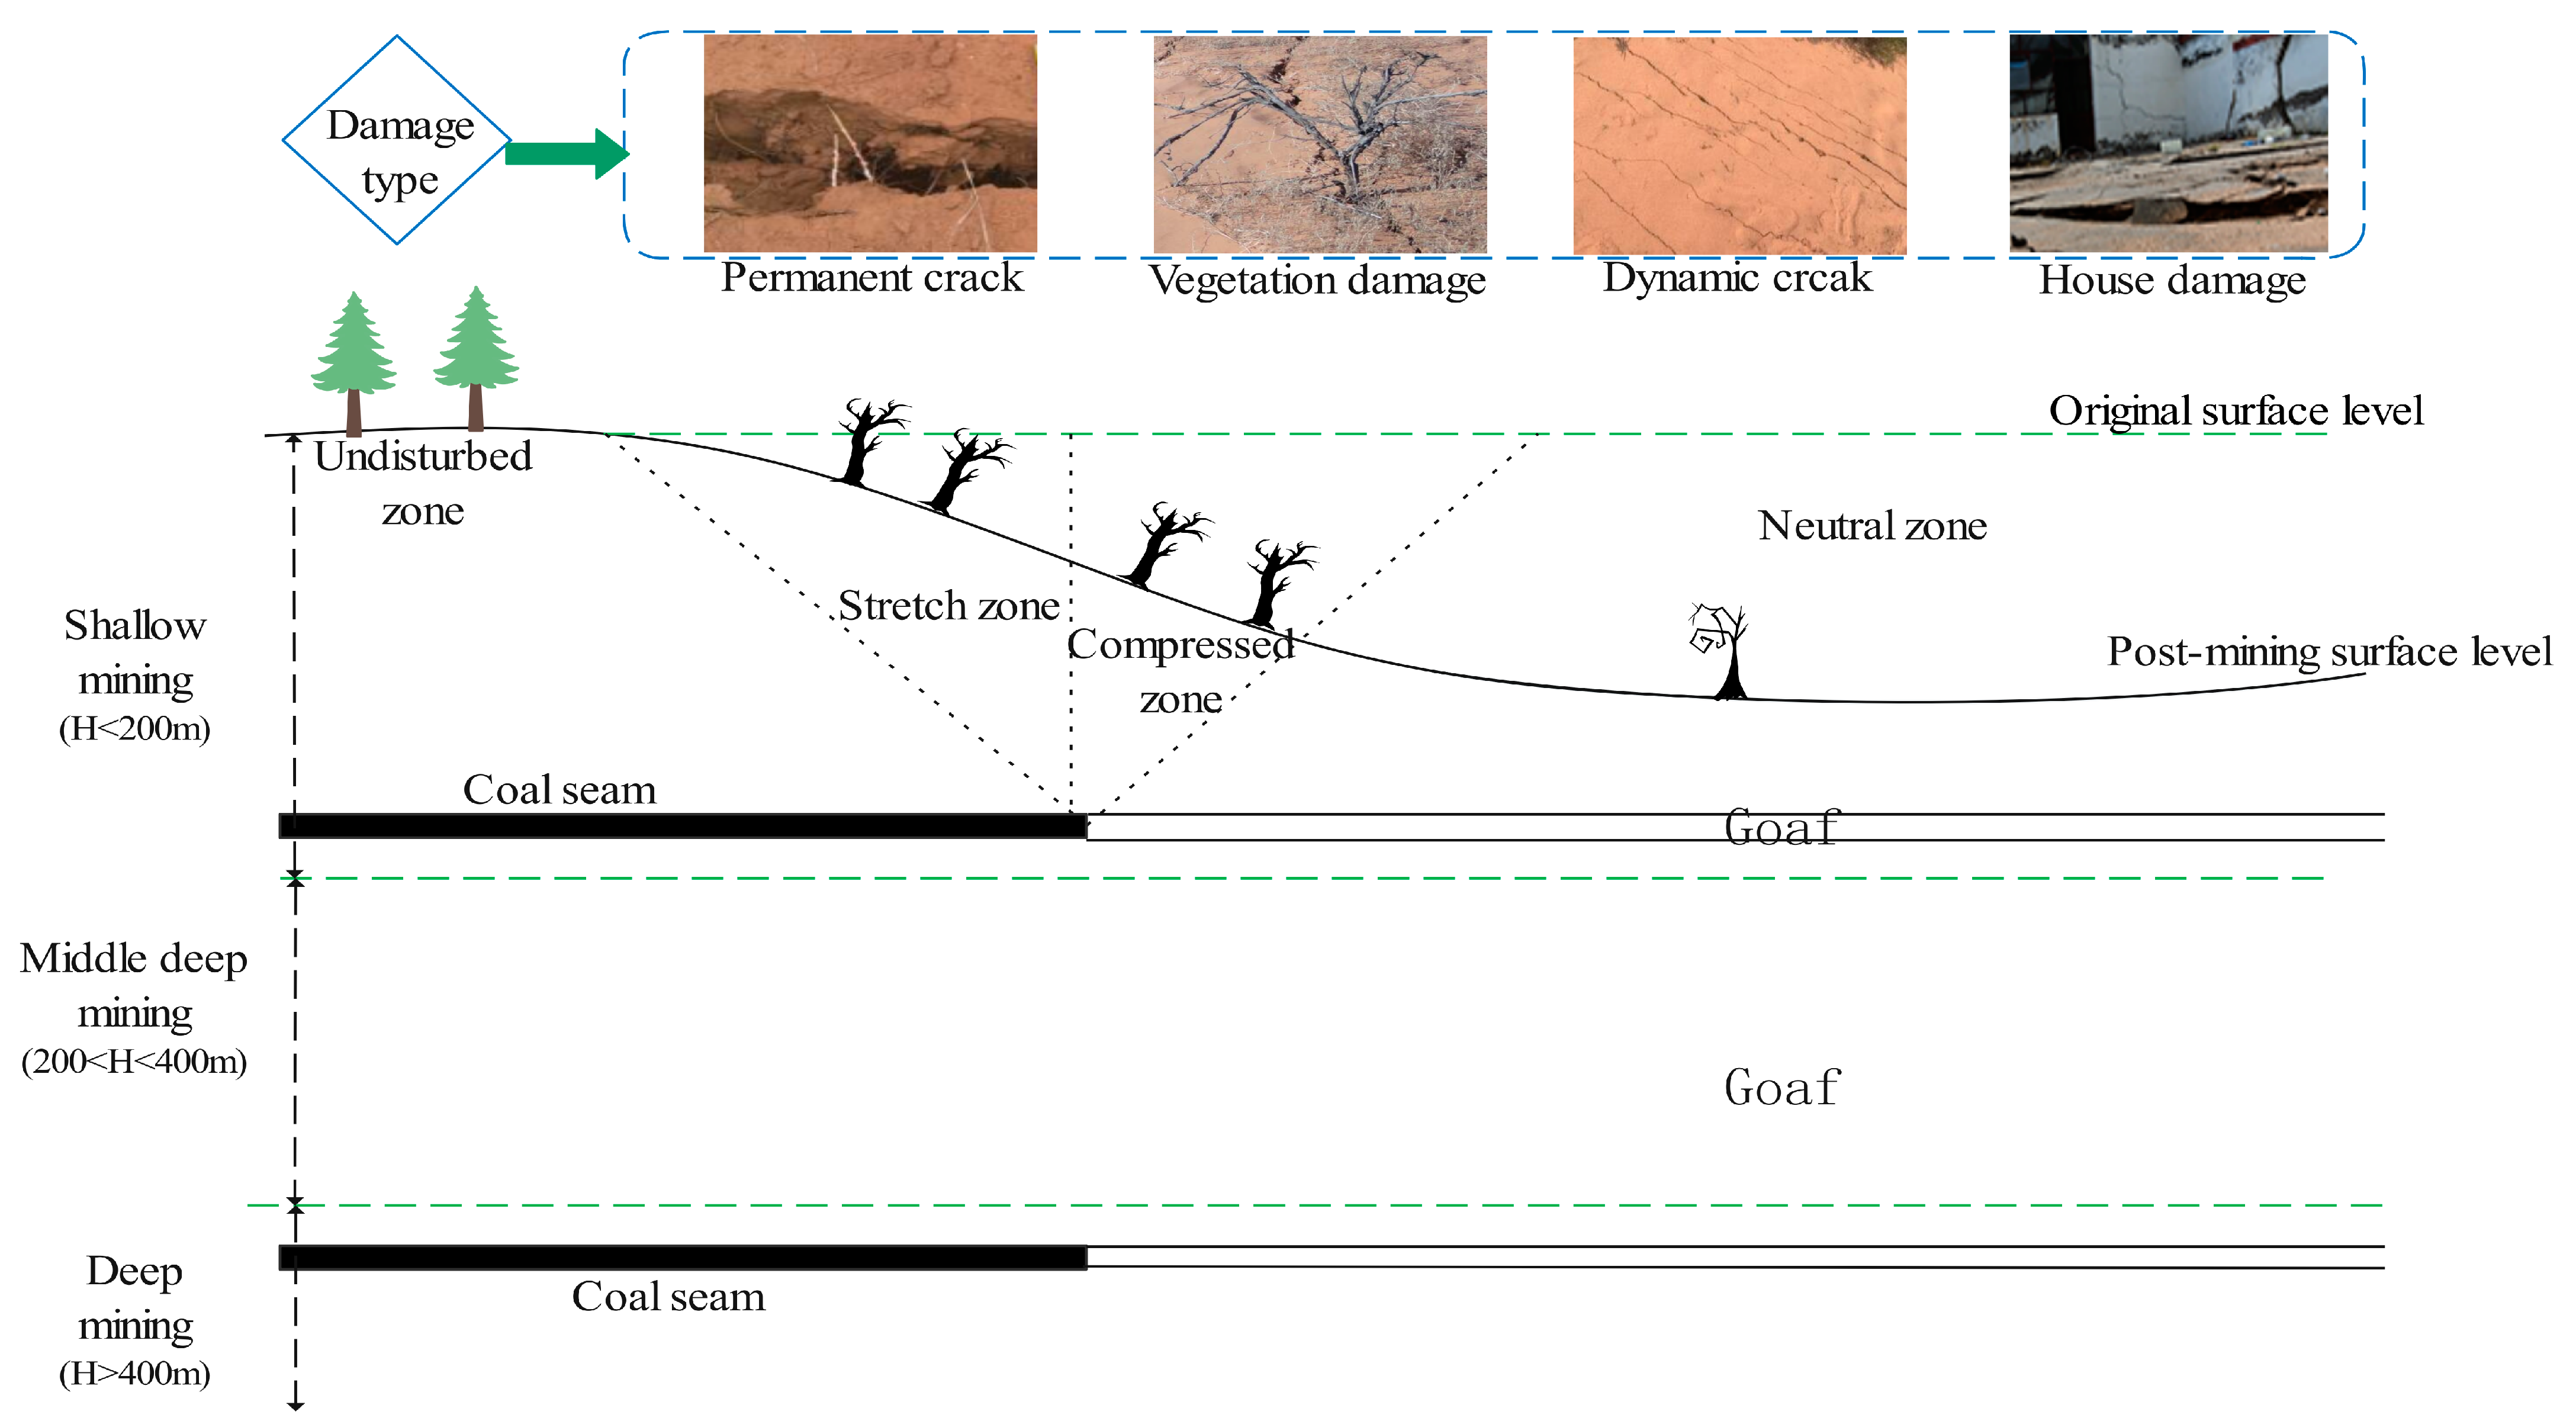
:1. Introduction
2. Study Area and Its Surface Failure Characteristics
2.1. Working Face for Shallow Mining
2.2. Working Face for Deep Mining
3. Methods and Results
3.1. Similar Material Simulation in Shallow Mining
3.1.1. Design and Production of Model
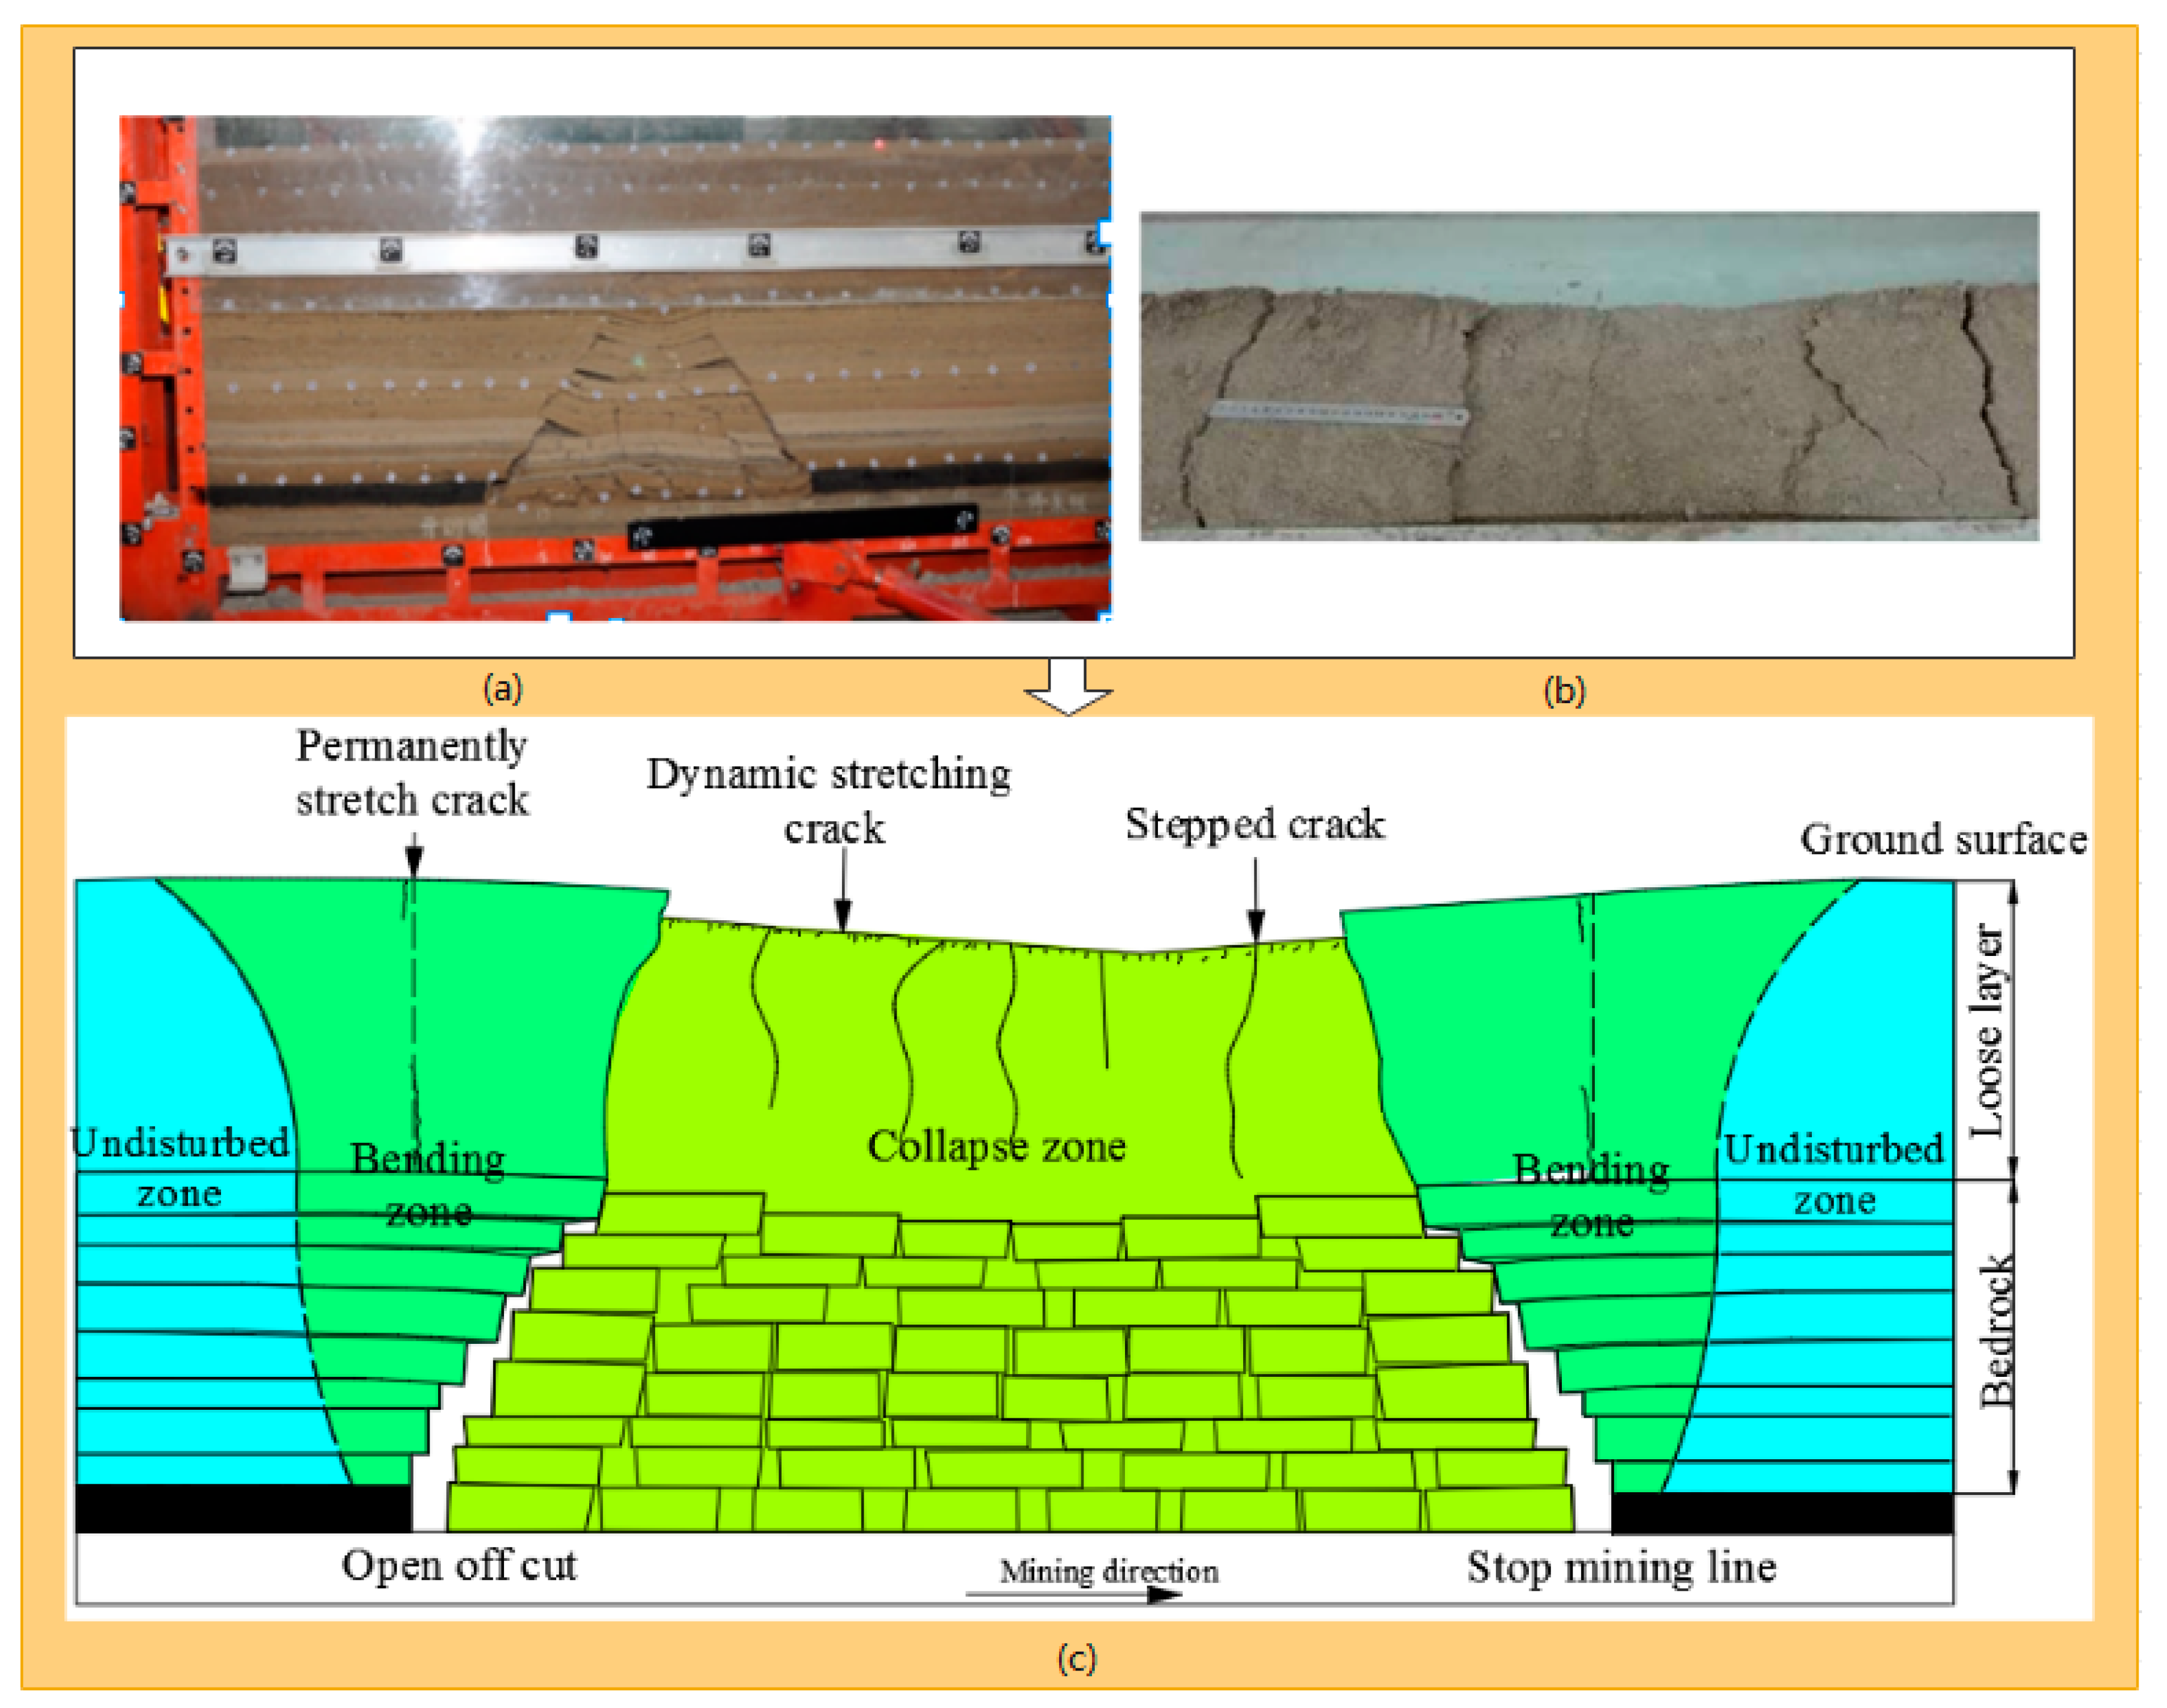
3.1.2. Overburden and Surface Damage Law
3.2. Similar Material Simulation in Deep Mining
3.2.1. Design and Production of Model
3.2.2. Overburden and Surface Damage Law
4. Discussion
4.1. Formation Mechanism of Permanently Stretch Cracks
4.2. Formation Mechanism of Dynamic Crack
5. Conclusions
Author Contributions
Funding
Institutional Review Board Statement
Informed Consent Statement
Data Availability Statement
Conflicts of Interest
References
- Yan, W.; Chen, J.; Tan, Y.; He, R.; Yan, S. Surface dynamic damage prediction model of horizontal coal seam based on the idea of wave lossless propagation. Int. J. Environ. Res. Public Health. 2022, 19, 6862. [Google Scholar] [CrossRef]
- Vervoort, A. The Time Duration of the Effects of Total Extraction Mining Methods on Surface Movement. Energies 2020, 13, 4107. [Google Scholar] [CrossRef]
- Ju, J.; Xu, J. Surface stepped subsidence related to top-coal caving longwall mining of extremely thick coal seam under shallow cover. Int. J. Rock Mech. Min. Sci. 2015, 78, 27–35. [Google Scholar] [CrossRef]
- Orwat, J. Causes analysis of occurrence of the terrain surface discontinuous deformations of a linear type. J. Phys. 2020, 1426, 012016. [Google Scholar] [CrossRef]
- Strzałkowski, P.; Scigała, R.; Szafulera, K.; Tomiczek, K. Forecasting of Discontinuous Deformations of Surface Type on the Mining and Post-Mining Areas; Publishing House of Silesian University of Technology: Gliwice, Poland, 2020; p. 127. [Google Scholar]
- Vervoort, A. Impact of the closure of a coal district on the environmental issue of long-term surface movements. AIMS Geosci. 2022, 8, 326–345. [Google Scholar] [CrossRef]
- Peng, S. Coal Mine Ground Control, 3rd ed.; West Virginia University: Morgantown, WV, USA, 2008. [Google Scholar]
- Strzałkowski, P.; Ścigała, R.; Szafulera, K.; Kołodziej, K. Surface Deformations Resulting from Abandoned Mining Excavations. Energies 2021, 14, 2495. [Google Scholar] [CrossRef]
- Strzałkowski, P. Predicting mining areas deformations under the condition of high strength and depth of cover. Energies 2022, 15, 4627. [Google Scholar] [CrossRef]
- Guo, J.; Li, Q.; Xie, H. Monitoring of vegetation disturbance and restoration at the dumping sites of the baorixile open-pit mine based on the LandTrendr algorithm. Int. J. Environ. Res. Public Health. 2022, 19, 9066. [Google Scholar] [CrossRef]
- Radutu, A.; Vlad-Sandru, M.-I. Review on the Use of Satellite-Based Radar Interferometry for Monitoring Mining Subsidence in Urban Areas and Demographic Indicators Assessment. Min. Rev./Rev. Minelor. 2023, 29, 42–62. [Google Scholar] [CrossRef]
- Rezaei, M.; Hossaini, M.F.; Majdi, A. A time-independent energy model to determine the height of destressed zone above the mined panel in longwall coal mining. Tunn. Undergr. Space Technol. 2015, 47, 81–92. [Google Scholar] [CrossRef]
- Salmi, E.F.; Nazem, M.; Karakus, M. Numerical analysis of a large landslide induced by coal mining subsidence. Eng. Geol. 2017, 217, 141–152. [Google Scholar] [CrossRef]
- Bai, E.; Guo, W.; Tan, Y. Negative externalities of high-intensity mining and disaster prevention technology in China. Bull. Eng. Geol. Environ. 2019, 78, 5219–5235. [Google Scholar] [CrossRef]
- Tajdu´s, K.; Sroka, A.; Misa, R.; Hager, S.; Rusek, J.; Dudek, M.; Wollnik, F. Analysis of Mining-induced delayed surface subsidence. Minerals 2021, 11, 1187. [Google Scholar] [CrossRef]
- Modeste, G.; Doubre, C.; Masson, F. Time evolution of mining-related residual subsidence monitored over a 24-year period using InSAR in southern Alsace, France. Int. J. Appl. Earth Obs. Geoinf. 2021, 102, 102392. [Google Scholar] [CrossRef]
- Declercq, P.-Y.; Dusar, M.; Pirard, E.; Verbeurgt, J.; Choopani, A.; Devleeschouwer, X. Post Mining Ground Deformations Transition Related to Coal Mines Closure in the Campine Coal Basin, Belgium, Evidenced by Three Decades of MT-InSAR Data. Remote Sens. 2023, 15, 725. [Google Scholar] [CrossRef]
- Li, P.; Zhu, X.; Ding, X.; Zhang, T. An Experimental Study of Industrial Site and Shaft Pillar Mining at Jinggezhuang Coal Mine. Appl. Sci. 2023, 13, 2340. [Google Scholar] [CrossRef]
- Wang, Z.; Li, W.; Wang, Q. Monitoring the dynamic response of the overlying rock-soil composite structure to underground mining using BOTDR and FBG sensing technologies. Rock Mech. Rock Eng. 2021, 54, 5095–5116. [Google Scholar] [CrossRef]
- Dong, L.; Zhu, H.; Yan, F.; Bi, S. Risk field of rock instability using microseismic monitoring data in deep mining. Sensors 2023, 23, 1300. [Google Scholar] [CrossRef] [PubMed]
- Dudek, M.; Tajdu´s, K. FEM for prediction of surface deformations induced by flooding of steeply inclined mining seams. Geomech. Energy Environ. 2021, 28, 100254. [Google Scholar] [CrossRef]
- Bo, H.; Li, Y.; Tan, X.; Dong, Z.; Zheng, G.; Wang, Q.; Yu, K. Estimation of Ground Subsidence Deformation Induced by Underground Coal Mining with GNSS-IR. Remote Sens. 2022, 15, 96. [Google Scholar] [CrossRef]
- Fan, K.; Li, W.; Wang, Q. Formation mechanism and prediction method of water inrush from separated layers within coal seam mining: A case study in the Shilawusu mining area China. Eng. Fail. Anal. 2019, 103, 158–172. [Google Scholar] [CrossRef]
- Yan, W.; Chen, J.; Yan, Y. A new model for predicting surface mining subsidence: The improved lognormal function model. Geosci. J. 2019, 23, 165–174. [Google Scholar] [CrossRef]
- Yan, W.; Dai, H.; Chen, J. Surface crack and sand inrush disaster induced by high-strength mining: Example from the Shendong coal field, China. Geosci. J. 2018, 22, 347–357. [Google Scholar] [CrossRef]


| Number | Name | Thickness (cm) | Weight/kg | Material Consumption | ||||
|---|---|---|---|---|---|---|---|---|
| Sand/kg | Calcium Carbonate/kg | Gypsum/kg | Water/kg | Sawdust/kg | ||||
| 1 | Aeolian sand | 36.98 | 301.46 | 262.01 | 39.45 | |||
| 2 | Sandy mudstone | 3.26 | 36.08 | 32.07 | 2.81 | 1.20 | 2.16 | |
| 3 | Siltstone | 3.57 | 39.01 | 34.14 | 1.46 | 3.41 | 2.34 | |
| 4 | Medium-grained sandstone | 4.32 | 49.99 | 39.99 | 3.00 | 7.00 | 3.00 | |
| 5 | Fine-grained sandstone | 3.05 | 34.03 | 29.17 | 1.46 | 3.40 | 2.04 | |
| 6 | Siltstone | 3.25 | 35.52 | 31.08 | 1.33 | 3.11 | 2.13 | |
| 7 | Medium-grained sandstone | 9.28 | 107.38 | 85.91 | 6.44 | 15.03 | 6.44 | |
| 8 | Siltstone | 1.35 | 14.75 | 12.91 | 0.55 | 1.29 | 0.89 | |
| 9 | Fine-grained sandstone | 4.58 | 51.10 | 43.80 | 2.19 | 5.11 | 3.07 | |
| 10 | Fine-grained sandstone | 2.43 | 27.11 | 23.24 | 1.16 | 2.71 | 1.63 | |
| 11 | Medium-grained sandstone | 2.95 | 34.14 | 27.31 | 2.05 | 4.78 | 2.05 | |
| 12 | Fine-grained sandstone | 3.77 | 42.07 | 36.06 | 1.80 | 4.21 | 2.52 | |
| 13 | Sandy mudstone | 2.19 | 24.24 | 21.54 | 1.88 | 0.81 | 1.45 | |
| 14 | Medium-grained sandstone | 1.89 | 21.87 | 17.50 | 1.31 | 3.06 | 1.31 | |
| 15 | Siltstone | 2.23 | 24.37 | 21.32 | 0.91 | 2.13 | 1.46 | |
| 16 | Coal seam | 5 | 42.86 | 38.57 | 3.43 | 0.86 | 2.57 | |
| 17 | Siltstone | 10 | 115.71 | 92.57 | 6.94 | 16.20 | 6.94 | |
| Number | Name | Thickness (cm) | Weight/kg | Material Consumption | ||||
|---|---|---|---|---|---|---|---|---|
| Sand/kg | Calcium Carbonate/kg | Gypsum/kg | Water/kg | Sodium Borate/g | ||||
| 1 | Loose layer | 30 | 375.5 | 331.8 | 17.7 | 25.9 | 41.6 | 417.2 |
| 2 | Medium-grained sandstone | 2.79 | 47.38 | 40.61 | 3.38 | 3.38 | 5.26 | 52.64 |
| 3 | Mudstone | 10.84 | 180.7 | 161.91 | 10.08 | 8.71 | 20.09 | 200.75 |
| 4 | Siltstone | 0.93 | 15.62 | 13.89 | 0.87 | 0.87 | 1.74 | 17.36 |
| 5 | Medium-grained sandstone | 1.66 | 28.19 | 24.16 | 2.01 | 2.01 | 3.13 | 31.32 |
| 6 | Mudstone | 2.98 | 49.15 | 43.27 | 4.4 | 1.48 | 5.47 | 54.61 |
| 7 | Siltstone | 6.44 | 108.3 | 96.28 | 6.03 | 6.03 | 12.03 | 120.3 |
| 8 | Medium-grained sandstone | 6.24 | 106.18 | 91 | 7.58 | 7.58 | 11.8 | 117.98 |
| 9 | Siltstone | 4.03 | 67.29 | 59.8 | 3.73 | 3.73 | 7.48 | 74.77 |
| 10 | Sandy mudstone | 2.29 | 37.73 | 33.01 | 3.77 | 0.94 | 4.19 | 41.92 |
| 11 | Siltstone | 5.95 | 99.96 | 88.81 | 5.57 | 5.57 | 11.09 | 111.05 |
| 12 | Medium-grained sandstone | 1.72 | 29.21 | 25.03 | 2.09 | 2.09 | 3.25 | 32.45 |
| 13 | Sandy mudstone | 1.74 | 28.62 | 25.05 | 2.86 | 0.72 | 3.18 | 31.81 |
| 14 | Medium-grained sandstone | 6.79 | 115 | 98.6 | 8.23 | 8.23 | 12.78 | 127.87 |
| 15 | Siltstone | 2.3 | 37.16 | 33.03 | 2.06 | 2.06 | 4.13 | 41.29 |
| 16 | Medium-grained sandstone | 5.3 | 89.88 | 77.05 | 6.42 | 6.42 | 9.99 | 99.87 |
| 17 | Sandy mudstone | 40.72 | 677.3 | 594.46 | 54.89 | 27.85 | 75.27 | 752.58 |
| 18 | Siltstone | 4.57 | 76.85 | 67.4 | 4.72 | 4.72 | 8.54 | 85.39 |
| 19 | Medium-grained sandstone | 2.56 | 43.47 | 37.26 | 3.1 | 3.1 | 4.83 | 48.3 |
| 20 | Sandy mudstone | 7.7 | 127.01 | 111.11 | 12.71 | 3.18 | 14.12 | 141.11 |
| 21 | Siltstone | 2.07 | 34.6 | 30.75 | 1.92 | 1.92 | 3.84 | 38.44 |
| 22 | Medium-grained sandstone | 10.38 | 181.6 | 155.63 | 12.98 | 12.98 | 20.16 | 201.76 |
| 23 | Coal seam | 2 | 23.36 | 20.77 | 1.82 | 0.78 | 2.6 | 25.96 |
| 24 | Siltstone | 1.6 | 14.28 | 12.7 | 0.79 | 0.79 | 1.59 | 15.87 |
| 25 | Sandy mudstone | 2.4 | 39.48 | 34.54 | 3.94 | 0.98 | 4.38 | 43.86 |
Disclaimer/Publisher’s Note: The statements, opinions and data contained in all publications are solely those of the individual author(s) and contributor(s) and not of MDPI and/or the editor(s). MDPI and/or the editor(s) disclaim responsibility for any injury to people or property resulting from any ideas, methods, instructions or products referred to in the content. |
© 2023 by the authors. Licensee MDPI, Basel, Switzerland. This article is an open access article distributed under the terms and conditions of the Creative Commons Attribution (CC BY) license (https://creativecommons.org/licenses/by/4.0/).
Share and Cite
Yan, W.; Guo, J.; Yan, S. Difference in Surface Damage between Deep and Shallow Mining of Underground Coal Resources in China. Sustainability 2023, 15, 7296. https://doi.org/10.3390/su15097296
Yan W, Guo J, Yan S. Difference in Surface Damage between Deep and Shallow Mining of Underground Coal Resources in China. Sustainability. 2023; 15(9):7296. https://doi.org/10.3390/su15097296
Chicago/Turabian StyleYan, Weitao, Junting Guo, and Shaoge Yan. 2023. "Difference in Surface Damage between Deep and Shallow Mining of Underground Coal Resources in China" Sustainability 15, no. 9: 7296. https://doi.org/10.3390/su15097296
APA StyleYan, W., Guo, J., & Yan, S. (2023). Difference in Surface Damage between Deep and Shallow Mining of Underground Coal Resources in China. Sustainability, 15(9), 7296. https://doi.org/10.3390/su15097296