AI-Based Degradation Index from the Microstructure Image and Life Prediction Models Based on Bayesian Inference
Abstract
1. Introduction
1.1. Background
1.2. Related Works
- (1)
- Novel experiment data: Since nickel-based superalloys have superheat resistance, the creep-rupture test is an expensive test that requires long-term observation to observe fracture while maintaining extreme environments such as high temperature and high pressure. However, it is necessary to acquire as much actual destructive test data as possible to increase the reliability of the index indicating the degree of degradation rather than using physical simulation values or interpolated values.
- (2)
- Lack of explainability and consistency of degradation index: A method that can consistently represent degradation with little test data is needed due to the nature of high-cost destructive testing. Statistical inference based on frequentism is based on the assumption that there are a lot of observed data. So, it is necessary to apply a method in which parameter inference can be made with fewer data, and the uncertainty of the inference decreases as the amount of observation data increases. After the degradation index is obtained, an explanatory and intuitive rationale is needed to secure the reliability of this index.
- (3)
- Unreliable prediction model: Due to high cost and long-term destructive testing, acquiring environmental condition data that lack diversity is likely. Predictive values of frequentist-based statistical models for untested environmental conditions are unreliable. Frequentism-based interval estimation methods such as confidence intervals are not appropriate for small data, and interpretation of the results is not intuitive. To improve this, it is necessary to use an approach and model that can be predicted with a small amount of data by setting the parameter as a random variable and quantitatively expressing the uncertainty as a probability.
- (4)
- Time-consuming and destructive test-based degradation diagnosis method: Currently, the diagnosis of degradation of high-temperature components is mainly performed by qualitative evaluation by experts. It is time consuming to take a microstructure image, analyze the shape of microstructural tissues in which degradation is progressing, and diagnose the degradation. In addition, there is a fatal disadvantage that degradation and lifespan can be evaluated only by destructive testing of high-temperature parts. This means that degradation and lifetime diagnosis cannot be performed on high-temperature parts of operating equipment.
- Reliable model based on actual destructive data of nickel-based superalloys: modeling based on creep-rupture fracture test data of the expensive nickel-based superalloy DA-5161 SX (rather than data from simulation and physical interpolation) improved the reliability of the model.
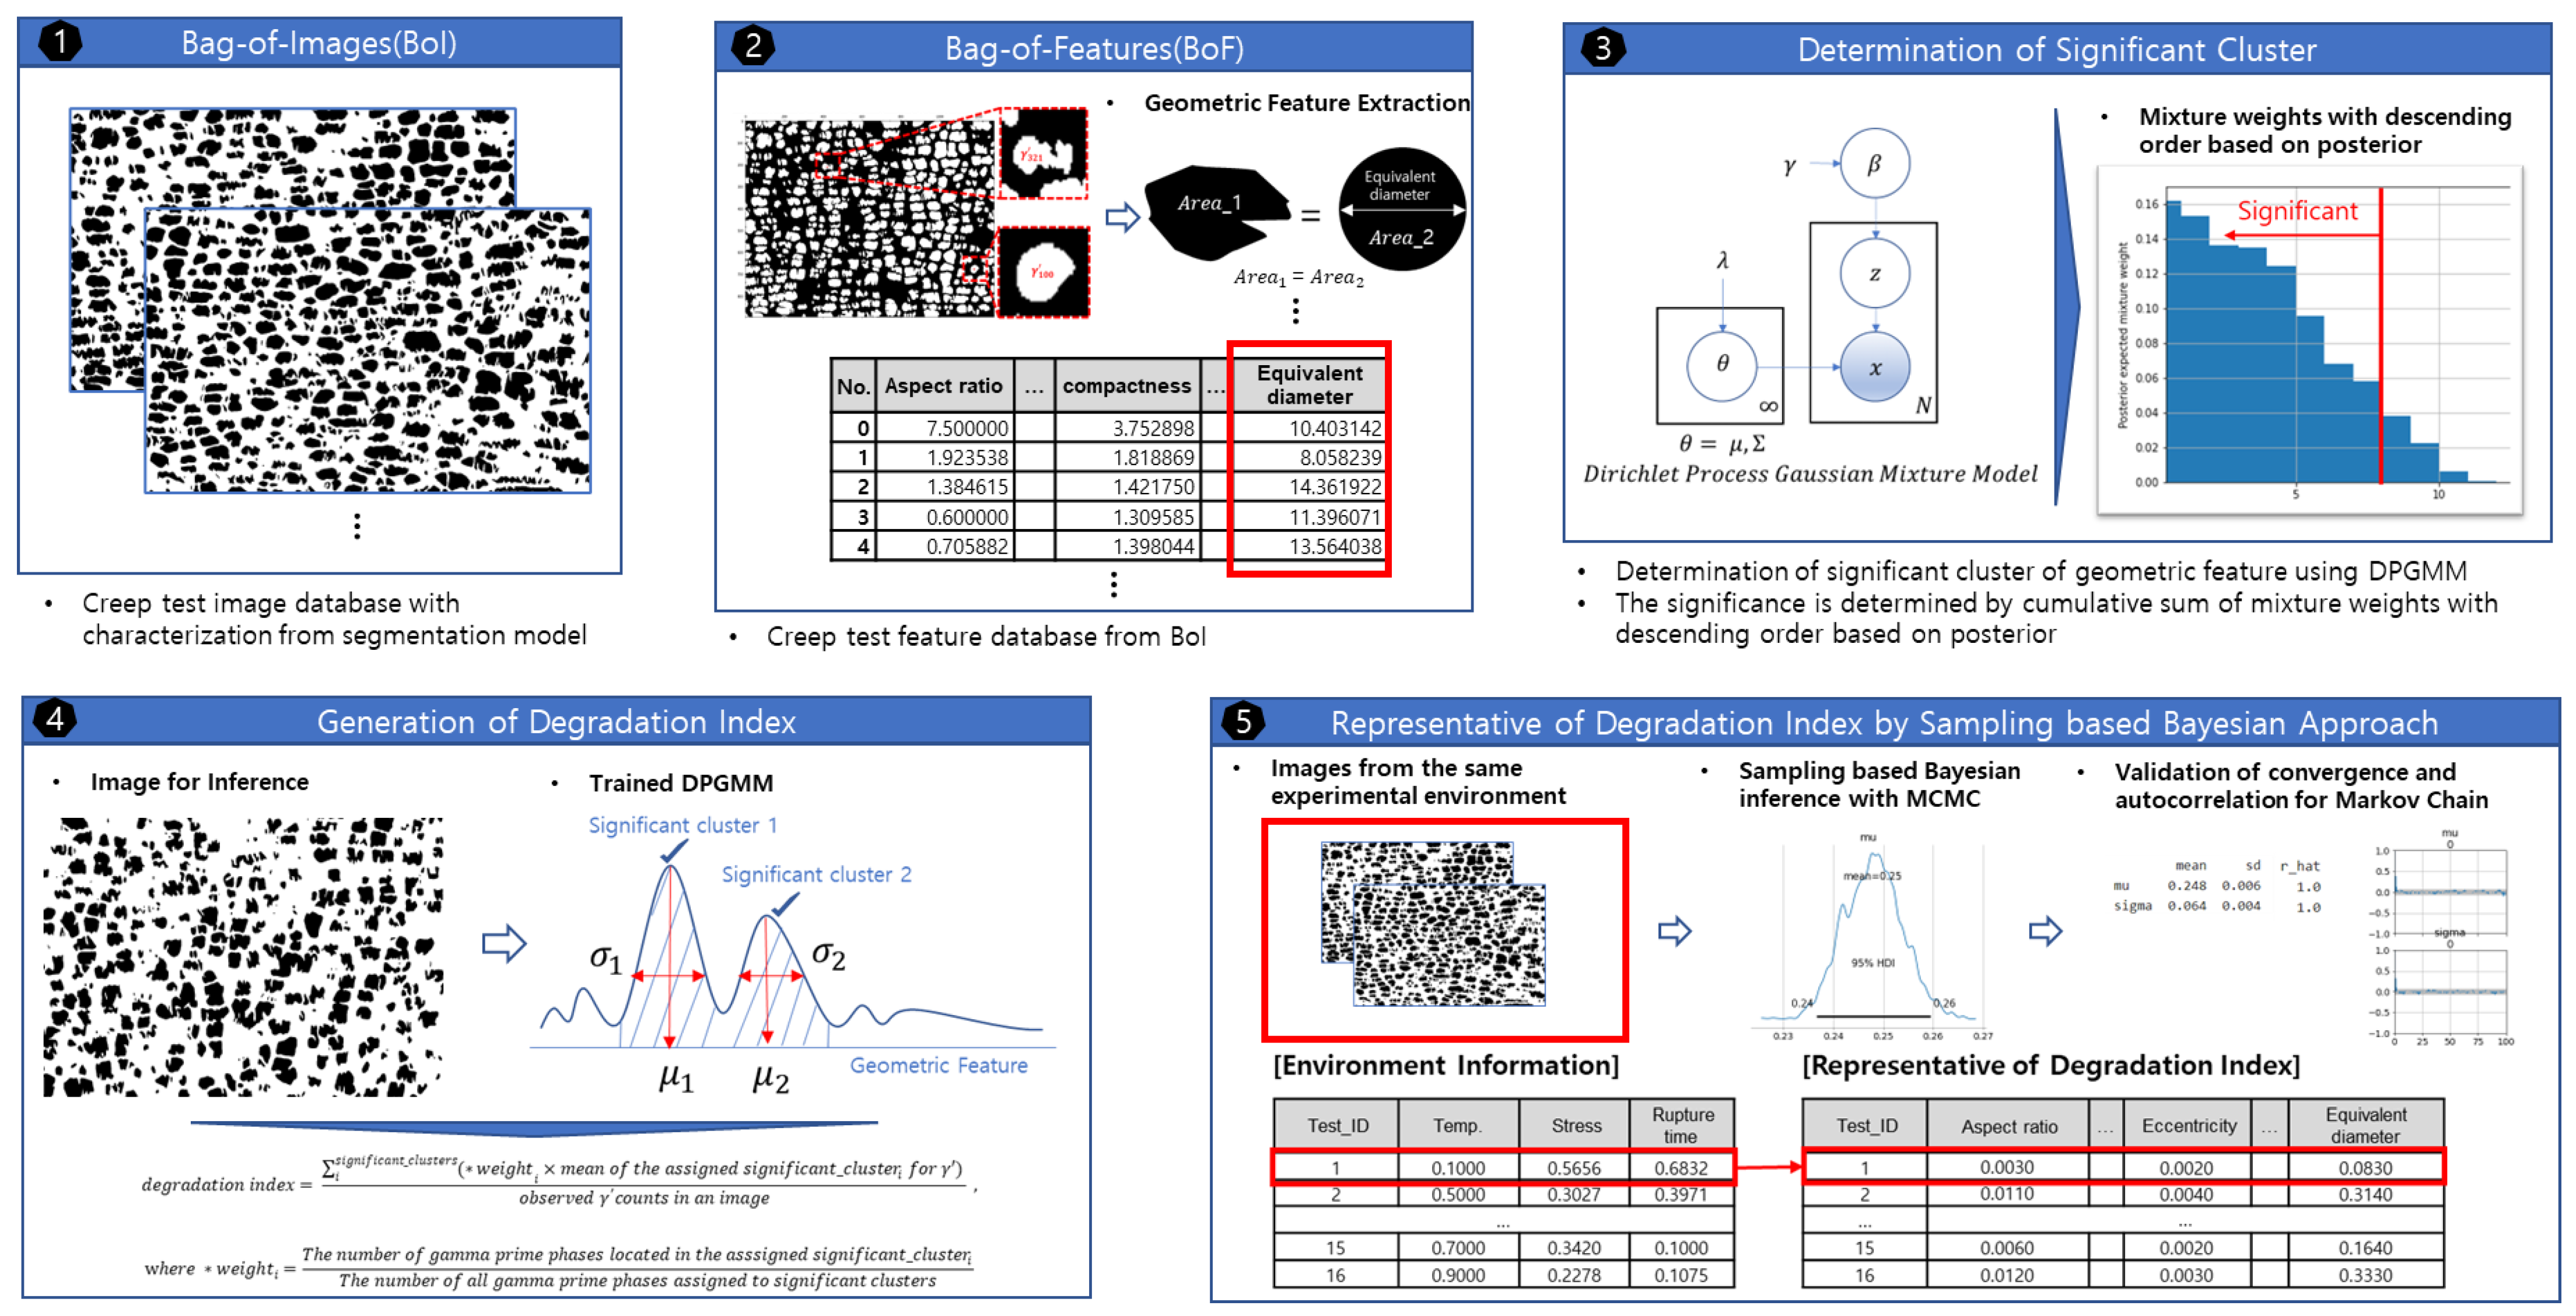
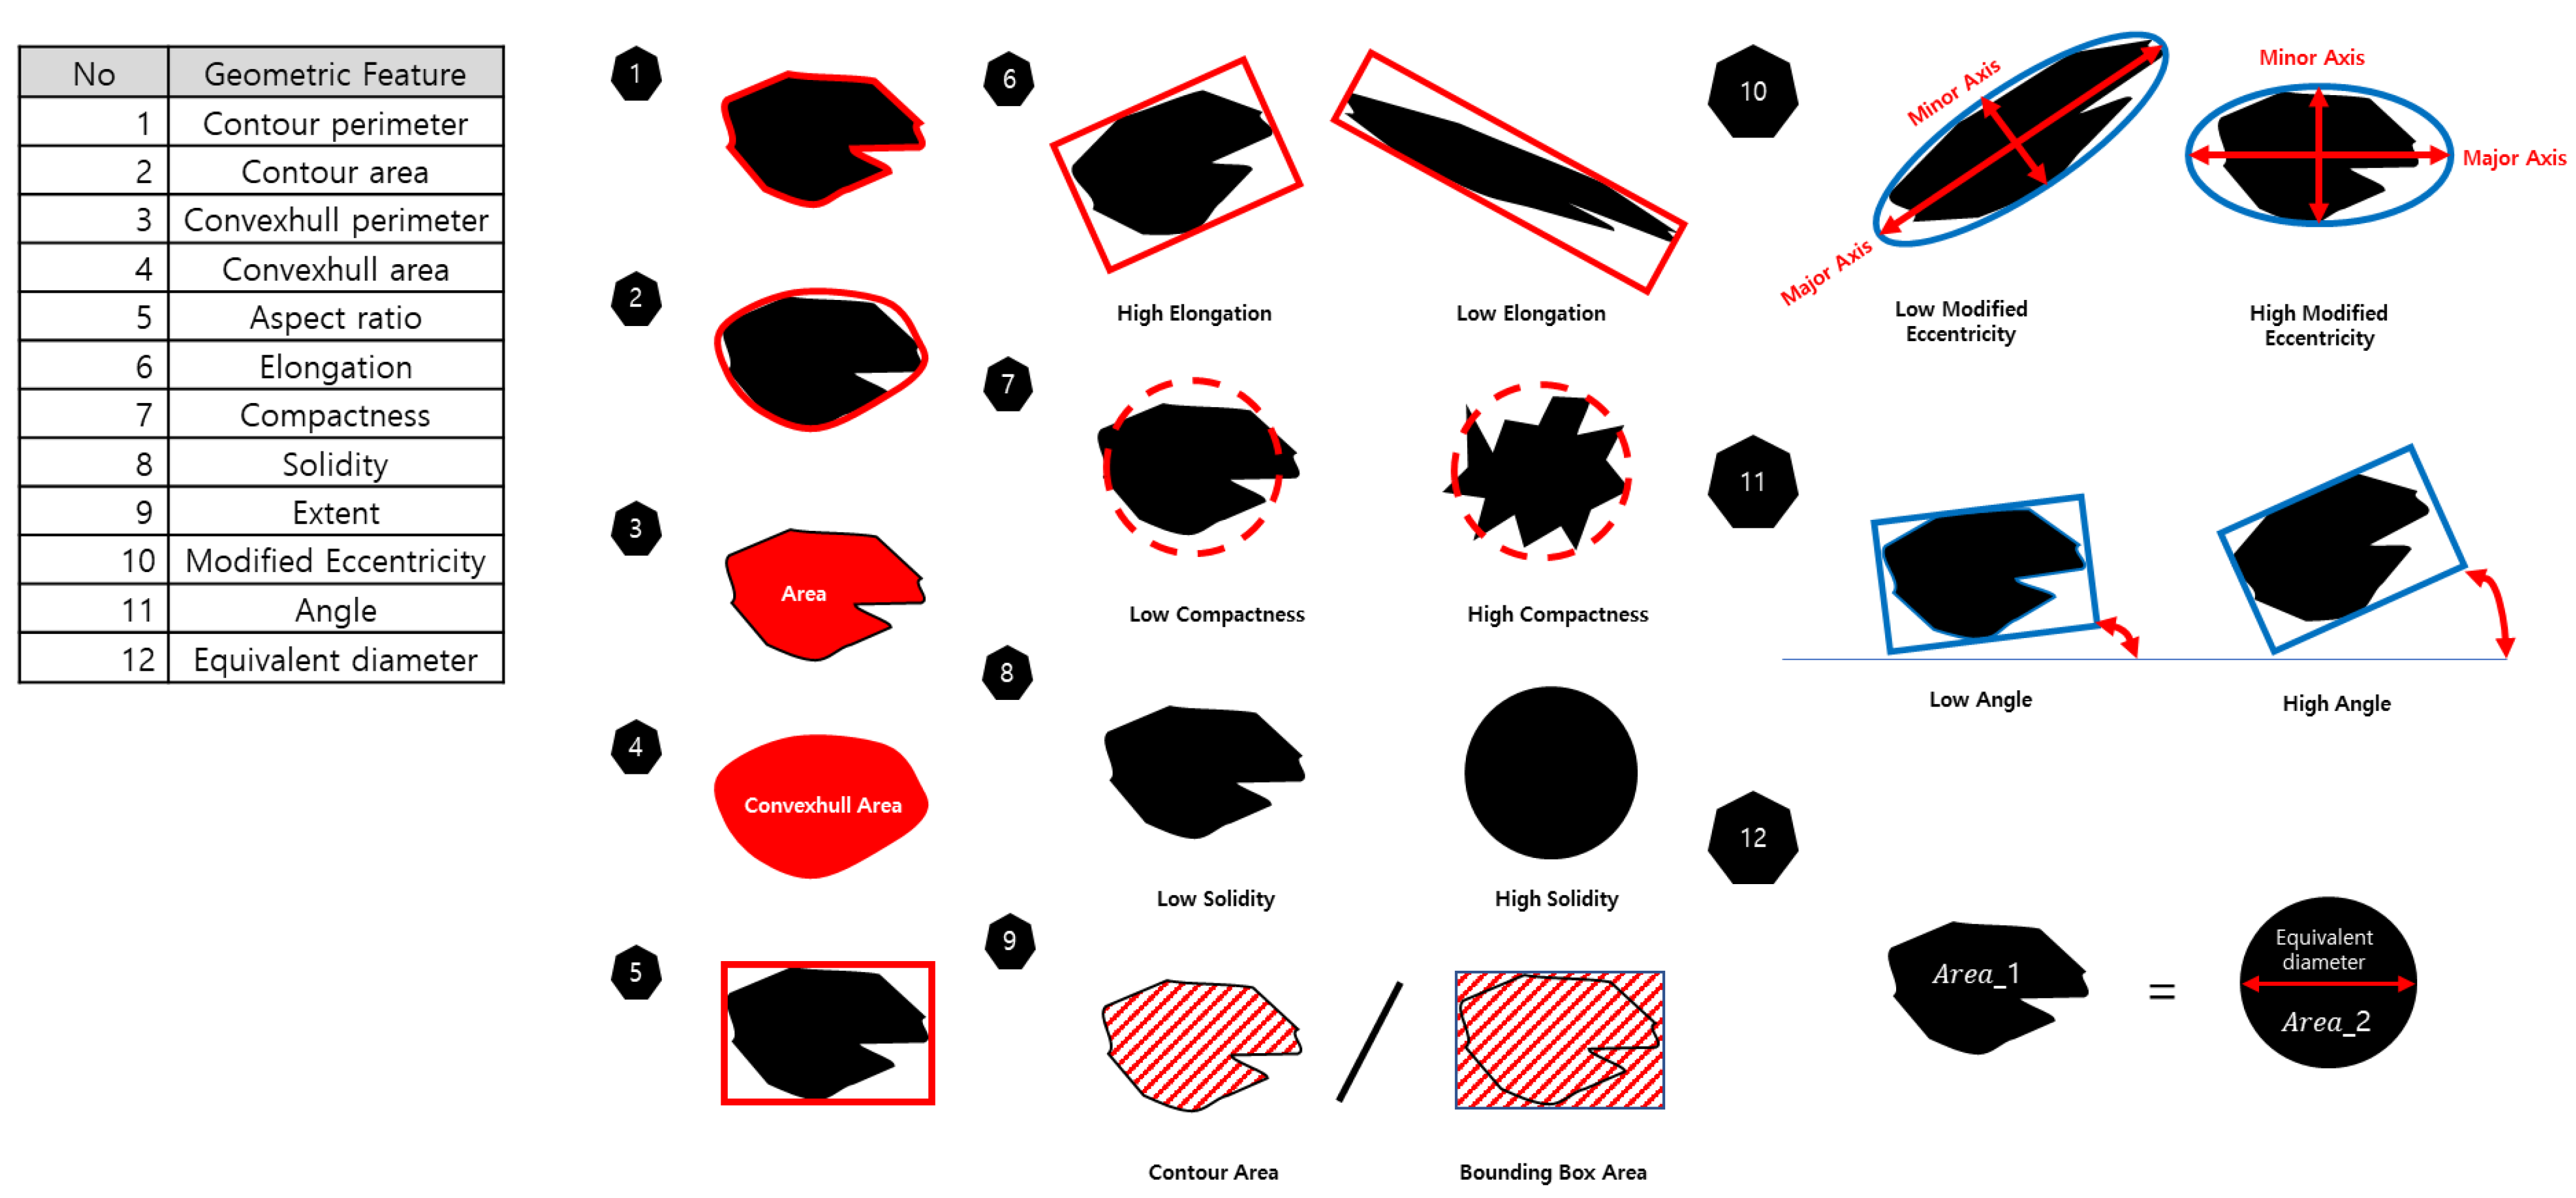
- Unique method of building degradation index and the novel result: The proposed degradation index construction method is a brand-new method that has not been reported before. Although the observed data are sparse due to the nature of the destructive test, the parameters of the degradation index can be inferred using the Bayesian model (Dirichlet process Gaussian mixture model, Metropolis–Hastings sampler). It is possible to obtain consistent results while simply constructing a one-dimensional degradation index for each extreme environmental condition. Since the 12 degradation indices are composed of geometrical feature extraction results on degraded tissue, the degradation index itself can intuitively explain the geometrical features.
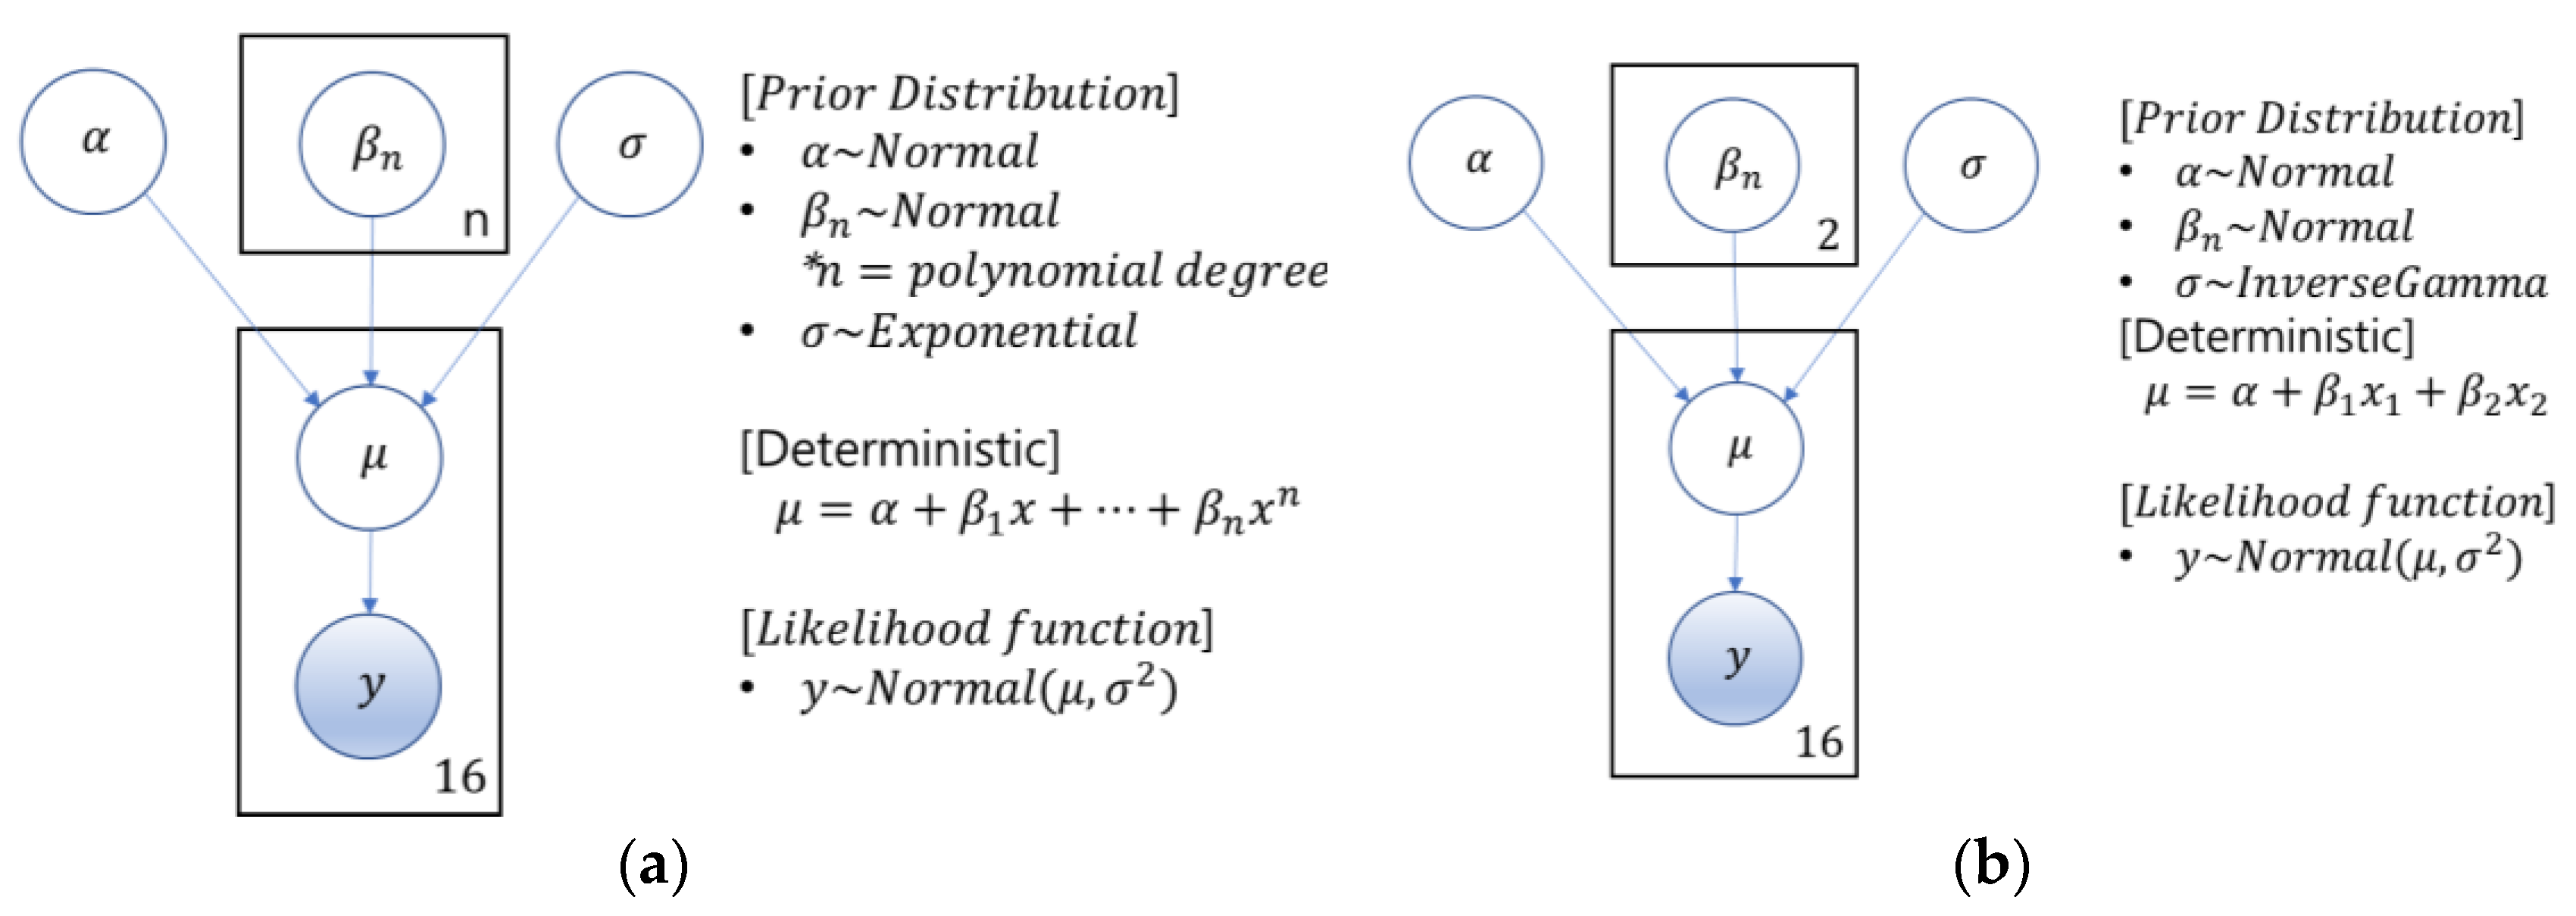
- Novel non-destructive life prediction model: Without destroying high-temperature parts, it is possible to quickly predict degradation index and LMP indicating creep life at the same time only by inputting environmental conditions. This created a basis for predicting the degradation degree and lifespan of non-destructive high-temperature parts only under environmental conditions that can be evaluated even during operation of the machine. The performance was compared and evaluated with four regression models for the relationship between environmental conditions, degradation index, and LMP. In addition to improving model performance by inputting significant explanatory variables to the sampling-based Bayesian regression model, intuition for interpretation was improved by quantifying the uncertainty of prediction results with probability.
2. Materials and Methods
2.1. Materials
2.1.1. Data Acquisition
2.1.2. Data Preprocessing
2.2. Methods
2.2.1. Quantification Method of Degradation Index
2.2.2. Degradation Index Prediction Model
| Algorithm 1. Metropolis–Hastings Algorithm [31,32] |
| Initialize |
| for iteration do |
| Propose: |
| Acceptance Probability: |
| if then |
| Accept the proposal: |
| else |
| Reject the proposal: |
| end if |
| end for |
2.2.3. LMP Prediction Model
3. Results
3.1. Evaluation Metric
3.1.1. Root-Mean-Squared Error (RMSE)
3.1.2. R-Squared (R2)
3.2. Degradation Index Prediction Model Performance
3.3. LMP Prediction Model Performance
4. Discussion
4.1. Conclusions
- Reliable model based on the actual destructive data of nickel-based superalloys:Our model improved reliability by constructing a quantification model of the Bayesian approach to the degradation index with expensive destructive test data observed for a long period of time in the creep-rupture test of DA-5161 SX, a nickel-based superalloy.
- Unique method of building degradation index and the novel result:A consistent method of constructing a deterioration index with a low-dimensional representative value that can be explained by geometrical features with a small amount of destructive test data was proposed. The robustness of the degradation index quantification model was verified by confirming that the degradation index obtained from 20% of the test images among the entire test images had the lowest change rate of the degradation index obtained from 80% of the training images at 6.9%. The proposed degradation index can be used as a key health factor for diagnostic solutions for devices with extreme materials in the future to improve the diagnostic performance of devices.
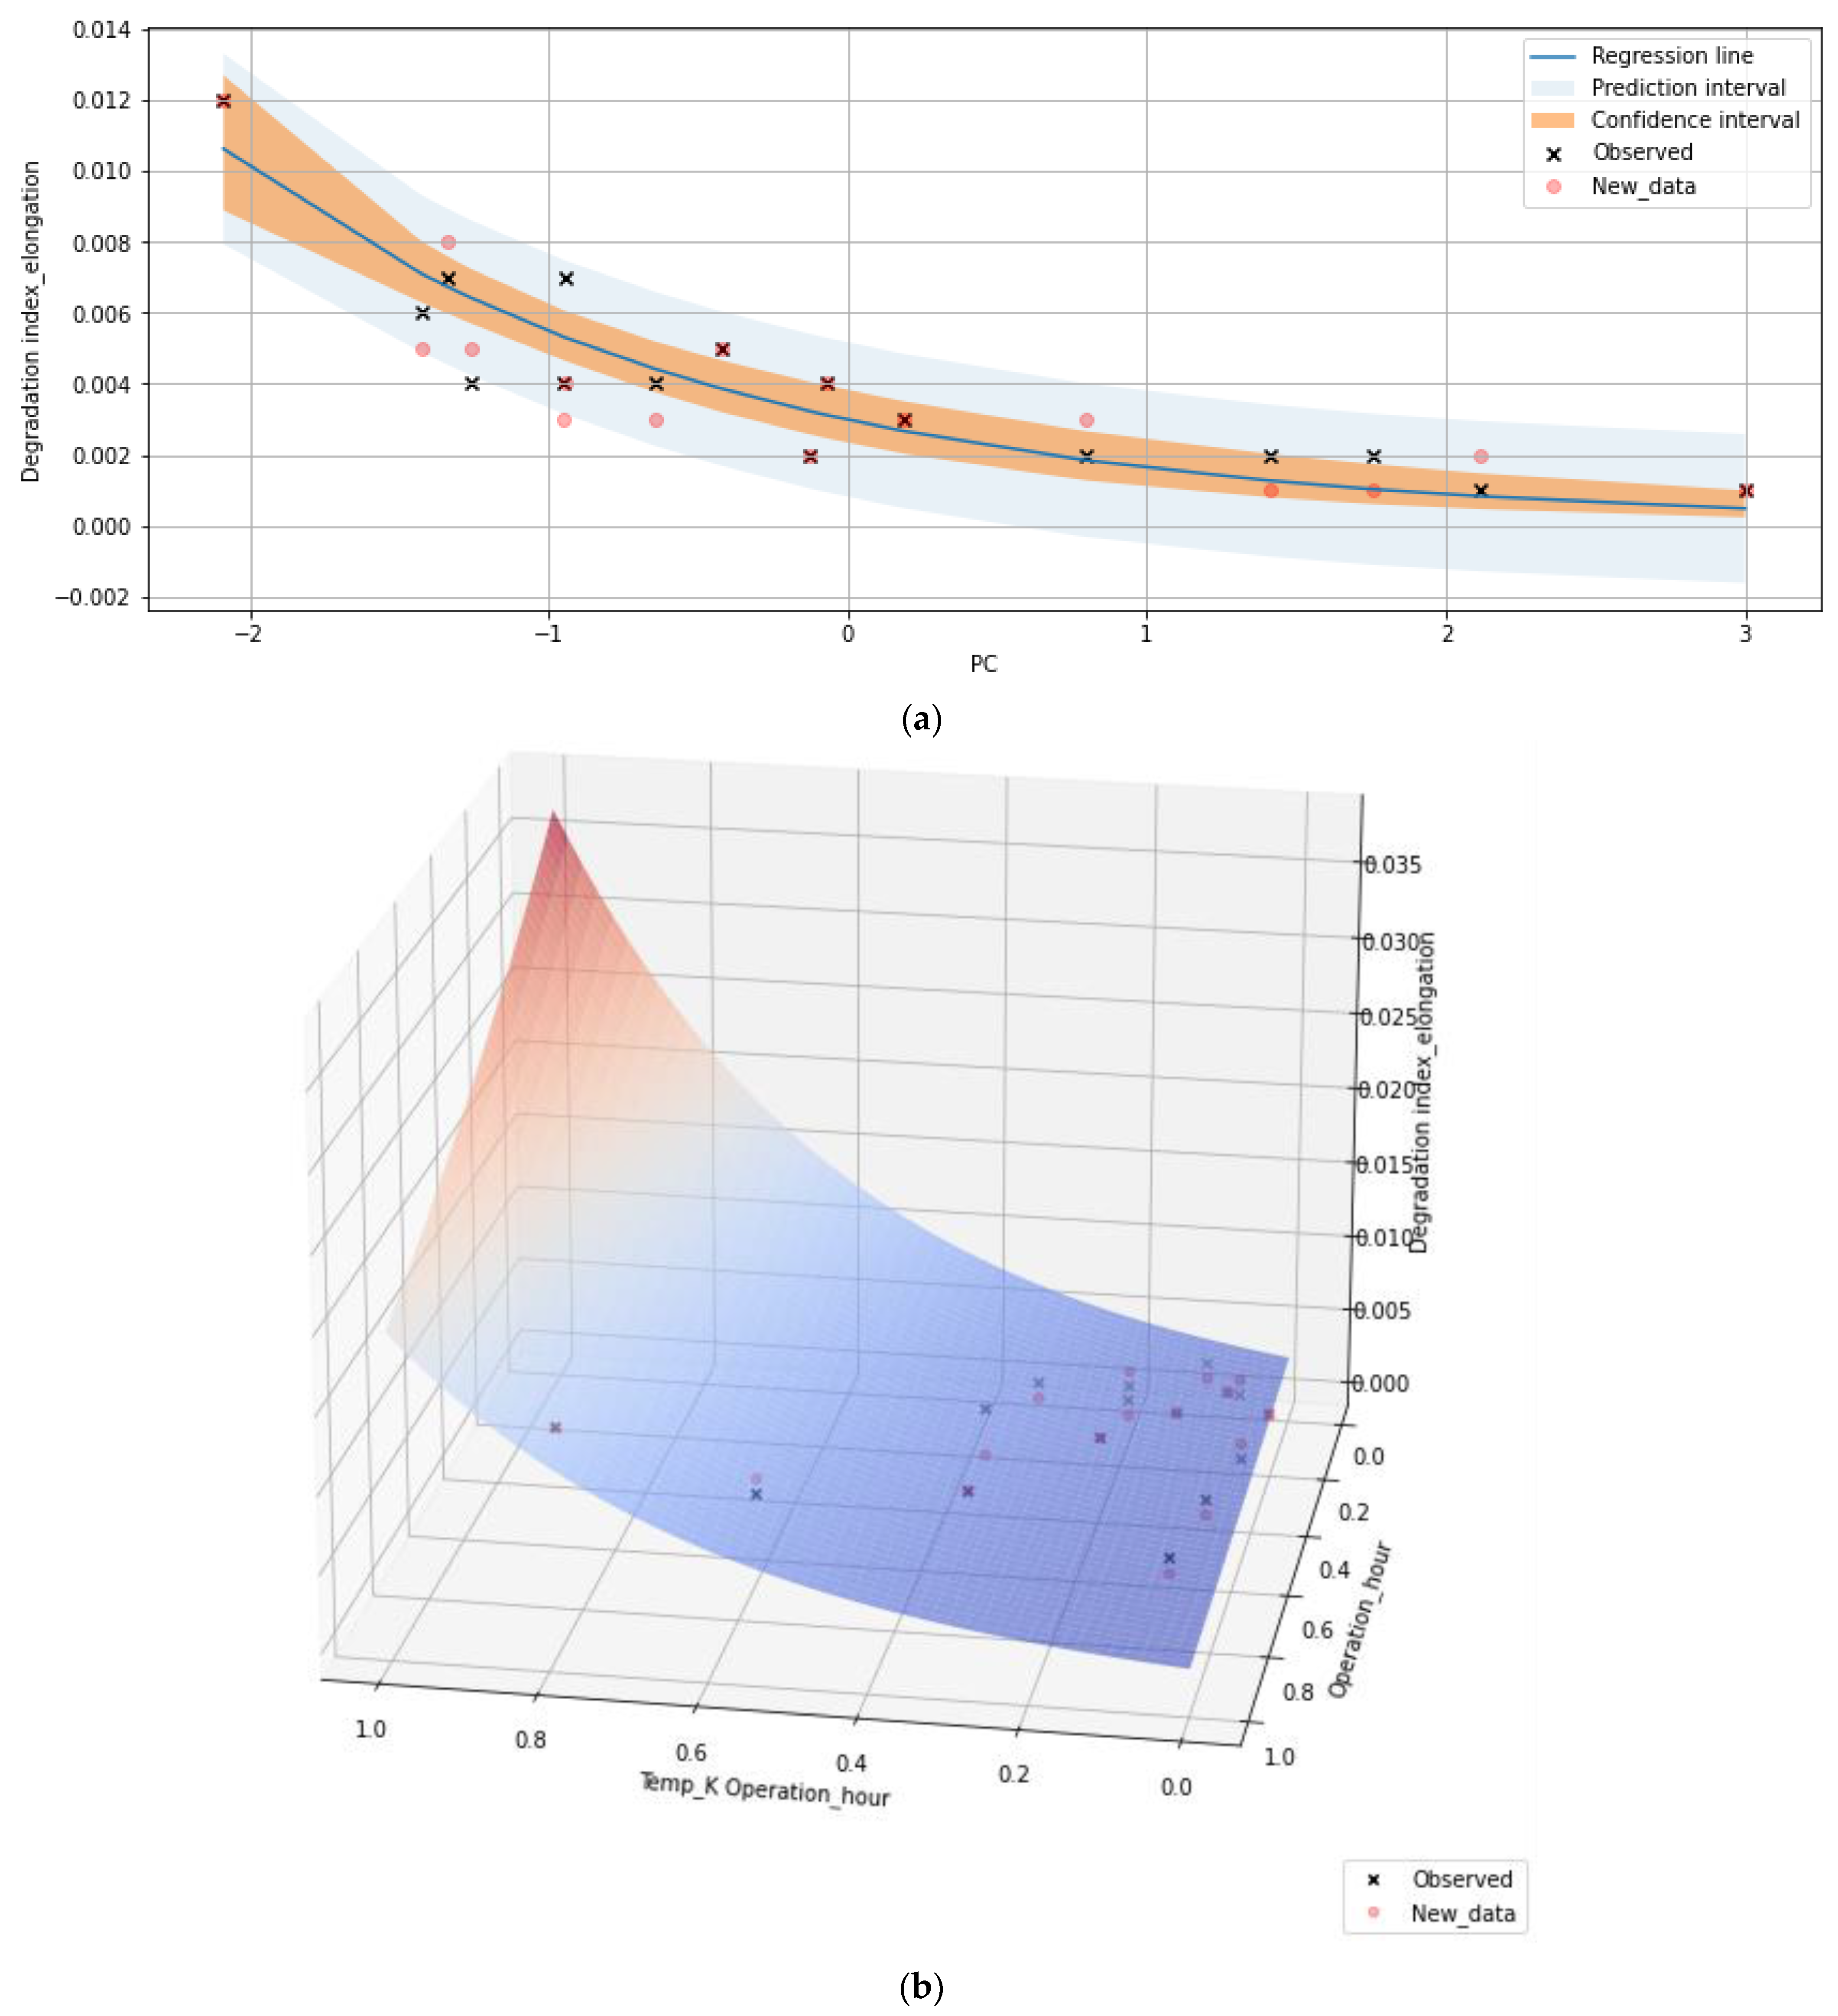
- Novel non-destructive life prediction model:Bayesian regression and Gaussian process regression models were proposed by applying the sampling-based Bayesian inference method. As a result, we confirmed that most of the Gaussian process regression showed almost acceptable RMSE performance when two significant explanatory variables suitable for explaining the response variable were input. In addition, predictions of unobserved environmental conditions can be described with quantified uncertainties for degradation and creep life. As a result, it is possible to predict degradation and creep life only under environmental conditions without destructive testing and intuitive visualization of the predicted results with low-dimensional descriptors.
4.2. Future Work
Author Contributions
Funding
Institutional Review Board Statement
Informed Consent Statement
Data Availability Statement
Acknowledgments
Conflicts of Interest
References
- O’Hagan, A. Bayesian statistics: Principles and benefits. Frontis 2004, 3, 44. [Google Scholar]
- Rezaeianjouybari, B.; Shang, Y. Deep learning for prognostics and health management: State of the art, challenges, and opportunities. Measurement 2020, 163, 107929. [Google Scholar] [CrossRef]
- Ministry of Trade, Industry and Energy (MOTIE). The 9th Basic Plan of Long-Term Electricity Supply and Demand; Ministry of Trade, Industry and Energy (MOTIE): Sejong, Republic of Korea, 2020; p. 39. [Google Scholar]
- Doosan Enerbility. Available online: https://www.doosanenerbility.com/kr/business/gas_turbine_product (accessed on 10 November 2022).
- Yuri, M.; Masada, J.; Tsukagoshi, K.; Ito, E.; Hada, S. Development of 1600 C-class high-efficiency gas turbine for power generation applying J-Type technology. Mitsubishi Heavy Ind. Tech. Rev. 2013, 50, 1–10. [Google Scholar]
- Salwan, G.K.; Subbarao, R.; Mondal, S. Comparison and selection of suitable materials applicable for gas turbine blades. Mater. Today Proc. 2021, 46, 8864–8870. [Google Scholar] [CrossRef]
- Farzaneh, A.; Khorasani, M.; Farabi, E.; Gibson, I.; Leary, M.; Ghasemi, A.; Rolfe, B. Sandwich structure printing of Ti-Ni-Ti by directed energy deposition. Virtual Phys. Prototyp. 2022, 17, 1006–1030. [Google Scholar] [CrossRef]
- Fan, Y.S.; Yang, X.G.; Shi, D.Q.; Tan, L.; Huang, W.Q. Quantitative mapping of service process-microstructural degradation-property degradation for a Ni-based superalloy based on chord length distribution imaging process. Mater. Des. 2021, 203, 109561. [Google Scholar] [CrossRef]
- Kang, D.W.; Kim, T.S. Model-based performance diagnostics of heavy-duty gas turbines using compressor map adaptation. Appl. Energy 2018, 212, 1345–1359. [Google Scholar] [CrossRef]
- Jin, Y.; Ying, Y.; Li, J.; Zhou, H. Gas path fault diagnosis of gas turbine engine based on knowledge data-driven artificial intelligence algorithm. IEEE Access 2021, 9, 108932–108941. [Google Scholar] [CrossRef]
- Li, Y.G. Gas turbine performance and health status estimation using adaptive gas path analysis. J. Eng. Gas Turbines Power 2010, 132, 041701. [Google Scholar] [CrossRef]
- Marahleh, G.; Kheder, A.R.I.; Hamad, H.F. Creep-life prediction of service-exposed turbine blades. Mater. Sci. 2006, 42, 476–481. [Google Scholar] [CrossRef]
- Larson, F.R.; Miller, J. A time-temperature relationship for rupture and creep stresses. Trans. Am. Soc. Mech. Eng. 1952, 74, 774–775. [Google Scholar] [CrossRef]
- Blum, A.L.; Langley, P. Selection of relevant features and examples in machine learning. Artif. Intell. 1997, 97, 245–271. [Google Scholar] [CrossRef]
- Dash, M.; Liu, H. Feature selection for classification. Intell. Data Anal. 1997, 1, 131–156. [Google Scholar] [CrossRef]
- Liu, H.; Motoda, H. (Eds.) Feature Extraction, Construction and Selection: A Data Mining Perspective; Springer Science & Business Media: Berlin/Heidelberg, Germany, 1998; p. 453. [Google Scholar]
- Matheus, C.J. The need for constructive induction. In Machine Learning Proceedings; Elsevier: Amsterdam, The Netherlands, 1991; pp. 173–177. [Google Scholar]
- Wnek, J.; Michalski, R.S. Hypothesis-driven constructive induction in AQ17-HCI: A method and experiments. Mach. Learn. 1994, 14, 139–168. [Google Scholar] [CrossRef]
- Wyse, N.; Dubes, R.; Jain, A.K. A critical evaluation of intrinsic dimensionality algorithms. In Pattern Recognition in Practice; Elsevier: Amsterdam, Netherlands, 1980; pp. 415–425. [Google Scholar]
- Hand, D.; Mannila, H.; Smyth, P. Principles of Data Mining; A Bradford Book: Denver, CO, USA, 2001. [Google Scholar]
- Motoda, H.; Liu, H. Feature Selection, Extraction and Construction. Commun. IICM 2002, 5, 2. [Google Scholar]
- Gupta, A.; Cecen, A.; Goyal, S.; Singh, A.K.; Kalidindibc, S.R. Structure–property linkages using a data science approach: Application to a non-metallic inclusion/steel composite system. Acta Mater. 2015, 91, 239–254. [Google Scholar] [CrossRef]
- Gorgannejad, S.; Gahrooei, M.R.; Paynabar, K.; Neu, R.W. Quantitative prediction of the aged state of Ni-base superalloys using PCA and tensor regression. Acta Mater. 2019, 165, 259–269. [Google Scholar] [CrossRef]
- Fua, C.; Chena, Y.; Li, L.; Antonov, S.; Feng, Q. Evaluation of service conditions of high pressure turbine blades made of DS Ni-base superalloy by artificial neural networks. Mater. Today Commun. 2020, 22, 100838. [Google Scholar] [CrossRef]
- Zhang, X.C.; Gong, J.G.; Xuan, F.Z. A deep learning based life prediction method for components under creep, fatigue and creep-fatigue conditions. Int. J. Fatigue 2021, 148, 106236. [Google Scholar] [CrossRef]
- Xu, J.; Li, L.; Liu, X.; Li, H.; Feng, Q. Fast characterization framework for creep microstructure of a nickel-based SX superalloy with high-throughput experiments and deep learning methods. Mater. Charact. 2022, 187, 111857. [Google Scholar] [CrossRef]
- E139-11; Standard Test Methods for Conducting Creep, Creep-Rupture, and Stress-Rupture Tests of Metallic Materials. ASTM International: West Conshohocken, PA, USA, 2006.
- Graham, R.L.; Yao, F.F. Finding the convex hull of a simple polygon. J. Algorithms 1983, 4, 324–331. [Google Scholar] [CrossRef]
- University of Guelph CIS 6320. Shape Analysis and Measurement. 2001. Available online: http://www.cyto.purdue.edu/cdroms/micro2/content/education/wirth10.pdf (accessed on 24 November 2022).
- Bishop, C.M. Pattern Recognition and Machine Learning; Springer: New York, NY, USA, 2006. [Google Scholar]
- Yildirim, I. Bayesian Inference: Metropolis-Hastings Sampling; Dept. of Brain and Cognitive Sciences, Univ. of Rochester: Rochester, NY, USA, 2012. [Google Scholar]
- Hastings, W.K. Monte Carlo sampling methods using Markov chains and their applications. Biometrika 1970, 57, 97–109. [Google Scholar] [CrossRef]
- Schulz, E.; Speekenbrink, M.; Krause, A. A tutorial on Gaussian process regression: Modelling, exploring, and exploiting functions. J. Math. Psychol. 2018, 85, 1–16. [Google Scholar] [CrossRef]
- Gaussian Processes: A Quick Introduction. Available online: https://arxiv.org/pdf/1505.02965.pdf (accessed on 24 November 2022).
- Kang, S.H.; Choi, H.S.; Yang, S.H.; Yi, J.H. Rejuvenation Technology for Aged Materials Used for Heavy Duty Gas Turbine Components. In Proceedings of the KSME Conference, Seoul, Republic of Korea, 3 June 2006. [Google Scholar]








| Year | Description | Coal | LNG |
|---|---|---|---|
| 2020 | Capacity (GW) | 35.3 | 41.3 |
| Weight (%) | 31.9 | 37.4 | |
| 2022 | Capacity (GW) | 37.8 | 43.3 |
| Weight (%) | 32.0 | 36.7 | |
| 2030 | Capacity (GW) | 31.9 | 55.5 |
| Weight (%) | 26.1 | 45.3 | |
| 2034 | Capacity (GW) | 28.3 | 59.1 |
| Weight (%) | 22.7 | 47.3 |
| Title of Paper | Characteristics | Dataset | Limitation |
|---|---|---|---|
| Quantitative prediction of the aged state of Ni-based superalloys using PCA and tensor regression (2019) [23] |
|
|
|
| Evaluation of service conditions of high-pressure turbine blades made of DS Ni-based superalloy by artificial neural networks (2020) [24] |
|
|
|
| A deep-learning-based life prediction method for components under creep, fatigue, and creep–fatigue conditions (2021) [25] |
|
|
|
| Quantitative mapping of service process microstructural degradation–property degradation for a Ni-based superalloy based on chord length distribution imaging process (2021) [8] |
|
|
|
| Fast characterization framework for creep microstructure of a nickel-based SX superalloy with high-throughput experiments and deep learning methods (2022) [26] |
|
|
|
| Test No. | Temperature | Stress | Rupture Time |
|---|---|---|---|
| 1 | 0.1000 | 0.5656 | 0.6832 |
| 2 | 0.5000 | 0.3027 | 0.3971 |
| 3 | 0.7000 | 0.1964 | 0.4802 |
| 4 | 0.9000 | 0.1605 | 0.2081 |
| 5 | 0.5000 | 0.2681 | 0.6596 |
| 6 | 0.7000 | 0.1698 | 0.8178 |
| 7 | 0.9000 | 0.1000 | 0.9000 |
| 8 | 0.1000 | 0.6704 | 0.2823 |
| 9 | 0.5000 | 0.3399 | 0.2398 |
| 10 | 0.7000 | 0.2258 | 0.2589 |
| 11 | 0.9000 | 0.1408 | 0.3231 |
| 12 | 0.1000 | 0.6166 | 0.4825 |
| 13 | 0.1000 | 0.9000 | 0.1168 |
| 14 | 0.5000 | 0.4913 | 0.1060 |
| 15 | 0.7000 | 0.3420 | 0.1000 |
| 16 | 0.9000 | 0.2278 | 0.1075 |
| Degradation Index | Variation of Degradation Index between Train and Test Datasets |
|---|---|
| Contour perimeter | 11.41% |
| Contour area | 12.95% |
| Convex hull perimeter | 11.74% |
| Convex hull area | 12.34% |
| Aspect ratio | 14.10% |
| Elongation | 24.93% |
| Compactness | 11.01% |
| Solidity | 12.10% |
| Extent | 12.96% |
| Modified eccentricity | 20.16% |
| Angle | 6.85% |
| Equivalent diameter | 11.77% |
| Average | 13.53% |
| Degradation Index | Selected Input Variable |
|---|---|
| Contour perimeter | 1. Temperature × Time, 2. Temperature |
| Contour area | 1. Temperature × Time, 2. Stress |
| Convex hull perimeter | 1. Temperature × Time, 2. Temperature |
| Convex hull area | 1. Temperature × Time, 2. Temperature |
| Aspect ratio | |
| Elongation | 1. Temperature × Time, 2. Time |
| Compactness | 2. Temperature × Time |
| Solidity | 2. Temperature × Time |
| Extent | 2. Temperature × Time |
| Modified eccentricity | 1. Temperature × Time, 2. Time |
| Angle | 2. Temperature × Time |
| Equivalent diameter | 1. Temperature × Time, 2. Stress |
| Description | Model | Metric | Contour Perimeter | Contour Area | Convex Hull Perimeter | Convex Hull Area | Aspect Ratio | Elongation | Compactness | Solidity | Extent | Modified Eccentricity | Angle | Equivalent Diameter |
|---|---|---|---|---|---|---|---|---|---|---|---|---|---|---|
| Explanatory variable with a principal component | OLS | RMSE | 0.4372 | 2.4141 | 0.3967 | 3.9667 | 0.0029 | 0.0014 | 0.0050 | 0.0023 | 0.0019 | 0.0014 | 0.1434 | 0.1089 |
| 0.6454 | 0.5519 | 0.6447 | 0.5547 | 0.8413 | 0.7475 | 0.8098 | 0.8138 | 0.7691 | 0.7233 | 0.7885 | 0.6326 | |||
| GLM | RMSE | 0.4524 | 2.4401 | 0.4109 | 4.1864 | 0.0029 | 0.0013 | 0.0049 | 0.0022 | 0.0020 | 0.0014 | 0.1395 | 0.1119 | |
| BR | RMSE | 0.4384 | 2.4234 | 0.3975 | 3.9553 | 0.0029 | 0.0014 | 0.0050 | 0.0023 | 0.0019 | 0.0014 | 0.1431 | 0.1078 | |
| GPR | RMSE | 0.4276 | 2.3794 | 0.3907 | 3.9222 | 0.0028 | 0.0013 | 0.0048 | 0.0023 | 0.0019 | 0.0014 | 0.1365 | 0.1060 | |
| Explanatory variable with 2 features selected | OLS | RMSE | 0.3357 | 1.7710 | 0.3086 | 3.4469 | 0.0025 | 0.0007 | 0.0039 | 0.0018 | 0.0016 | 0.0006 | 0.0841 | 0.0830 |
| 0.7909 | 0.7588 | 0.7850 | 0.6637 | 0.8873 | 0.9411 | 0.8826 | 0.8898 | 0.8453 | 0.9588 | 0.9273 | 0.7862 | |||
| GLM | RMSE | 0.3357 | 1.7710 | 0.3086 | 3.4469 | 0.0025 | 0.0007 | 0.0039 | 0.0018 | 0.0016 | 0.0006 | 0.0841 | 0.0830 | |
| BR | RMSE | 0.3384 | 1.7292 | 0.3096 | 3.1504 | 0.0029 | 0.0014 | 0.0035 | 0.0022 | 0.0016 | 0.0012 | 0.0843 | 0.0821 | |
| GPR | RMSE | 0.2945 | 1.5739 | 0.2677 | 2.4181 | 0.0023 | 0.0008 | 0.0032 | 0.0014 | 0.0014 | 0.0005 | 0.0702 | 0.0765 |
| Model | Contour Perimeter | Contour Area | Convex Hull Perimeter | Convex Hull Area | Aspect Ratio | Elongation | Compactness | Solidity | Extent | Modified Eccentricity | Angle | Equivalent Diameter |
|---|---|---|---|---|---|---|---|---|---|---|---|---|
| OLS | 77% | 73% | 78% | 87% | 84% | 48% | 79% | 77% | 82% | 39% | 59% | 76% |
| GLM | 74% | 73% | 75% | 82% | 84% | 53% | 80% | 79% | 81% | 40% | 60% | 74% |
| BR | 77% | 71% | 78% | 80% | 100% | 104% | 70% | 95% | 82% | 87% | 59% | 76% |
| GPR | 69% | 66% | 69% | 62% | 80% | 59% | 65% | 63% | 71% | 36% | 51% | 72% |
| Model | Contour Perimeter | Contour Area | Convex Hull Perimeter | Convex Hull Area | Aspect Ratio | Elongation | Compactness | Solidity | Extent | Modified Eccentricity | Angle | Equivalent Diameter |
|---|---|---|---|---|---|---|---|---|---|---|---|---|
| OLS | 95% | 98% | 97% | 91% | 102% | 115% | 100% | 106% | 122% | 129% | 101% | 95% |
| GLM | 106% | 103% | 107% | 102% | 111% | 115% | 107% | 114% | 132% | 133% | 109% | 104% |
| BR | 96% | 99% | 96% | 90% | 101% | 116% | 99% | 106% | 123% | 128% | 102% | 94% |
| GPR | 96% | 101% | 98% | 95% | 102% | 116% | 100% | 109% | 125% | 129% | 104% | 94% |
| Model | Contour Perimeter | Contour Area | Convex Hull Perimeter | Convex Hull Area | Aspect Ratio | Elongation | Compactness | Solidity | Extent | Modified Eccentricity | Angle | Equivalent Diameter |
|---|---|---|---|---|---|---|---|---|---|---|---|---|
| OLS | 121% | 104% | 124% | 118% | 105% | 99% | 117% | 134% | 174% | 95% | 129% | 113% |
| GLM | 104% | 104% | 104% | 110% | 71% | 69% | 76% | 82% | 103% | 55% | 75% | 111% |
| BR | 123% | 102% | 124% | 105% | 114% | 78% | 100% | 113% | 126% | 84% | 129% | 111% |
| GPR | 116% | 89% | 117% | 85% | 157% | 128% | 123% | 136% | 184% | 128% | 123% | 109% |
| Model | Metric | Contour Perimeter | Contour Area | Convex Hull Perimeter | Convex Hull Area | Aspect Ratio | Elongation | Compactness | Solidity | Extent | Modified Eccentricity | Angle | Equivalent Diameter |
|---|---|---|---|---|---|---|---|---|---|---|---|---|---|
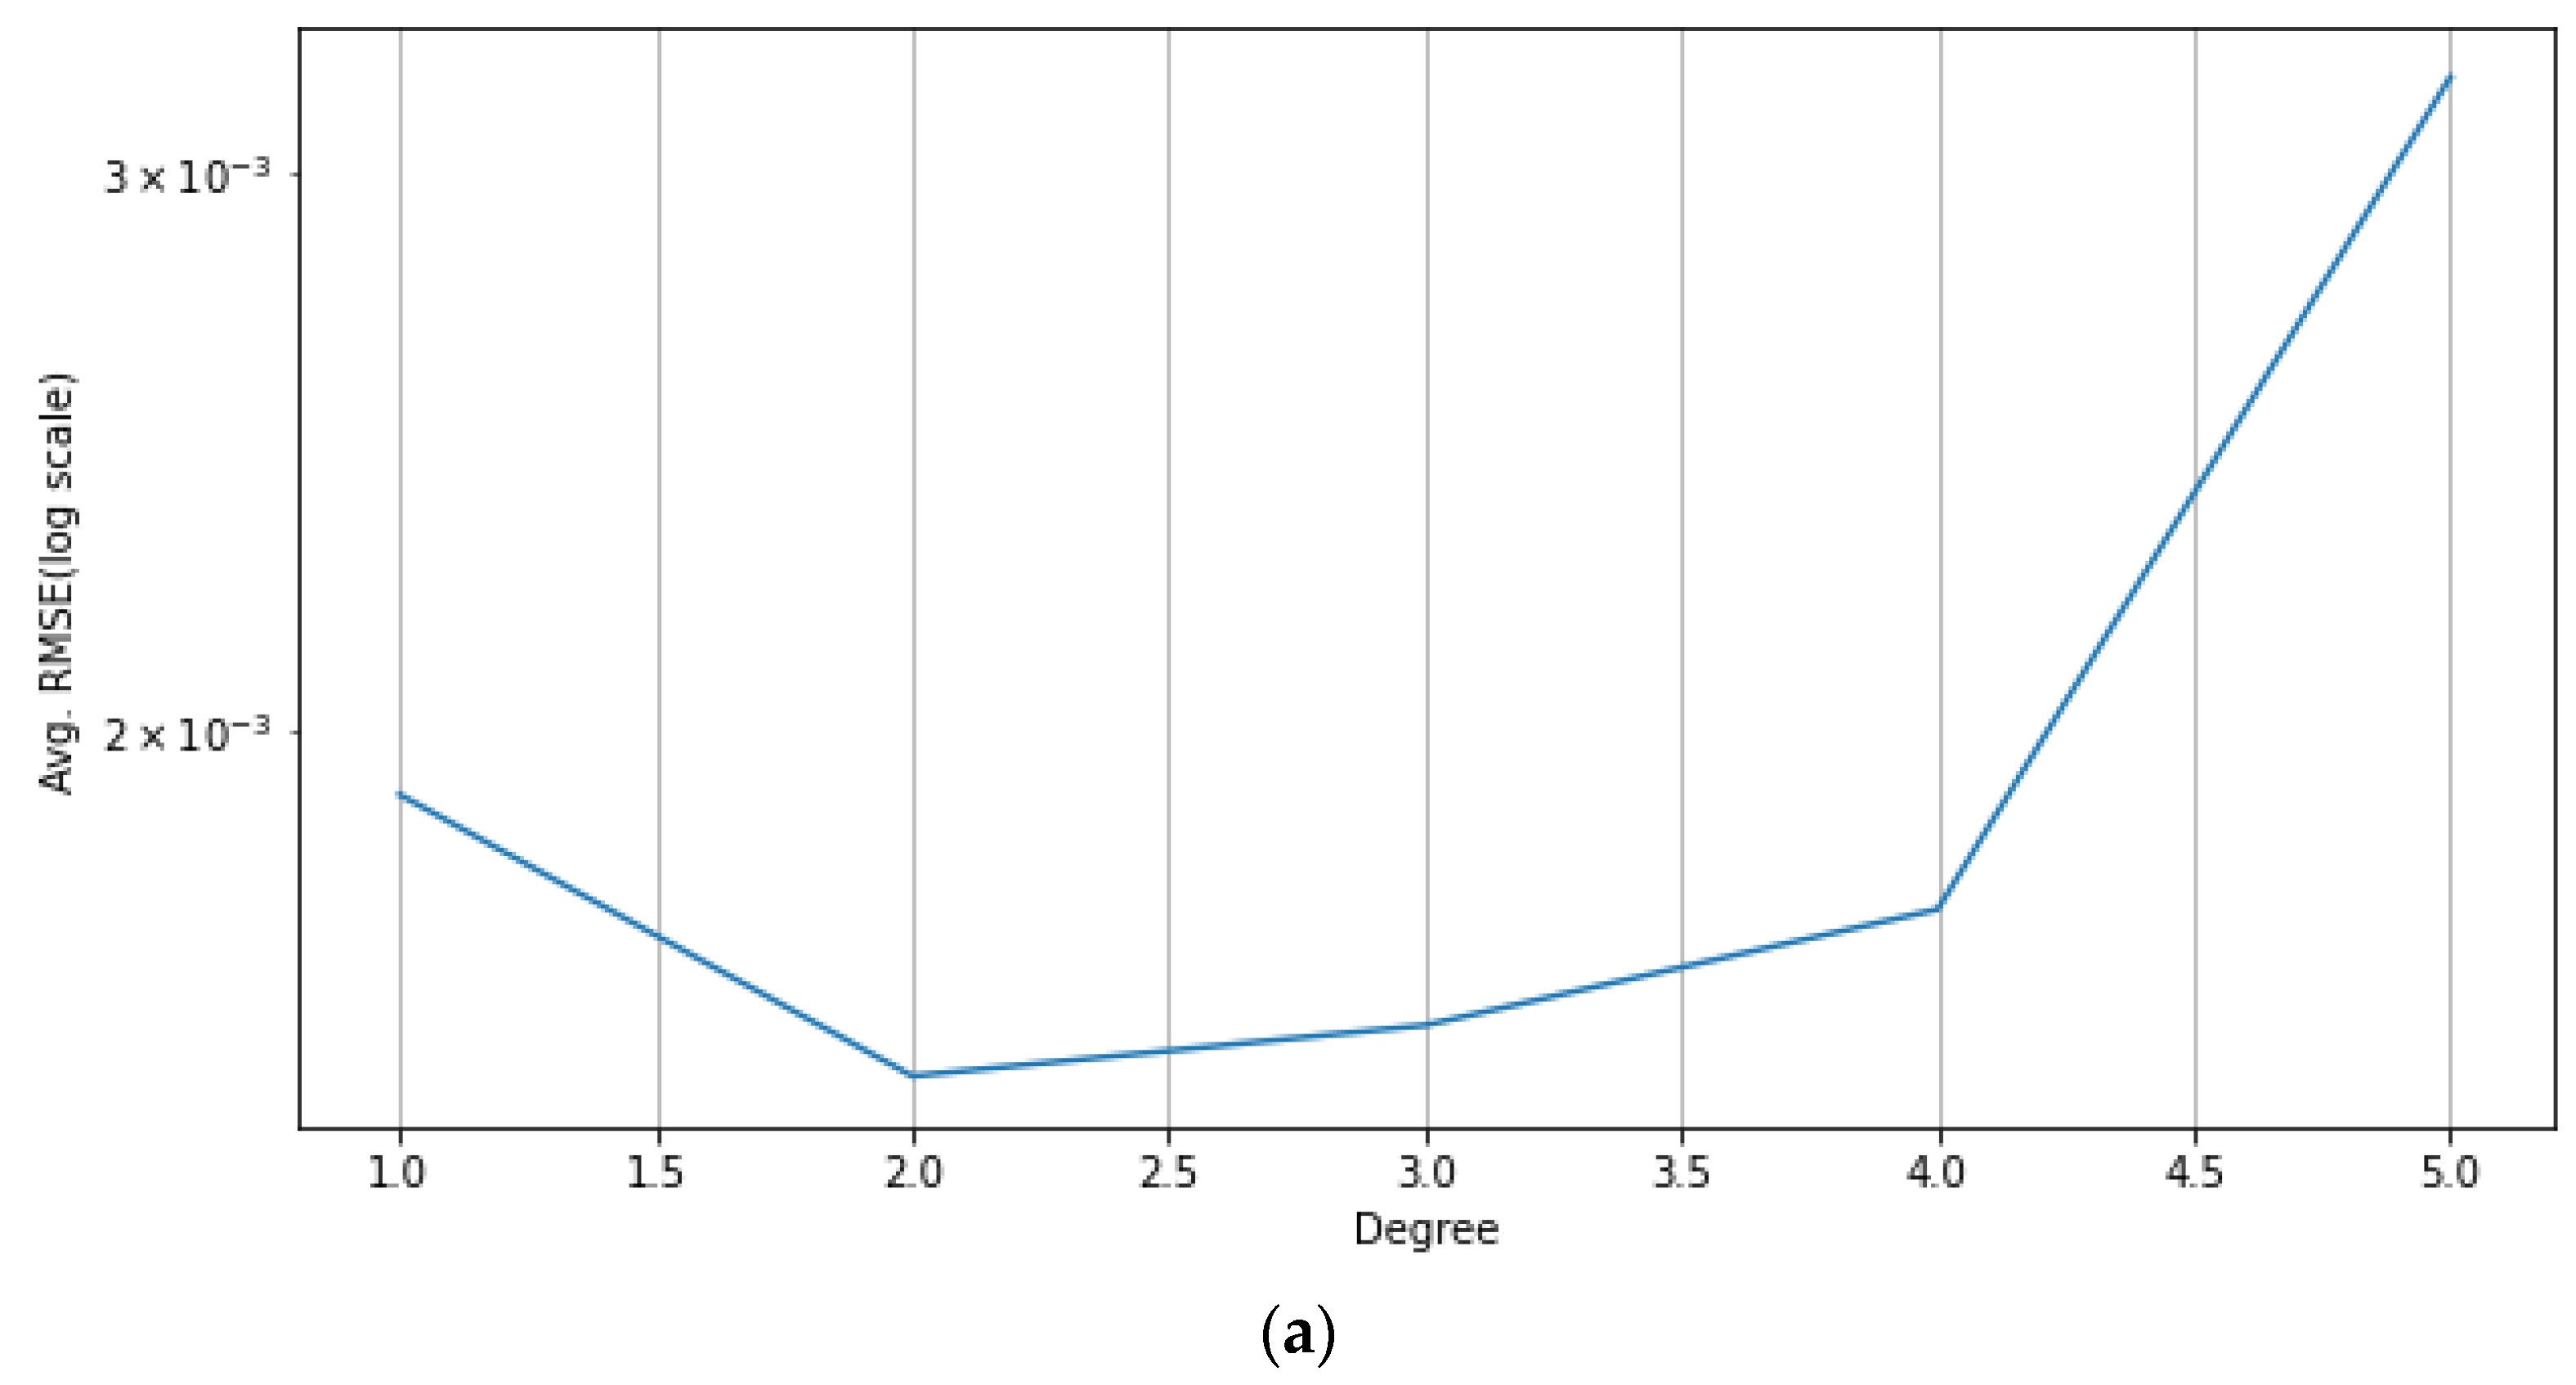
| Best Degree | 2 | 2 | 2 | 2 | 3 | 2 | 2 | 3 | 2 | 2 | 3 | 2 | |
| OLS | RMSE | 0.1189 | 0.1453 | 0.1193 | 0.1308 | 0.0747 | 0.1103 | 0.0908 | 0.0954 | 0.1077 | 0.1121 | 0.0812 | 0.1220 |
| 0.7310 | 0.5984 | 0.7293 | 0.6745 | 0.8939 | 0.7683 | 0.8432 | 0.8266 | 0.7792 | 0.7608 | 0.8746 | 0.7169 | ||
| GLM | RMSE | 0.1337 | 0.1564 | 0.1342 | 0.1439 | 0.0838 | 0.1231 | 0.1064 | 0.0934 | 0.1187 | 0.1275 | 0.0955 | 0.1360 |
| BR | RMSE | 0.1196 | 0.1452 | 0.1200 | 0.1304 | 0.1034 | 0.1419 | 0.1024 | 0.1154 | 0.1264 | 0.1363 | 0.0813 | 0.1220 |
| GPR | RMSE | 0.0976 | 0.1146 | 0.0970 | 0.0989 | 0.0680 | 0.0857 | 0.0825 | 0.0762 | 0.0924 | 0.0971 | 0.0807 | 0.1045 |
| Model | A PC with 12 Degradation Indices | A PC with the Top-5 Best Degradation Indices 1 |
|---|---|---|
| Best degree | 3 | 3 |
| OLS | 0.0890 | 0.0990 |
| GLM | 0.1065 | 0.1181 |
| BR | 0.0889 | 0.0985 |
| GPR | 0.0841 | 0.0946 |
| Model | PCA: All 1 | PCA: Top5 2 | Contour Perimeter | Contour Area | Convex Hull Perimeter | Convex Hull Area | Aspect Ratio | Elongation | Compactness | Solidity | Extent | Modified Eccentricity | Angle | Equivalent Diameter |
|---|---|---|---|---|---|---|---|---|---|---|---|---|---|---|
| OLS | 115% | 119% | 107% | 110% | 109% | 105% | 119% | 130% | 109% | 141% | 119% | 124% | 112% | 108% |
| GLM | 128% | 132% | 107% | 109% | 108% | 104% | 126% | 121% | 108% | 129% | 114% | 125% | 120% | 108% |
| BR | 115% | 119% | 108% | 111% | 109% | 105% | 109% | 116% | 109% | 99% | 104% | 116% | 112% | 109% |
| GPR | 100% | 100% | 100% | 100% | 100% | 100% | 100% | 100% | 99% | 99% | 99% | 100% | 100% | 100% |
Disclaimer/Publisher’s Note: The statements, opinions and data contained in all publications are solely those of the individual author(s) and contributor(s) and not of MDPI and/or the editor(s). MDPI and/or the editor(s) disclaim responsibility for any injury to people or property resulting from any ideas, methods, instructions or products referred to in the content. |
© 2023 by the authors. Licensee MDPI, Basel, Switzerland. This article is an open access article distributed under the terms and conditions of the Creative Commons Attribution (CC BY) license (https://creativecommons.org/licenses/by/4.0/).
Share and Cite
Yu, J.; Oh, H. AI-Based Degradation Index from the Microstructure Image and Life Prediction Models Based on Bayesian Inference. Sustainability 2023, 15, 7298. https://doi.org/10.3390/su15097298
Yu J, Oh H. AI-Based Degradation Index from the Microstructure Image and Life Prediction Models Based on Bayesian Inference. Sustainability. 2023; 15(9):7298. https://doi.org/10.3390/su15097298
Chicago/Turabian StyleYu, Junsang, and Hayoung Oh. 2023. "AI-Based Degradation Index from the Microstructure Image and Life Prediction Models Based on Bayesian Inference" Sustainability 15, no. 9: 7298. https://doi.org/10.3390/su15097298
APA StyleYu, J., & Oh, H. (2023). AI-Based Degradation Index from the Microstructure Image and Life Prediction Models Based on Bayesian Inference. Sustainability, 15(9), 7298. https://doi.org/10.3390/su15097298


