Article

An Eco-Driving Strategy Considering Phase-Switch-Based Bus Lane Sharing

Key Laboratory of Road and Traffic Engineering of the Ministry of Education, Tongji University, Shanghai 201804, China
*
Author to whom correspondence should be addressed.
Sustainability 2023, 15(9), 7330; https://doi.org/10.3390/su15097330
Submission received: 10 March 2023 / Revised: 18 April 2023 / Accepted: 20 April 2023 / Published: 28 April 2023
(This article belongs to the Section Energy Sustainability)

Abstract

:
Eco-driving is one of the most effective control strategies to enable energy management for urban traffic. However, the existing eco-driving strategies still have two shortcomings: (i) these strategies lack the consideration of lateral decision-making; (ii) their performance deteriorates when a controlled vehicle encounters traffic queues at a signalized intersection. To overcome these shortcomings, this paper proposes an innovative eco-driving strategy at intersection approach lanes consisting of the bus-priority lane (BPL) and general-purpose lanes (GPLs). The proposed strategy has the capability of lateral decision-making and allows ego connected and automated vehicles (CAV) to bypass the traffic queue. To enable this capability, the proposed strategy permits the ego CAV to change lanes and share the BPL. Both left-turning-movement CAVs and going-through-movement CAVs are allowed to share the BPL; i.e., the function of the BPL can be switched as per the phases of a traffic signal scheme. Through phase-switch-based bus lane sharing, the proposed eco-driving strategy aims to improve traffic efficiency and sustainability under the partially connected and automated traffic environment. To validate its effectiveness, the proposed strategy is evaluated against the non-control baseline and the state-of-the-art strategy. Sensitivity analysis is conducted under six different demand levels and five different CAV penetration rates. The results show that the proposed eco-driving strategy outperforms and has the benefits of fuel efficiency improvement, throughput improvement, and delay reduction.

1. Introduction

With the increasing utilization of automobiles, a considerable amount of fuel is consumed by vehicles each year. As reported in the United Nations Climate Change (UNCC) in 2014, vehicles as a main mode of transportation contribute significantly to energy consumption, accounting for 17.5% of global carbon emissions [1]. Such enormous fuel consumption in transportation would cause a series of severe problems, such as an energy crisis and environmental degradation. Especially in congested urban traffic areas, these problems are more serious due to frequent acceleration, deceleration, and idling. Therefore, an effective energy management strategy is critical for urban traffic operations.
Eco-driving, as one of the most effective strategies, is widely adopted to enable energy management for urban traffic. The main idea is to reduce acceleration, deceleration, and idling by adjusting driving behaviors. Eco-driving is an effective method of mitigating climate change such as global warming. Related research work has shown that 5–20% fuel efficiency can be reached by eco-driving [2]. Existing eco-driving strategies for urban traffic can be categorized into three kinds. The first kind of strategy focused on developing eco-driving training programs for drivers to master energy-efficient driving abilities [3,4,5,6,7,8]. The second kind of strategy focused on establishing eco-driving metrics to measure the energy efficiency and effectiveness of different eco-driving interventions [9,10,11,12,13]. The third kind of strategy focused on designing an eco-driving mechanism for controlling vehicles, which is the scope of this research. With the help of connected and automated vehicles (CAV) technology, this kind of strategy has been more effective in reducing energy consumption and exhaust emission. The reason for that is that this kind of strategy can control CAVs to accurately implement all eco-driving control commands. Based on the CAV technology, many eco-driving control strategies are proposed, including speed guidance, trajectory planning, etc. [14,15,16,17,18,19]. All these strategies demonstrate great potential for achieving energy efficiency improvement and exhaust emission abatement.
However, these control-based eco-driving strategies still have some shortcomings. Many existing strategies only focused on optimizing longitudinal trajectories for vehicles to achieve eco-driving [20]. The lack of consideration of lateral trajectories would make these strategies inapplicable. This is because lane changing is inevitable if vehicles can acquire efficiency improvement. To overcome this shortcoming, some strategies are proposed to achieve eco-driving by sharing special-purpose lanes, such as bus-priority lanes (BPLs) [21]. The BPL can grant priority to transit buses by separating transit buses from general vehicles. Since the frequency of transit buses is not always high, some eco-driving strategies allow general vehicles to share the BPL without interfering with transit buses [22]. Such bus lane sharing is essential because it can reduce road resource wastage on the BPL and achieve efficiency improvement for some general vehicles. However, this eco-driving strategy considering bus lane sharing still has a critical issue. Some previous research validated the effectiveness of such strategies in a simplified scenario, such as two lanes at intersections, a two-phase traffic signal, and some unsaturated traffic demand patterns [23,24]. The lack of consideration of turning-movement intentions of vehicles in bus lane sharing makes the strategy inapplicable and causes efficiency reduction at the signalized intersection.
To address the aforementioned issue, an innovative eco-driving strategy is proposed. Compared with existing works in the eco-driving area, this strategy innovatively considers a phase-switch-based bus lane sharing for partially connected and automated traffic at signalized intersections. It means that the strategy should allow vehicles with corresponding turning movements to share the BPL according to the current signal phase. The strategy bears the following features:
  • Allow phase-switch-based bus lane sharing for CAVs.
  • Improve traffic efficiency and sustainability in the partially connected and automated environment.
  • Be enabled under various demand patterns.
  • Ensure absolute bus priority while allowing CAVs to share the bus lane.
The remainder of this paper is structured as follows. Section 2 presents problem descriptions. Section 3 provides a step-by-step description of the logic of the proposed decision-making module and the formulation of the proposed controller. Section 4 describes the experiment design and associated results. Section 5 and Section 6 detail the conclusions and future works.

2. Problem Description

The scenario in this research is a signalized intersection under a partially connected and automated traffic environment. As shown in Figure 1, a control zone consists of two sections: Section 1 and Section 2. Section 1 contains three lanes, the topmost lane is for bus priority, namely the bus-priority lane (BPL). The other two lanes are for general purposes, namely the general-purpose lane (GPL). Due to the lane channelization for different turning movements, Section 2 contains four lanes. lane ① is BPL and lanes ②③④ are GPLs. Each GPL is dedicated to a special turning movement. All general vehicles run on the GPLs when they come into the road section. The general vehicles are composed of connected and automated vehicles (CAV) and connected and human-driven vehicles (CHV). All vehicles enable communication with other vehicles and the roadside unit via vehicle-to-vehicle (V2V) and vehicle-to-infrastructure (V2I) in real-time. CAVs can be controlled at a microscopic level. As for CHVs, they are driven by humans and move at their own will. The BPL is designed to ensure absolute bus priority and is open to CAVs if they have no interference with buses.
The task of this paper is to design an eco-driving strategy considering phase-switch-based bus lane sharing. The eco-driving strategy serves four purposes: (1) allow phase-switch-based bus lane sharing for CAVs; (2) improve efficiency and sustainability in the partially connected and automated environment; (3) be enabled under various demand patterns; (4) ensure absolute bus priority while allowing CAVs to share the BPL.

3. Eco-Driving Strategy

In this section, the logic of the proposed eco-driving strategy is introduced (Figure 2). The eco-driving strategy is designed for all CAVs in the control zone. The strategy has two crucial components: the eco-driving decision-making module and the phase-switch-based bus lane sharing controller (PBLSC). The eco-driving decision-making module collects global traffic information from vehicles and roadside units. Based on the global traffic information, this module determines whether CAVs should take lane-changing maneuvers or not. If the decision is lane-changing, the PBLSC is activated to optimize trajectories for CAVs from longitudinal and lateral dimensions. If the output trajectories are feasible, CAVs can be controlled to share the BPL and implement optimization plans. Otherwise, CAVs continue to run on the GPL. Some detailed information about these two components has been described in the following sections.

3.1. Eco-Driving Decision-Making

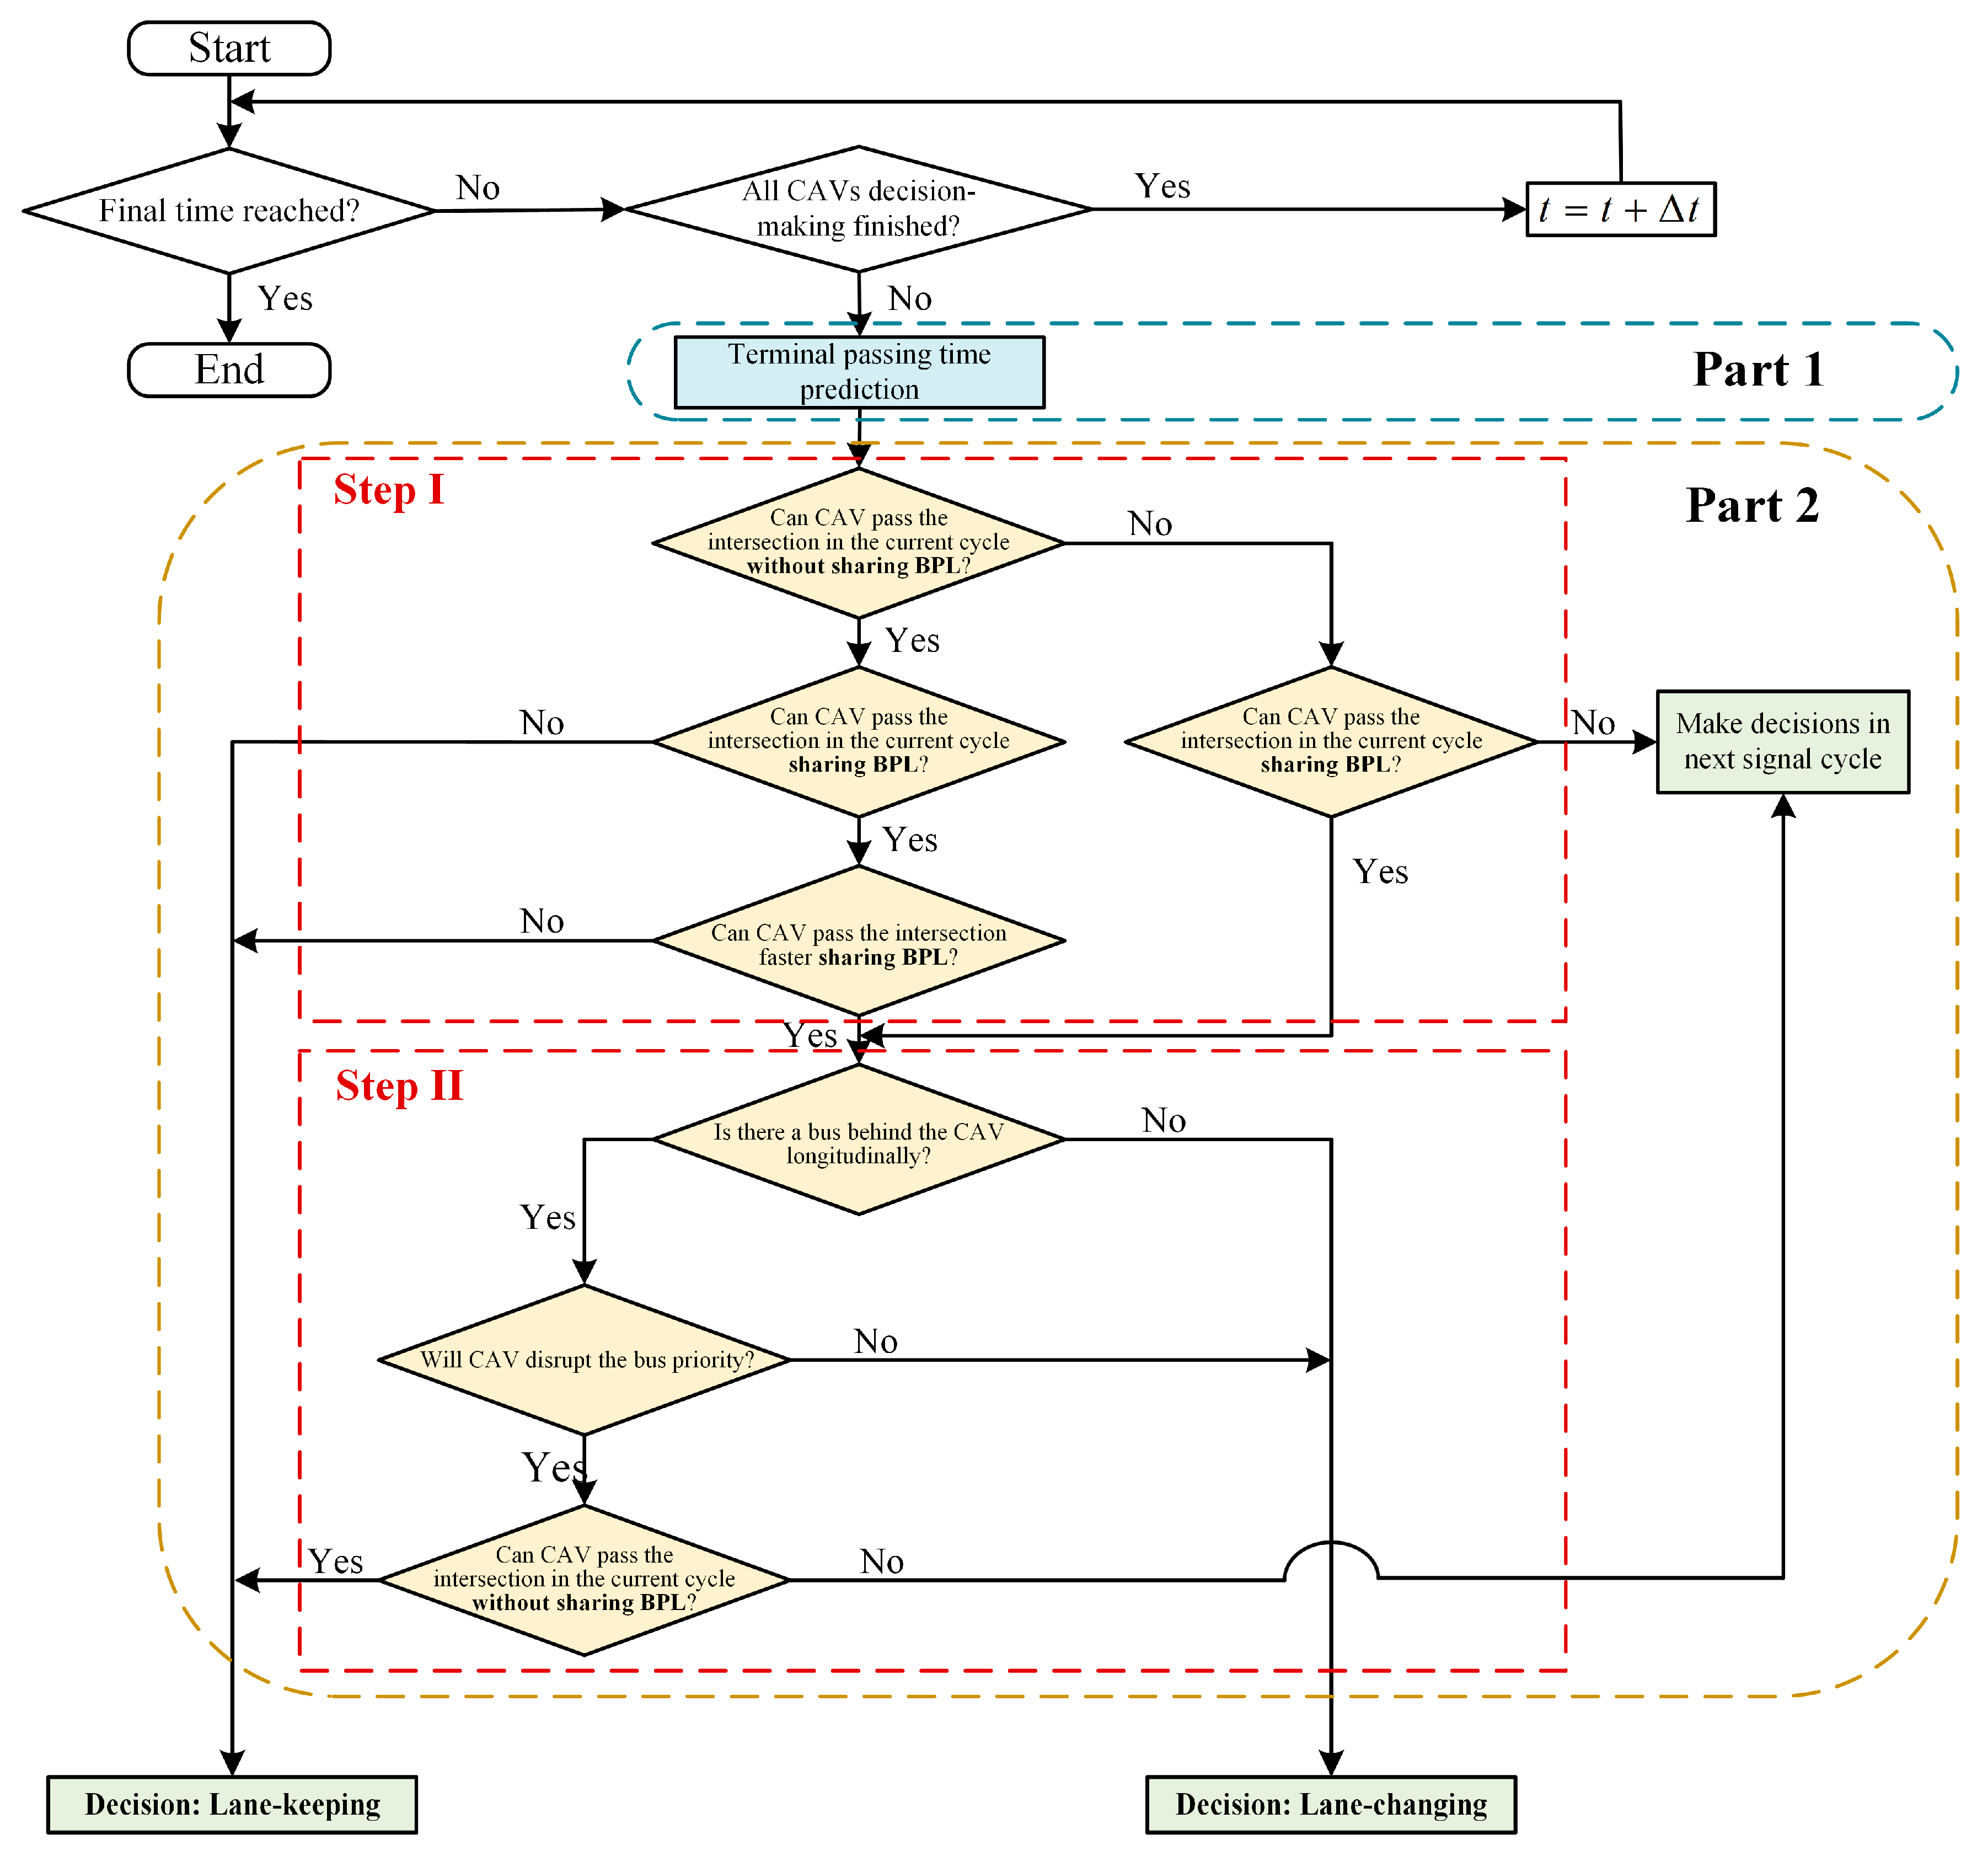
The structure of the eco-driving decision-making module is shown in Figure 3. The eco-driving decision-making module is activated at each time step. This module can be divided into two parts: terminal passing time prediction and lateral decision-making. The detailed description of each part is illustrated as follows.
Part 1. Terminal passing time prediction: This part is to predict the terminal passing time for each CAV in the control zone. It calculates the terminal passing time of CAVs under two circumstances. One is that CAVs always run on the GPLs to get through the signalized intersection. The other is that CAVs share the BPL to pass the signalized intersection. These results will be sent to part 2 for further decision-making. The detailed prediction method will be introduced in Section 3.2.
Part 2. Lateral decision-making: This part adopts a rule-based approach to determine whether CAVs should share the BPL or not. It can be divided into two steps: Step I and Step II. Step I is designed for CAVs to determine whether to share the BPL and which signal cycle to pass. Step II is designed for CAVs to judge if transit buses would be disrupted when CAVs share the BPL.

3.2. Terminal Passing Time Prediction

This section illustrates how to predict the terminal passing time for each CAV in the control zone. The inputs of this part include vehicle state information (position, speed, acceleration, turning-movement intention etc.), signal phase information, and timing information. The outputs contain two kinds of predicted terminal passing time. One corresponds to CAVs running on the GPL. The other corresponds to CAVs running on the BPL.
In this paper, this part selects a preceding vehicle that has the same turning-movement intention as the ego CAV from back to front. Such a selected preceding vehicle (SPV) is crucial for predicting the ego CAV’s terminal passing time. The reason is that vehicles with different turning-movement intentions would pass the intersection in different signal phases. Such impacts of different turning movements can be eliminated when they are running on the dedicated turning-movement lanes. Figure 4 illustrates the definition of the SPV under three circumstances. The selected area represents a hypothetical lane in front of the ego CAV c to select SPV. As shown in Figure 4a, the ego CAV c with a left-turning-movement intention is in the upstream section (Section 1). The selected area is divided into two parts according to the route of the left-turning movement. As shown in Figure 4b, the ego CAV c with a left-turning-movement intention is in the downstream section (Section 2), but not on the dedicated lane for left-turning movement. The selected area is the dedicated lane for left-turning movement in front of the ego CAV   c . The reason is that the ego CAV c must change lanes to a left-turning-movement dedicated lane to pass the intersection. For the ego CAV c with a going-through-movement intention, the selected area is shown in Figure 4c. Based on the selected area, the SPV of ego CAV c can be identified.

3.2.1. Terminal Passing Time on GPLs

For each ego CAV c with turning-movement intention i in the control zone, the terminal passing time t p c , i is formulated as follows:
t p c , i = max { t p c 1 , i + ( n + 1 ) · t h ,   t p e c , i } i { G T , L T , R T } , c C
where C denotes the set of ego CAVs index; i is the turning-movement intentions of CAVs; G T , L T , and R T , respectively, denote going-through movement, left-turning movement, and right-turning movement; t p c 1 , i is the terminal passing time of the SPV; t h represents the safety headway; n is the number of vehicles with different turning-movement intentions between ego CAV c and its SPV; t p e c , i is the earliest terminal passing time of ego CAV c with turning-movement intention i . Its value depends on whether ego CAV c can accelerate to the speed limit in the control zone. It is formulated as follows:
Case 1. Ego CAV c can reach the speed limit v l i m in the control zone.
t p e c , i = ( L x t s c , i S t s c , i ) / v l i m + ( v l i m v t s c , i ) / a m a x + t s i { G T , L T , R T } , c C
S t s c , i = ( v l i m 2 v t s c , i 2 ) / 2 a m a x i { G T , L T , R T } , c C
where t s denotes the current time step S t s c , i represents the distance required to accelerate to maximum speed, x t s c , i indicates the current position, and v t s c , i represents the current speed. L represents the length of the control zone and a m a x is the maximum acceleration.
Case 2. Ego CAV c can never reach the speed limit v l i m in control zone.
t p e c , i = ( v m a x c , i v t s c , i ) / a m a x i { G T , L T , R T } , c C    
v m a x c , i = 2 a m a x · ( L x t s c , i ) + v t s c , i 2 i { G T , L T , R T } , c C    
where v m a x c , i is the maximum speed ego CAV c can reach in the control zone.
The terminal passing time is affected by signal timing when vehicles approach the intersection because vehicles with different turning-movement intentions can only pass the intersection at the corresponding signal phase. According to whether ego CAV c can catch the current green light, there are two situations related to the calculation of t p c , i :
Situation 1. Ego CAV c can catch the green light in the current signal cycle.
t p c , i = { t p c , i i = G T , R t p c , i   mod   S R + G s t p c , i i = L T , R + G s t p c , i   mod   S R + G s + G l c C
S = R + G s + G l
where S denotes the length of a signal cycle, and R , G s , and G l are the duration of red light, going-through-movement green light, and left-turning-movement green light, respectively. In this situation, terminal passing time cannot be affected by multiple phases of signal timing.
Situation 2. Ego CAV c cannot catch the green light in the current signal cycle.
t p c , i = { t p c , i / S S + R + G s + t s i = L T , c = 1 , 0 t p c , i   mod   S R + G s t p c , i / S S + R + G s + t s i = L T , c > 1 , 0 ( t p c 1 , i + ( n + 1 ) t h )   mod   S R + G s t p c , i i = L T , c > 1 , R + G s ( t p c 1 , i + ( n + 1 ) t h )   mod   S S c C
t p c , i = { t p c , i / S S + R + t s i = G T , c = 1 , 0 t p c , i   mod   S R t p c , i / S S + R + t s i = G T , c = 1 , R + G s t p c , i   mod   S S t p c , i / S S + R + t s i = G T , c > 1 , 0 ( t p c 1 , i + ( n + 1 ) t h )   mod   S R t p c , i / S S + R + t s i = G T , c > 1 , R + G s ( t p c 1 , i + ( n + 1 ) t h )   mod   S S t p c , i i = G T , c > 1 , R ( t p c 1 , i + ( n + 1 ) t h )   mod   S R + G s c C
As for going-through-movement or left-turning-movement ego CAV c , c = 1 means it is the first vehicle in the selected area. Its terminal passing time is in the next passable duration. c > 1 means there are preceding vehicles. Whether ego CAV c and its preceding vehicle can enter the intersection in the same green phase is also considered in Equations (8) and (9).

3.2.2. Terminal Passing Time on BPL

For ego CAV c on BPL, the terminal passing time can be accurately calculated. The reason is that the trajectory information of the preceding vehicles and buses can be collected through V2I and V2V. The terminal passing time of ego CAV c on BPL can be calculated as follows:
t p c , i = max { t p c 1 , i + t h ,   t p e c , i } i { G T , L T } , i { G T , L T } , c C    
where i also represents the turning-movement intentions, and t p c 1 , i is the terminal passing time of the preceding CAV on BPL.

3.3. Phase-Switch-Based Bus Lane Sharing Controller

This section introduces a PBLSC method to optimize vehicle trajectories for CAVs which are allowed to share BPL. The PBLSC can help CAVs pass the intersection without stops and ensure absolute bus priority. The basic formulation of PBLSC is introduced sequentially.

3.3.1. Cost Function

The cost function to be minimized has two terms, including travel efficiency and fuel consumption:
J = J 1 + J 2
The first term denotes that the vehicles should pass the intersection as fast as possible to improve travel efficiency.
J 1 = α · ( | x t c , i L | + | v t c , i v l i m | ) i { G T , L T , R T } , c C ,   t T
where t is the time index and T is the set of time index before ego CAV c leave the intersection. x t c , i and v t c , i are the position and speed of ego CAV c at time t , respectively. Equation (12) has two parts, the first part is the distance between the position of the ego CAV c and the position of the stop bar. The second is the gap between the speed of ego CAV c and the speed limit. α is the weight of this part in the cost function. The second term denoting total fuel consumption is illustrated as follows:
J 2 = β · c t | a t c , i | i { G T , L T , R T } , c C ,   t T
where β is the weight of fuel consumption in Equation (13). a t c , i is the acceleration of ego CAV c at time t . | a t c , i | is used to describe the fuel consumption of ego CAV c at each time step.

3.3.2. Constraints

a
Vehicle kinematic constraints
The movement of vehicles has to be subject to kinematic constraints as described below.
v m i n v t c , i v l i m i { G T , L T , R T } , c C ,   t T
a m i n a t c , i a m a x i { G T , L T , R T } , c C ,   t T
v t c , i = v t 1 c , i + a t c , i Δ t i { G T , L T , R T } , c C ,   t T
x t c , i = x t 1 c , i + v t 1 c , i Δ t + 1 / 2 · a t c , i Δ t 2 i { G T , L T , R T } , c C ,   t T
Equation (14) means the speed of ego CAV c must be limited within the minimum and maximum allowed values ( v m i n , v l i m respectively). Equation (15) denotes that the acceleration and deceleration of ego CAV c must be in a feasible range. Equations (16) and (17) depict the vehicle dynamic constraints.
b
Vehicle conflict-free constraints
The ego CAV needs to fulfill the vehicle conflict-free constraints when conducting lane-changing to BPL. The following constraints ensure that vehicle trajectories are conflict-free.
x t c , i w t c + 1 , c · x t c + 1 , i + w t b , c · M l c + π · v t c + 1 , i i { G T , L T } , i { G T , L T } , t T , b B , c C
F t c 1 , c · x t c 1 , i x t c , i + F t b , c · M l c + π · v t c , i i { G T , L T } , i { G T , L T } , t T , b B , c C
x t c , i w t b , c · x t b , i + ( 1 w t b , c ) · M l b + π · v t b , i i { G T , L T } , i { G T , L T } , t T , b B , c C
  F t b , c · x t b , i x t c , i + ( 1 F t b , c ) · M l c + π · v t c , i i { G T , L T } , i { G T , L T } , t T , b B , c C
where M is a large positive real number, b is the bus index and B is the set of bus index, x t c + 1 , i and v t c + 1 , i are the position and speed of the following CAV behind ego CAV c at time t , respectively, x t b , i and v t b , i are the same circumstance for buses, F t b , c is introduced to decide whether the preceding vehicle of ego CAV c is bus b , F t b , c = 1 means bus b exists and x t b , i x t c , i , otherwise 0, w t b , c is introduced to decide whether the following vehicle of ego CAV c is bus b , w t b , c = 1 means bus b exists and x t b , i x t c , i , otherwise 0. w t c + 1 , c , F t c 1 , c are for the situation that the preceding or following vehicle is a CAV, l b , l c are the length of buses and the length of CAVs respectively, and π represents the average reaction time.
c
Lane-changing possibility constraints
The ego CAV must be subject to the lane-changing possibility constraints to get enough lane-changing space, the following constraints are imposed:
t p c , i F t c 1 , c · t p c 1 , i + F t b , c · t p b , i + ( F t c 1 , c + F t b , c ) · t h i { G T , L T } , i { G T , L T } , t T , b B , c C
t p c , i w t c + 1 , c · t p c + 1 , i + w t b , c · t p b , i ( w t c + 1 , c + w t b , c ) · t h + ( 1 w t c + 1 , c w t b , c ) · M i { G T , L T } , i { G T , L T } , t T , b B , c C
where t p b , i means the terminal passing time of bus b . Equations (22) and (23) guarantee the existence of lane-changing space on the BPL. Furthermore, they also ensure that the ego CAV will not affect the trajectories of the preceding and following vehicles while passing the intersection.
d
Preceding and following vehicles’ type constraints
The following constraints are imposed:
w t c + 1 , c + w t b , c 1 t T , b B , c C
F t c 1 , c + F t b , c 1 t T , b B , c C
Equation (24) means the following vehicle of ego CAV c can only be a bus or a CAV, or does not exist. The same situation also applies to Equation (25).

4. Evaluation

In this section, the proposed eco-driving strategy is evaluated through simulation experiments compared with the non-control baseline and the state-of-the-art strategy. The simulation experiments select throughput, delay, and fuel consumption as the measurements of effectiveness. The simulation experiments are conducted under six different congestion levels and five different CAV Penetration Rates. The goal is to fairly confirm the benefits of the proposed eco-driving strategy while ensuring absolute bus priority.

4.1. Experiment Design

4.1.1. Testbed

The testbed of the simulation experiment is presented in Figure 5. In the testbed, the road network with a signalized intersection is composed of two sections. The length of Section 1 is 350 m and the length of Section 2 is 150 m. One lane is the bus-priority lane (BPL) and the others are general-purpose lanes (GPL). Beside it, the roadside unit enabling V2I communication with vehicles is built. All vehicles enable communication via V2V. The simulation platform is based on PTV-VISSIM because PTV-VISSIM has a high simulation speed and a user-friendly GUI.

4.1.2. Scenario

Three scenarios considering absolute bus priority are tested:
  • Non-control baseline: In this scenario, all vehicles are human-driven vehicles. All general traffic can only run on the GPLs.
  • State-of-the-art strategy: In this scenario, general traffic is composed of CAVs and CHVs. The BPL is only open to CAVs with going-through-movement intentions. All CAVs sharing the BPL cannot cause interference with buses. This strategy enables single-phase-based bus lane sharing [22].
  • The proposed strategy: In this scenario, general traffic is composed of CAVs and CHVs. The BPL is open to CAVs with going-through-movement intentions and left-turning-movement intentions. All CAVs sharing the BPL cannot cause interference with buses. The proposed strategy enables phase-switch-based bus lane sharing.

4.1.3. Measurement of Effectiveness

To investigate the effectiveness of the proposed strategy, three Measurements of Effectiveness (MOE) are selected, including the surrogate of fuel consumption, throughput, and delay. The surrogate of fuel consumption, as one of the MOEs, is defined as follows:
F u e l   c o n s u m p t i o n = t c | a t c , i | / t m t t T , c C
where m t denotes the number of vehicles in each time step t . To validate the credibility of ensuring absolute bus priority, this paper adopts speed error as an evaluation index. This evaluation index represents the deviation between the actual speed and desired speed of buses. It is defined as follows:
s p e e d   e r r o r = ( | a c t u a l   s p e e d d e s i r e d   s p e e d | / d e s i r e d   s p e e d ) × 100 %

4.1.4. Simulation Settings

The parameters in the simulation experiment are shown in Table 1.

4.1.5. Sensitivity Analysis

To fairly confirm the validation of the proposed strategy, sensitivity analysis is conducted under six different congestion levels (0.6, 0.8, 1.0, 1.2, 1.4, and 1.6) and five different CAV penetration rates (10%, 25%, 50%, 75%, and 90%). The saturation flow rate has been calibrated due to the traffic signal, as shown in Table 1. Unlike the freeway, the factor that vehicles can only get through the signalized intersection during the green time should be taken into consideration. Hence, the congestion level of the signalized intersection has to be calibrated by the parameters of the signal plan.

4.2. Results

The simulation results are presented in this section. The results have confirmed that the proposed strategy has full advantages through comparison against the non-control baseline and the state-of-the-art strategy. The advantages of the proposed strategy can be observed in fuel efficiency improvement, throughput improvement, and delay reduction. Furthermore, the credibility of ensuring absolute bus priority has been validated.

4.2.1. Fuel Efficiency Improvement Validation

Sensitive Analysis at Various CAV Penetration Rates

(1) 
Compared with Non-control Baseline
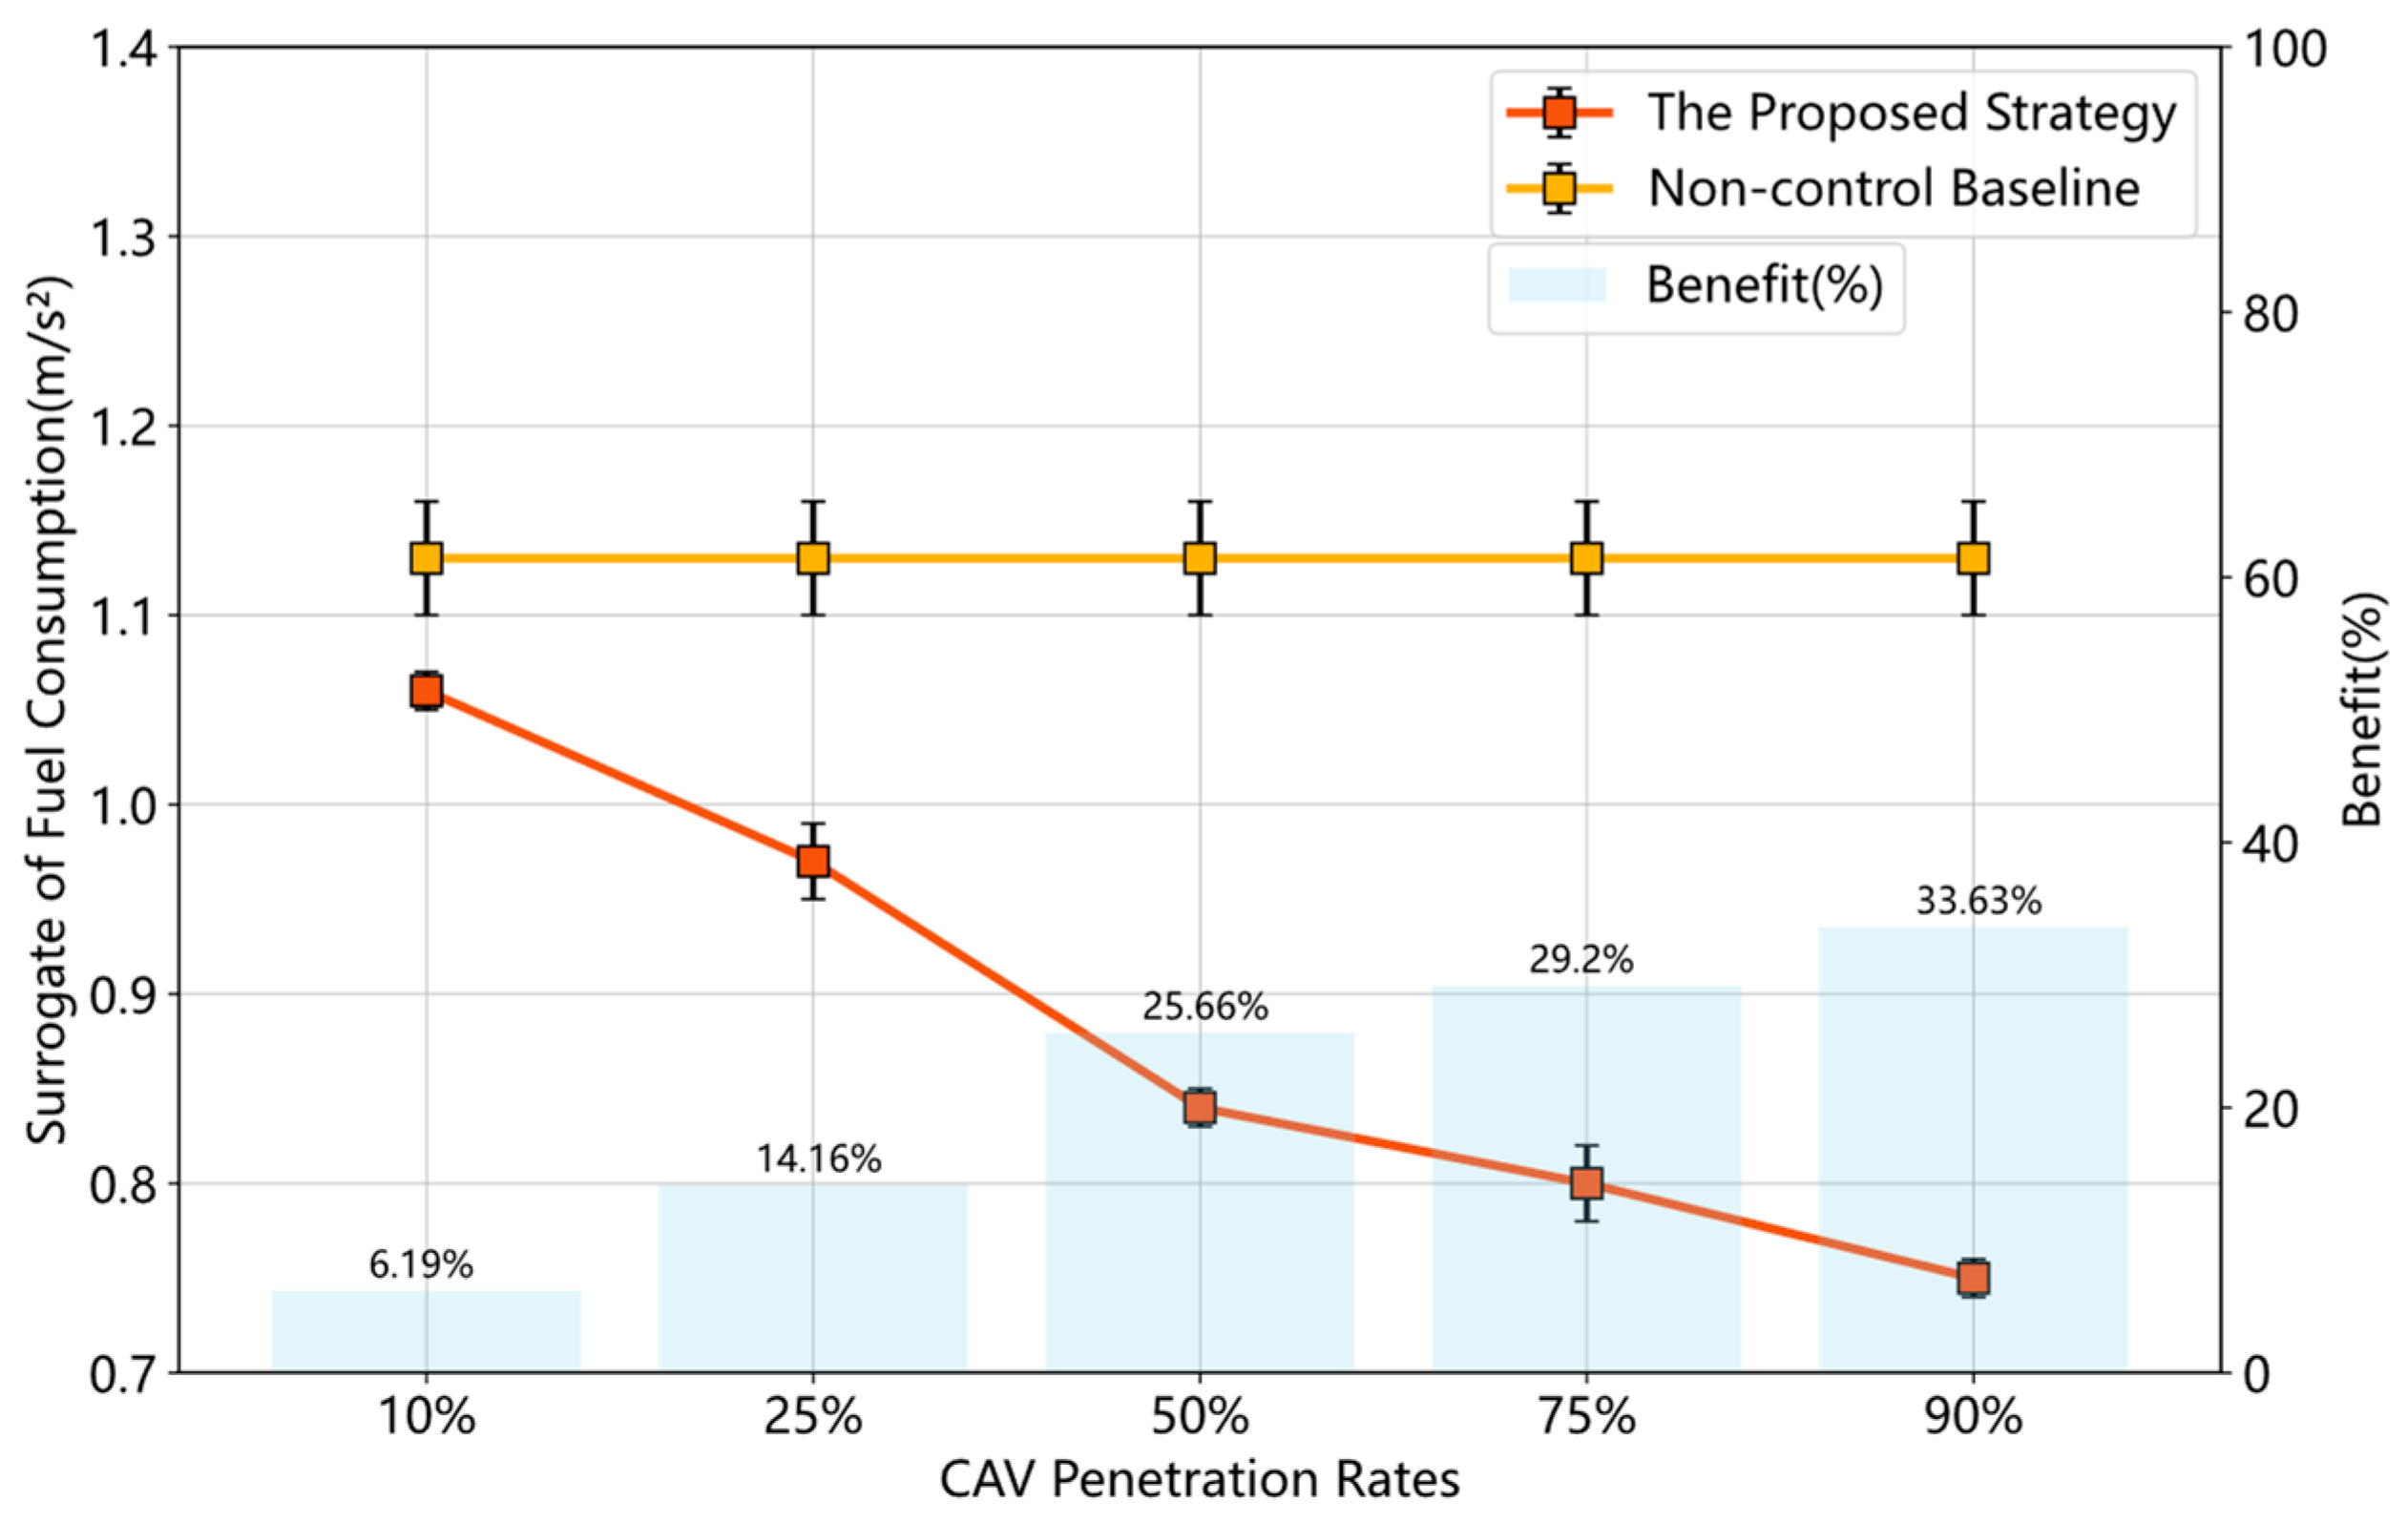
Figure 6 shows the results of the fuel consumption comparison under various CAV penetration rates (CPR) (demand level = 1.6). Compared to the non-control baseline, the proposed strategy has the benefit of fuel efficiency improvement. Such a benefit grows with CPR. To be noted, the proposed strategy can save up to 33.63% of fuel consumption when the CPR is 90%. The reason is that the proposed strategy can control CAVs to avoid frequent stop-and-go when approaching the signalized intersection.
(2) 
Compared with the State-of-the-art Strategy
Figure 7 shows the fuel consumption comparison result between the state-of-the-art strategy and the proposed strategy under various CPR. Compared with the state-of-the-art strategy, more benefits of fuel efficiency can be achieved with the proposed strategy. When the CPR is 50%, the proposed strategy could save fuel by up to 15.15%. The reason is that the proposed strategy makes more CAVs approach the intersection smoothly by allowing them to achieve phase-switch-based bus lane sharing. Such phase-switch-based bus lane sharing makes CAVs pass the intersection without frequent acceleration and deceleration.

Sensitive Analysis at Various Demand Levels

(1) 
Compared with Non-control Baseline
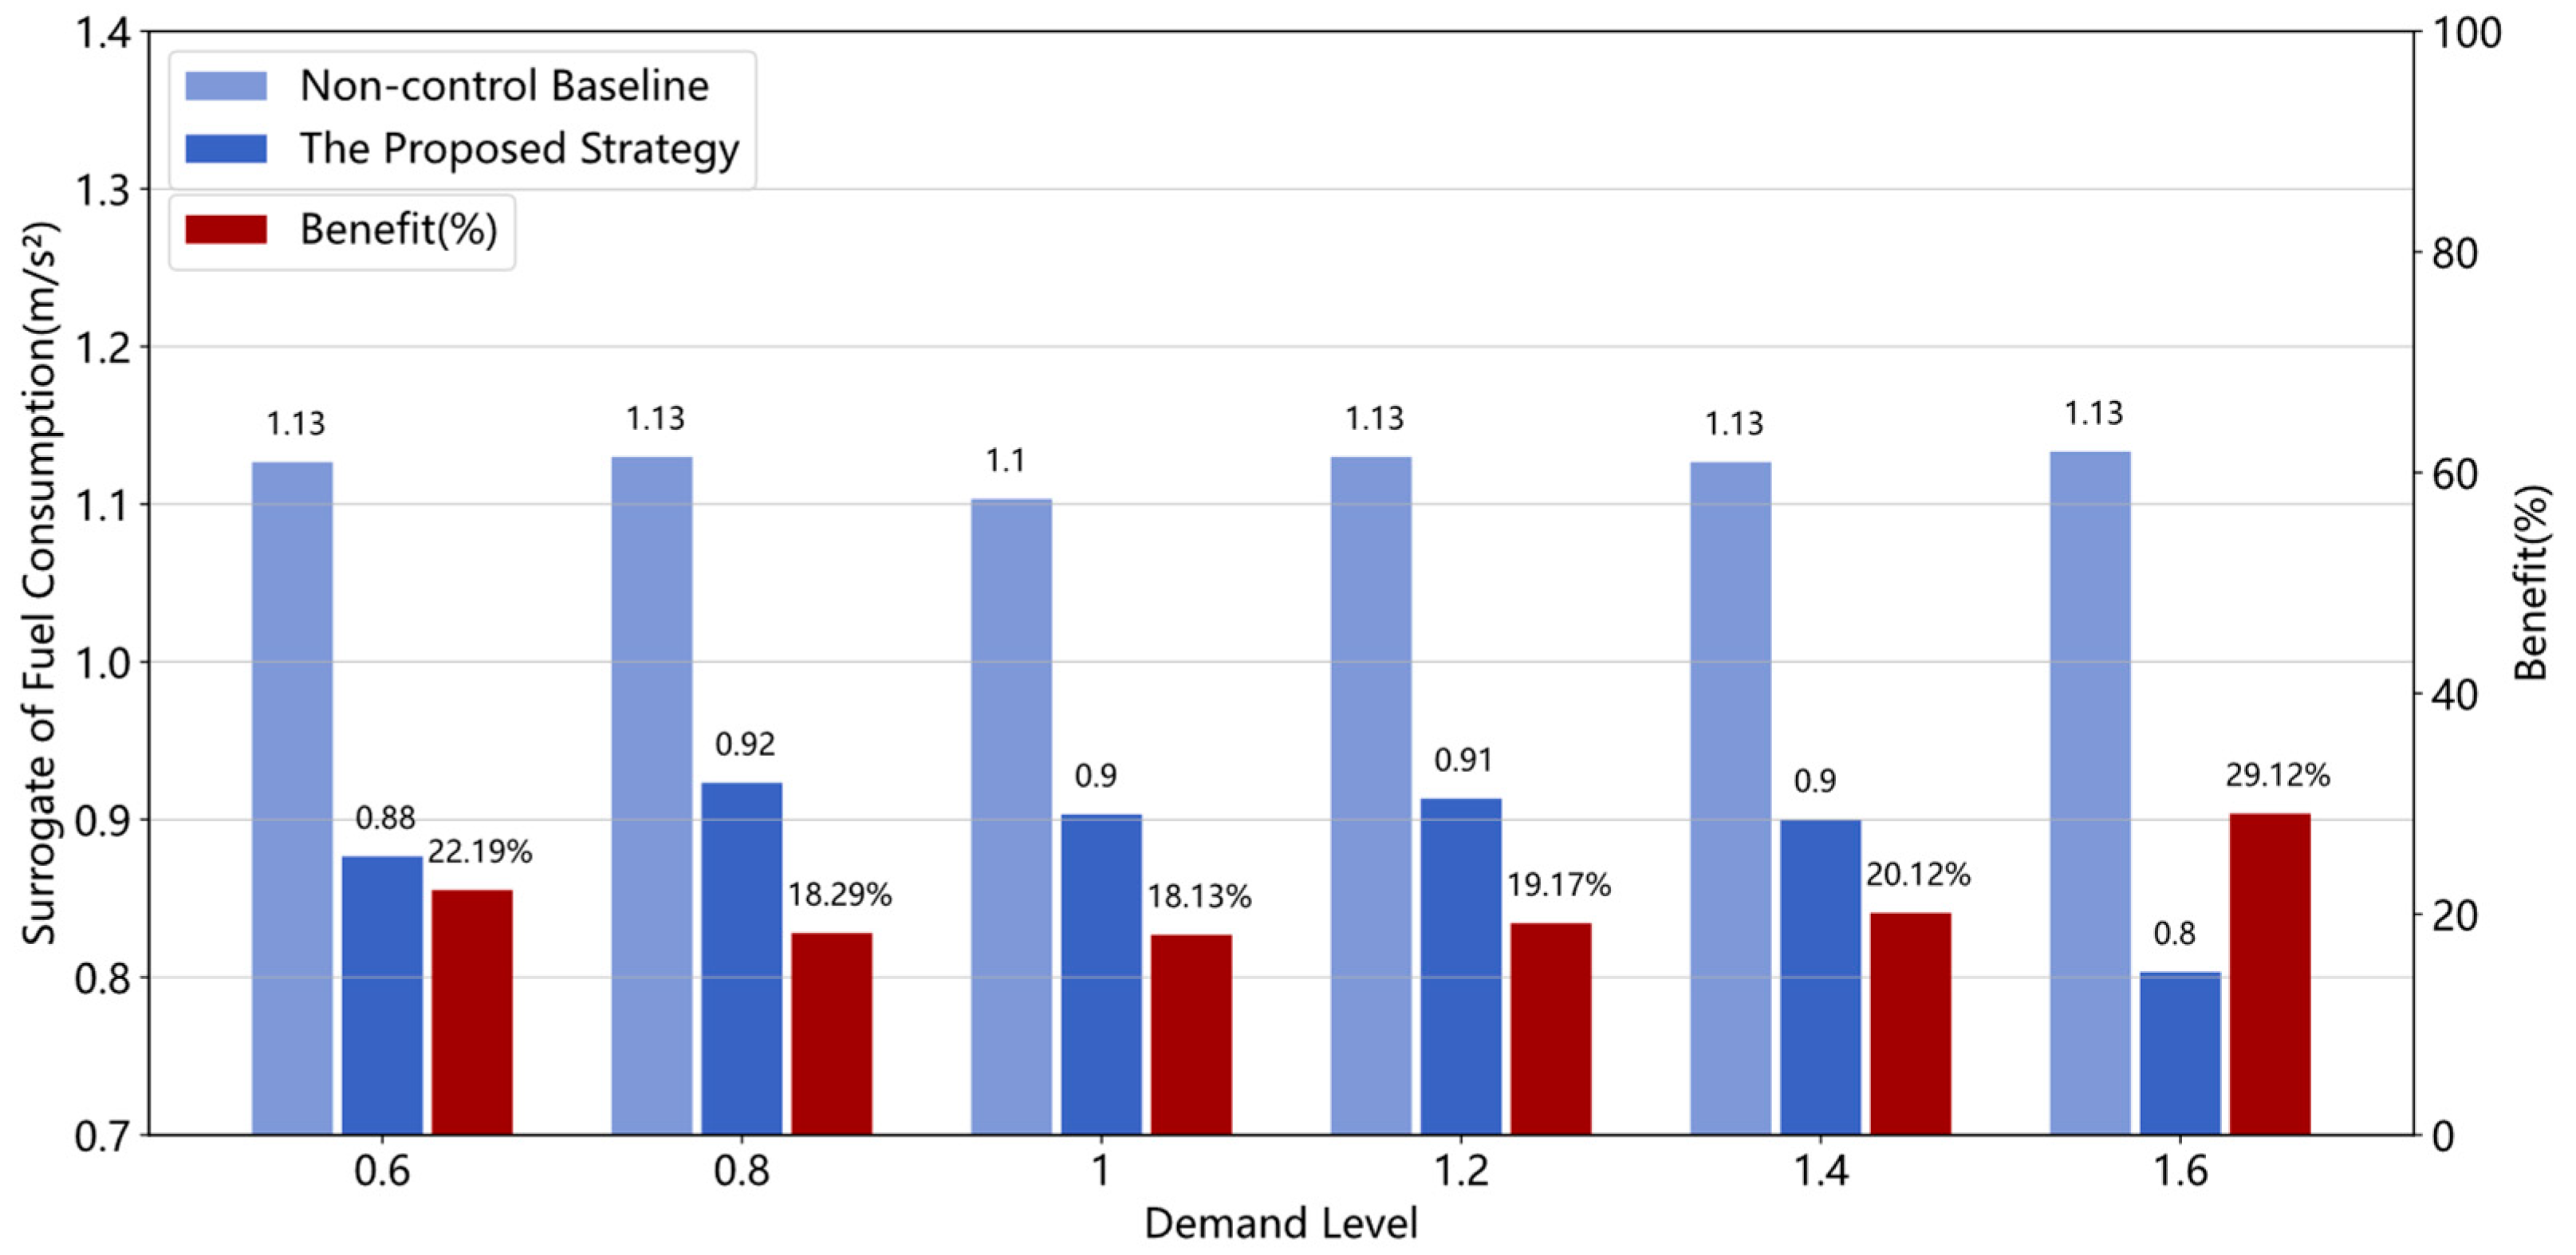
Figure 8 shows the result of the fuel consumption comparison between the non-control baseline and the proposed strategy under various demand levels (CPR = 75%). The results reveal that the proposed strategy has the benefit of fuel efficiency improvement compared to the non-control baseline. Such benefits grow with the demand levels. Especially under oversaturated conditions (demand level = 1.6), the proposed strategy can save fuel by up to 29.12%. The reason is that frequent acceleration and deceleration can be avoided by bus lane sharing and optimal control for CAVs.
(2) 
Compared with the State-of-the-art Strategy
Figure 9 shows the result of the fuel consumption comparison between the state-of-the-art strategy and the proposed strategy under various demand levels (CPR = 75%). Compared to the state-of-the-art strategy, the benefits of fuel efficiency improvement are achieved by the proposed strategy. The fuel consumption can be saved up to 11.07% when the demand level is 1.6. The reason for that is the proposed strategy allows more CAVs to share the BPL through phase-switch-based bus lane sharing. Such phase-switch-based bus lane sharing can reduce the frequent acceleration and deceleration caused by severe congestion on the GPLs.

4.2.2. Traffic Efficiency Improvement Validation

Sensitive Analysis at Various CAV Penetration Rates

(1) 
Compared with Non-control Baseline
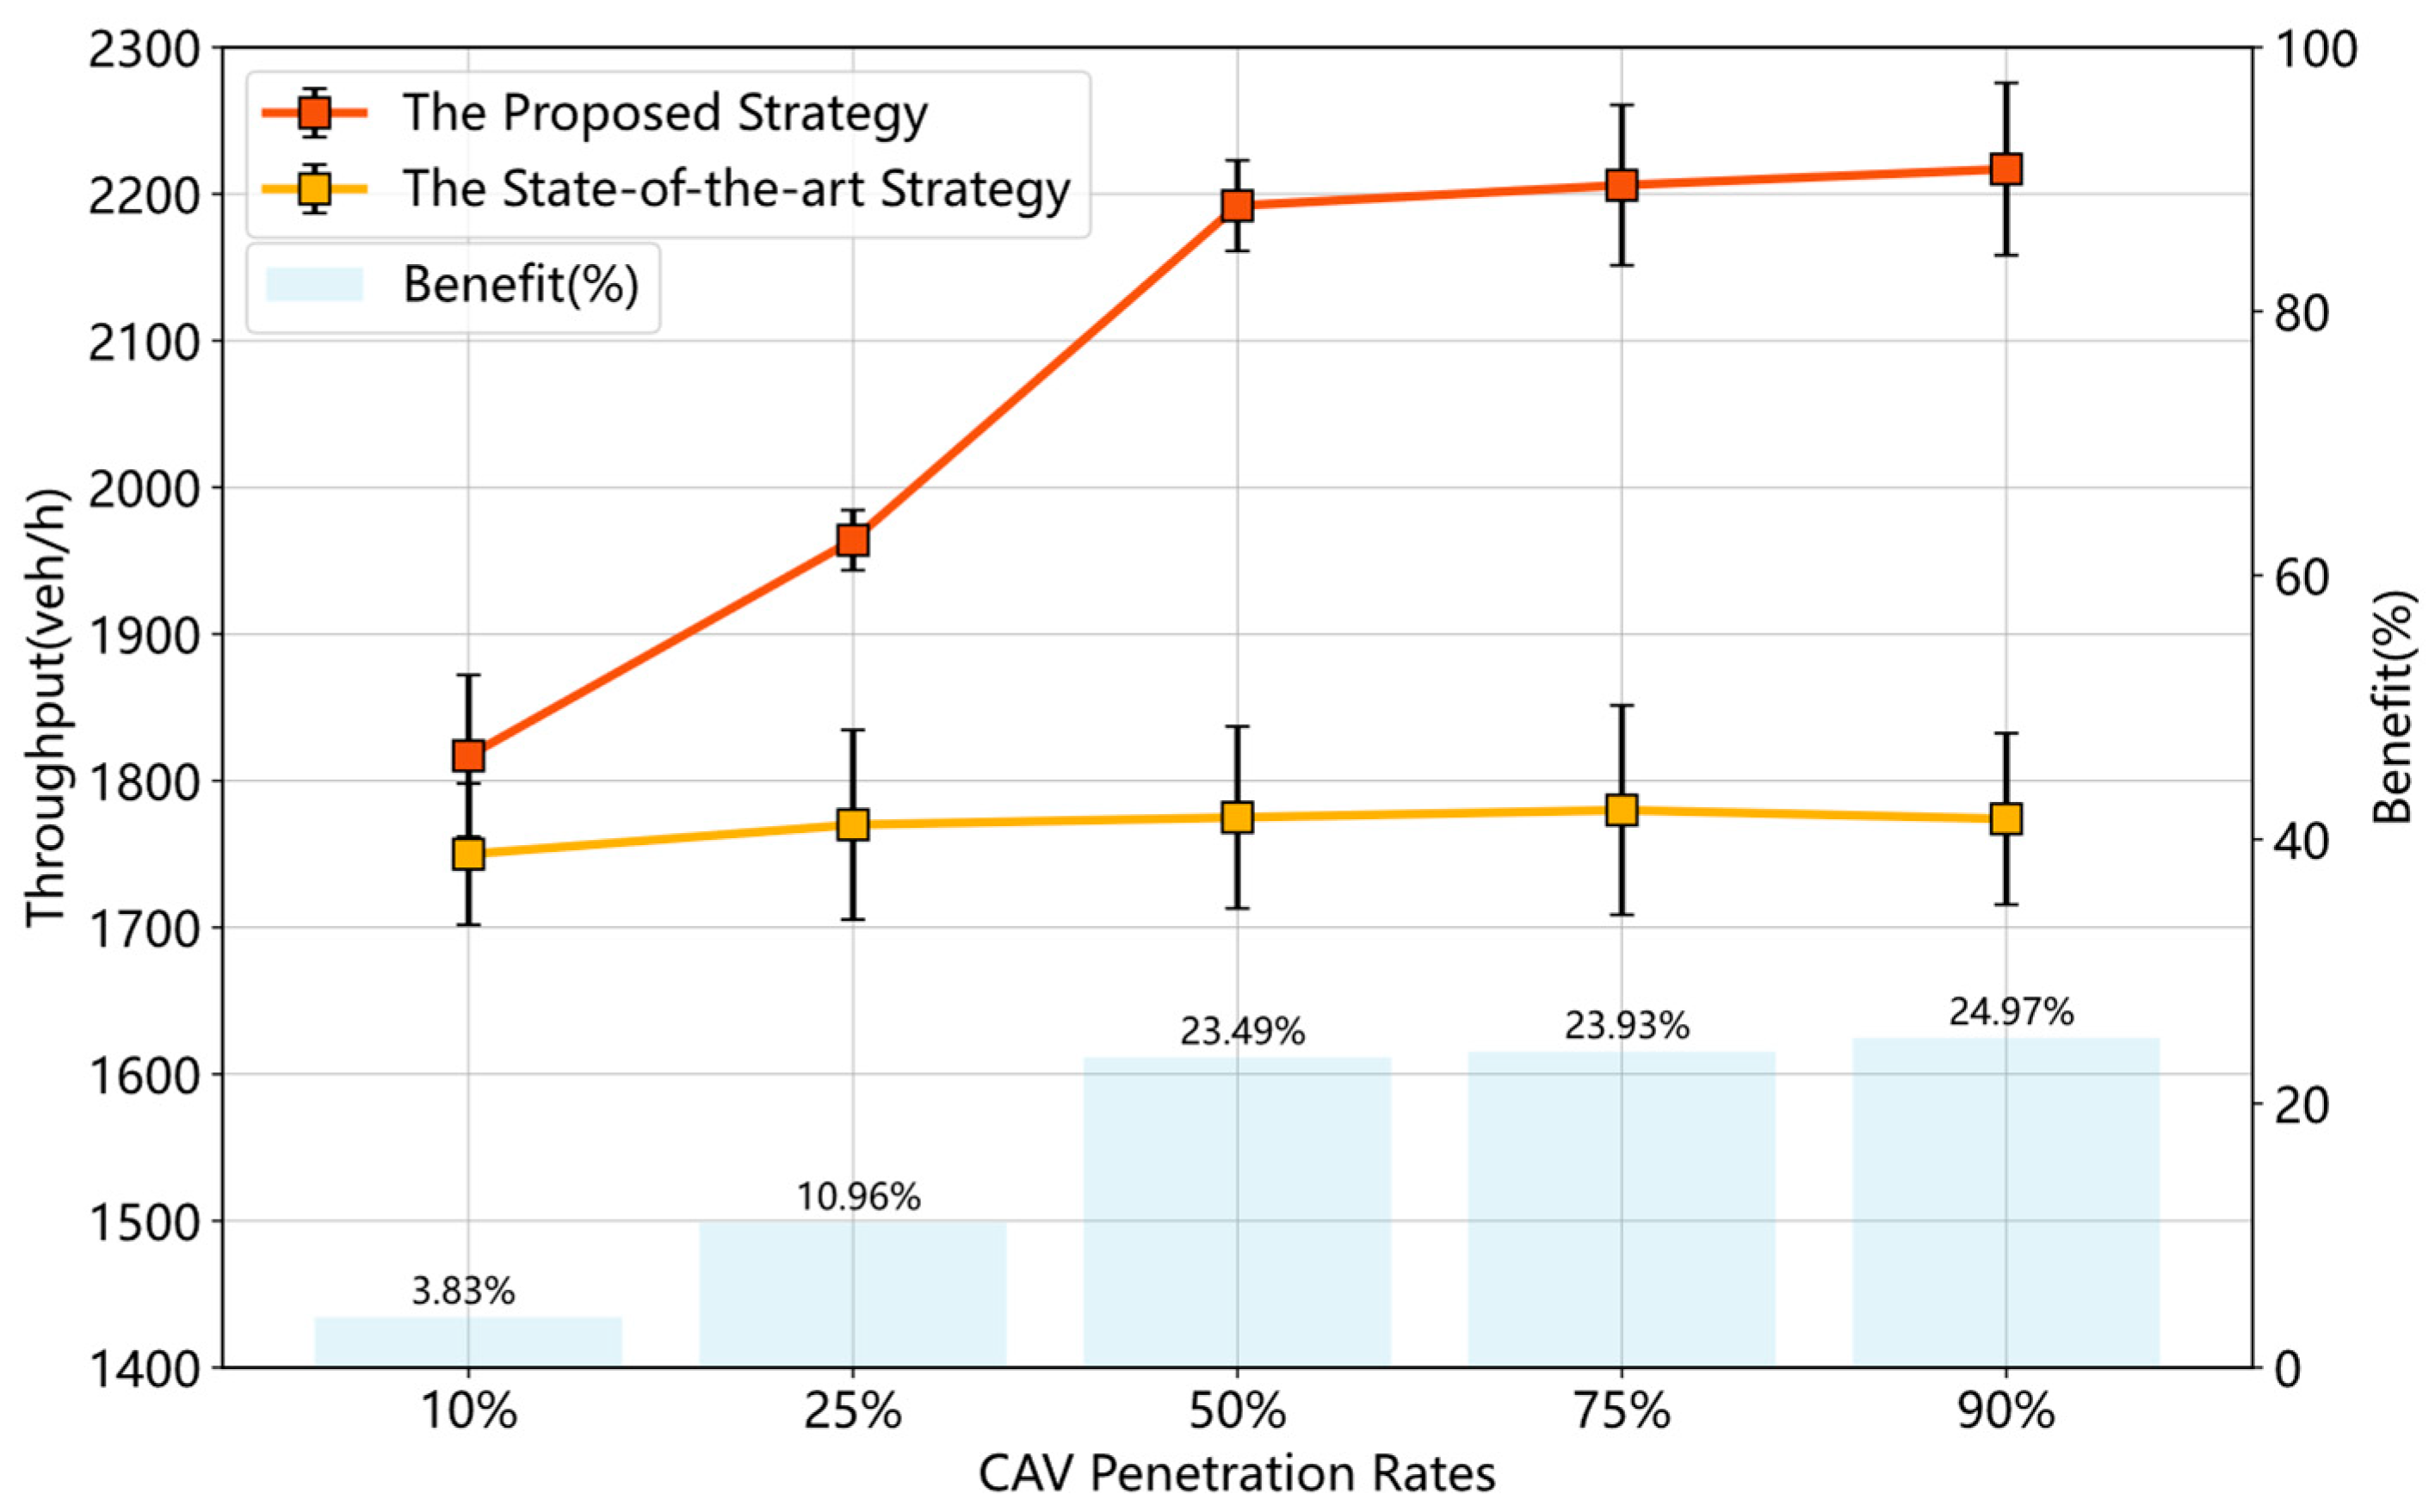
Figure 10 shows the result of the throughput comparison between the non-control baseline and the proposed strategy under various CPR (demand level = 1.6). The benefits of throughput improvement increases from 9.46% to 32.05% when the CPR ranges from 10% to 25%. When the CPR is 50% or over, significant benefits of throughput improvement can be observed. However, no obvious benefits of throughput improvement can be achieved when the CPR is more than 50%. It makes sense that there is no more available space for CAVs to share the BPL when the CPR is high.
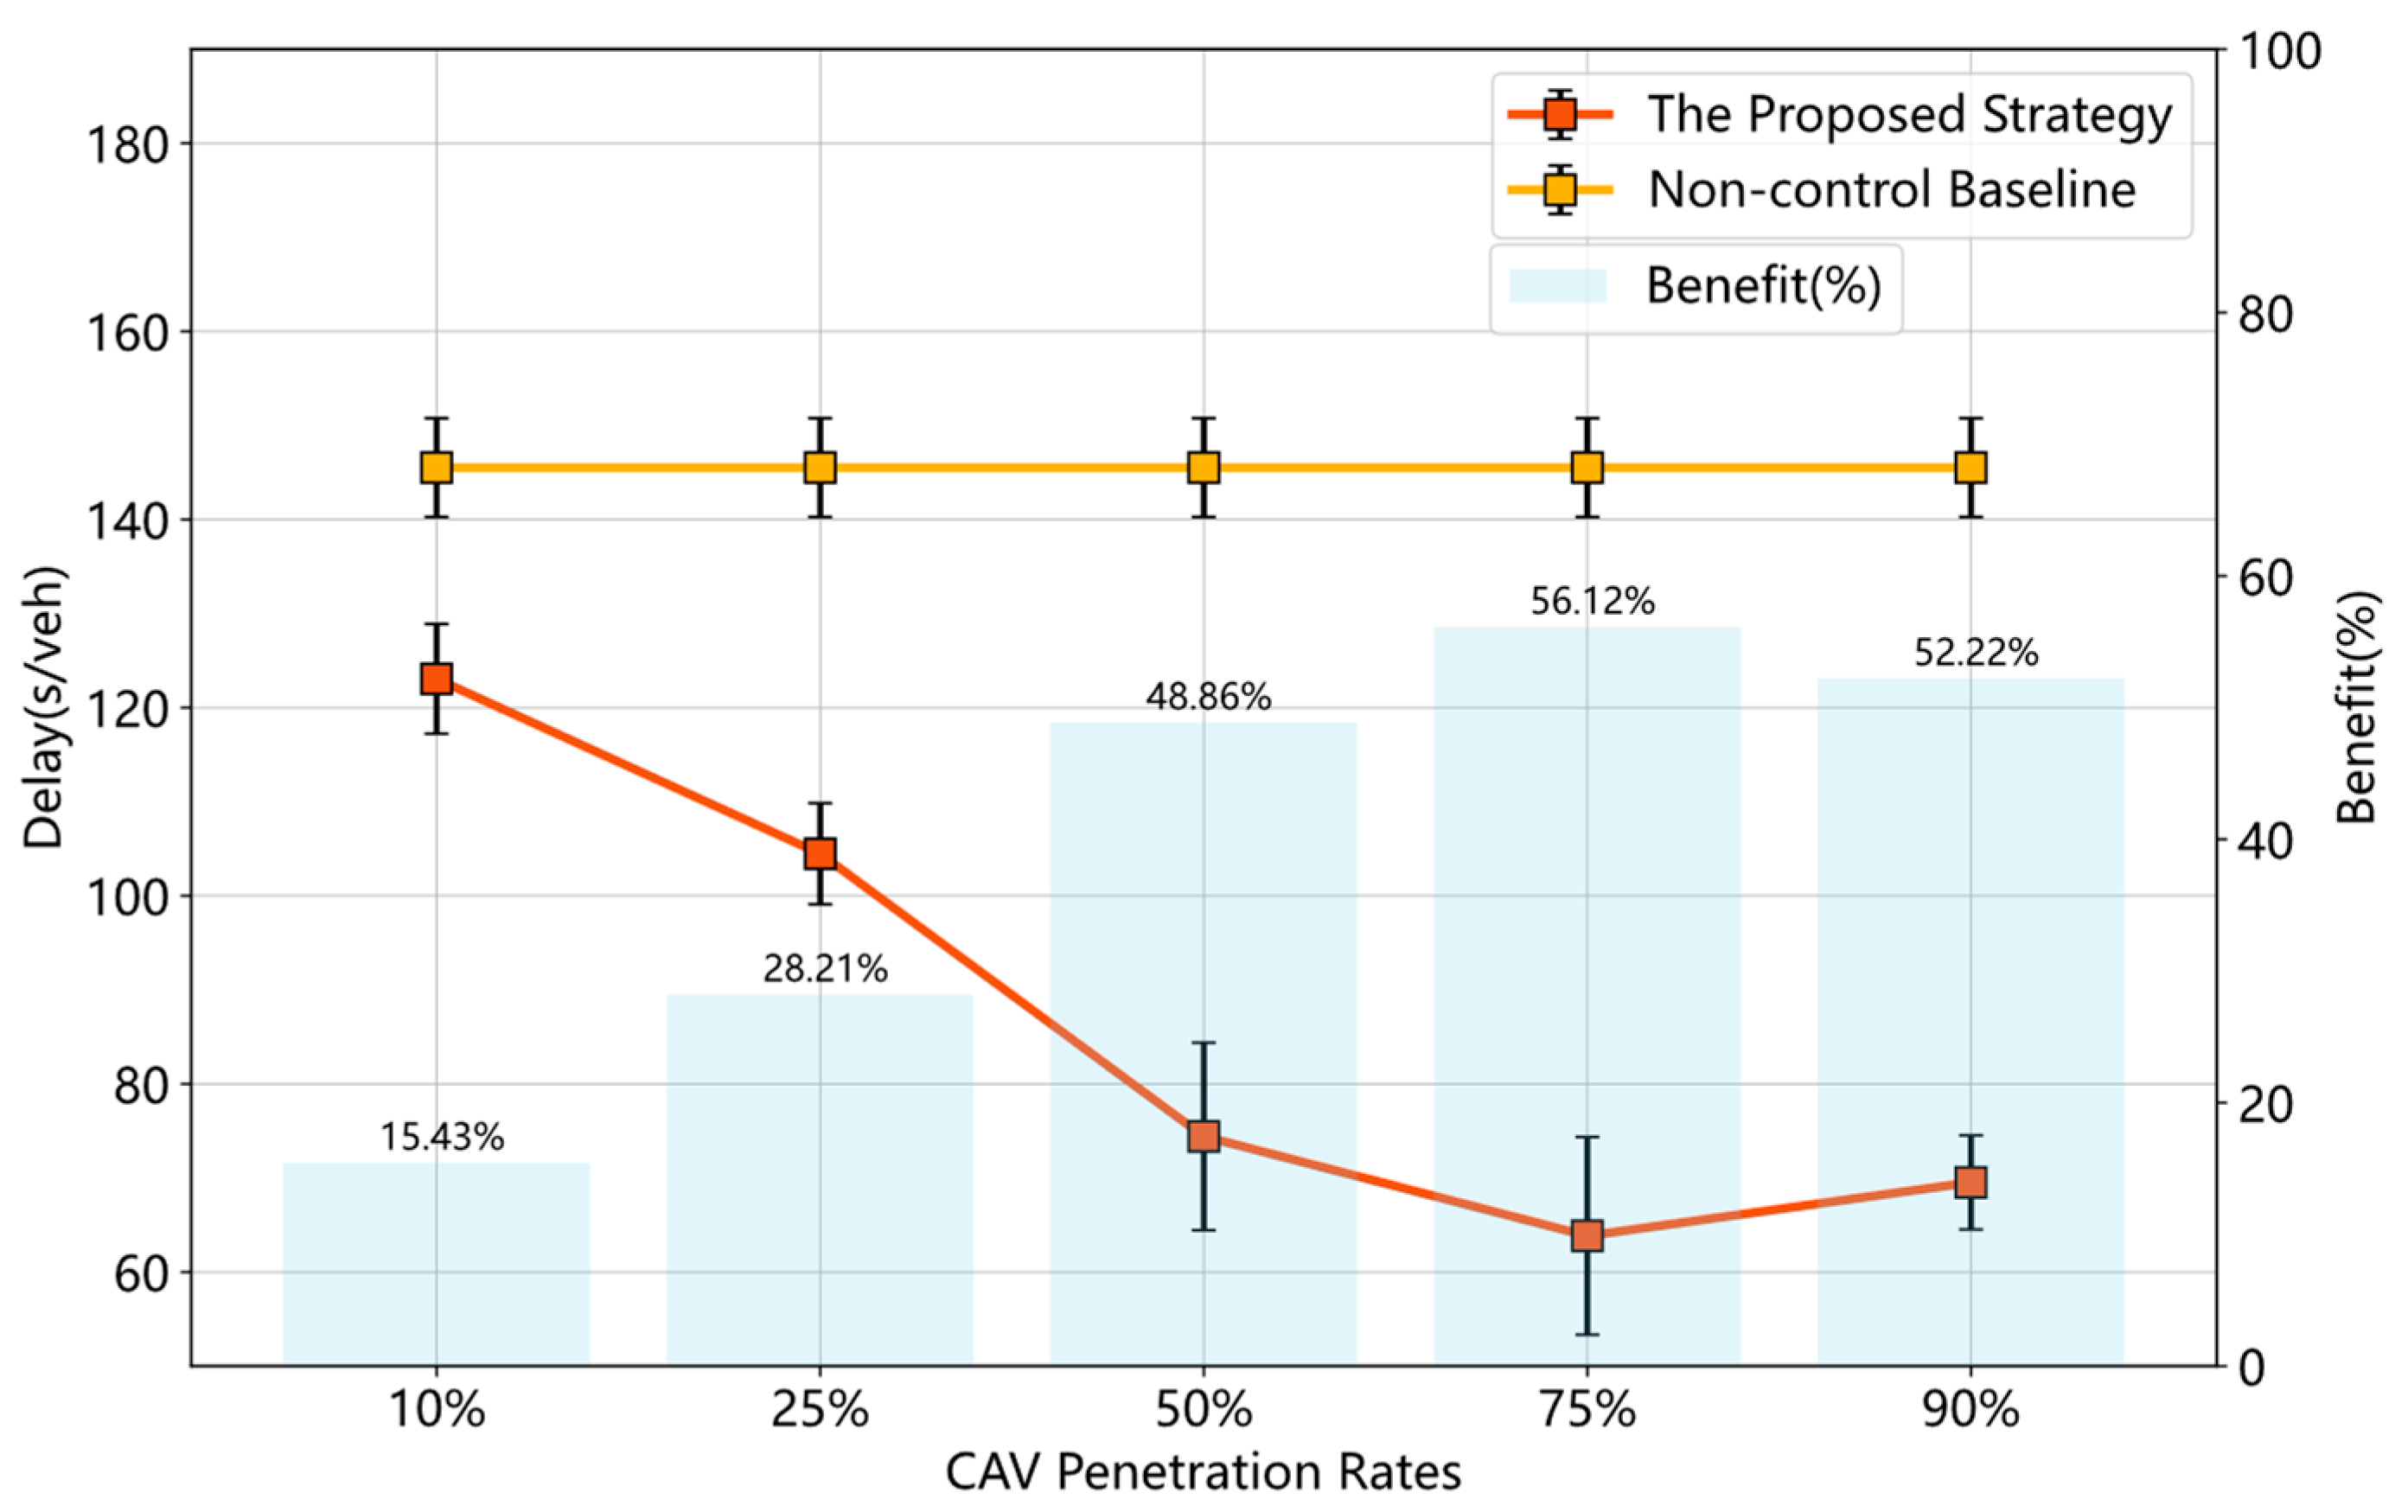
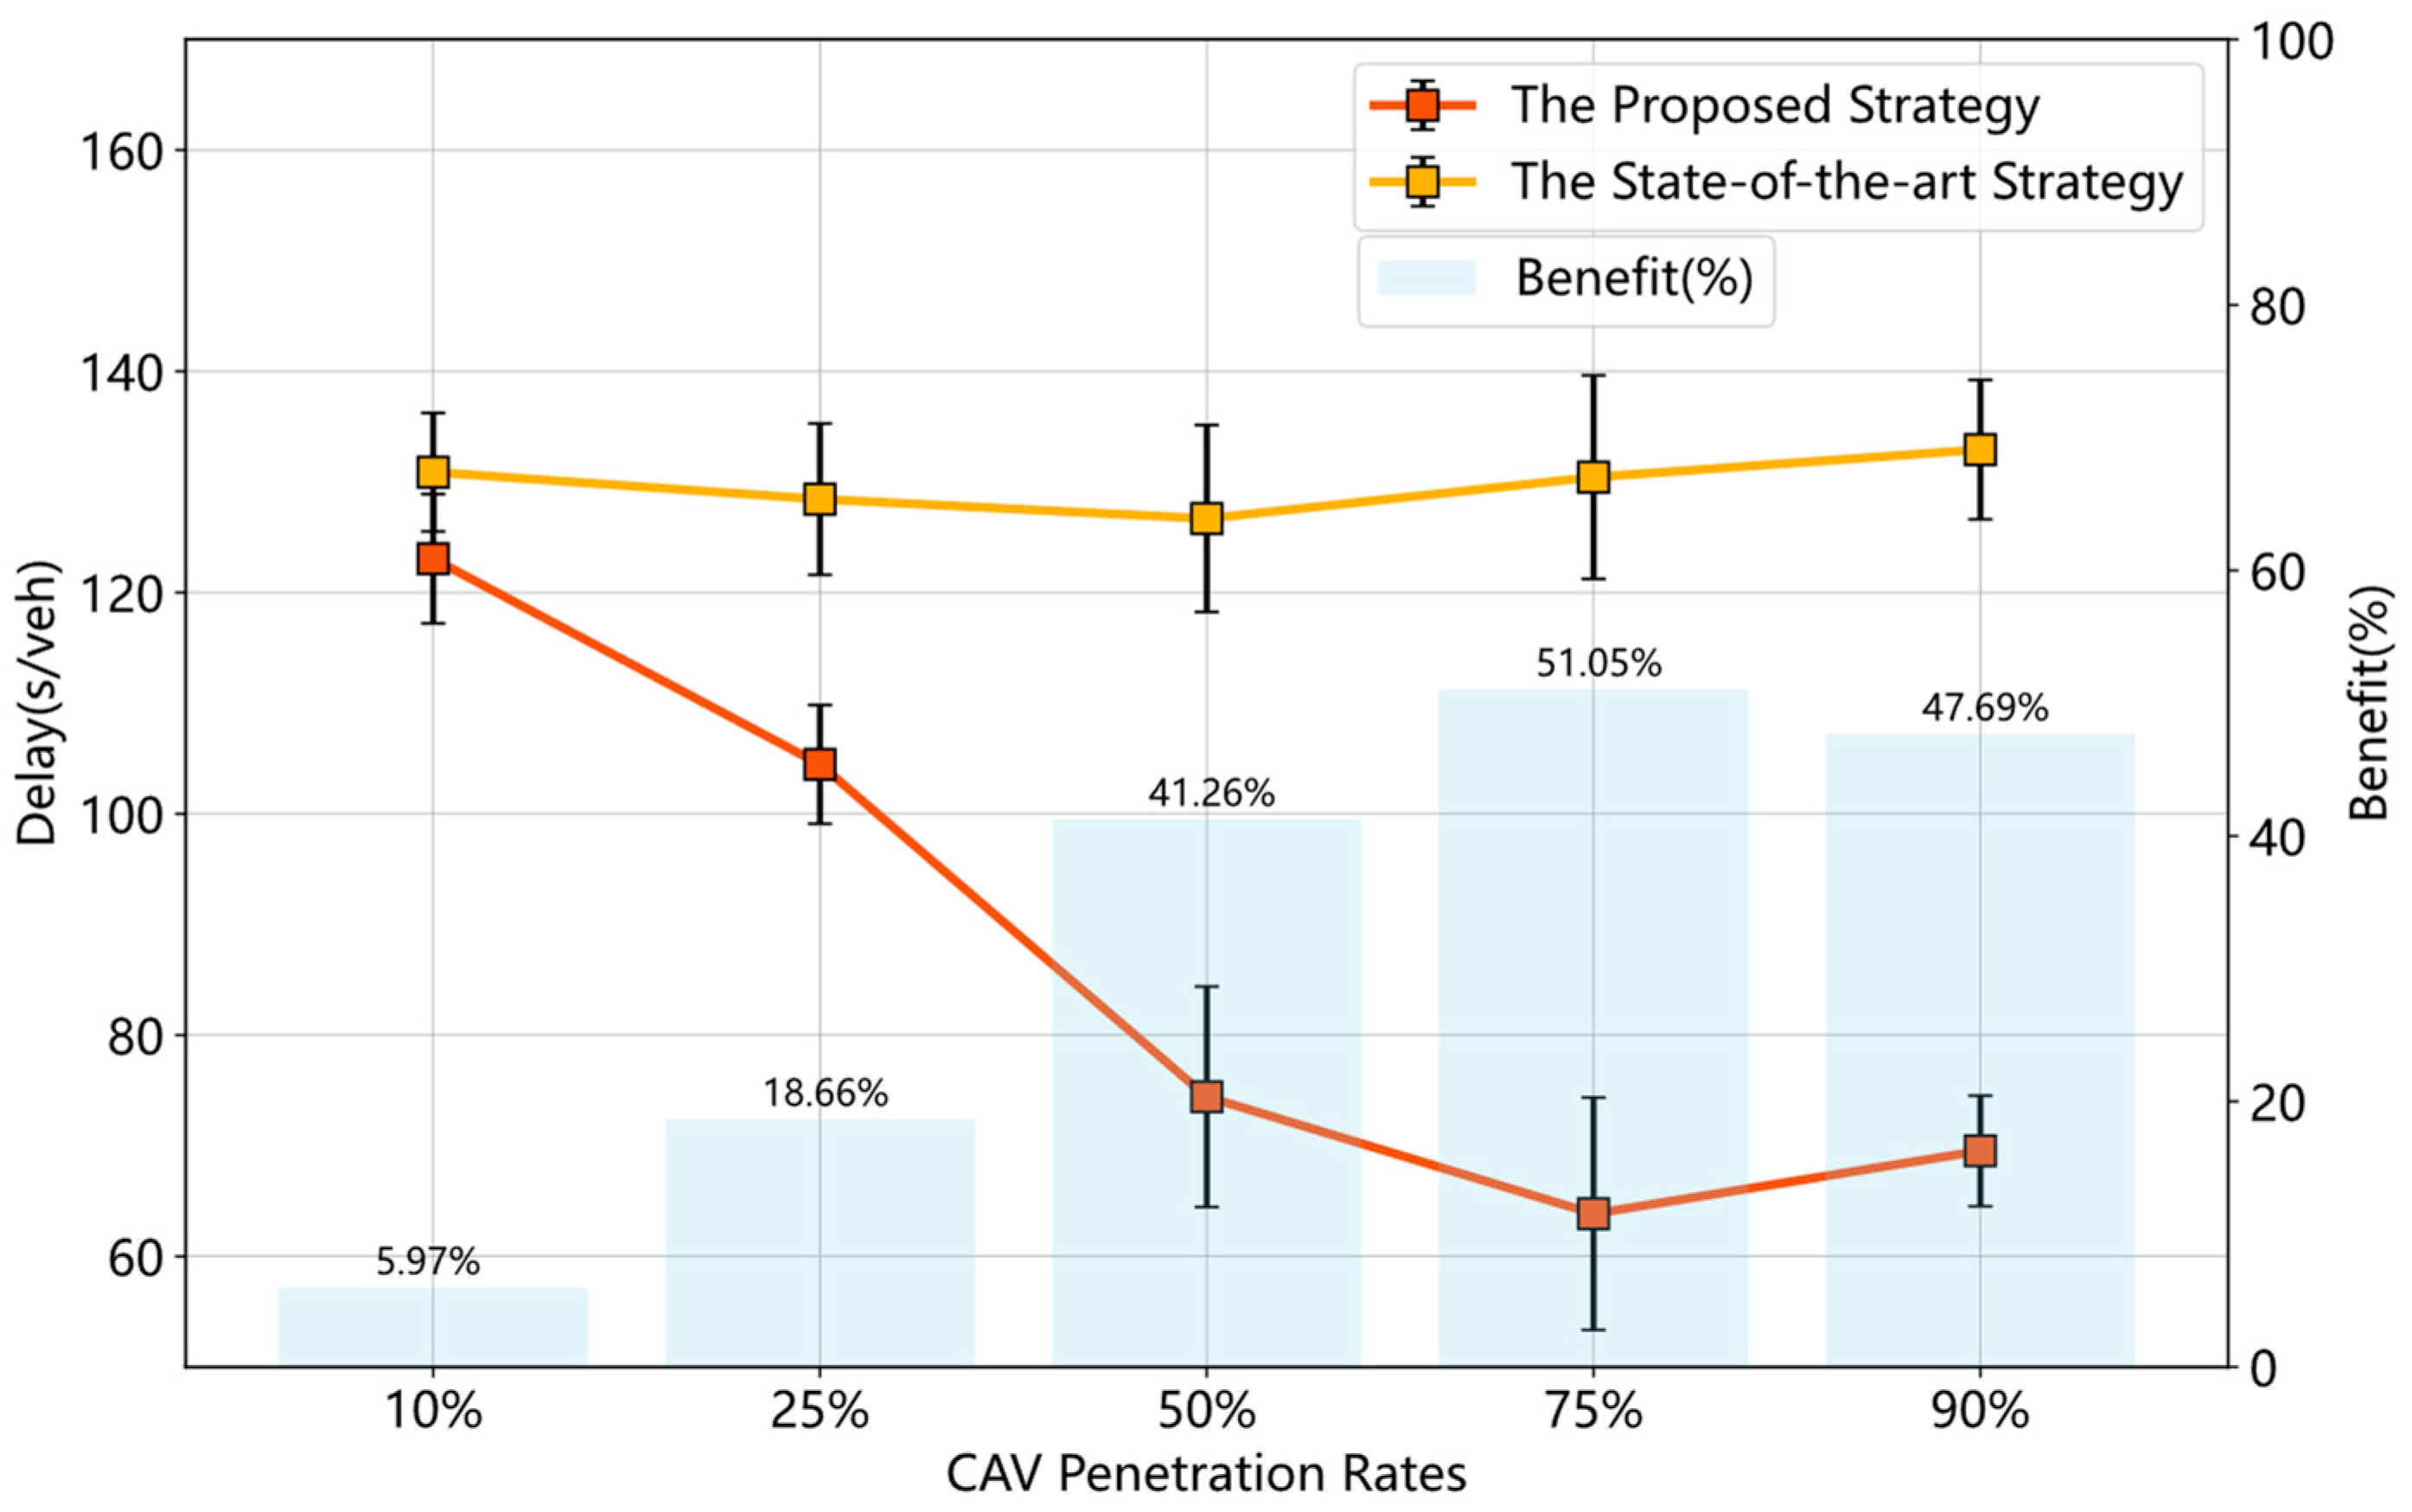
Figure 11 shows the result of the average vehicle delay comparison between the state-of-the-art strategy and the proposed strategy under various CPR. The results reveal that the proposed strategy achieves the benefits of delay reduction. Notably, when the CPR is 50% or over, such benefits are more obvious. That is because the proposed strategy can control more CAVs to pass the intersection without stops during a target green phase when the CPR is high.
(2) 
Compared with the State-of-the-art Strategy
Figure 12 shows the result of the throughput comparison between the state-of-the-art strategy and the proposed strategy under various CPR (demand level = 1.6). The result confirms that the proposed strategy performs better in throughput improvement under various CPR. Some reasons can be selected to explain that. Due to the phase-switch-based bus lane sharing, the proposed strategy allows more CAVs to share the BPL to pass the intersection during various green phases.
Figure 13 shows the result of the delay comparison between the state-of-the-art strategy and the proposed strategy under various CPR (demand level = 1.6). The proposed strategy outperforms the state-of-the-art strategy in delay reduction, especially when the CPR is high. The reason is that the proposed strategy can reduce more CAVs’ idling by using phase-switch-based bus lane sharing during various green phases.

Sensitive Analysis at Different Demand Levels

(1) 
Compared with Non-control Baseline
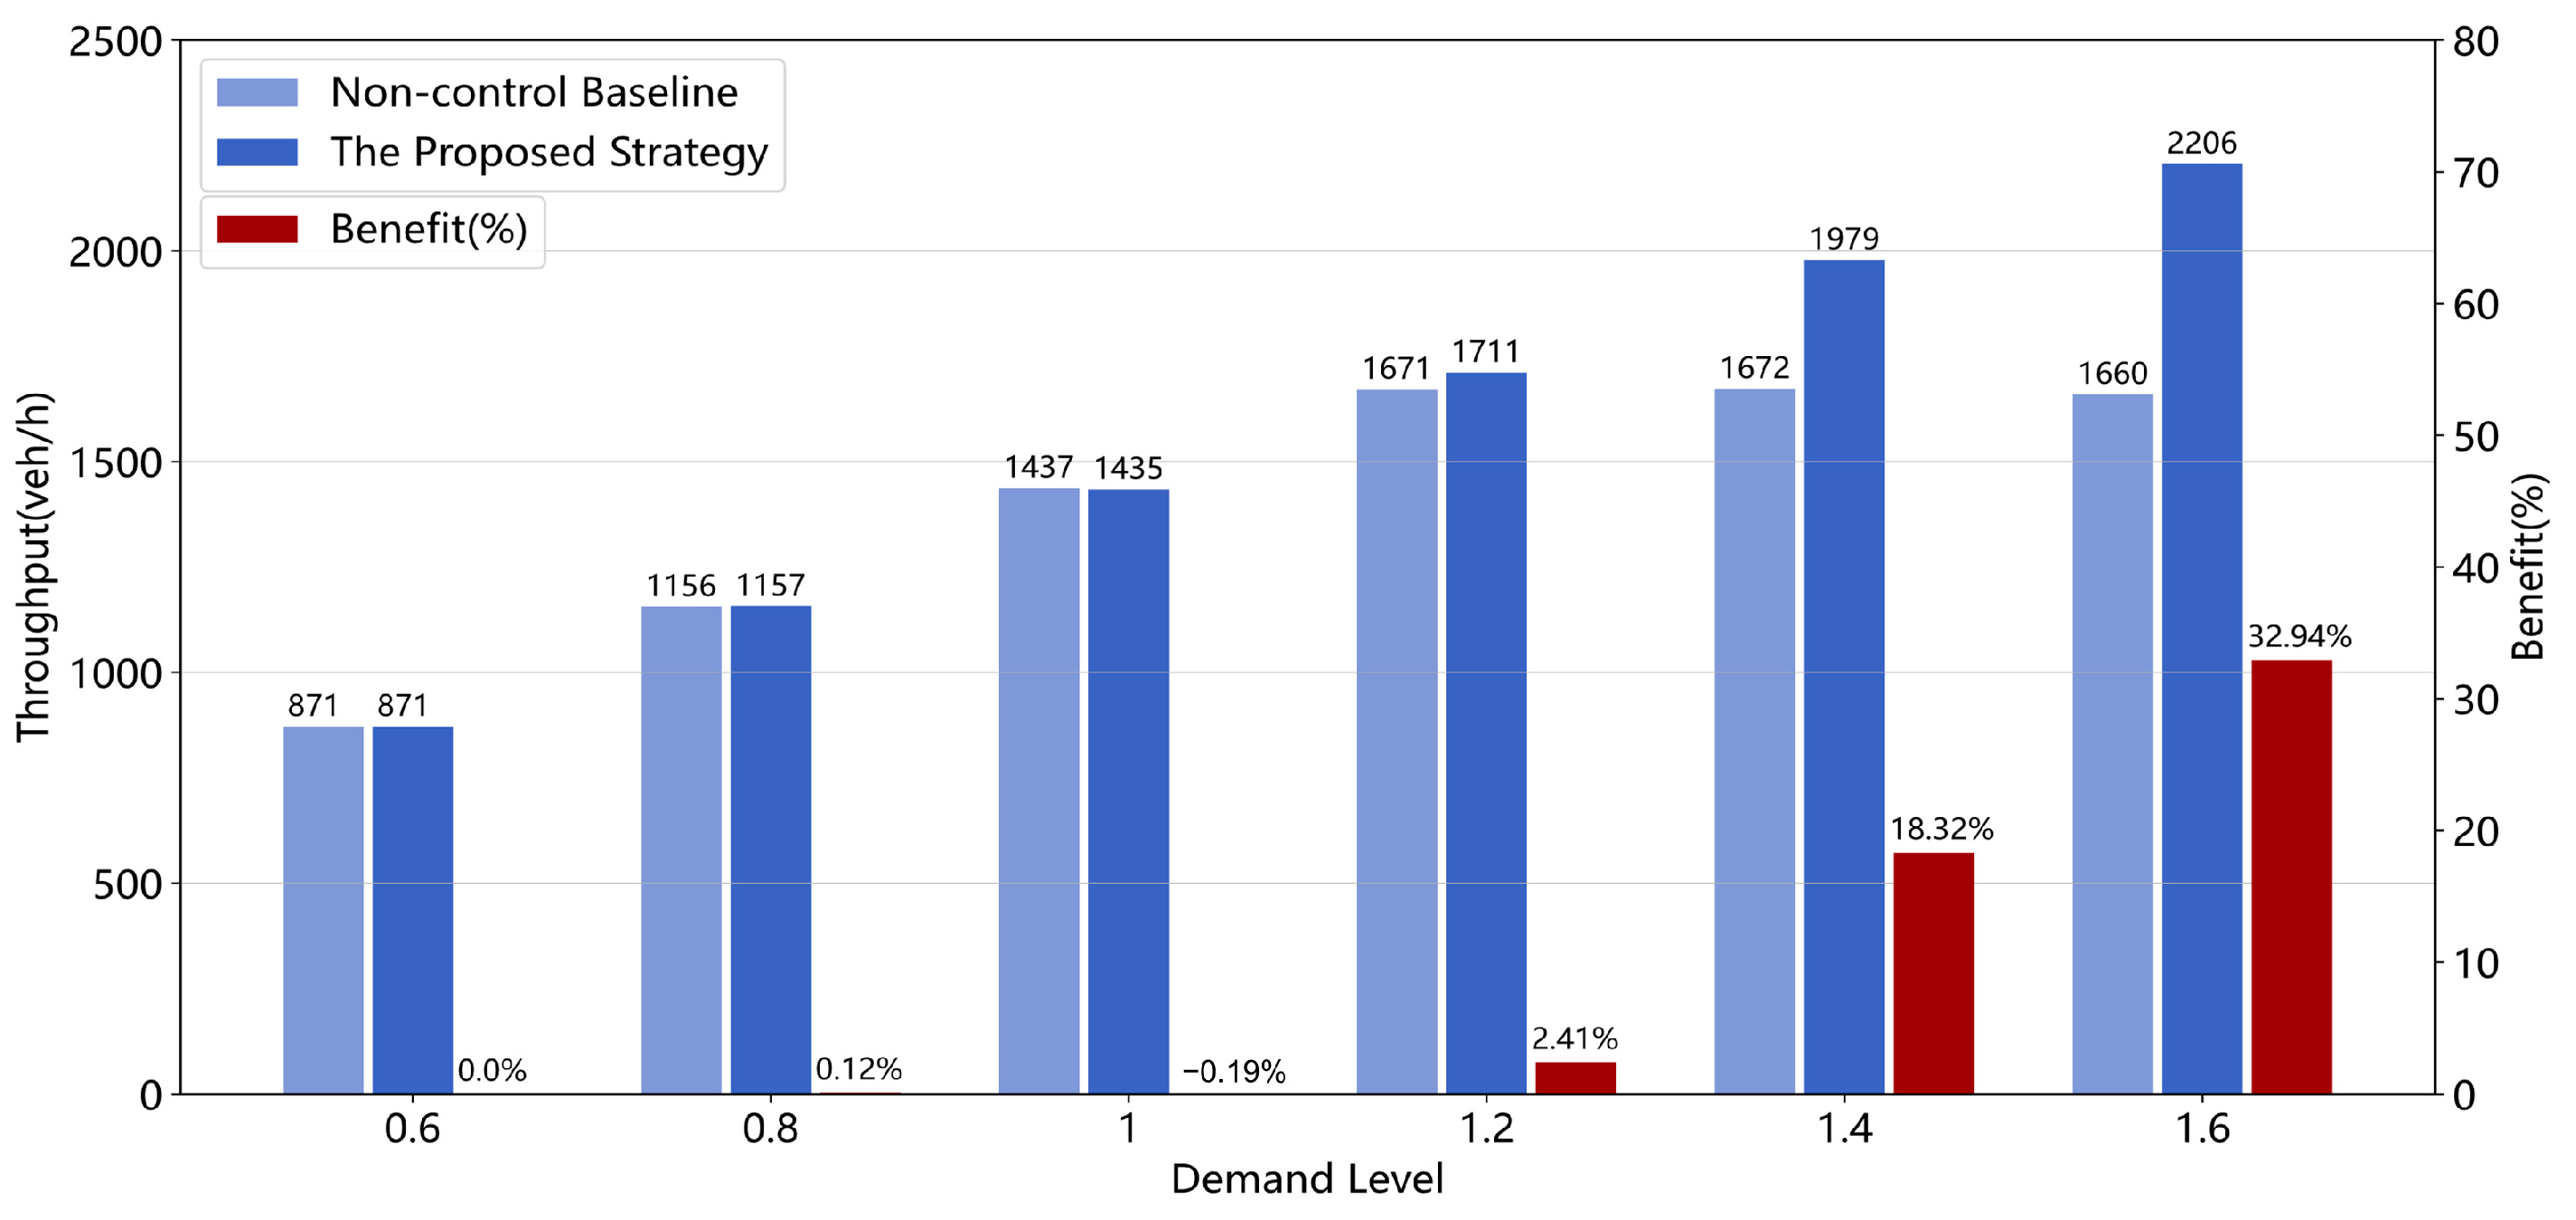
Figure 14 shows the result of the throughput comparison between the non-control baseline and the proposed strategy under various demand levels (CPR = 75%). The proposed strategy has no obvious benefits of throughput improvement when the demand level is less than or equal to 1. The proposed strategy achieves the benefits of throughput improvement when the demand level is 1.2 or over. When the demand level is 1.6, the throughput improvement benefit of the proposed strategy is 32.94%. This makes sense because the proposed strategy permits more CAVs to share the BPL to pass the intersection during a given green phase.
Figure 15 shows the result of the delay comparison under various demand levels (CPR = 75%). The proposed strategy has delay reduction benefits under all demand levels. When the demand level ranges from 0.8 to 1.2, the delay reduction benefits of the proposed strategy increases from 23.14 to 78.15%. The reason for that is the proposed strategy optimizes trajectories for CAVs sharing the BPL to pass the intersection without stops while the non-control baseline cannot achieve that. With the growth of the demand levels from 1.2 to 1.6, the delay reduction benefits of the proposed strategy are still obvious but decline gradually. This is because the proposed strategy has no more available space in the BPL for CAVs to achieve phase-switch-based bus lane sharing when the demand level is high.
(2) 
Compared with the State-of-the-art Strategy
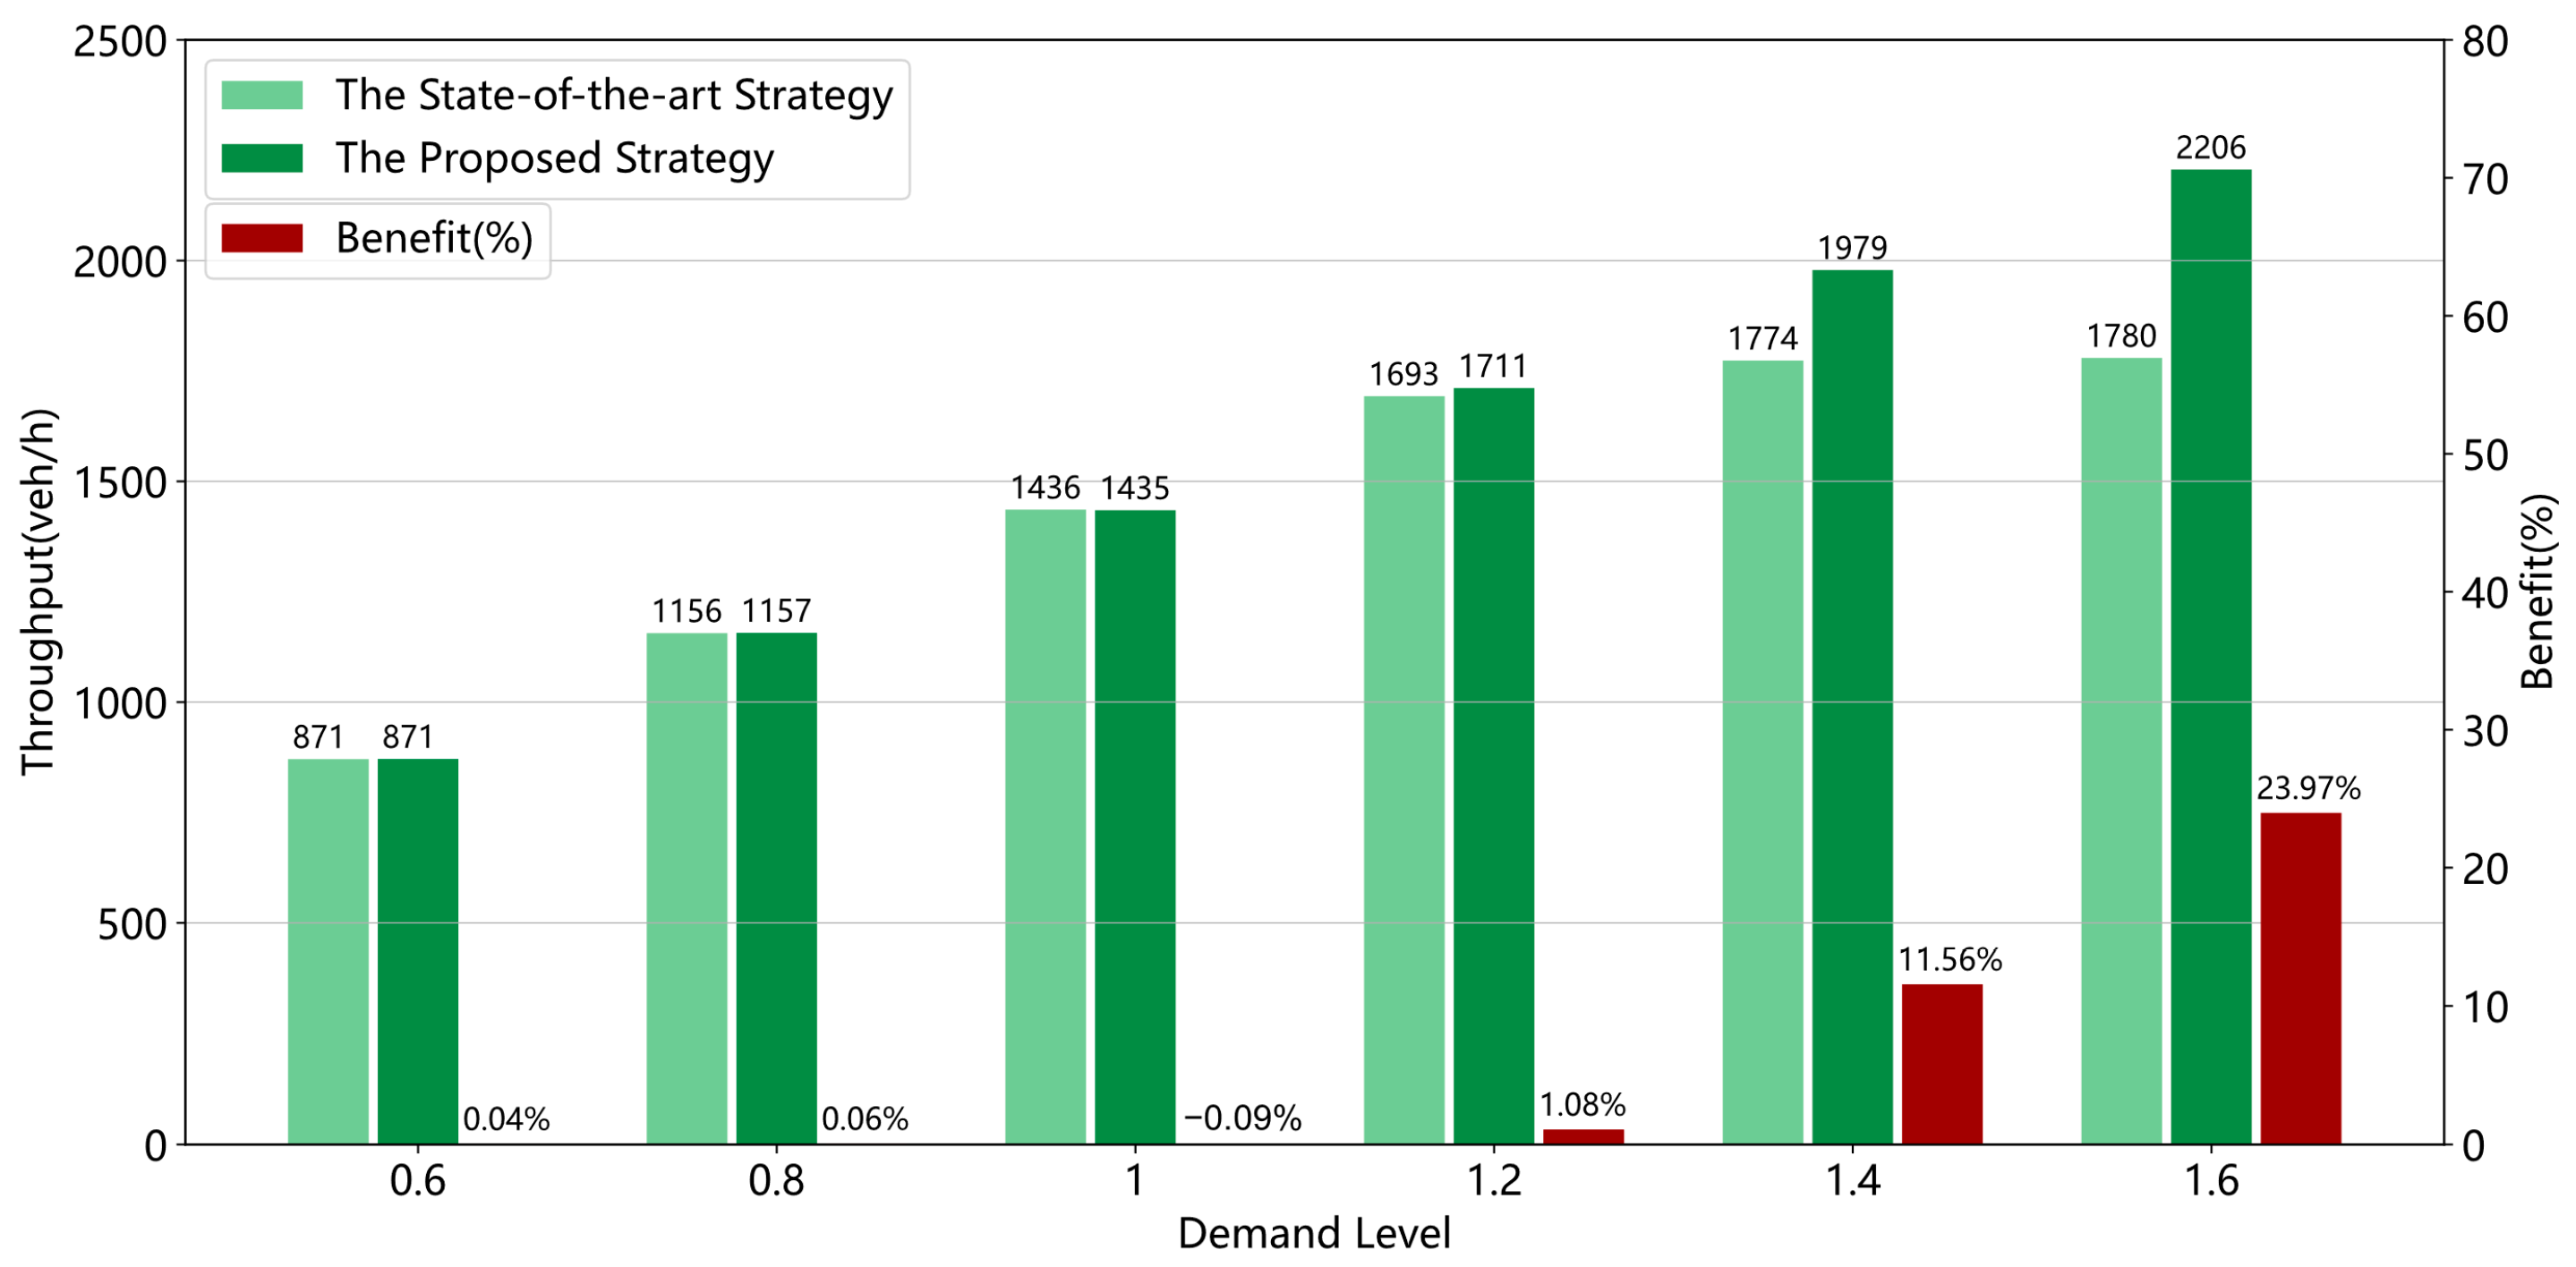
Figure 16 is the result of the throughput comparison between the state-of-the-art strategy and the proposed strategy in different demand levels (CPR = 75%). Under the non-saturated (demand level = 0.6, and 0.8) and saturated conditions (demand level = 1.0), the proposed strategy has no throughput benefits. The reason is that the uncongested roads could easily handle all vehicles and thus have no room for improvement. The proposed strategy outperforms the state-of-the-art strategy under oversaturated conditions (demand level = 1.2, 1.4, and 1.6). Some reasons can be selected to explain that. Due to the PBLSC, the proposed strategy can make more CAVs share BPL than the state-of-the-art strategy.
Figure 17 shows the result of the delay comparison under various demand levels (CPR = 75%). It can be observed that the proposed strategy performs well in oversaturated conditions (demand level = 1.2, 1.4, and 1.6). Furthermore, the proposed strategy can reduce delay by up to 69.59% when the demand level is 1.4. The reason is that the proposed strategy can prevent more CAVs from too-long queues on the GPL during different signal phases.

4.2.3. The Validation of the Absolute Bus Priority

The proposed eco-driving strategy can control CAVs to achieve phase-switch-based bus lane sharing while ensuring absolute bus priority. To validate the effectiveness of the capability of ensuring absolute bus priority, some experiments are conducted. As mentioned previously, the speed error of the buses has been selected as a crucial MOE to evaluate the capacity of ensuring absolute bus priority. The result is shown in Table 2. In this table, the actual accelerations are all less than 0.01 m/s2 which can be ignored. The desired speed for all buses is a constant. The actual speed is the average speed of all buses. The speed error is all less than 0.1%, which means that all buses run on the BPL with a desired speed. Hence, the proposed strategy has a credible capability of ensuring absolute bus priority.

5. Discussion and Conclusions

This research proposed an eco-driving strategy at signalized intersections for mixed traffic consisting of CAVs and CHVs. This proposed strategy aims at maximizing the benefit of general traffic, especially in fuel efficiency improvement, throughput improvement, and delay reduction. To achieve these goals, the proposed strategy designs a method of phase-switch-based bus lane sharing for general vehicles while ensuring absolute bus priority. Such an eco-driving strategy considering phase-switch-based bus lane sharing is more applicable for signalized arterials with multiple rights-of-way. The reason why the proposed strategy is more effective is discussed as follows.
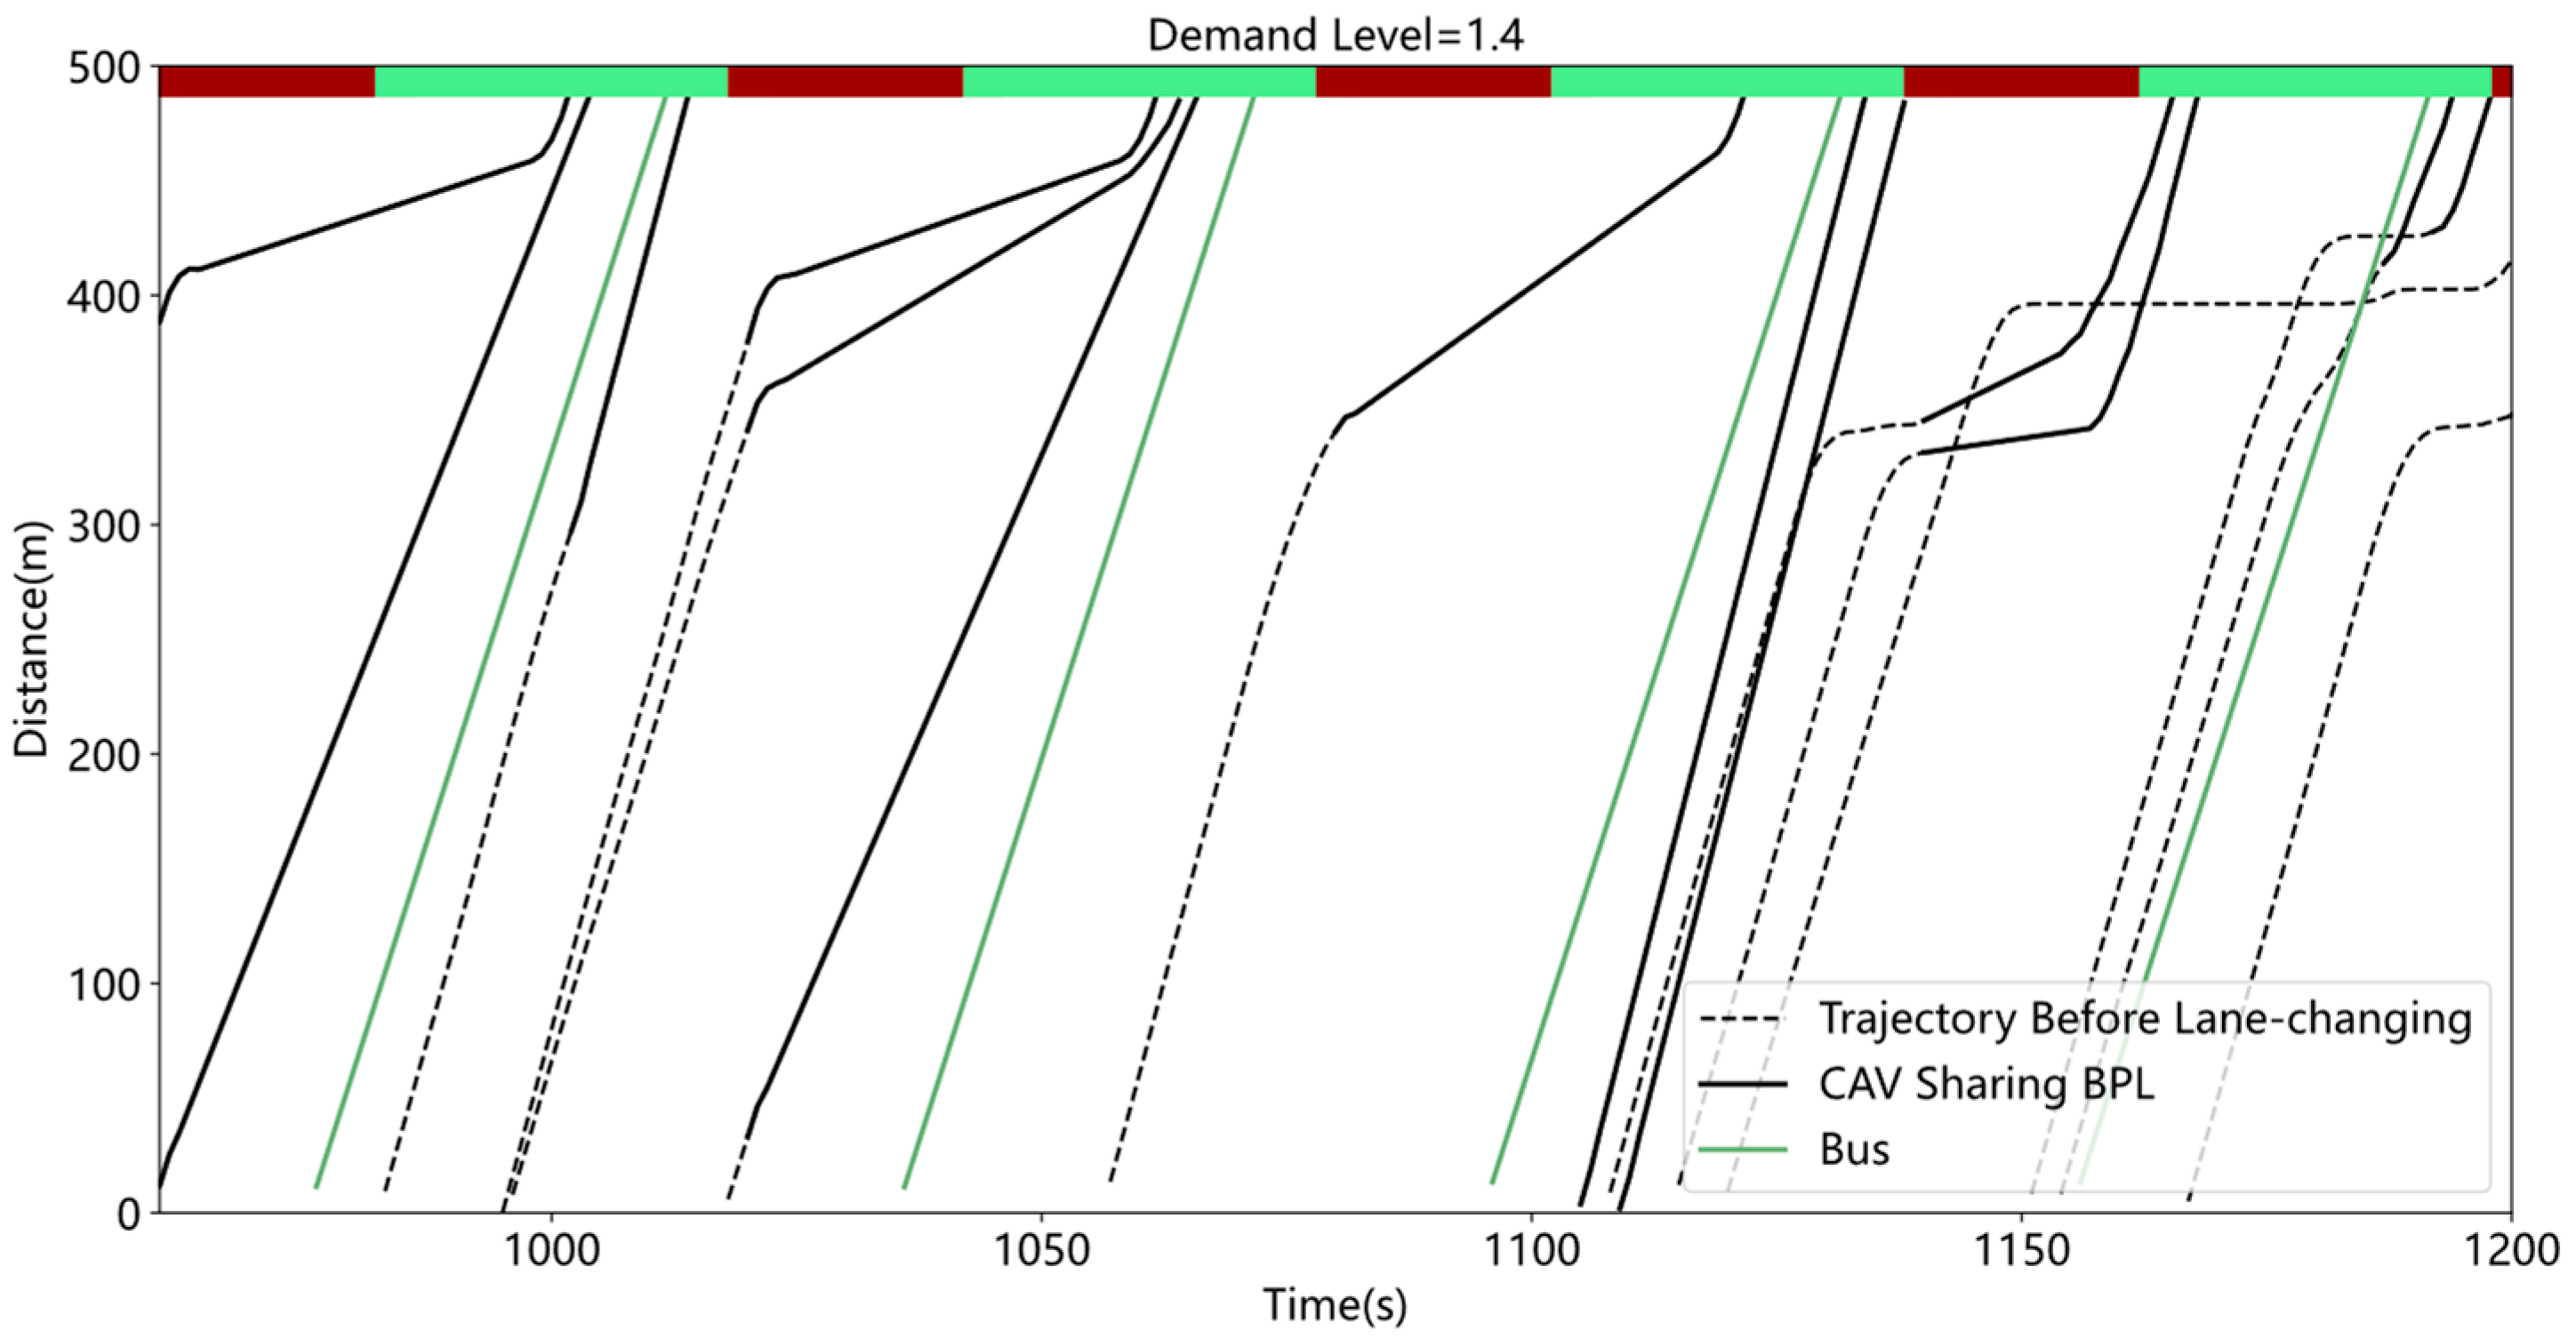
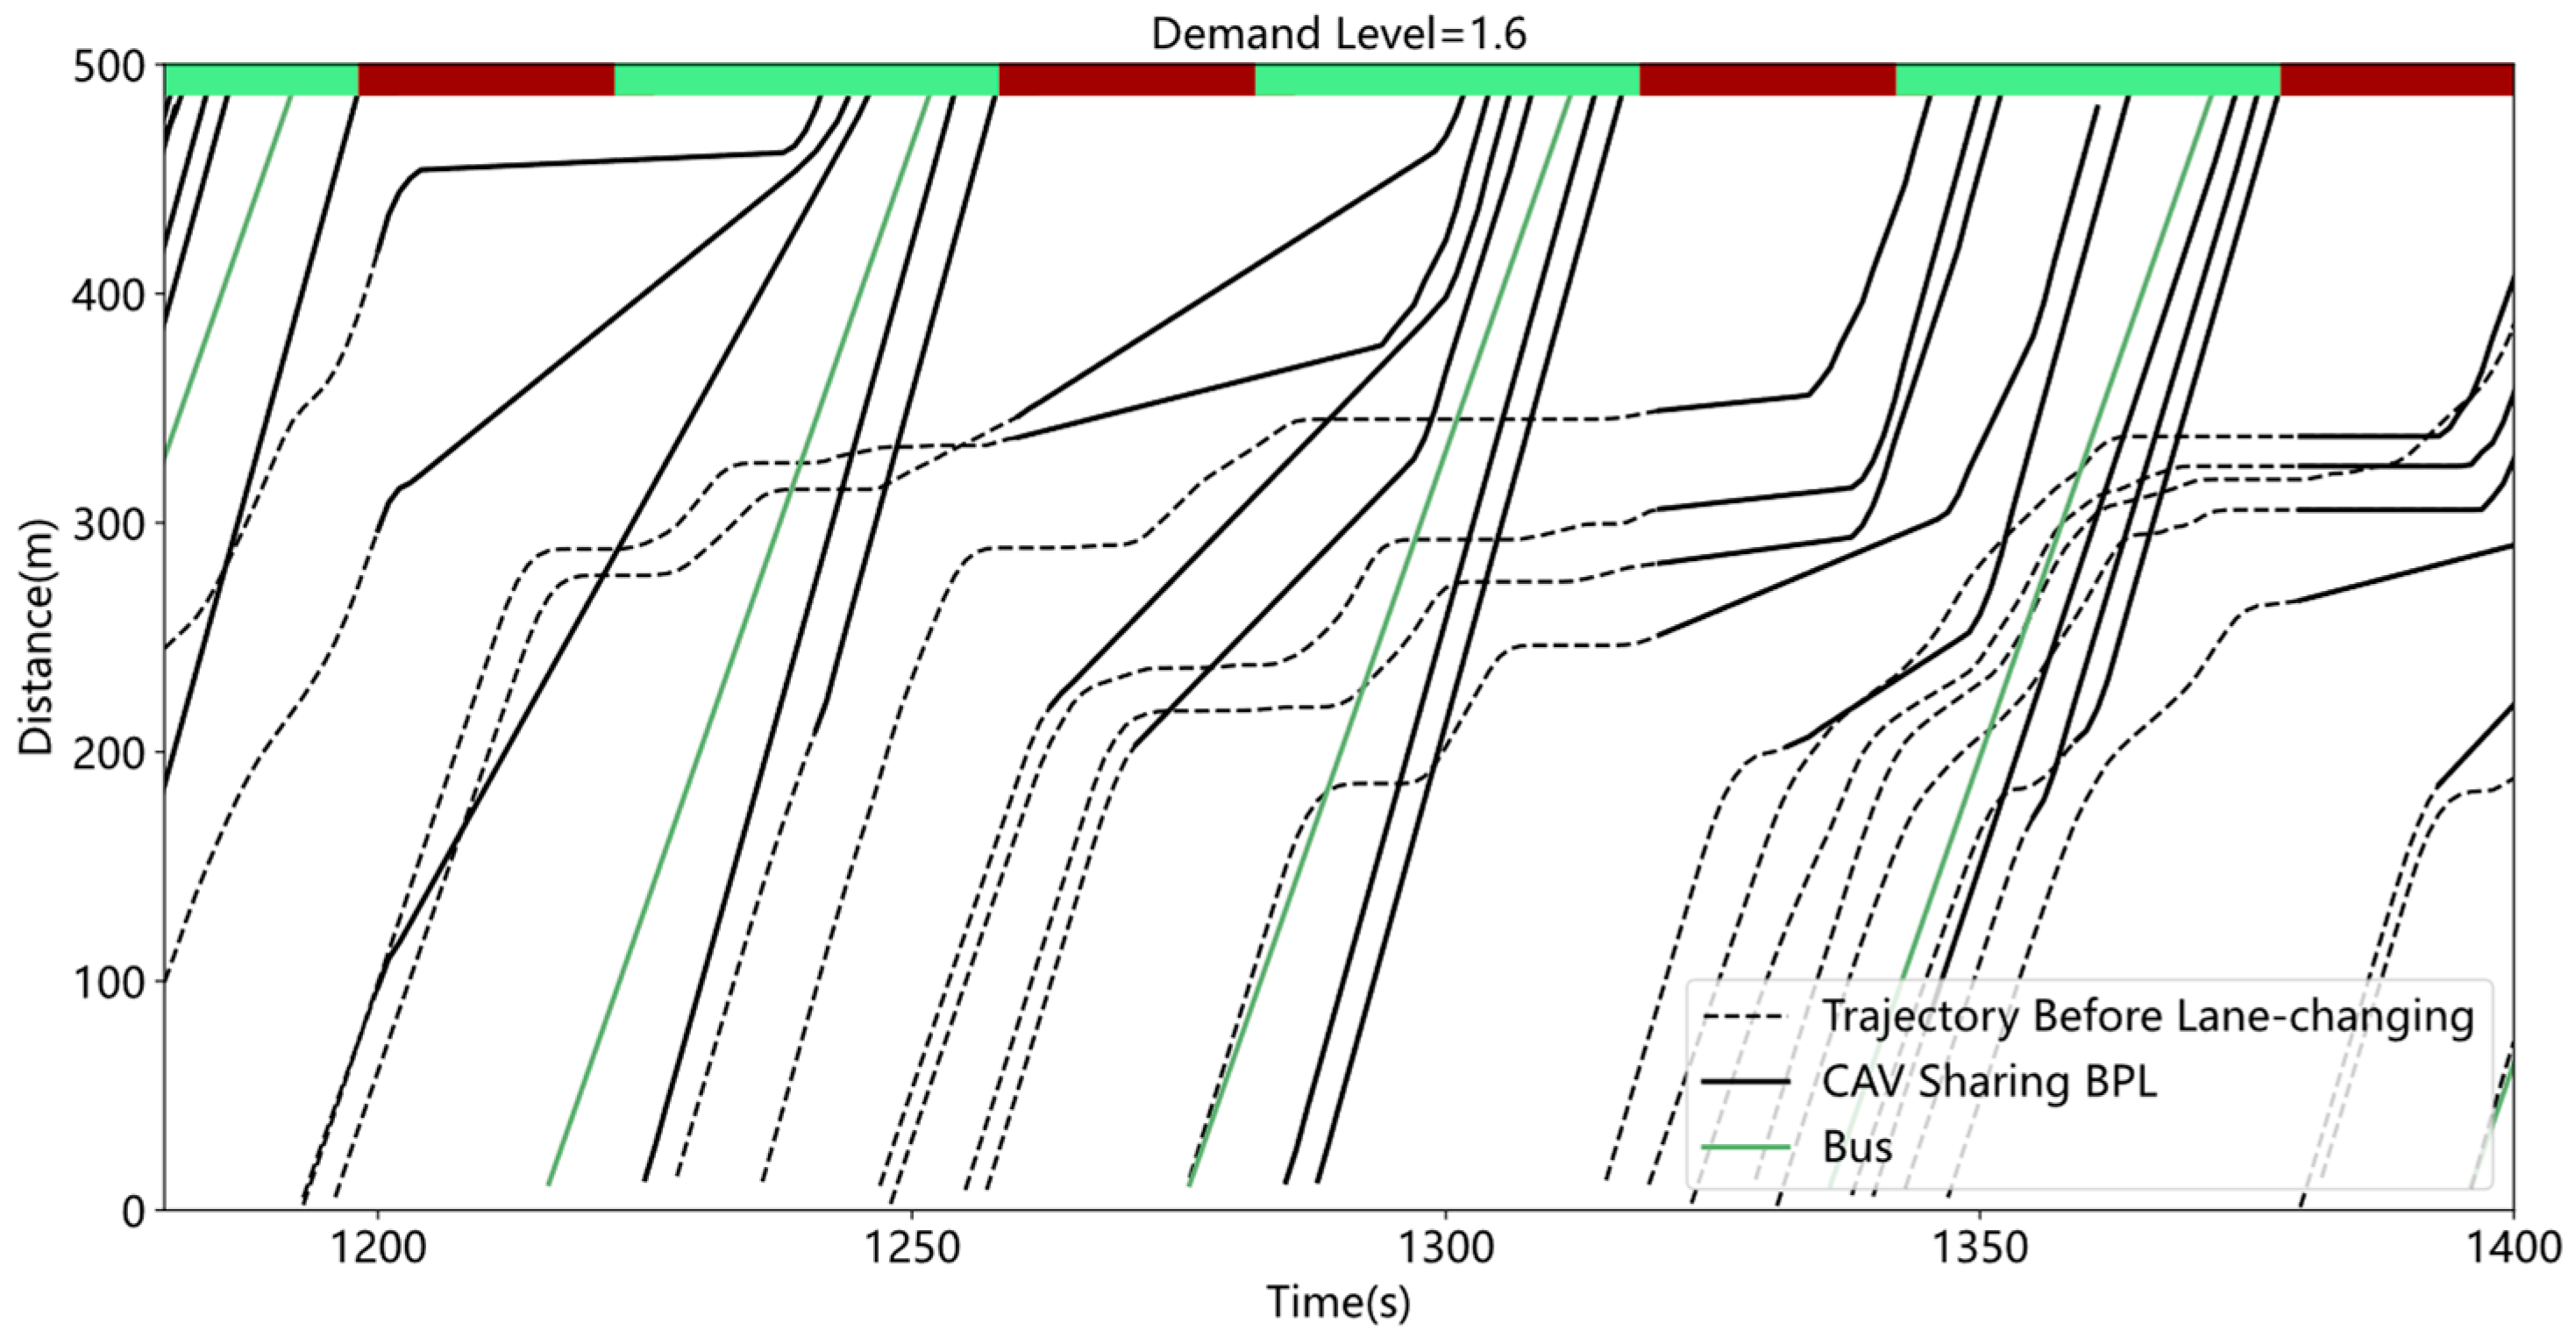
As shown in Figure 18, Figure 19 and Figure 20, these results are vehicle trajectories optimized by the proposed strategy on the BPL under oversaturated demand levels (1.2, 1.4, and 1.6). The solid black lines denote trajectories of CAVs sharing the BPL and the dashed black lines denote trajectories of CAVs before sharing the BPL. The green lines represent the bus trajectories. As shown in these results, due to the proposed strategy, more CAVs can be controlled to bypass the traffic queue and pass the intersection without stops during a target green phase to improve efficiency. Furthermore, frequent acceleration and deceleration caused by severe congestion can be reduced after lane-changing to improve traffic sustainability.
Conclusions drawn from the results are as follows. Compared with the state-of-the-art strategy, the effectiveness of the proposed strategy is validated in terms of fuel consumption, throughput, and vehicle delay:
  • Under various CAV Penetration Rates (CPR), the proposed strategy outperforms the state-of-the-art strategy, especially when the CPR is high. The proposed strategy can respectively obtain the benefits of throughput improvement and delay reduction up to 24.97% and 51.05%. Furthermore, the proposed strategy could save fuel by up to 15.15%. With the growth of CPR, the benefits of fuel efficiency decline gradually.
  • Under various demand levels, the proposed strategy achieves more throughput improvement benefits under oversaturated conditions (demand level = 1.2, 1.4, and 1.6), ranging from 1.08% to 23.97%. The delay reduction benefits of the proposed strategy range from 2.21% to 69.59% from the non-saturated demand level to the oversaturated demand level, respectively. Additionally, the fuel consumption of the proposed strategy can be saved up to 11.07% when the demand level is 1.6.
  • The proposed eco-driving strategy can maximize the benefits of general vehicles while ensuring absolute bus priority under various CPR and demand levels.

6. Limitations and Future Research

Although the proposed strategy has achieved more benefits of fuel efficiency improvement, throughput improvement, and delay reduction, it still has some limitations. For example, the proposed strategy lacks the consideration of the optimization of signal phase and timing. Therefore, future research could be conducted on the joint optimization of the traffic signal and vehicle trajectories. By incorporating signal timing optimization, the eco-driving strategy can reduce unnecessary vehicle speed oscillation and fuel consumption caused by inappropriate signal timing.

Author Contributions

Conceptualization, G.W. and J.L.; methodology, G.W., J.L. and Z.Z.; software, Z.L.; validation, G.W., Z.L. and Z.Z.; formal analysis, G.W. and Z.L.; investigation, G.W.; resources, G.W.; data curation, G.W.; writing—original draft preparation, G.W.; writing—review and editing, Z.Z. and J.L.; visualization, Z.L.; supervision, J.L.; project administration, J.L.; funding acquisition, J.L. All authors have read and agreed to the published version of the manuscript.

Funding

This paper is supported by National Key R&D Program of China (No. 2022ZD0115501), National Natural Science Foundation of China (Grant No.52072264), Zhengzhou Major Science and Technology Project (No. 2021KJZX0060-9),Shanghai Municipal Science and Technology Major Project 2021SHZDZX0100, Shanghai Automotive Industry Science and Technology Development Foundation (No. 2213), Shanghai Oriental Scholar (2018), Tongji Zhongte Chair Professor Foundation (No. 000000375-2018082), and the Fundamental Research Funds for the Central Universities.

Institutional Review Board Statement

Not applicable.

Informed Consent Statement

Not applicable.

Data Availability Statement

The data presented in this research are available on request from the corresponding author.

Acknowledgments

This research was supported by PTV VISSIM for the simulation environment.

Conflicts of Interest

The authors declare no conflict of interest.

References

  1. Edenhofer, O.; Pichs-Madruga, R.; Sokona, Y. Intergovernmental Panel Climate Change of Working Group III. In Climate Change 2014 Mitigation of Climate Change Working Group III Contribution to the Fifth Assessment Report of the Intergovernmental Panel on Climate Change Preface; IPCC: Geneva, Switzerland, 2014; pp. IX–XI. [Google Scholar]
  2. Barth, M.; Boriboonsomsin, K. Energy and emissions impacts of a freeway-based dynamic eco-driving system. Transp. Res. Part D Transp. Environ. 2009, 14, 400–410. [Google Scholar] [CrossRef]
  3. Huang, Y.H.; Ng, E.C.Y.; Zhou, J.L.; Surawski, N.C.; Chan, E.F.C.; Hong, G. Eco-driving technology for sustainable road transport: A review. Renew. Sustain. Energy Rev. 2018, 93, 596–609. [Google Scholar] [CrossRef]
  4. Xu, N.; Li, X.H.; Liu, Q.; Zhao, D. An Overview of Eco-Driving Theory, Capability Evaluation, and Training Applications. Sensors 2021, 21, 6547. [Google Scholar] [CrossRef] [PubMed]
  5. Sivak, M.; Schoettle, B. Eco-driving: Strategic, tactical, and operational decisions of the driver that influence vehicle fuel economy. Transp. Policy 2012, 22, 96–99. [Google Scholar] [CrossRef]
  6. Xu, Y.Z.; Li, H.Y.; Liu, H.B.; Rodgers, M.O.; Guensler, R.L. Eco-driving for transit: An effective strategy to conserve fuel and emissions. Appl. Energy 2017, 194, 784–797. [Google Scholar] [CrossRef]
  7. Andrieu, C.; Saint Pierre, G. Comparing effects of eco-driving training and simple advices on driving behavior. In Proceedings of the 15th Meeting of the Euro-Working-Group-on-Transportation (EWGT), Paris, France, 10–13 September 2012; pp. 211–220. [Google Scholar]
  8. Beusen, B.; Broekx, S.; Denys, T.; Beckx, C.; Degraeuwe, B.; Gijsbers, M.; Scheepers, K.; Govaerts, L.; Torfs, R.; Panis, L.I. Using on-board logging devices to study the longer-term impact of an eco-driving course. Transp. Res. Part D Transp. Environ. 2009, 14, 514–520. [Google Scholar] [CrossRef]
  9. Almannaa, M.H.; Chen, H.; Rakha, H.A.; Loulizi, A.; El-Shawarby, I. Reducing Vehicle Fuel Consumption and Delay at Signalized Intersections Controlled-Field Evaluation of Effectiveness of Infrastructure-to-Vehicle Communication. Transp. Res. Rec. 2017, 2621, 10–20. [Google Scholar] [CrossRef]
  10. Liao, R.H.; Chen, X.M.; Yu, L.; Sun, X.F. Analysis of Emission Effects Related to Drivers’ Compliance Rates for Cooperative Vehicle-Infrastructure System at Signalized Intersections. Int. J. Environ. Res. Public Health 2018, 15, 122. [Google Scholar] [CrossRef] [PubMed]
  11. Hao, P.; Wu, G.Y.; Boriboonsomsin, K.; Barth, M.J. Eco-Approach and Departure (EAD) Application for Actuated Signals in Real-World Traffic. IEEE Trans. Intell. Transp. Syst. 2019, 20, 30–40. [Google Scholar] [CrossRef]
  12. Lai, J.T.; Hu, J.; Cui, L.; Chen, Z.; Yang, X.G. A generic simulation platform for cooperative adaptive cruise control under partially connected and automated environment. Transp. Res. Part C Emerg. Technol. 2020, 121, 102874. [Google Scholar] [CrossRef]
  13. Hu, J.; Sun, S.; Lai, J.; Wang, S.; Chen, Z.; Liu, T. CACC Simulation Platform Designed for Urban Scenes. IEEE Trans. Intell. Veh. 2023, 84, 1–19. [Google Scholar] [CrossRef]
  14. Elliott, D.; Keen, W.; Miao, L. Recent advances in connected and automated vehicles. J. Traffic Transp. Eng. Engl. Ed. 2019, 6, 109–131. [Google Scholar] [CrossRef]
  15. Mintsis, E.; Vlahogianni, E.I.; Mitsakis, E.; Ozkul, S. Evaluation of a Cooperative Speed Advice Service Implemented along an Urban Arterial Corridor. In Proceedings of the 2017 5th IEEE International Conference on Models and Technologies for Intelligent Transportation Systems (MT-ITS), Naples, Italy, 26–28 June 2017; IEEE: Piscataway, NJ, USA, 2017; pp. 232–237. [Google Scholar]
  16. Ma, J.Q.; Li, X.P.; Zhou, F.; Hu, J.; Park, B.B. Parsimonious shooting heuristic for trajectory design of connected automated traffic part II: Computational issues and optimization. Transp. Res. Part B Methodol. 2017, 95, 421–441. [Google Scholar] [CrossRef]
  17. Zhang, Y.M.; Wu, Z.Z.; Zhang, Y.; Shang, Z.Y.; Wang, P.; Zou, Q.Q.; Zhang, X.H.; Hu, J. Human-Lead-Platooning Cooperative Adaptive Cruise Control. IEEE Trans. Intell. Transp. Syst. 2022, 23, 18253–18272. [Google Scholar] [CrossRef]
  18. An, L.H.; Yang, X.F.; Hu, J. Modeling System Dynamics of Mixed Traffic with Partial Connected and Automated Vehicles. IEEE Trans. Intell. Transp. Syst. 2022, 23, 15755–15764. [Google Scholar] [CrossRef]
  19. Wang, H.R.; Lai, J.T.; Zhang, X.H.; Zhou, Y.; Li, S.; Hu, J. Make space to change lane: A cooperative adaptive cruise control lane change controller. Transp. Res. Part C Emerg. Technol. 2022, 143, 103847. [Google Scholar] [CrossRef]
  20. Jiang, H.F.; Hu, J.; An, S.; Wang, M.; Park, B.B. Eco approaching at an isolated signalized intersection under partially connected and automated vehicles environment. Transp. Res. Part C Emerg. Technol. 2017, 79, 290–307. [Google Scholar] [CrossRef]
  21. Zhang, Z.; Lai, J.; Ma, C.; Zhu, J.; Yang, X. Ensuring Absolute Transit Priority Through Trajectory Based Control of Connected and Automated Traffic. In Proceedings of the 2021 6th International Conference on Transportation Information and Safety (ICTIS), Wuhan, China, 22–24 October 2021; IEEE: Piscataway, NJ, USA, 2021; pp. 1132–1135. [Google Scholar]
  22. Zhang, Z.; Lai, J.; Yang, X. Dynamic spatial slice optimization for bus priority under the environment of mixed traffic. In Proceedings of the 25th IEEE International Conference on Intelligent Transportation Systems, ITSC 2022, Macau, China, 8–12 October 2022; Institute of Electrical and Electronics Engineers Inc.: Piscataway, NJ, USA, 2022; pp. 3023–3025. [Google Scholar]
  23. He, S.X.; Dong, J.N.; Liang, S.D.; Yuan, P.C. An approach to improve the operational stability of a bus line by adjusting bus speeds on the dedicated bus lanes. Transp. Res. Part C Emerg. Technol. 2019, 107, 54–69. [Google Scholar] [CrossRef]
  24. Hu, J.; Zhang, Z.H.; Xiong, L.; Wang, H.R.; Wu, G.Y. Cut through traffic to catch green light: Eco approach with overtaking capability. Transp. Res. Part C Emerg. Technol. 2021, 123, 102927. [Google Scholar] [CrossRef]
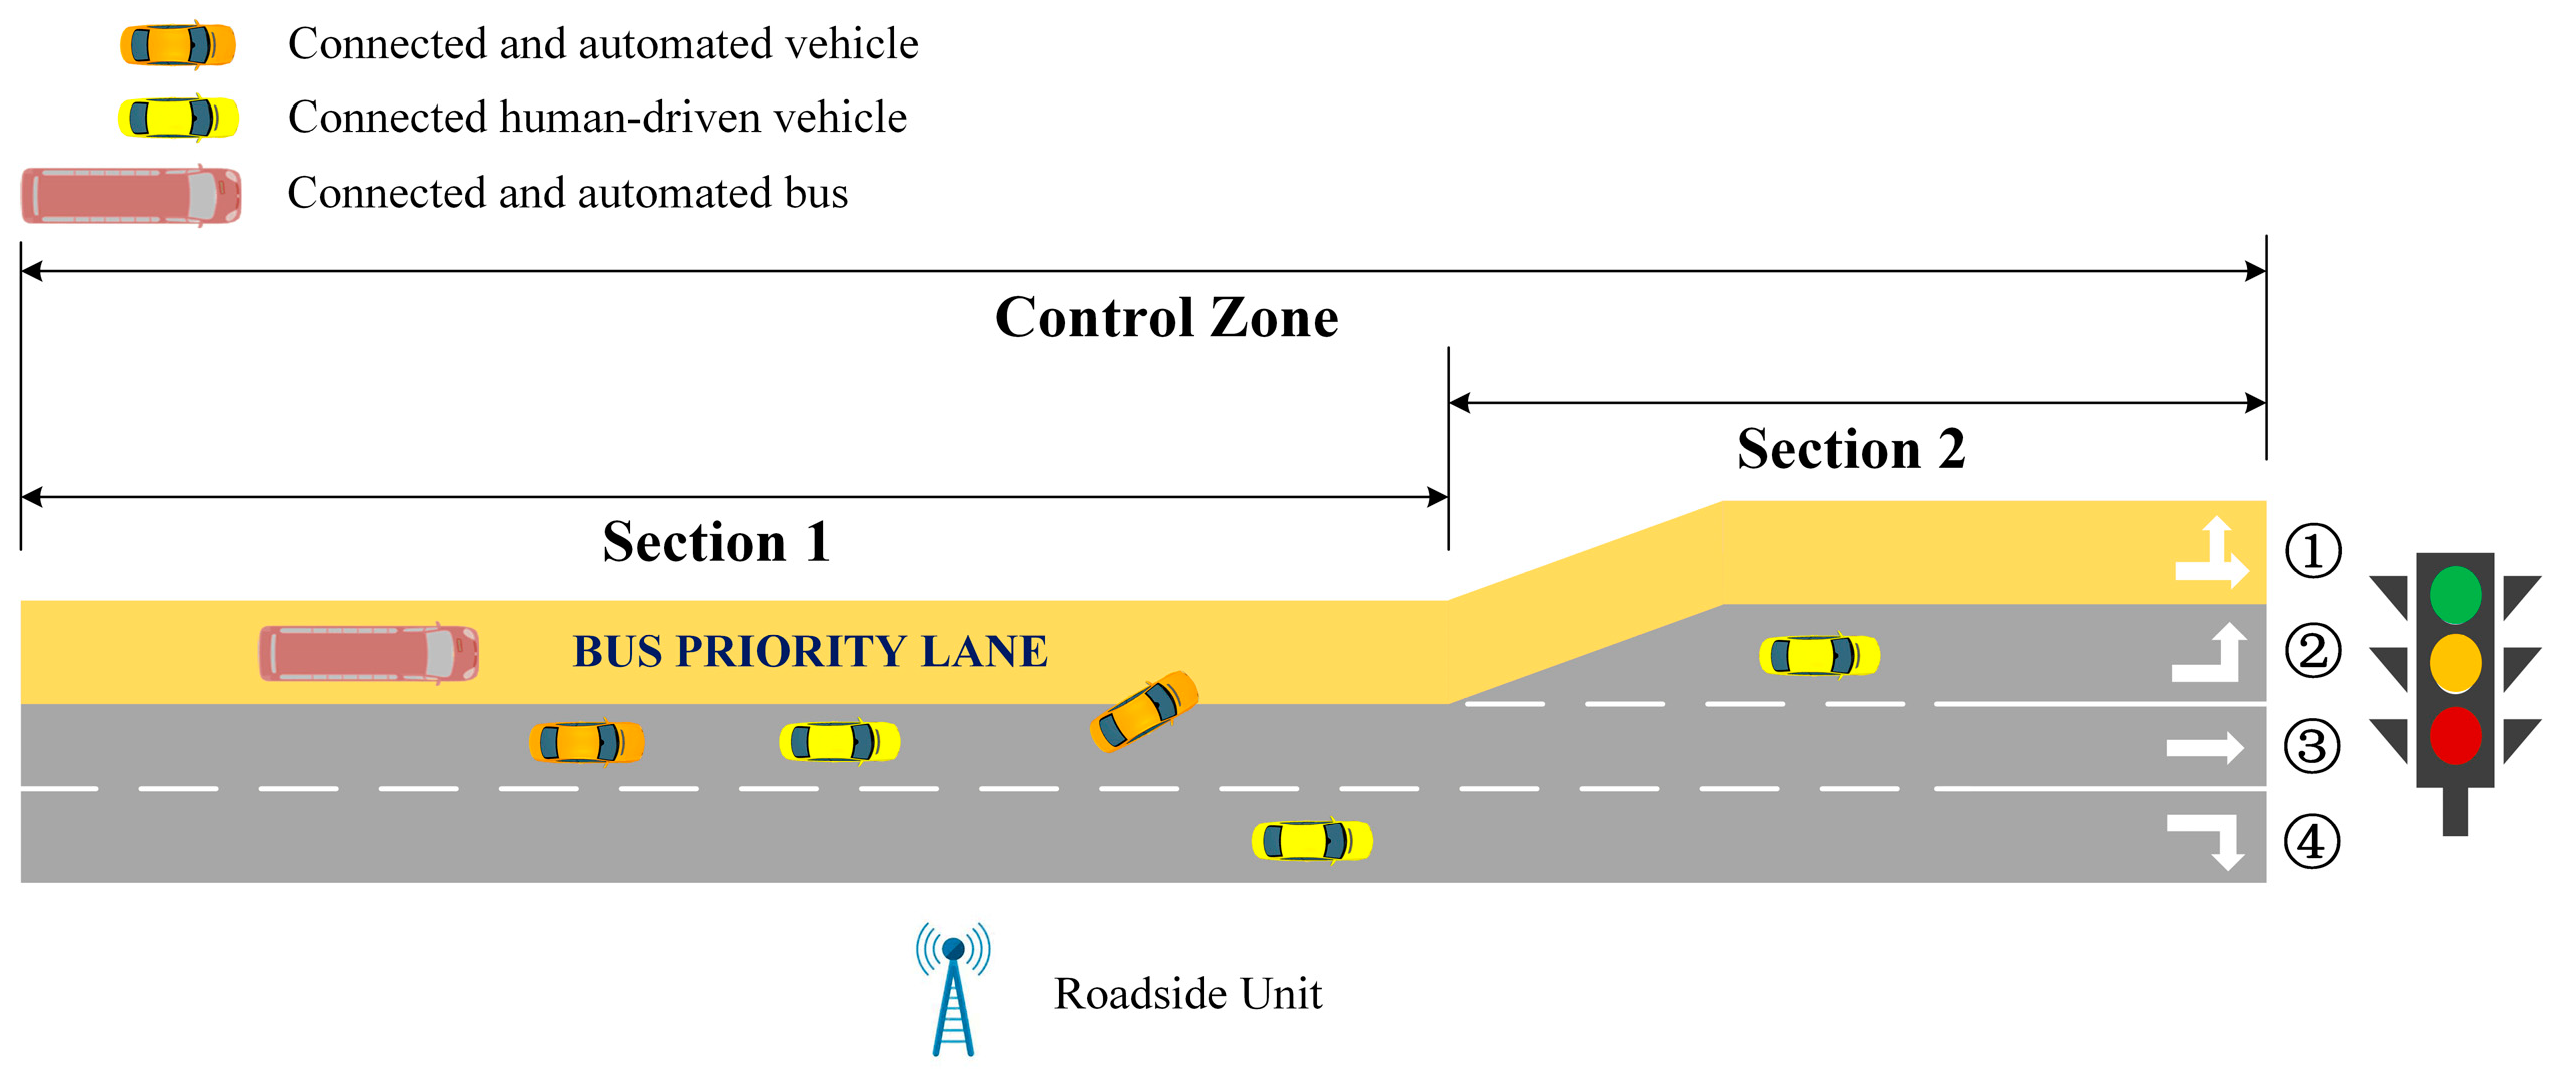
Figure 1. Illustration of the scenario.
Sustainability 15 07330 g001
Figure 2. Overall logic of eco-driving strategy.
Sustainability 15 07330 g002
Figure 3. Eco-driving decision-making module.
Sustainability 15 07330 g003
Figure 4. (a) Definition of SPV for the ego CAV with left-turning movement intention on the upstream section. (b) Definition of SPV for the ego CAV with left-turning movement intention on the downstream section. (c) Definition of SPV for the ego CAV with going-through movement intention.
Sustainability 15 07330 g004
Figure 5. Testbed in the simulation experiment.
Sustainability 15 07330 g005
Figure 6. The fuel consumption comparison between the non-control baseline and the proposed strategy under various CPR.
Sustainability 15 07330 g006
Figure 7. The fuel consumption comparison between the state-of-the-art strategy and the proposed strategy under various CPR.
Sustainability 15 07330 g007
Figure 8. The fuel consumption comparison between the non-control baseline and the proposed strategy under various demand levels.
Sustainability 15 07330 g008
Figure 9. The fuel consumption comparison between the state-of-the-art strategy and the proposed strategy under various demand levels.
Sustainability 15 07330 g009
Figure 10. The result of throughput comparison between the non-control baseline and the proposed strategy under various CPR.
Sustainability 15 07330 g010
Figure 11. The result of delay comparison between the non-control baseline and the proposed strategy under various CPR.
Sustainability 15 07330 g011
Figure 12. The result of throughput comparison between the state-of-the-art strategy and the proposed strategy under various CPR.
Sustainability 15 07330 g012
Figure 13. The result of the delay comparison between the state-of-the-art strategy and the proposed strategy under various CPR.
Sustainability 15 07330 g013
Figure 14. The result of throughput comparison between the non-control baseline and the proposed strategy under various demand levels.
Sustainability 15 07330 g014
Figure 15. The result of delay comparison between the non-control baseline and the proposed strategy under various demand levels.
Sustainability 15 07330 g015
Figure 16. The result of throughput comparison between the state-of-the-art strategy and the proposed strategy under various demand levels.
Sustainability 15 07330 g016
Figure 17. The result of delay comparison between the state-of-the-art strategy and the proposed strategy under various demand levels.
Sustainability 15 07330 g017
Figure 18. Trajectories of buses and CAVs sharing the BPL (demand level = 1.2).
Sustainability 15 07330 g018
Figure 19. Trajectories of buses and CAVs sharing the BPL (demand level = 1.4).
Sustainability 15 07330 g019
Figure 20. Trajectories of buses and CAVs sharing the BPL (demand level = 1.6).
Sustainability 15 07330 g020
Table 1. Simulation settings.
ParameterValue
Length of Section 1 (m)350
Length of Section 2 (m)150
Simulation time horizon (s)3900
Optimization time step (s)1
Cycle of signal time (s)60
Duration of red light (s)24
Duration of the going-through-movement green light (s)18
Duration of the left-turning-movement green light (s)18
Saturation flow rate (veh/h)1440
Departure time interval of buses (s)60
Proportion of left-turning-movement vehicles40%
Proportion of going-through-movement vehicles40%
Desired speed for buses (km/h)48
Desired speed for general vehicles (km/h)60
Maximum speed (m/s)20
Minimum speed (m/s)0
Maximum acceleration (m/s2)3.5
Minimum acceleration (m/s2)−4
Safe time headway (s)1.6
Reaction time (s)0.5
Length of the bus (m)10
Length of the general vehicle (m)4
Factor α 10
Factor β 1
Table 2. Speed and acceleration results of buses under the oversaturated demand level.
Demand LevelActual Speed
(km/h)
Actual Acceleration
(m/s2)
Desired Speed
(km/h)
Speed Error
(%)
1.247.990.0056480.02
1.448.010.0055480.02
1.647.960.0086480.08
Disclaimer/Publisher’s Note: The statements, opinions and data contained in all publications are solely those of the individual author(s) and contributor(s) and not of MDPI and/or the editor(s). MDPI and/or the editor(s) disclaim responsibility for any injury to people or property resulting from any ideas, methods, instructions or products referred to in the content.