Article

Analysis of Coal Floor Fault Activation Inducing Water Inrush Using Microseismic Monitoring—A Case Study in Zhaogu No. 1 Coal Mine of Henan Province, China

1
Civil and Resource Engineering School, University of Science and Technology Beijing, Beijing 100083, China
2
Beijing Anke Industrial Technology Co., Ltd., Beijing 100083, China
3
Henan Key Laboratory for Green and Efficient Mining & Comprehensive Utilization of Mineral Resources, Henan Polytechnic University, Jiaozuo 454000, China
*
Author to whom correspondence should be addressed.
Sustainability 2023, 15(9), 7361; https://doi.org/10.3390/su15097361
Submission received: 27 February 2023 / Revised: 17 April 2023 / Accepted: 25 April 2023 / Published: 28 April 2023
(This article belongs to the Special Issue Green and Scientific Design of Deep Underground Engineering)

Abstract

:
Previously conducted studies have established that mining activities can activate faults, which will cause floor water inrush disasters and cause loss of personnel and property. In order to reduce the possibility of water inrush disasters in mining, it is particularly important to study the dynamic characteristics and rules of floor fault activation under the influence of mining. In this work, firstly, a microseismic monitoring system was established in the working face to analyze the changes of microseismic indexes before and after grouting. It was found that grouting can enhance the strength of a rock mass and play a role in sealing the water channel. Secondly, the quadratic kernel function of microseismic event energy was established. It was found that the accumulation degree of microseismic events and the region of high energy kernel density increased with the decrease of the distance between the working face and the left boundary of the “analysis region”. Combined with a microseismic event index and water inflow, the activation process of the floor fault was divided into five stages. Finally, the plastic failure region of surrounding rock under different excavation steps was analyzed by numerical simulation, and the characteristics of fault activation were further explained. A method of taking measures to prevent water inrush in the “sign stage of fault activation” was proposed.

1. Introduction

Mine floor water inrush disasters are a kind of mining dynamic phenomenon that seriously endangers coal safety production in China. The essence of water inrush is that the underlying pressurized water breaks through the barrier of the water-repellent layer of the floor and flows into the goaf in the form of sudden or delayed flow along the water conduit. According to the statistics, more than 80% of the water inrush is related to the fault [1,2,3]. Therefore, there is an urgent need to study the fault activation of a coal floor and reduce the occurrence of water inrush accidents for safe mining in China.
Many studies have focused on the influence of fault activation on the mechanism and predication of water inrush in coal mining by numerical simulation and microseismic monitoring methods [4,5,6]. One study [7] conducted numerical analyses to study fault activation by mining activities and found that maximum fault slip rates were associated with the maximum increments of relative dynamic shear displacement. Another study [8] adopted static boundary element modeling to simulate seismic tremors associated with a fault slip in a particular mining environment and found that excessive shear stress leads to a fault slip. The authors of [9] established a simplified mechanical model, which contains multiple factors relating to the activation and evolution of insidious water-conductive faults and the results indicated that fault activation was influenced by many factors, predominant among which were the burial depth of the insidious fault, the friction angle of the fault plane, the face advance direction and pore water pressure. In article [10], the authors studied the fault activation mechanism by a boundary element method numerical modeling and found that both horizontal stress and vertical stress had an effect on the fault. Article [11] adopted the extended finite element numerical simulation software to study the stress evolution and deformation failure rules of a coal seam containing a fault floor and found that, when the mining coal seam was close to the fault, the fault zone rotated and deformed. The authors of article [12] conducted a numerical study on groundwater outburst along the fault zones in coal mines, and divided the floor strata into three zones: a mining-induced fracture zone, an intact zone and a fault activation zone, and found that the intact zone was the key element to resisting groundwater outburst. In [13], the authors established the Fisher’s discriminant model for water inrush and predicted parting areas of the Qidong coal mine. They found that the accuracy of the model reached 90.4%. The authors of [14] analyzed the weight of water pressure and principal stress near the fault and proposed a method to predict the location of water inrush based on the objective weight of the water pressure at different locations. By using a numerical simulation method, the authors of article [15] studied the fault activation under different fault drops with the help of RFPA software and found that the fault drop would not activate the fault and the increase of the drop would reduce the possibility of a water inrush disaster. Through the analysis of focal solutions of seismic events, it was found that faults are activated through reduced normal stresses on the fault [16]. The article pointed out that the cause of post-mining-induced fault reactivation (in longwall-mined coal fields) was not fully understood but was thought to be related primarily to groundwater flows and mine water rebound [17]. Article [18] simulated the fault lagging water inrush process and proposed the concept of the potential water inrush channel with a time effect. The simulation results were largely consistent with mining practices. In article [19], the authors conducted numerical results of coal floor activation by using the extended finite element method and argued that if the combined effect of geostatic and tectonic pressure exceeded the fluid pressure, the possibility of water inrush increases with the mining depth. The authors of papers [20] and [21] studied the stress variation on the surface of a fault under two different mining advancing directions and found that when mining advanced from the foot wall, the fault zone stayed in the compaction state where the hanging wall and foot wall were squeezed together, which was unfavorable for a water inrush hazard. The authors of [22] used a numerical simulation to study the fault activation driven by the mining load and hydraulic loads, and found that the smaller the fault dip is, the earlier the water inrush channel will be formed. Article [23] simulated the pathway of water inrush under the coupled effects of stress induced by mining and confined water pressure. The results showed that as the working face advances, the confined water would flow upward along the fault. The paper used numerical analyses to evaluate the strata failure and water inflow enhancements caused by coal mining operations and found that the vertical groundwater flow near the damage zone was enhanced, resulting in the discharge of the underlying aquifers [24]. The authors of [25] applied the digital terrain model to calculate the accumulation of water. This method provides a reference for the identification of the water level in the fault area and the prevention of water inrush accidents. In article [26], the authors pointed out that geotechnology with backfill will minimize the development of cracks in the undermined salt mass and ensure the safety of waterproof rock strata, thus protecting the mine from emergency floods. Article [27] used finite difference software to analyze the laws of deformation and failure of the through-fault floor and fault activation under two different coal pillar width settings, and determined that the safety width of the waterproof coal pillar was 80 m.
In recent years, microseismic monitoring has been a widely used technique in rock engineering, such as mining engineering [28,29,30] and slope engineering [31]. In China’s coal and metal mines, the microseismic monitoring technique is an effective way to identify the water inrush pathway. The authors of [32] adopted microseismic monitoring technology to monitor the water inrush channels and found that the microseismic signals in the water inrush channel were different from other microseismic signals. In [29], the authors investigated the activation failure characteristics of the mining floor fault above a confined aquifer by using the microseismic monitoring technique and the results showed that when the workface advances to the fault with a distance of approximately 60 m, the floor fault showed activation signs. In article [33], the authors simulated the stress distribution and seepage characteristics of the floor during mining by COMSOL Multiphysics software and found that the water inrush point occurred when the floor of the working face was 35 m away from the fault. Article [34] introduced an approach that uses microseismic multi-parameters, including the cumulative apparent volume, energy index, spatial correlation length and fractal dimension to forecast ground pressure hazards in deep metal mines. Article [35] analyzed the space–time distribution of microseismic events in a coal mine to identify the potential water inrush areas in the coal floor. The authors of article [36] adopted the microseismic monitoring technique on a fracture zone to monitor the forming process of the water inrush pathway. The results showed that the location of the water inrush pathway could be obtained. In article [31], the authors established a microseismic monitoring system and analysis method for assessing a potential seepage channel in the Zhangmatun iron mine. The authors of [37] adopted the microseismic monitoring system to warn workers of a coal mine floor water inrush and the results showed that the microseismic events of the floor were mainly distributed in three areas, namely, the structure affecting a microseismic area, the mining itself affecting a microseismic area and the lag microseismic area. The authors of [38] adopted the microseismic monitoring system to monitor the water damage of a coal mine floor, and found that by monitoring the activation signal of hidden faults in the working face of coal mining, the water inrush from the coal seam floor caused by the faults can be effectively predicted.
By analyzing the information above, it can be noted that a water inrush disaster caused by floor activation under the influence of mining is a very topical issue. The authors above have conducted in-depth research on fault activation mechanisms and microseismic parameters before and after water inrush, but how to use microseismic monitoring technology to identify water inrush channels and when to take reinforcement measures requires further study. Therefore, the purpose of this study is to adopt microseismic monitoring technology to reduce the possibility of a mine floor water inrush disaster. In order to do this, it is necessary to solve the following tasks: (1) Determine the characteristics of microseismic events in the process of floor activation and explain and analyze the causes and rules of a rock mass failure; (2) The plastic failure characteristics of surrounding rock under different excavation steps are studied to further explain the characteristics of the fault activation process. The experimental results are expected to provide important insights into the study of water inrush prevention and control caused by floor fault activation.

2. Engineering Conditions of Zhaogu No. 1 Coal Mine

Zhaogu No. 1 coal mine, which is located in the Jiaozuo coal field of northern Henan Province (Figure 1, created by the authors), has been mined for more than 10 years. The main minable coal seam is seam numbers two and one, and the authorized productive capacity is 200 Mt/a. The 16001 working face is the first full height working face in Zhaogu No. 1 coal mine and the mining height ranges from 5.5 to 6.0 m. The standard elevation of the roof ranges from −429.9 to −490.0 m and the corresponding site at the ground surface is from +85.9 m to +87.1 m. The strike length and trend width of the 16001 working face are 901.5 m and 205.5 m, respectively.
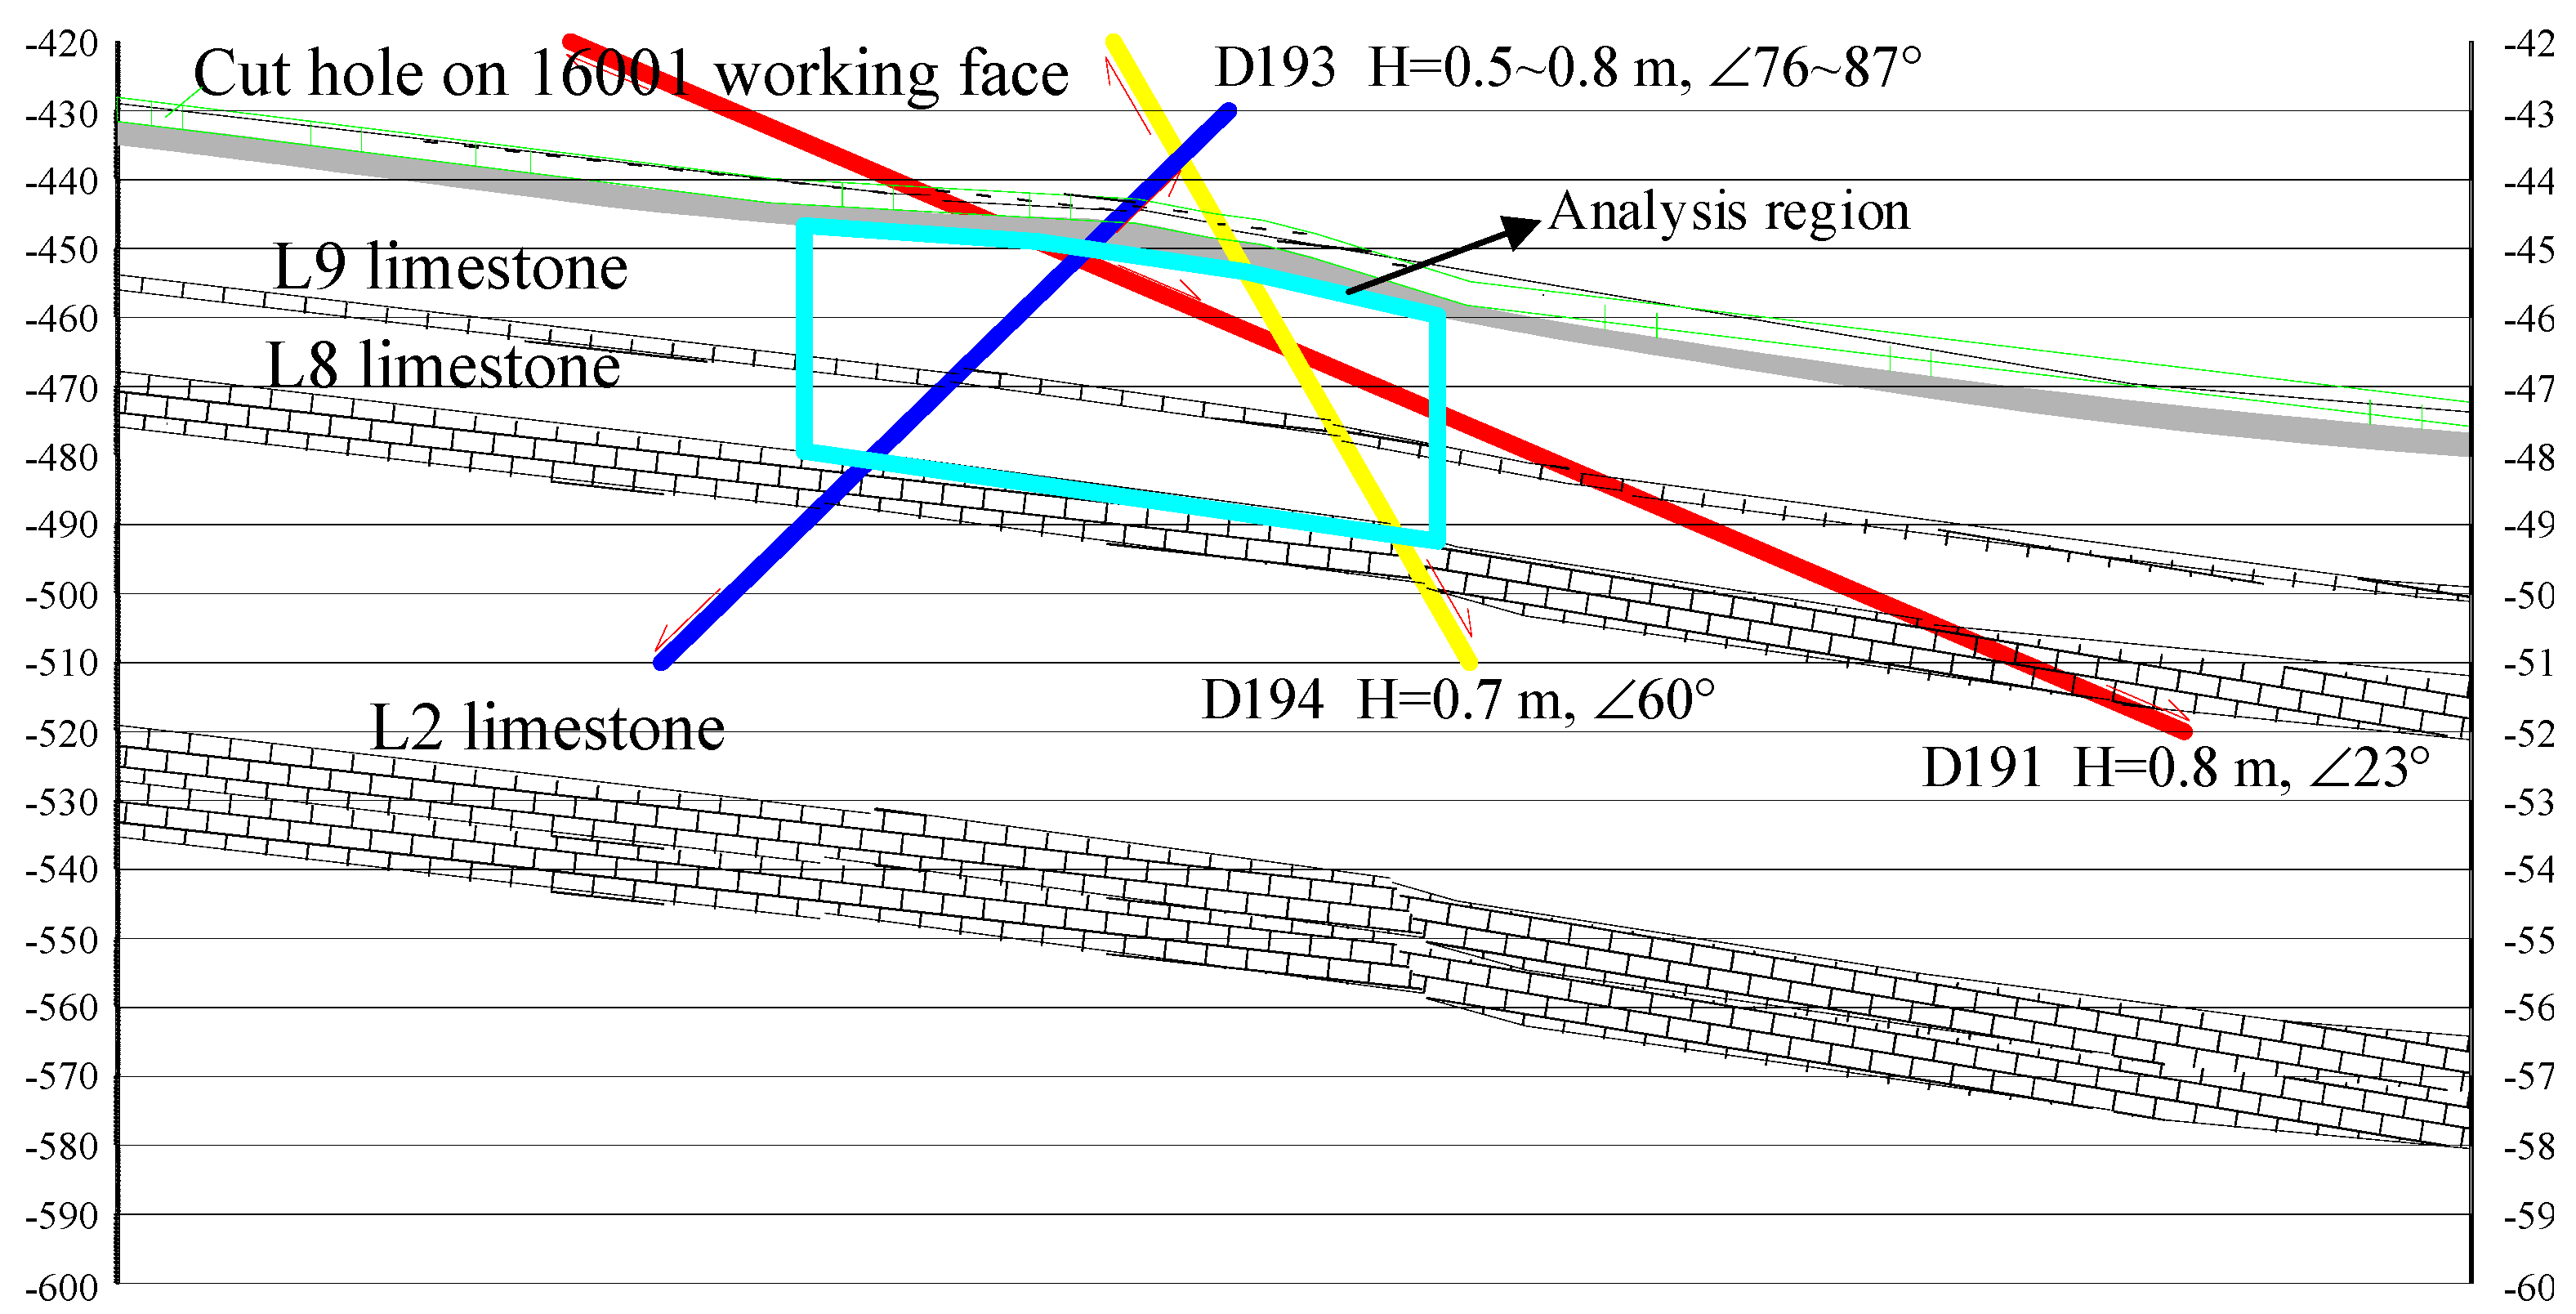
Figure 2 shows the profile map along the ventilation roadway of the 16001 working face. The green line represents the mining area of coal seams. There are three floor aquifers of the 16001 working face, namely L9, L8 and L2. The L9 aquifer is a water-free limestone layer at a distance of 16.4~20.5 m from the floor of the coal seam, and the average thickness is 2 m. The L8 limestone aquifer is the direct water source, with an average thickness of 8.0 m, a distance of 26.0~8.0 m from the floor of the coal seam, and a water pressure of 5.0~5.3 MPa. The water inrush coefficient is greater than 0.1, and there is a risk of water inrush. The average thickness of the L2 limestone is 16.1 m, the upper distance from the coal floor is 88.3~98.8 m, and the water pressure is 6.1~6.7 MPa. The water inrush coefficient is less than 0.1.
According to the actual revelation during the working face roadway tunnelling and the three-dimensional seismic data, there are three faults at the section that is 100~200 m from the cut hole on the 16001 working face. The specific attitude of the faults is shown in Table 1.

3. Floor Fault Activation Law Based on Microseismic Monitoring

3.1. The Layout of Microseismic System of 16001 Working Face

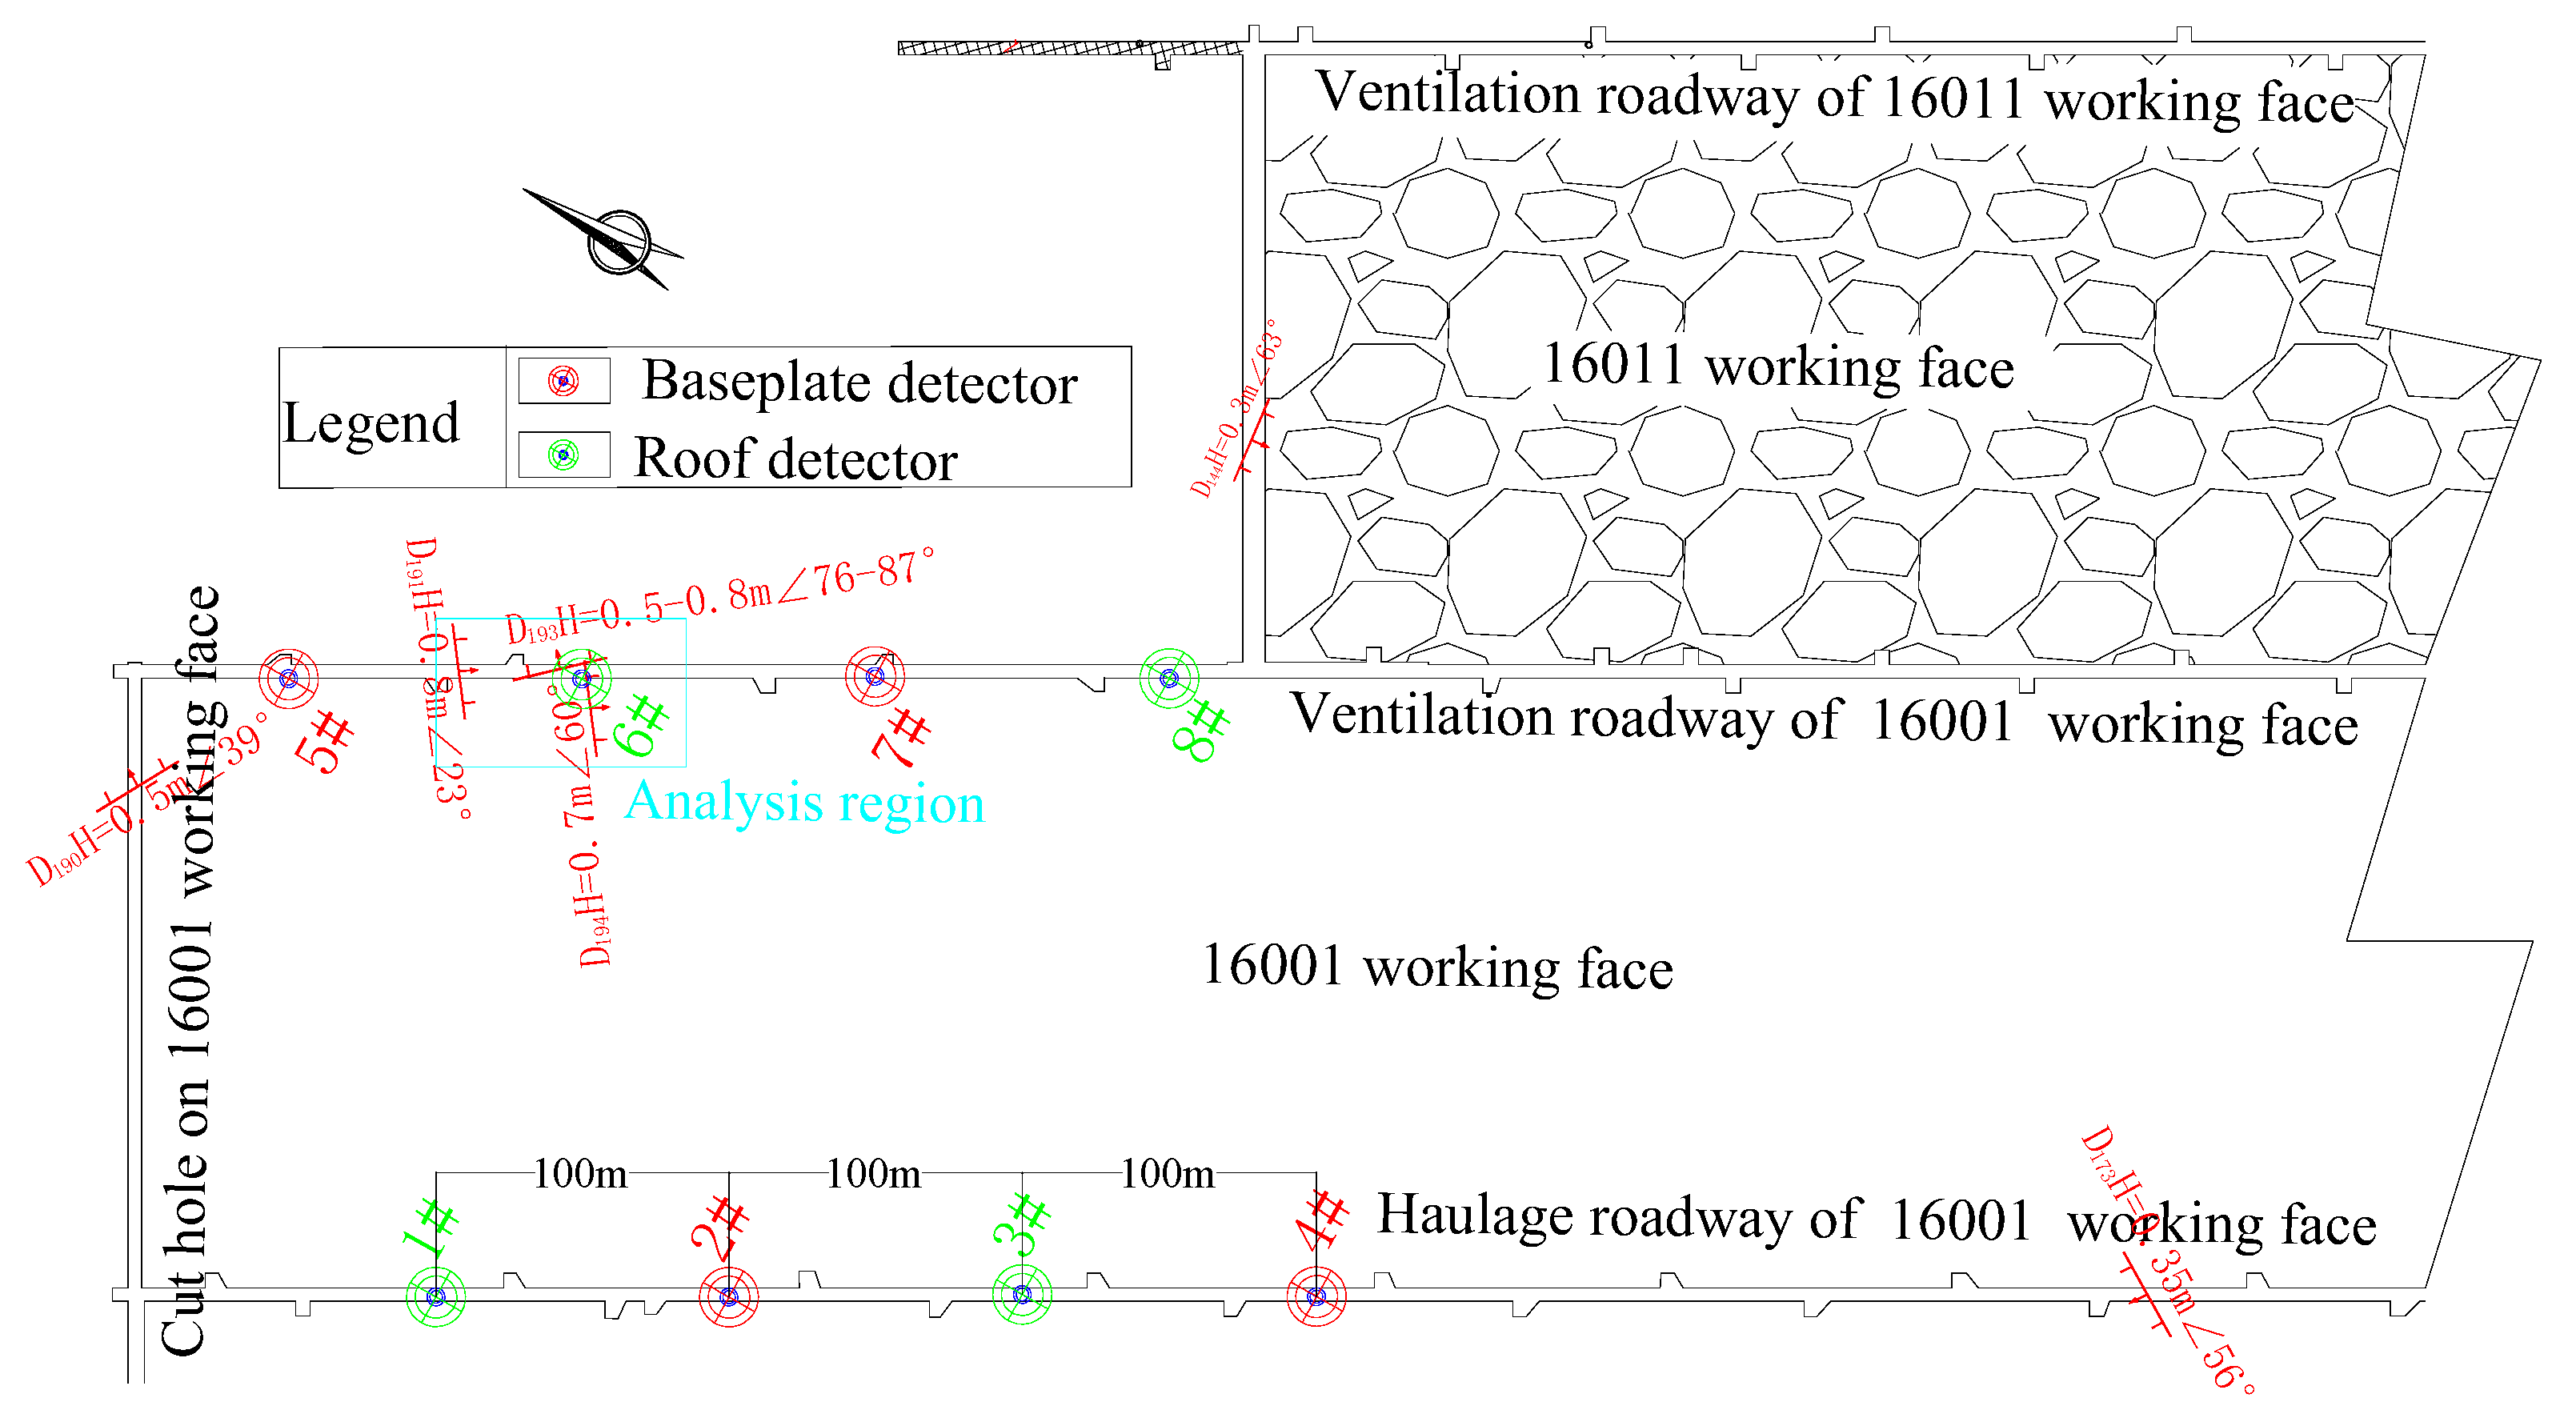
In order to achieve the purpose of real-time monitoring of the failure process in the fault floor area affected by mining, a KJ551 high-precision microseismic monitoring system produced by Beijing Anke Xingye Science and Technology Co., Ltd., Beijing, China. was adopted in the floor of the 16001 working face. The sensor response frequency range of the microseismic system is 0.1~600 Hz, and the sensor sensitivity is 110 V/m/s. According to the requirements of the monitoring purpose and the specific situation of the site, the microseismic network was laid out with a spatial network, and four sets of geophones were arranged on the working surface and the lower trough, respectively. A geophone in the same trough was installed with a deep hole interval between the top and bottom plates, and the horizontal distance between the two geophone pairs was 100 m. The deep hole installation position of the top plate was located 35 m vertically upward. The installation position of the deep hole in the bottom floor was 15 m vertically down from the bottom floor. After the geophone was sent to the bottom of the hole, cement slurry was injected into the surrounding rock for coupling. The network layout is shown in Figure 3.
The microseismic monitoring system in the 16001 working face was put into operation on 18 January 2018, and shot calibration was carried out in the roadway and the lower roadway of the working face on 24 January and 4 February, respectively. The eight geoscilloscope channels of the two calibration guns received vibration signals, and the four channels with the best waveform quality were selected, respectively, for wave velocity calculation. The calculation results are shown in Table 2. The numbers in Table 2 represent the detectors in the Figure 3. The average measured wave velocity of 3437 m/s was selected as the wave velocity value of the microseismic system. The calibration events were calculated based on the wave velocity values set above, and the results are shown in Table 3. The error ranges of the three axes for the two calibrations were 0~4 m, and the average errors of the three axes were 1.77 m and 1.97 m, respectively. The analysis results show that the positioning accuracy met the research requirements.

3.2. Monitoring Results of Water Inflow and Microseismic Events

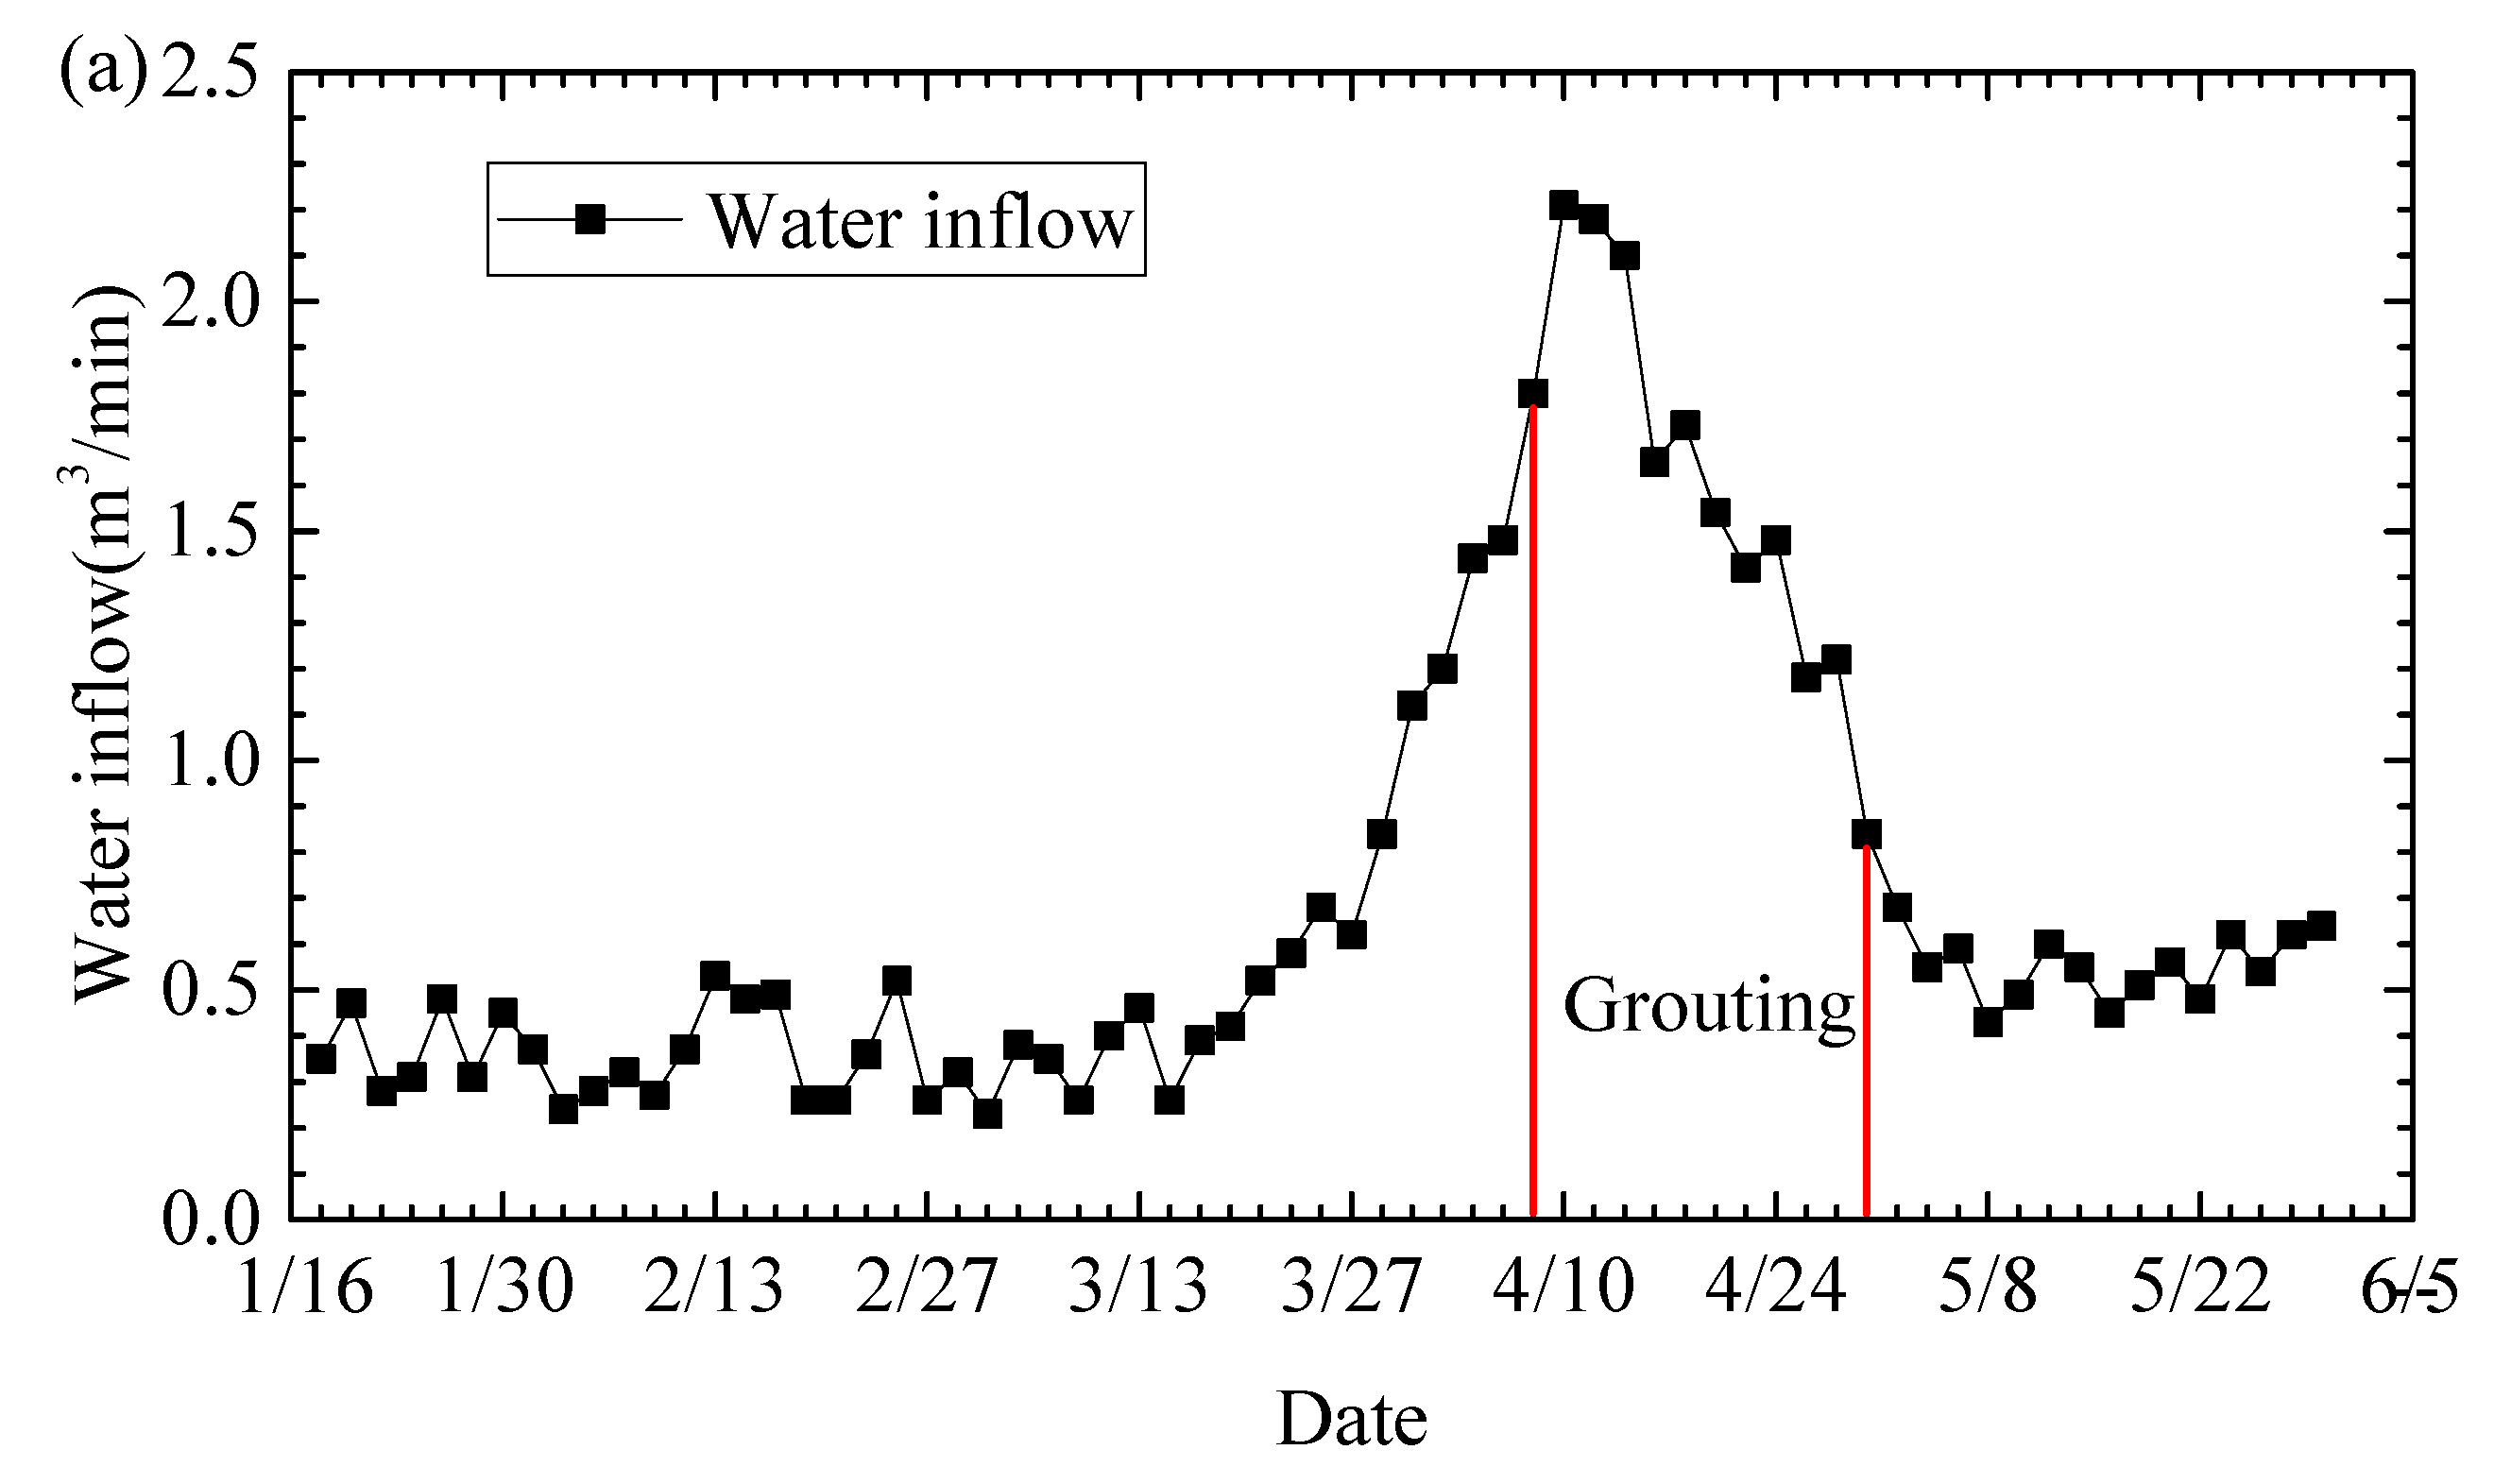
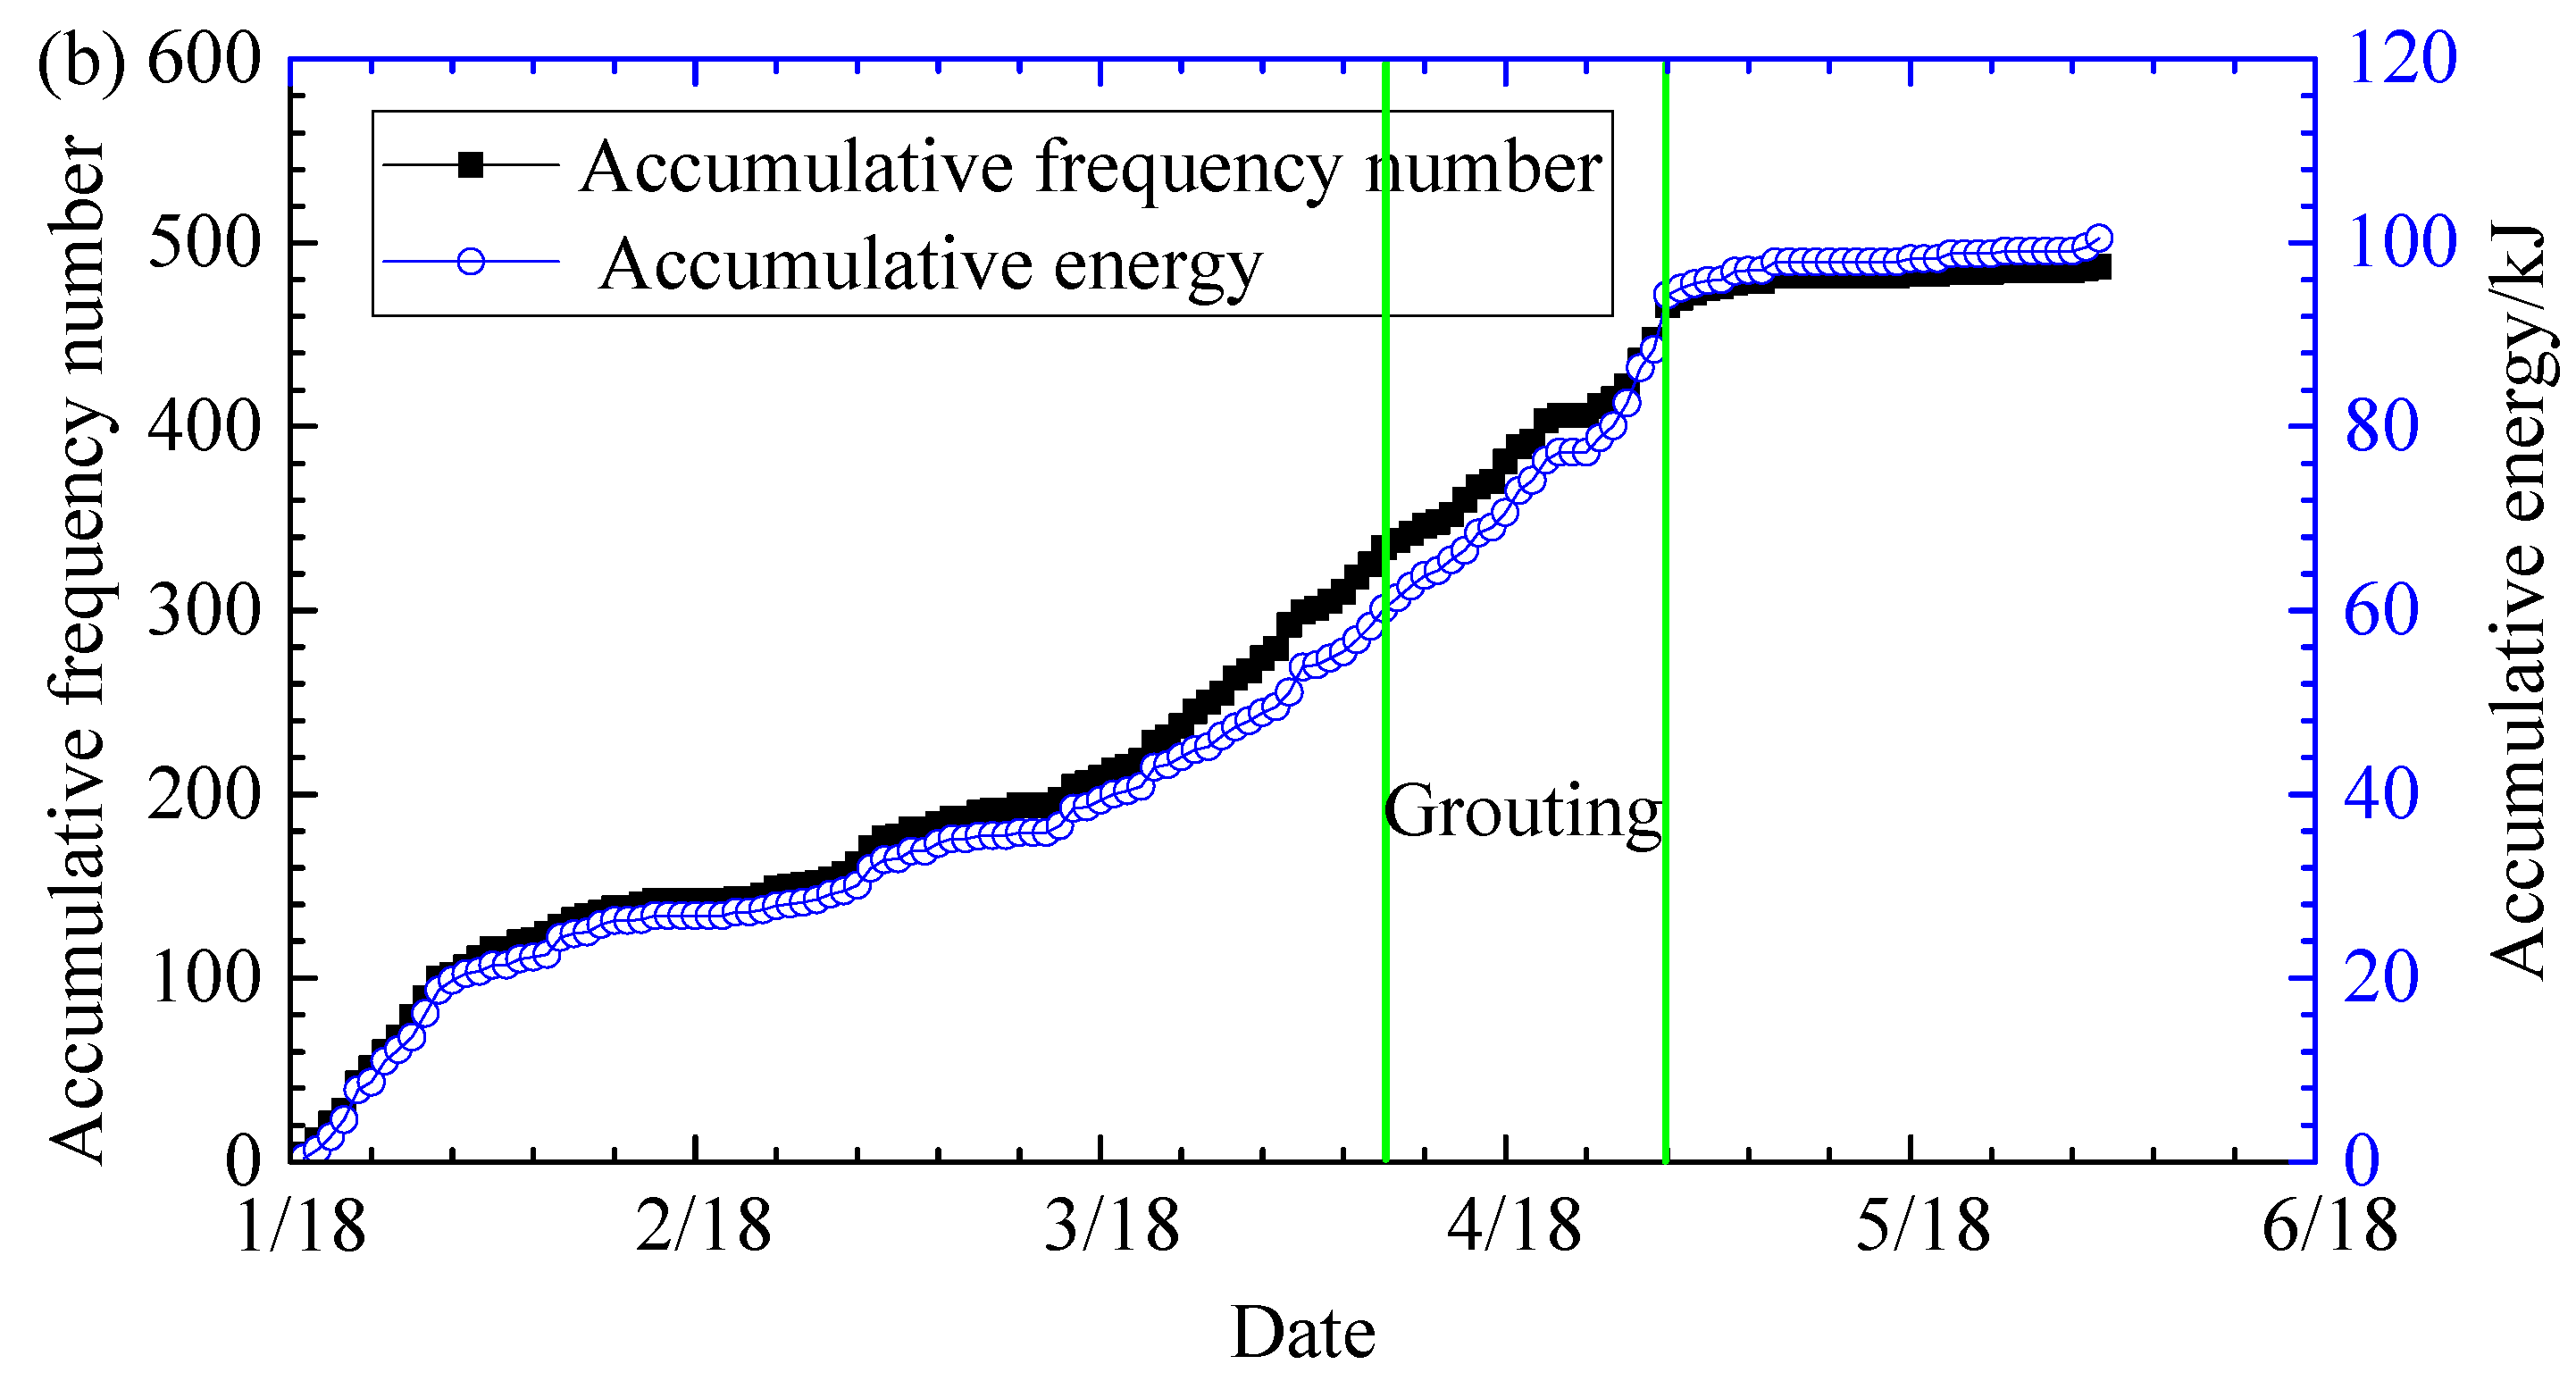
The water inflow of the 16001 working face led by fault activation and the accumulative frequency number and energy of microseismic events in the “analysis region” that changed with the date can be seen in Figure 4. According to the observation record of the water inflow on the working face (see Figure 4a), the water inflow increased sharply after 27 March. It was found that there was obvious water gushing in the bracket area on the upper part of the working face. In order to prevent the fault from continuing to activate and form a strong water channel, which could cause water inrush on the working face, grouting reinforcement was carried out on the floor from 8 April to 30 April, which can be seen in Figure 4.
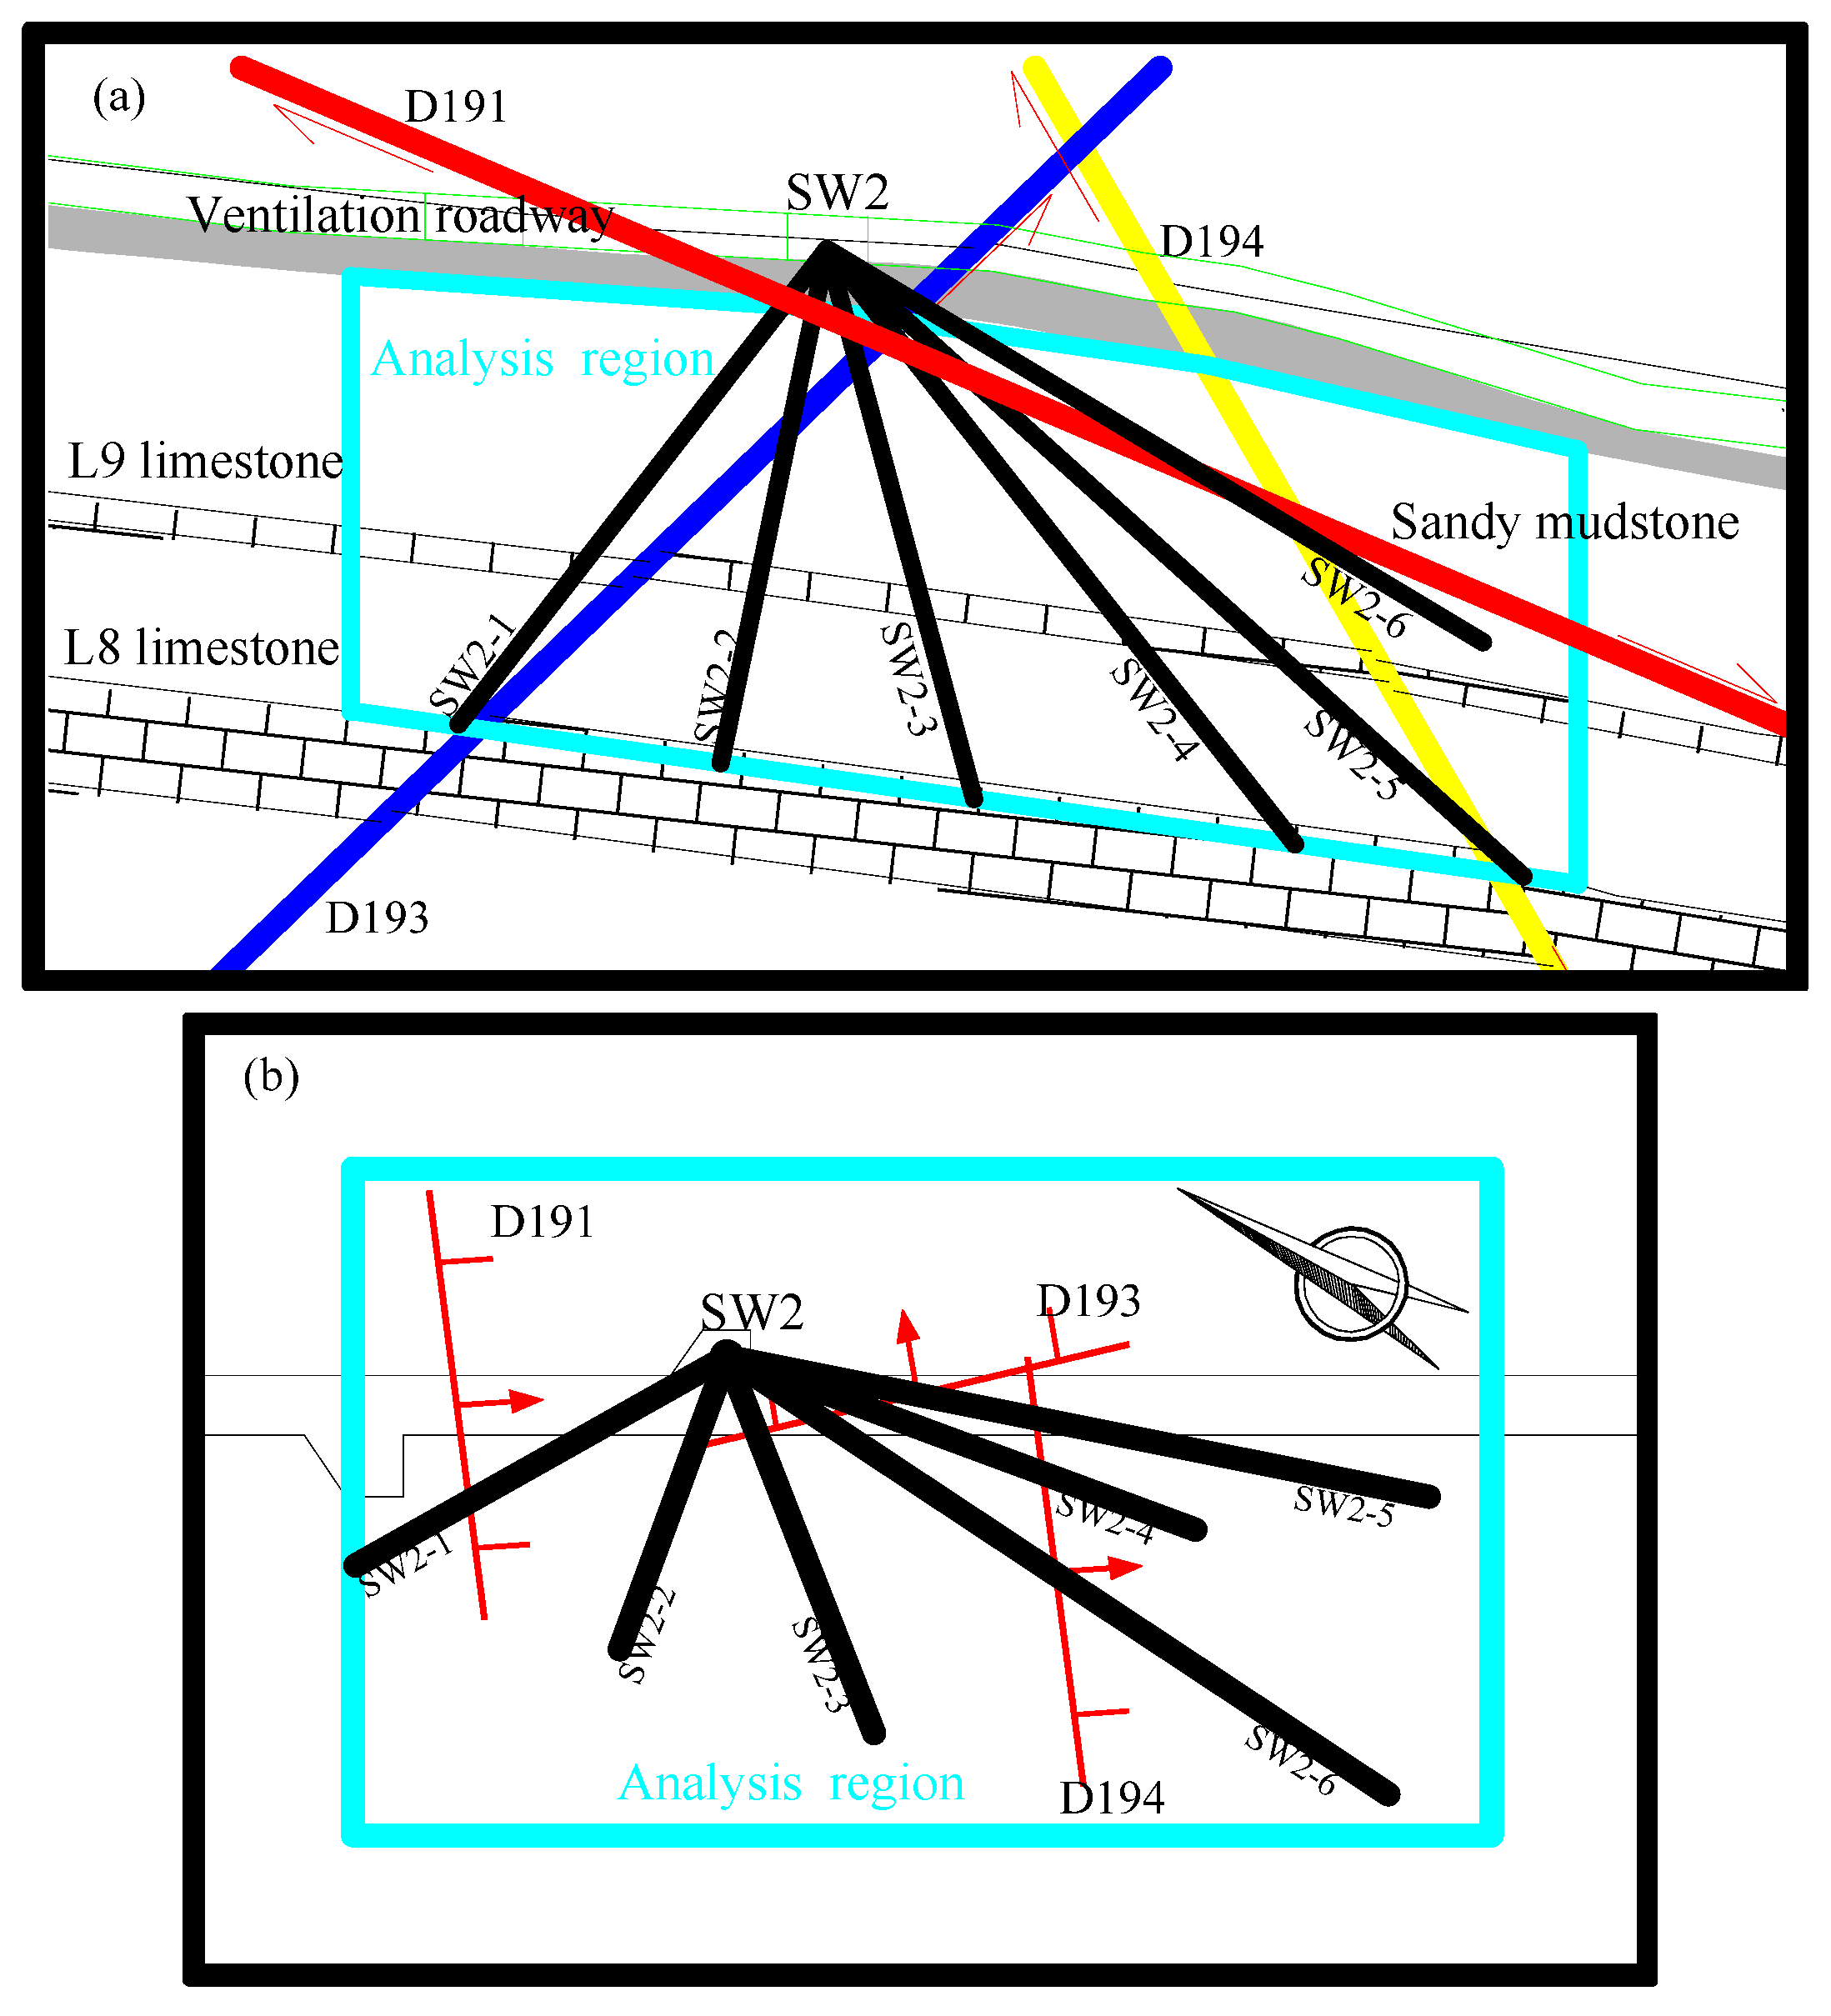
In order to prevent the occurrence of a water inrush accident, grouting was carried out in the SW2 drilling field outside the roadway on the working face. A total of 6 grouting boreholes were constructed, with their plane and section as shown in Figure 5. The borehole parameters are shown in Table 4.
From Table 4 and Figure 5a, one can observe that the SW2-1~5 drilling hole’s final location was L8 limestone. The final location of the drilling hole of SW2-6′s was sandy mudstone. According to Figure 5, the location of the fault activation was covered by grouting. The grouting was conducted using 42.5 ordinary silicate cement: the water–cement ratio was 1:0.3~1:1, the grouting pressure was 8 MPa and the grouting period was from 8 April to 30 April. It can be seen from Figure 4a that the water inflow of the working face firstly increased and then decreased rapidly during grouting, indicating that grouting played a significant role in sealing the water channel. It can be seen from Figure 4b that the accumulated frequency number and accumulated energy increment of microseismic events in the “analysis region” had been significantly reduced after grouting, indicating that the strength of the rock mass in the “analysis region” had been increased after grouting, and it was difficult to be destroyed under the influence of mining, resulting in the decrease of the microseismic index.

3.3. Analysis of Microseismic Monitoring Results

Under the double disturbance of mining and aquifer water pressure, a local damage tensile stress or shear stress state will occur in the rock mass of the water-resisting layer of the floor, and a micro-fracture will occur inside the rock mass after reaching the ultimate strength of the material, which will be displayed as microseismic events in the microseismic monitoring system. Under the influence of external forces, cracks in some weak areas of the rock mass (faults, collapse columns, etc.) gather in large numbers, which is manifested in the microseismic event cluster in the microseismic monitoring system.
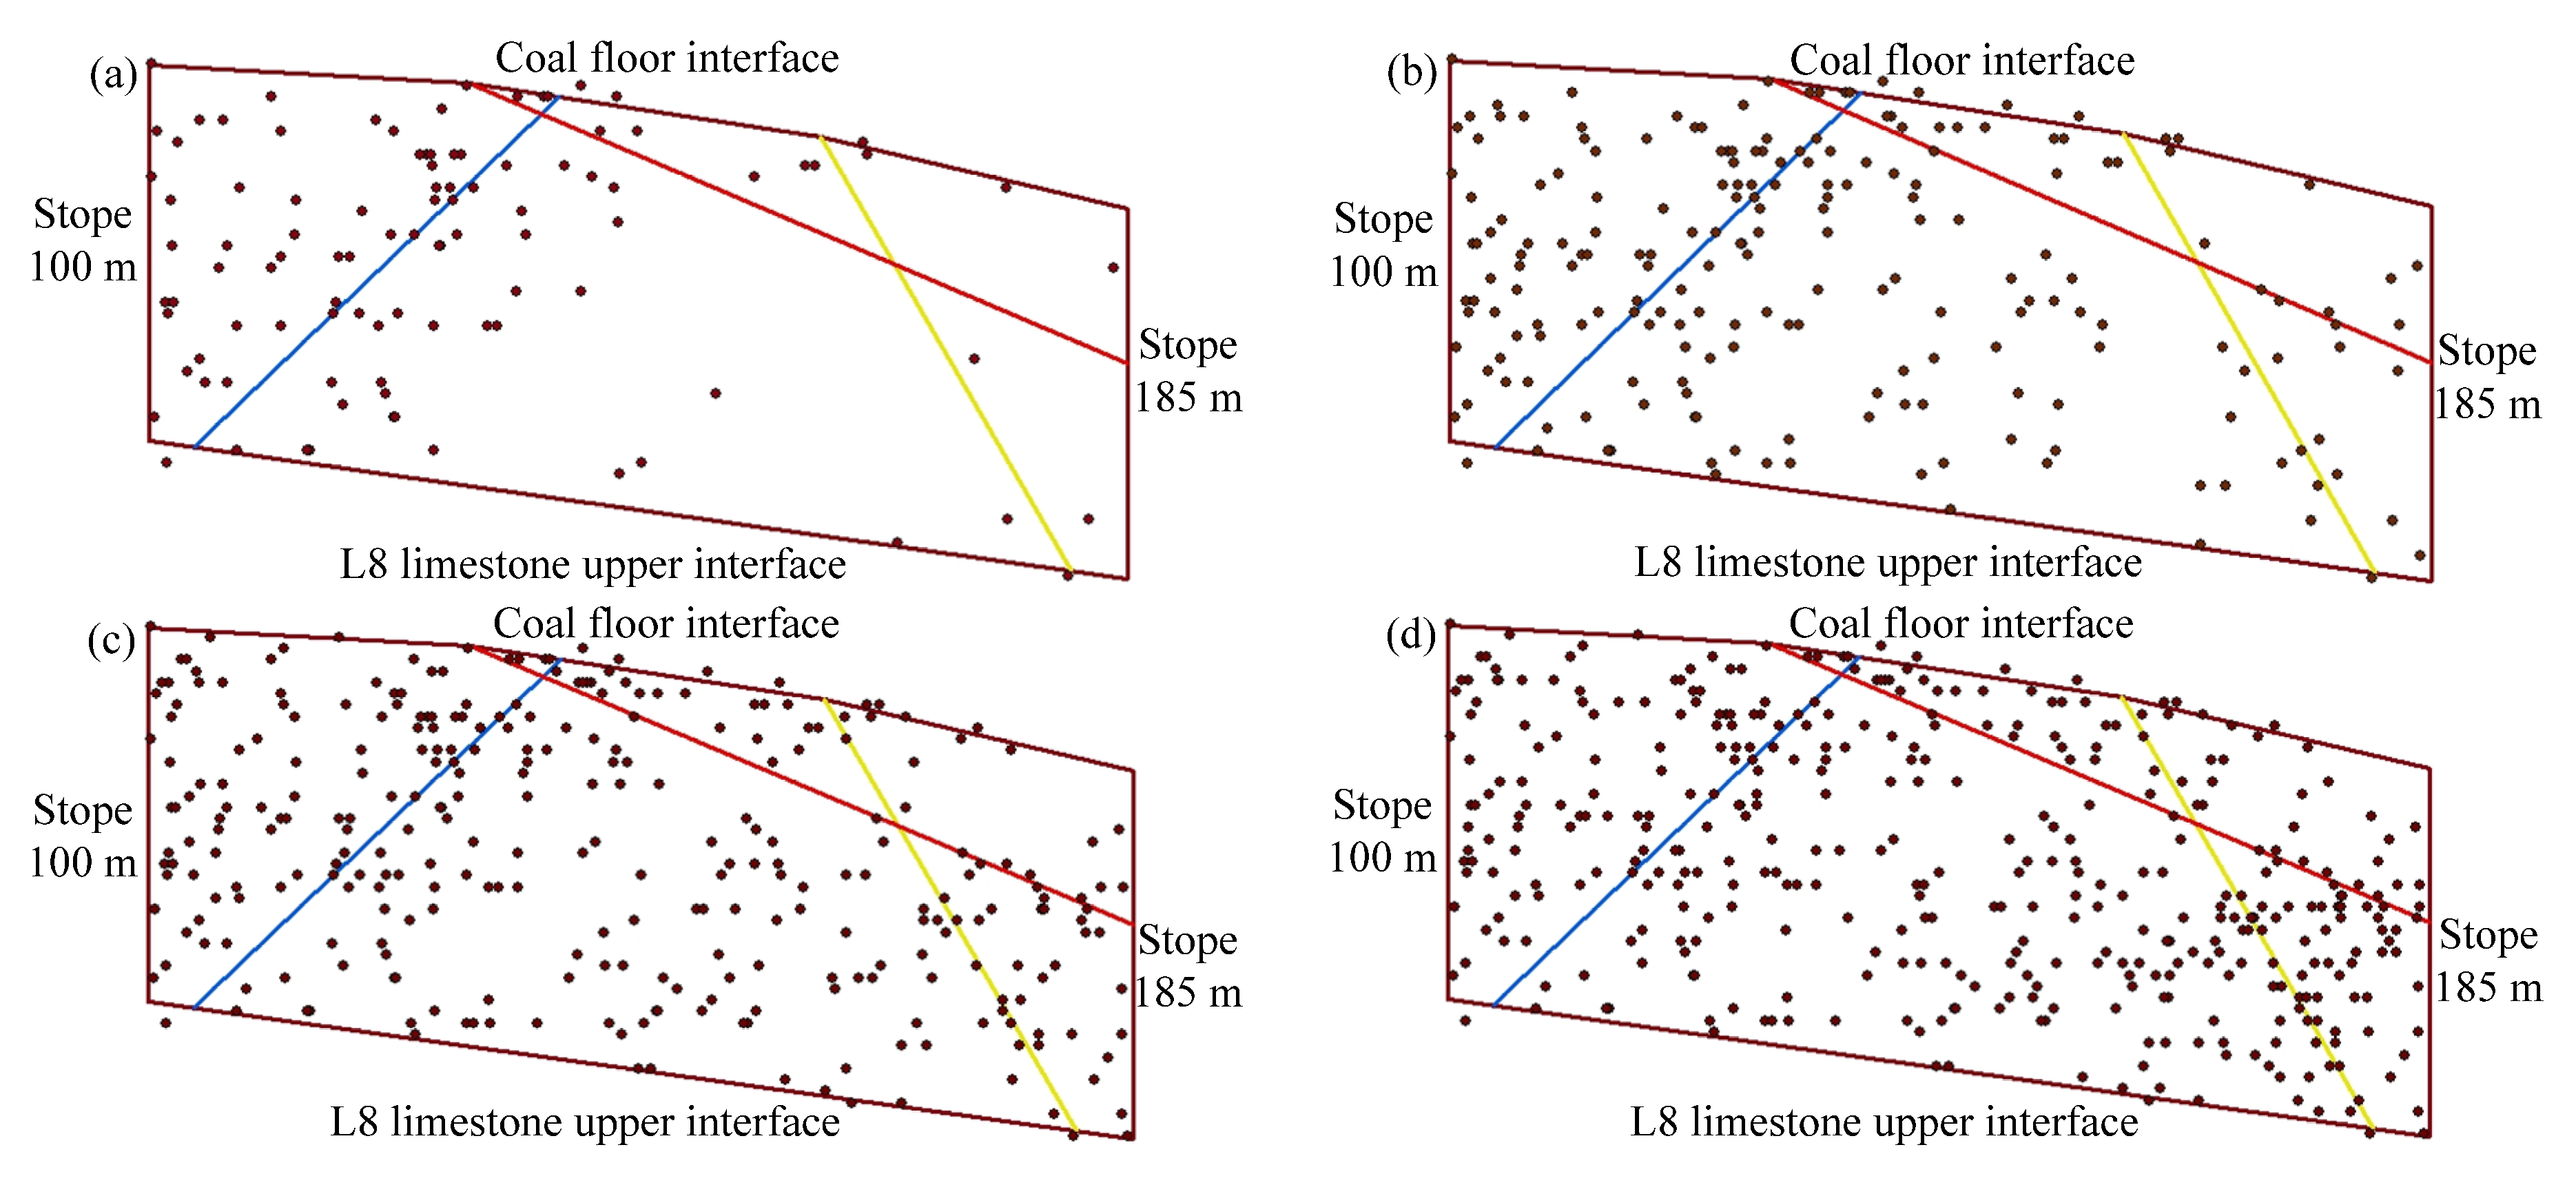
According to the disclosure and exploration results, the influence areas of faults D191, D193 and D194 on the water-barrier layer of the floor are divided, which are the “analysis region” with a cyan block box in Figure 2 and Figure 3. Since the beginning of the operation of the microseismic system on 18 January, there have been events located in the “analysis region”. Until the advance of the working face by 255 m on 31 May, there were no more microseismic events located in the “analysis area”. The distribution evolution process of microseismic events in the “analysis region” during this period are shown in Figure 6.
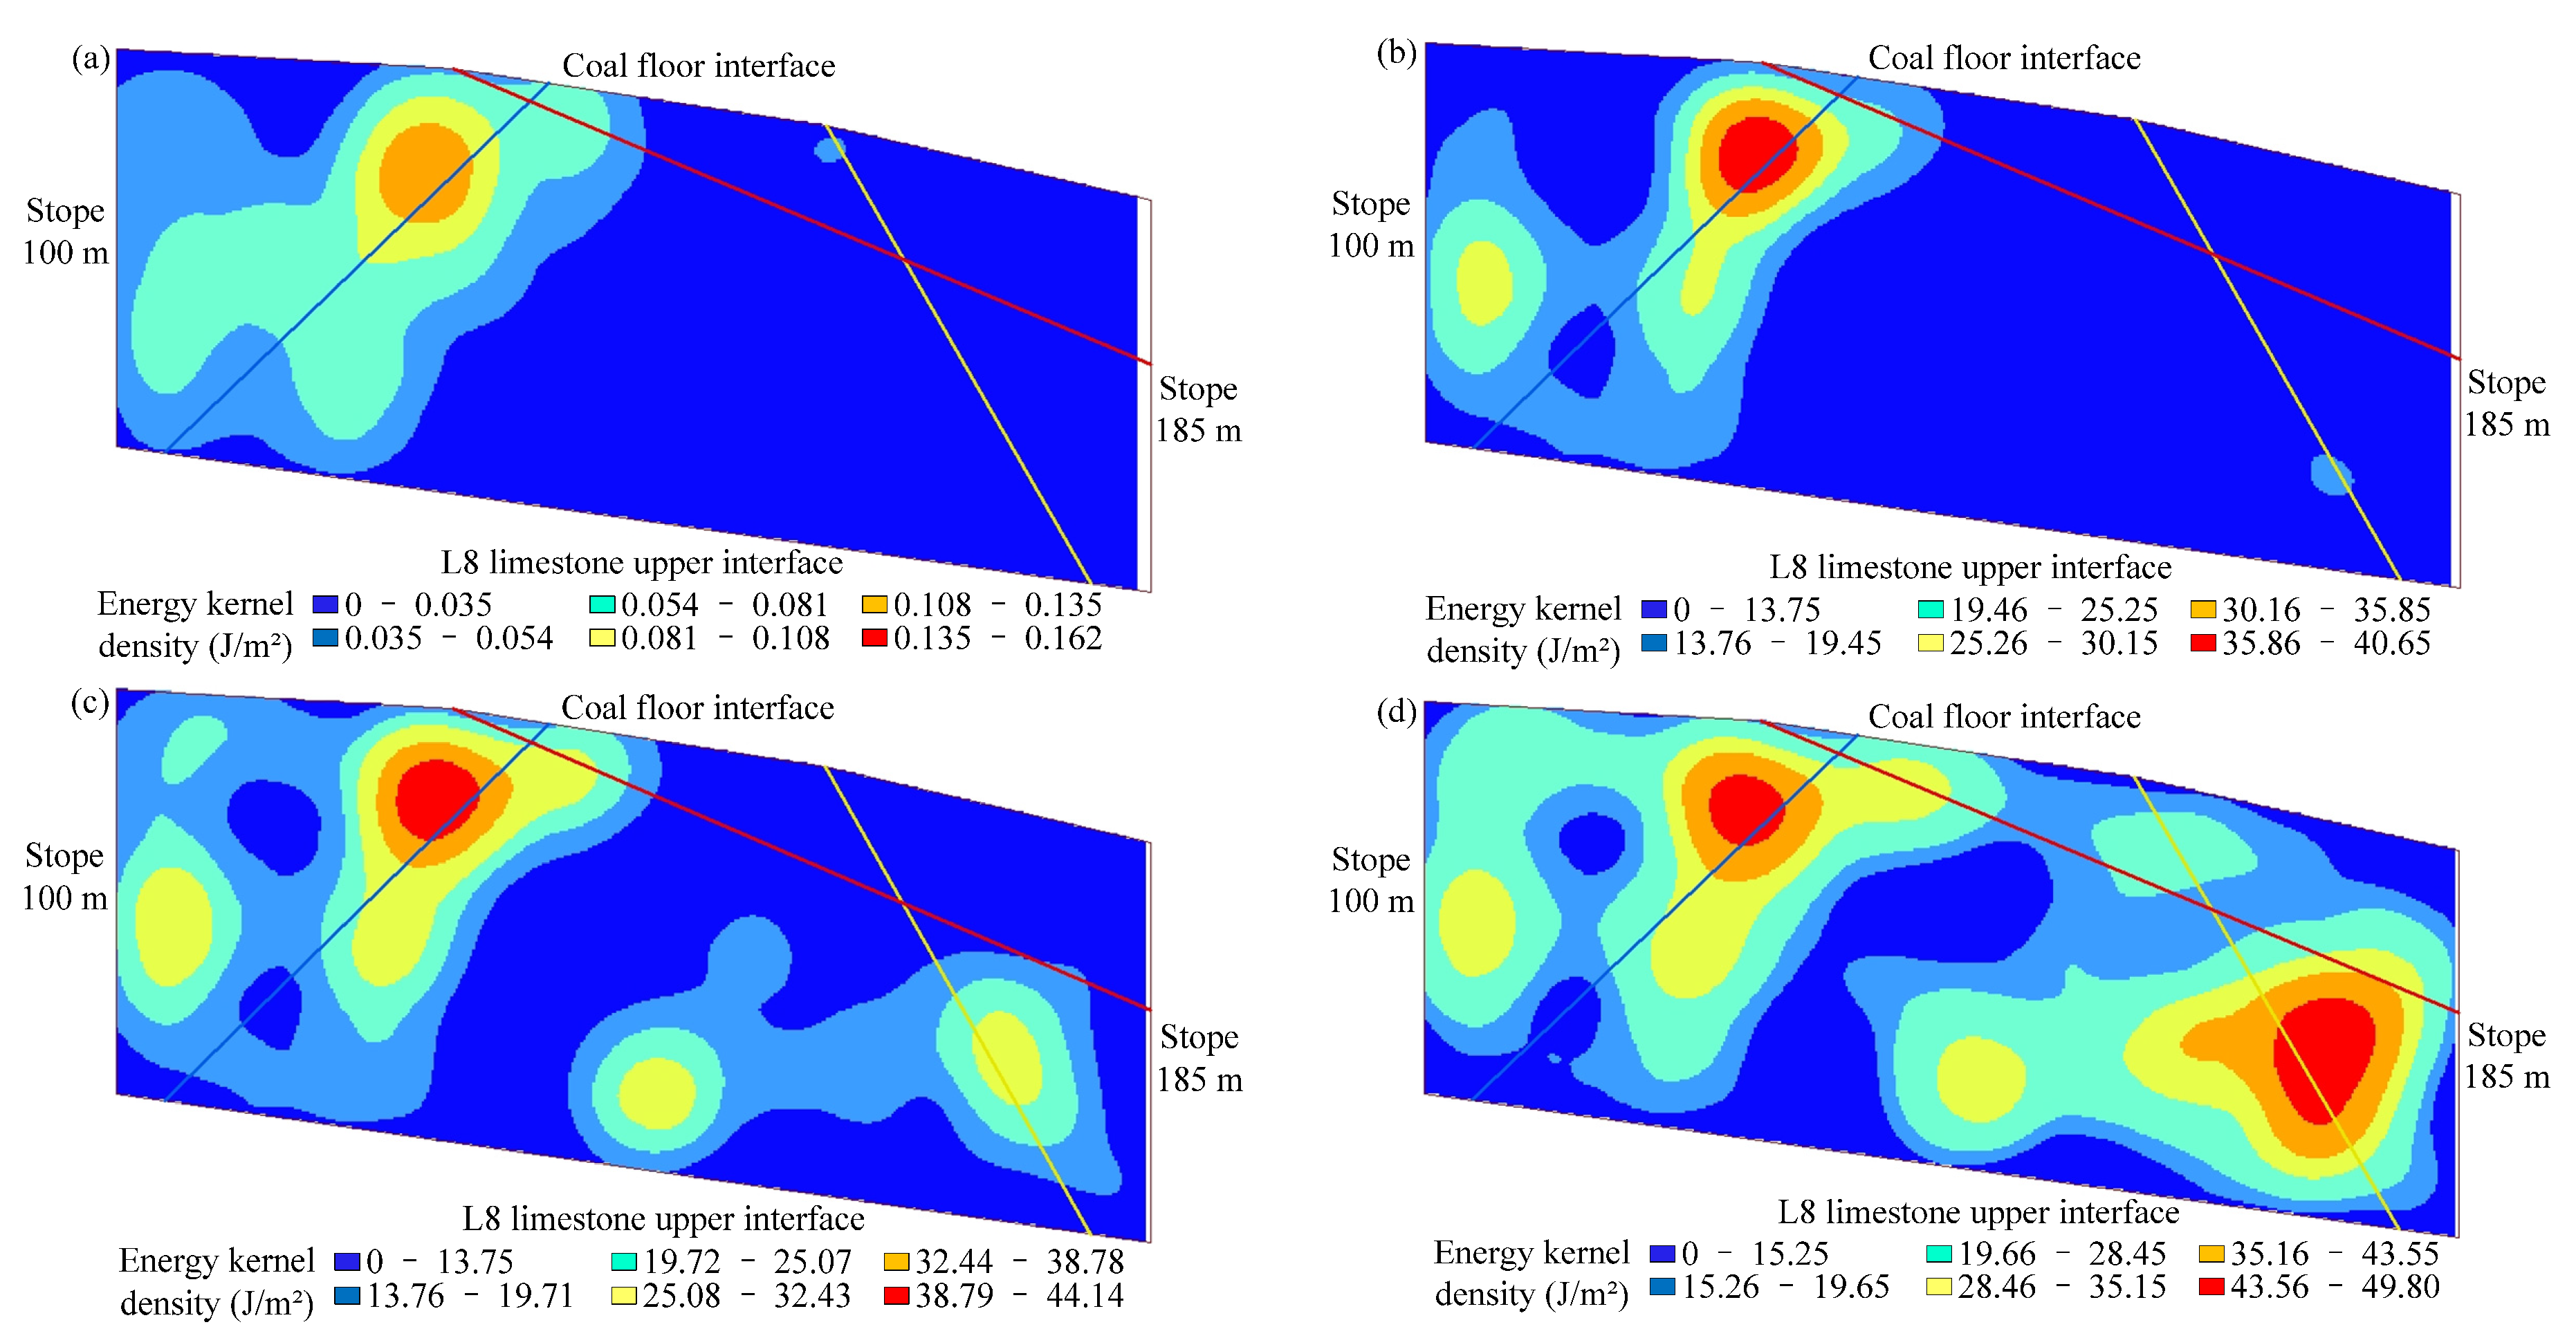
Since the rock mass fracture with microseismic events was mainly a planar fracture, and the extension direction of the fracture plane was uncertain, the research accuracy was poor when the point represented the event. In order to accurately study the rock mass failure degree under the influence of mining, the quadratic kernel function (see Equation (1)) calculation method was introduced, that is, the location coordinates of microseismic events were taken as the center of the circle and the maximum location error was taken as the radius (10 m is selected here). The energy of the microseismic events was distributed according to the quadratic kernel function and, finally, the energy within the region was accumulated to obtain the cloud map of the energy kernel density. The calculation method above takes into account the influence of a positioning error when quantifying the degree and scope of the rock mass damage with the understanding that the location coordinates of the microseismic events were closest to the core location of the rock mass damage. Finally, the distribution range of the rock mass releasing elastic energy was obtained, and the released amount of elastic energy represents the degree of fracture development in the rock mass. The energy of all the microseismic events in the “analysis area” was expanded planarly according to the kernel function, and the energy kernel density value was finally calculated. the distribution of the energy kernel density value was shown on the profile map, as shown in Figure 7.
K x = 3 4 1 x 2 , x 1 , 1 0 ,                         otherwise
Under the dual interference of mining and water pressure, the distribution rule of microseismic events in the “analysis area” and the change rule of indexes, such as frequency, accumulated energy and energy core density, were comprehensively analyzed. Combined with the change of on-site water inflow, the activation process of the floor fault was roughly divided into five stages, namely, the pre-mining stage, initial mining stage, fault activation indication stage, fault activation stage and fault activation extinction stage. The microseismic indexes in the pre-mining stage showed the characteristics of “high growth rate and short increase time”, while the microseismic indexes in the early mining influence stage presented the characteristics of “low growth rate and long increase time”. “High growth rate and long increase time” were characteristics of the microseismic indexes in the activation sign stage and activation stage. The microseismic indexes in the activation extinction stage effectively no longer increased.
Each stage was explained by combining the microseismic data and water inflow changes as follows:
(1) Previous mining affects the stage: The working face was mined until 28 January. There were a few microseismic events located near the D193 fault in the “analysis region”, and almost no events occurred near the D191 and D194 faults, as shown in Figure 6a. According to the analysis of the energy kernel density cloud in Figure 7a, the maximum energy kernel density value in the “analysis region” was only 0.16 J/m2, and only the energy kernel density value near fault D193 was greater than 0.05 J/m2, while the energy kernel density in other areas was essentially 0. Through the comprehensive analysis within this period, the distances of the D191 and D194 faults in the “analysis region” were far away from the working face. The mining activities had little disturbance on the D191 and D194 faults, which was reflected in the microseismic monitoring system, as the event accumulation degree was extremely low. Therefore, namely for the D191 and D194 fault areas, for this period of time, the previous mining activity affects the stage.
(2) Initial mining affects the stage: Until 16 March, the working face was about 15 m from the left boundary of the “analysis region”. As shown in Figure 6b, the distribution of microseismic events in the “analysis region” extended further to the leading direction. The accumulation degree of events near fault D193 increased, and there was a small range of low-level event accumulation near fault lines D191 and D194. According to Figure 7b, there were two regions with high-energy kernel density. One of them was the area between the left boundary of the “analysis region” and the D193 fault, with an energy kernel density of 20~30 J/m2. Through reasonable analysis, it can be contended that stress concentration occurred in the tectonic stress field of fault D193 under the influence of mining, and this area was within the peak value range of advanced concentrated stress on the working face. Under the combined action of the tectonic stress field and mining disturbance stress field, the rock mass in this area was destroyed to a large extent, leading to the formation of many microseismic events. The other area was near the intersection of faults D193 and D191, and the energy kernel density was 25~40 J/m2. This shows that the rock mass at the fault junction was of low strength, and the disturbance stress field near the fault and the advanced concentrated stress field of the working face interacted and superimposed each other, aggravating the rock mass fracture. Through comprehensive analysis, it was determined that the mining activities in this stage affected faults D191 and D194, but the event accumulation degree was low. Therefore, this period was the initial mining affects stage for the area near faults D191 and D194.
(3) Sign stage of fault activation: Until 4 April, the working face was about 10 m from the left boundary of the “analysis region”. It can be seen from Figure 6c that the accumulation of microseismic events near faults D191 and D194 had further increased. Figure 7c illustrates that, in addition to the two regions with large energy kernel density values in the previous stage, there were two additional regions. One was located near the L8 limestone interface in the middle of the “analysis region”, and the other was near the intersection of fault D191 and fault D194, with an energy kernel density of 20~30 J/m2. The reason was that the rock mass at the fault junction was of low strength, and the tectonic stress and advanced concentrated stress interacted and superimposed each other, resulting in rock mass fracture and microseismic event accumulation. For the “analysis region”, this period could be referred to as the sign stage of fault activation. Therefore, grouting (see Figure 5) was adopted to reinforce and improve the damaged rock mass.
(4) Fault activation stage: Until 29 April, the working face lagged about 10 m to the right boundary of the “analysis region”. During this period, the “analysis region” transitioned from the influence state of advanced concentrated stress to the relief state of goaf. It can be seen from Figure 7d that the energy kernel density value near the intersection of the two faults was the largest, about 50 J/m2, indicating that the disturbance stress field and the mining stress field near the fault merged into a stress concentration area with larger stress and a wider distribution range, leading to intensified activation of the faults (especially at the intersection of the faults). Since the “analysis region” had been reinforced by grouting at the sign stage of fault activation, the water inflow at this stage was significantly reduced compared with that of the previous stage. According to a comprehensive analysis, this period was the stage of intense fault activation. If no reinforcement measures were taken before, water inrush accidents were most likely to occur at this stage.
(5) Gradual extinction stage of fault activation: Until 31 May, the working face was about 70 m ahead of the boundary to the right of the “analysis region”. The cumulative frequency of microseismic events during this period and the amount of cumulative energy added over time were very low (see Figure 4b), which meant that mining had little impact on the “analysis region”. The activated fault gradually closed and stabilized under the action of mining pressure, and the water inflow of the working face at this stage was relatively stable (see Figure 4a). After comprehensive analysis, it was considered that this stage was the gradual extinction stage of fault activation.

4. Numerical Simulation of Failure Behaviors of the Floor Fault

4.1. Simulation Model and Sheme

FLAC3D 3.0, a numerical simulation software, was used to simulate the floor failure law of confined water mining with the fault working face, and to study and analyze the evolution law of the plastic failure zone and stress field during mining. The simulation model was set up based on the geological conditions of the 16001 working face in Zhaogu No. 1 coal mine. The length, width and height of the numerical simulation model were 500, 50 and 140 m, respectively. The model included an 80 m roof and a 50 m floor of seam numbers two and one, and a 6 m coal seam thickness. In the model, the buried depth of coal seam was 540 m, and a stress boundary of 11.5 MPa was applied on the upper part of the model to simulate the dead weight of the overlying strata. A stress boundary of 5 MPa was applied to the interface of the L8 limestone to replace the confined water pressure. The horizontal displacement was constrained by the left and right boundaries, and the vertical displacement was constrained by the bottom boundary. The fault cut through the entire model and the fault inclination angle was simulated to be 45°. The drop and fault plane width were 1.0 and 2 m, respectively. The cutting hole of the working face was located in the upper wall of the fault, 160 m away from the fault surface, and the advancing direction was from the upper wall to the footwall. The physical and mechanical parameters of each rock strata (obtained from field sampling and laboratory tests) are shown in Table 5, and the constructed numerical model is shown in Figure 8.
The Mohr–Coulomb failure criterion was used to calculate the mining failure characteristics of the surrounding rocks in the numerical simulation. The process of simulated mining was realized by distributed excavation. Firstly, the initial stress field balance was calculated. According to the designed excavation step calculation, the simulation excavation was 20 m each time. The mining height was the full height of the coal. When the maximum unbalanced force curve of the model was close to zero, the calculated equilibrium was determined.

4.2. Analysis of Simulation Results

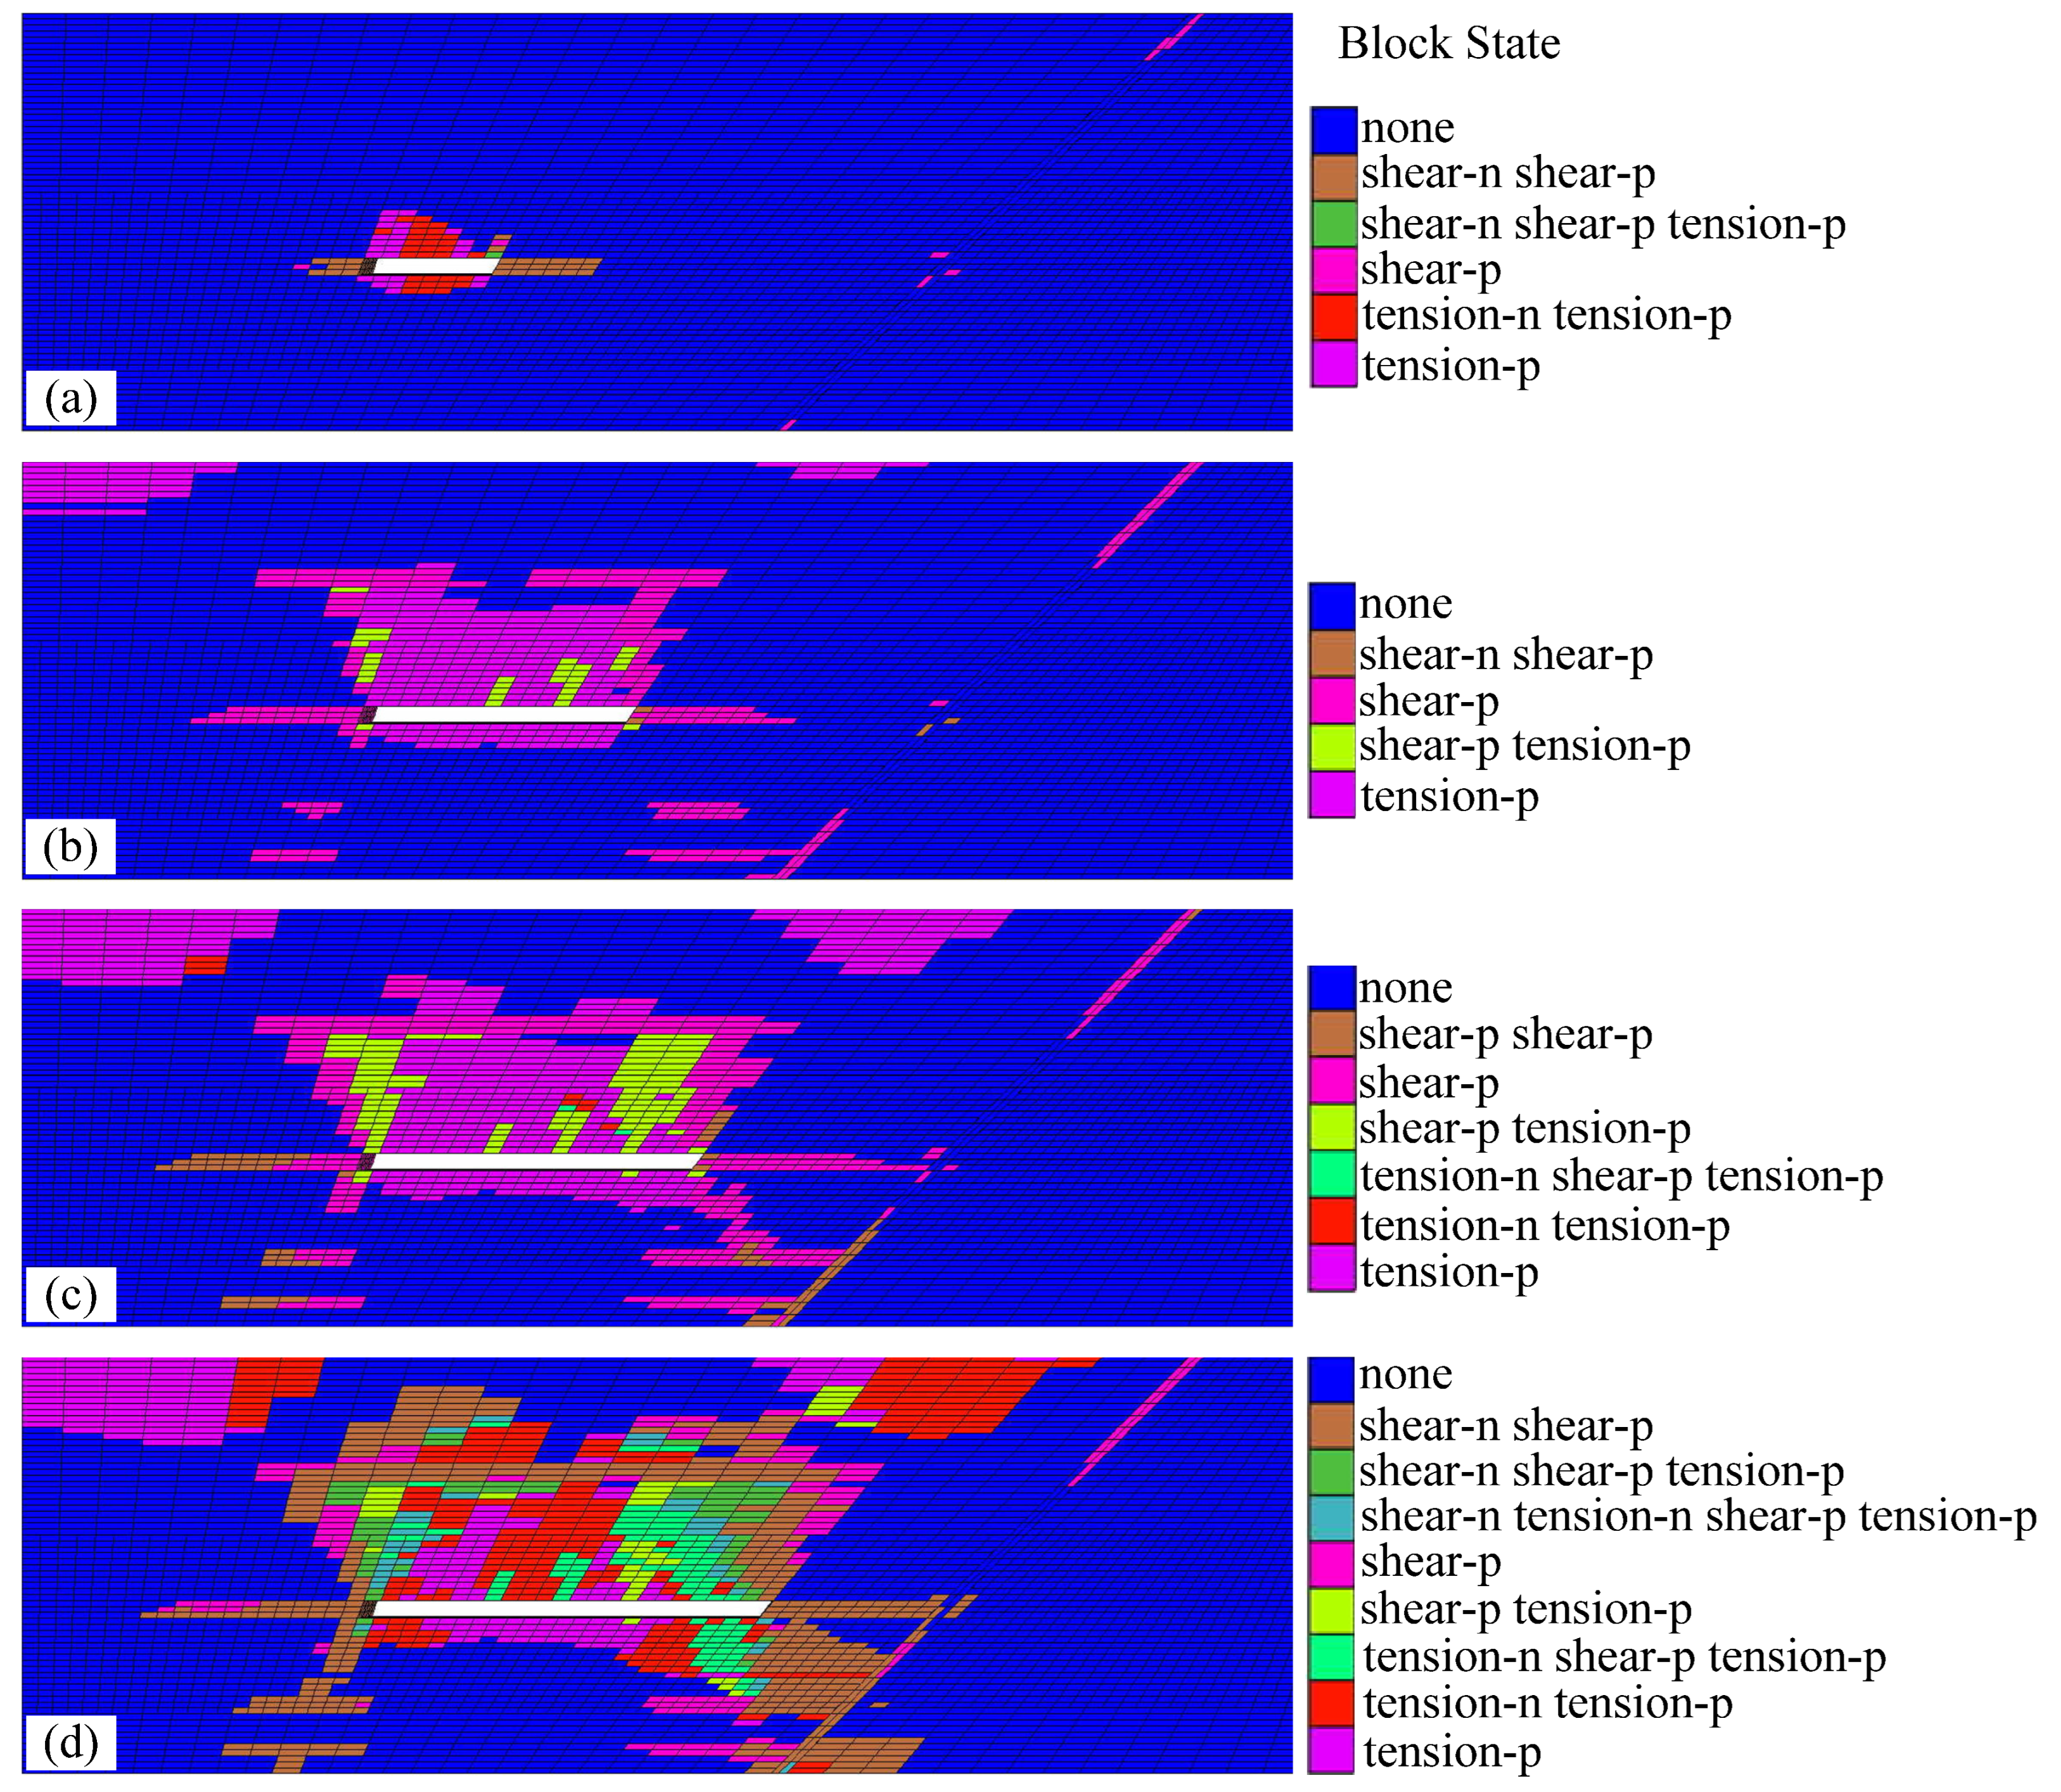
Figure 9 shows the distribution of the plastic failure region of the surrounding rock under different excavation steps. As can be seen from Figure 9a, in the process of a 40 m advance from the cutting hole of the working face, the plastic failure area of the surrounding rock was mainly distributed around the working face, and the maximum plastic failure depth of the floor was about 6 m. Because the working face was far away from the fault, the surrounding rocks in the area near the fault did not incur a plastic failure, which suggests that mining activities do not affect the floor containing the fault. Combined with the monitoring results of the microseismic monitoring system, it was concluded that this stage belonged to the “previous mining affects stage”.
When the working face continued to advance to 80 m from the cutting hole, it can be seen from Figure 9b that the plastic failure range of the goaf roof and floor was further extended, and the maximum plastic failure depth of the floor was about 8 m. Due to the combined action of mining and water pressure, a small range of shear failure occurred at the intersection of the L8 limestone and the bottom of the fault. Generally speaking, this had little impact on the area near the fault. This stage belongs to the “initial mining affects stage”.
When the working face advanced to 60 m from the fault, as shown in Figure 9c, a water diversion channel connecting the stope and aquifer formed below the working face. In addition, the plastic failure range of the fault area affected by mining expanded, and the location was consistent with the high-energy kernel density in the microseismic monitoring results. If this period was accompanied by the increase of the working face water inflow, measures, such as grouting, should be taken to prevent the one-step activation of the fault from causing water inrush. This stage should be labeled the “sign stage of fault activation”.
When the working face advanced to 40 m from the fault, as shown in Figure 9d, under the influence of mining, all the areas between the upper fault plane and the working face underwent plastic failure, and the range of the water diversion channel was further extended. If no measures were taken in the early stage, the possibility of a water inrush accident was greater. This stage belongs to the “fault activation stage”.
In summary, it can be seen that the simulation results of the working face relative to the fault position are consistent with the microseismic monitoring results under the influence of mining at various stages of floor fault activation.

5. Conclusions

(1) With the decrease of the distance between the working face and the left boundary of the “analysis region”, the accumulation degree of the microseismic events in the “analysis region” increases, and the high-energy kernel density region increased. According to microseismic data and water inflow, the fault activation under the influence of mining was divided into five stages: “previous mining affects stage”, “initial mining affects stage”, “sign stage of fault activation”, “fault activation stage” and “gradual extinction stage of fault activation”.
(2) It was found that the “sign stage of fault activation” was the disaster-bearing stage, and the reinforcement measures taken at this stage can effectively reduce the possibility of water inrush accidents.
(3) The numerical simulation results show that as the distance between the working face and the fault decreased, the plastic failure range of the fault region gradually expanded. This finding explains the fault activation characteristics from the perspective of plastic failure of the surrounding rock.
(4) Through microseismic monitoring technology, the remarkable effect of the forecast on water inrush induced by fault activation allowed us to take measures to prevent water inrush. It not only guaranteed the safety of the workers and the smooth stoping of the working surface, but also showed that microseismic monitoring technology could provide an early warning of the danger of floor fault activation inducing water inrush, which has a very important application and popularization value in similar coal mines.

Author Contributions

Conceptualization, F.J. and Y.C.; methodology, C.X.; software, C.Z.; validation, C.X., C.Z. and Y.C.; formal analysis, C.X.; investigation, C.X. and Y.C.; resources, F.J.; writing—original draft preparation, C.X., C.Z. and Y.C.; writing—review and editing, F.J. and Y.C.; visualization, C.X. and Y.C.; supervision, F.J.; project administration, F.J.; funding acquisition, Y.C. All authors have read and agreed to the published version of the manuscript.

Funding

Financial support from the National Natural Science Foundation of China (51904092), the Fundamental Research Funds for the Universities of Henan Province (NSFRF230403, NSFRF210454), Young backbone teachers funding program of Henan Polytechnic University (2022XQG-01), the research fund of Henan Key Laboratory for Green and Efficient Mining & Comprehensive Utilization of Mineral Resources (KCF2202) and the research fund of Jiaozuo Road Traffic and Transportation Science and Technology research center (JRTT2023004, JRTT2023010, JRTT2023011, ZD2021002, YB2021001) are gratefully acknowledged.

Institutional Review Board Statement

Not applicable.

Informed Consent Statement

Not applicable.

Data Availability Statement

The data presented in this study are available upon request from the corresponding author.

Conflicts of Interest

The authors declare no conflict of interest.

References

  1. Wei, Q.; Li, W.; Li, T.; Chang, J.; Wang, Q. Effects of Coal Mining on Shallow Water Resources in Semiarid Regions: A Case Study in the Shennan Mining Area, Shaanxi, China. Mine Water Environ. 2016, 36, 104–113. [Google Scholar] [CrossRef]
  2. Wu, Q.; Guo, X.; Shen, J.; Xu, S.; Liu, S.; Zeng, Y. Risk assessment of water inrush from aquifers underlying the Gushuyuan coal mine, China. Mine Water Environ. 2017, 36, 96–103. [Google Scholar] [CrossRef]
  3. Yin, H.; Sang, S.; Xie, D.; Zhao, H.; Li, S.; Li, H.; Zhuang, X. A numerical simulation technique to study fault activation characteristics during mining between fault bundles. Environ. Earth Sci. 2019, 78, 148. [Google Scholar] [CrossRef]
  4. Lee, D.K.; Yim, G.J.; Ji, S.W.; Cheong, Y.W. Study on distribution characteristics of some water parameters properties of mine drainage in an oxidation pond, Hwangji-Yuchang coal mine, South Korea. Environ. Earth Sci. 2013, 68, 241–249. [Google Scholar] [CrossRef]
  5. Liu, P.; Tao, Y.; Shang, M.; Yao, M. The calculation of mine water yield using the non-continuous flow theory. Environ. Earth Sci. 2014, 71, 975–981. [Google Scholar] [CrossRef]
  6. Guo, B.; Cheng, T.; Wang, L.; Luo, T.; Yang, X. Physical simulation of water inrush through the mine floor from a confined aquifer. Mine Water Environ. 2018, 37, 577–585. [Google Scholar] [CrossRef]
  7. Sainoki, A.; Mitri, H.S. Dynamic behaviour of mining-induced fault slip. Int. J. Rock Mech. Min. Sci. 2014, 66, 19–29. [Google Scholar] [CrossRef]
  8. Hofmann, G.; Scheepers, L. Simulating fault slip areas of mining induced seismic tremors using static boundary element numerical modelling. Min. Technol. 2011, 120, 53–64. [Google Scholar] [CrossRef]
  9. Hu, X.; Wang, L.; Lu, Y.; Yu, M. Analysis of insidious fault activation and water inrush from the mining floor. Int. J. Min. Sci. Technol. 2014, 24, 477–483. [Google Scholar] [CrossRef]
  10. Islam, M.; Shinjo, R. Mining-induced fault reactivation associated with the main conveyor belt roadway and safety of the Barapukuria Coal Mine in Bangladesh: Constraints from BEM simulations. Int. J. Coal Geol. 2009, 79, 115–130. [Google Scholar] [CrossRef]
  11. Zhao, J.; Chen, J.; Xing, H.; Zhao, Z.; Zhang, X. Dynamic mechanical response and movement evolution characteristics of fault systems in the coal mining process. Pure Appl. Geophys. 2022, 179, 233–246. [Google Scholar] [CrossRef]
  12. Li, L.; Yang, T.; Liang, Z.; Zhu, W.; Tang, C. Numerical investigation of groundwater outbursts near faults in underground coal mines. Int. J. Coal Geol. 2011, 85, 276–288. [Google Scholar] [CrossRef]
  13. Chen, L.; Feng, X.; Xu, D.; Zeng, W.; Zheng, Z. Prediction of water-inrush risk areas in process of mining under the unconsolidated and confined aquifer: A case study from the Qidong coal mine in China. Environ. Earth Sci. 2016, 75, 706. [Google Scholar] [CrossRef]
  14. Sun, W.; Liu, H.; Cao, Z.; Yang, H.; Li, J. Mechanism Analysis of Floor Water Inrush Based on Criteria Importance though Intercrieria Correlation. Water 2023, 15, 232. [Google Scholar] [CrossRef]
  15. Chen, J.; Zhang, Y.; Ma, K.; Tang, D.; Li, H.; Zhang, C. Analysis of Mining Crack Evolution in Deep Floor Rock Mass with Fault. Geofluids 2021, 2021, 5583877. [Google Scholar] [CrossRef]
  16. Alber, M.; Fritschen, R.; Bischoff, M.; Meier, T. Rock mechanical investigations of seismic events in a deep longwall coal mine. Int. J. Rock Mech. Min. Sci. 2009, 46, 408–420. [Google Scholar] [CrossRef]
  17. Donnelly, L.; Culshaw, M.; Bell, F. Longwall mining-induced fault reactivation and delayed subsidence ground movement in British coalfields. Q. J. Eng. Geol. Hydrogeol. 2008, 41, 301–314. [Google Scholar] [CrossRef]
  18. Liu, S.; Liu, W.; Yin, D. Numerical simulation of the lagging water inrush process from insidious fault in coal seam floor. Geotech. Geol. Eng. 2017, 35, 1013–1021. [Google Scholar] [CrossRef]
  19. Zhou, Q.; Herrera, J.; Hidalgo, A. The numerical analysis of fault-induced mine water inrush using the extended finite element method and fracture mechanics. Mine Water Environ. 2018, 37, 185–195. [Google Scholar] [CrossRef]
  20. Zhang, P.; Zhu, X.; Sun, W.; Yang, H.; Yang, F. Study on mechanism of delayed water inrush caused by mining-induced filling fault activation. Coal Sci. Technol. 2022, 50, 136–143. (In Chinese) [Google Scholar] [CrossRef]
  21. Li, C.; Xu, Z. Numerical modeling and investigation of fault-induced water inrush hazard under different mining advancing directions. Mathematics 2022, 10, 1561. [Google Scholar] [CrossRef]
  22. Song, W.; Liang, Z. Theoretical and numerical investigations on mining-induced fault activation and groundwater outburst of coal seam floor. Bull. Eng. Geol. Environ. 2021, 80, 5757–5768. [Google Scholar] [CrossRef]
  23. Hu, Y.; Sun, J.; Liu, W.; Wei, D. The evolution and prevention of water inrush due to fault activation at working face No. II 632 in the Hengyuan coal mine. Mine Water Environ. 2019, 38, 93–103. [Google Scholar] [CrossRef]
  24. Islam, M.; Hayashi, D.; Kamruzzaman, A. Finite element modeling of stress distributions and problems for multi-slice longwall mining in Bangladesh, with special reference to the Barapukuria coal mine. Int. J. Coal Geol. 2009, 78, 91–109. [Google Scholar] [CrossRef]
  25. Muzik, J.; Seidlova, A.; Kudelcikova, M.; Kongar-Syuryun, C.; Mihalik, J. Flood hazard calculation by using a digital terrain model. IOP Conf. Ser. Earth Environ. Sci. 2021, 906, 012067. [Google Scholar] [CrossRef]
  26. Rybak, J.; Kongar-Syuryun, C.; Tyulyaeva, Y.; Khayrutdinov, A.; Akinshin, I. Geomechanical substantiation of parameters of technology for mining salt deposits with a backfill. Min. Sci. 2021, 28, 19–32. [Google Scholar] [CrossRef]
  27. Li, A.; Ji, B.; Ma, Q.; Liu, C.; Wang, F.; Ma, L.; Mu, P.; Mou, L.; Yang, Y.; Ding, X. Design of longwall coal pillar for the prevention of water inrush from the seam floor with through fault. Geofluids 2021, 2021, 5536235. [Google Scholar] [CrossRef]
  28. Leśniak, A.; Isakow, Z. Space–time clustering of seismic events and hazard assessment in the Zabrze-Bielszowice coal mine, Poland. Int. J. Rock Mech. Min. Sci. 2009, 46, 918–928. [Google Scholar] [CrossRef]
  29. Sun, J.; Wang, L.; Hou, H. Application of micro-seismic monitoring technology in mining engineering. Int. J. Min. Sci. Technol. 2012, 22, 79–83. [Google Scholar] [CrossRef]
  30. Zhou, J.; Yang, T.; Zhang, P.; Xu, T.; Wei, J. Formation process and mechanism of seepage channels around grout curtain from microseismic monitoring: A case study of Zhangmatun iron mine, China. Eng. Geol. 2017, 226, 301–315. [Google Scholar] [CrossRef]
  31. Liu, X.; Tang, C.A.; Li, L.; Lv, P.; Liu, H. Microseismic monitoring and 3D finite element analysis of the right bank slope, Dagangshan Hydropower Station, during reservoir impounding. Rock Mech. Rock Eng. 2017, 50, 1901–1917. [Google Scholar] [CrossRef]
  32. Cheng, S.; Li, S.; Li, L.; Shi, S.; Zhou, Z.; Wang, J. Study on energy band characteristic of microseismic signals in water inrush channel. J. Geophys. Eng. 2018, 15, 1826–1834. [Google Scholar] [CrossRef]
  33. Liu, W.; Li, Y. Theoretical and Simulation Investigations of Water Inrushes Due to Fault Activation by Mining. Mine Water Environ. 2023, 42, 146–157. [Google Scholar] [CrossRef]
  34. Liu, J.; Feng, X.; Li, Y.; Xu, S.; Sheng, Y. Studies on temporal and spatial variation of microseismic activities in a deep metal mine. Int. J. Rock Mech. Min. Sci. 2013, 60, 171–179. [Google Scholar] [CrossRef]
  35. Cheng, A.; Gao, Y.; Liang, X.; Liu, C.; Wu, Q.; Zhu, Q. Identification of potential water inrush areas in coal floor by using microseismic monitoring technique. Chin. J. Geotech. Eng. 2014, 36, 1727–1732. (In Chinese) [Google Scholar] [CrossRef]
  36. Sun, Y.; Zuo, J.; Li, Y.; Liu, C.; Li, Y.; Shi, Y. Micro-seismic monitoring on fractured zone and water inrush mechanism analysis of deep mining above aquifer in Xingdong coalmine. Rock Soil Mech. 2017, 38, 2335–2342. (In Chinese) [Google Scholar] [CrossRef]
  37. Wang, Y.; Yu, S.; Wang, S.; Huang, K.; Tang, C. Application of microseismic monitoring technology in water inrush warning of coal mine floor. Coal Sci. Technol. 2018, 48, 68–73. (In Chinese) [Google Scholar] [CrossRef]
  38. Yu, R.; Qian, J.; Liu, L.; Zha, H.; Li, N. Microseismic Precursors of Coal Mine Water Inrush Characterized by Different Waveforms Manifest as Dry to Wet Fracturing. Int. J. Environ. Res. Public Health 2022, 19, 14291. [Google Scholar] [CrossRef]
Figure 1. (a) The location of Zhaogu No. 1 coal mine of Henan Province, China; (b) enlarged drawing of the location of Zhaogu No. 1 coal mine.
Sustainability 15 07361 g001
Figure 2. The profile map along the ventilation roadway of 16001 working face of Zhaogu No. 1 coal mine.
Sustainability 15 07361 g002
Figure 3. The layout of the monitoring stations of the 16001 working face.
Sustainability 15 07361 g003
Figure 4. (a) Water flow of 16001 working face across varying dates; (b) the relationship between accumulative energy and accumulative frequency of the number of microseismic events.
Sustainability 15 07361 g004aSustainability 15 07361 g004b
Figure 5. Schematic drawing of drill holes for grouting: (a) cross-section; (b) plan.
Sustainability 15 07361 g005
Figure 6. Distribution map of microseismic events’ evolution in the “analysis region”. The working face was located at (a) 20 m stope on 28 January; (b) 85 m stope on 16 March; (c) 110 m stope on 3 April; (d) 175 m stope on 29 April; and (e) 255 m stope on 31 May.
Sustainability 15 07361 g006aSustainability 15 07361 g006b
Figure 7. Evolution cloud map of energy kernel density values of microseismic events in the “analysis region”. The working face was located at (a) 20 m stope on 28 January; (b) 85 m stope on 16 March; (c) 110 m stope on 3 April; (d) 175 m stope on 29 April; and (e) 255 m stope on 31 May.
Sustainability 15 07361 g007aSustainability 15 07361 g007b
Figure 8. Numerical simulation model of 16001 working face in Zhaogu No. 1 coal mine.
Sustainability 15 07361 g008
Figure 9. Distribution of plastic failure zone of surrounding rock under different excavation steps. (a) Working face advanced 40 m (120 m from fault); (b) working face advanced 80 m (80 m from fault); (c) working face advanced 100 m (60 m from fault); (d) working face advanced 120 m (40 m from fault).
Sustainability 15 07361 g009
Table 1. The detailed information of the fault at the ventilation roadway of 16001 working face.
No.NameStrike (°)Trend (°)Dip Angle (°)Difference of Level (m)
1D191235145230.8
2D1931394976~870.5~0.8
3D194235145600.7
Table 2. The measured wave velocity.
DateMeasured Wave Velocity (m/s)Mean (m/s)
24 January2#3#1#7#3422
3328351033953456
4 February6#7#5#2#3453
3525329034483550
Table 3. The calibration table of positioning accuracy.
Date XYZAverage Error
24 January calibrationMeasured coordinates462,872.493,920,374.48−436.0
Oriented coordinates462,873.963,920,378.28−435.94
Error1.473.800.0521.77
4 February calibrationMeasured coordinates462,703.453,920,239.89−464.28
Oriented coordinates462,705.623,920,237.60−465.75
Error2.162.281.4731.97
Table 4. The location information and the amount of grouting.
Serial NumberDrilling NumberDrilling Depth (m)Drilling Azimuth (°)Dip Angle (°)Final Hole LocationGrouting Pressure (MPa)Grouting Amount (m3)
1SW2-147.9302−48.2L8 Limestone862
2SW2-245.2261−58.8L8 Limestone834.1
3SW2-351.3220−53.7L8 Limestone8113.2
4SW2-458.5171−49.9L8 Limestone8108.5
5SW2-571.3162−41.4L8 Limestone818.6
6SW2-666.3185−26.5Sandy mudstone879.1
Table 5. Physical and mechanical parameters of the strata and fault.
LithologyDensity
(ρ/kgm-3)
Young’s Modulus
(E/GPa)
Poisson’s Ratio
(μ)
Cohesion
(C/MPa)
Friction
(φ/°)
Tension
(σ/MPa)
Sandy mudstone261031.10.228.2362.6
Fine sandstone252033.00.262.8371.8
L8 limestone268048.00.3034405.1
Siltstone267029.00.248.0422.8
L9 limestone268045.00.3036415.0
Coal14504.00.253.0201.2
Mudstone266026.00.248.5321.4
Medium sandstone264028.50.268.5331.7
Fault22002.70.400.9400.2
Disclaimer/Publisher’s Note: The statements, opinions and data contained in all publications are solely those of the individual author(s) and contributor(s) and not of MDPI and/or the editor(s). MDPI and/or the editor(s) disclaim responsibility for any injury to people or property resulting from any ideas, methods, instructions or products referred to in the content.