Article

Toward New Value-Added Products Made from Anaerobic Digestate: Part 2—Effect of Loading Level on the Densification of Solid Digestate

by
Grzegorz Łysiak
1,
Ryszard Kulig
1,* and
Alina Kowalczyk-Juśko
2
1
Department of Food Engineering and Machines, University of Life Sciences in Lublin, 20-950 Lublin, Poland
2
Department of Environmental Engineering and Geodesy, University of Life Sciences in Lublin, Leszczyńskiego 7, 20-069 Lublin, Poland
*
Author to whom correspondence should be addressed.
Sustainability 2023, 15(9), 7396; https://doi.org/10.3390/su15097396
Submission received: 13 March 2023 / Revised: 17 April 2023 / Accepted: 27 April 2023 / Published: 29 April 2023

Abstract

:
A comprehensive understanding of the mechanisms associated with the pelletization of an anaerobic digestate is necessary to optimize the pellet production process and achieve better and more sustainable management of the digestate. This work evaluated the digestate behavior during cyclic loading and unloading in a closed matrix. The results presented here are a continuation of those observed in previous work that evaluated the effect of moisture content on the behavior of the digestate under cyclic loading/unloading conditions in a closed matrix. The effect of moisture content on the distribution of permanent and elastic strain energy demonstrated in the previous study was verified in the present work under different loading conditions. A Zwick universal machine was used for the experiments. The samples were loaded with amplitudes of 8, 11, 14, 17, and 20 kN for 10 cycles. Two distinct moisture levels of the digestate—10% and 22%—were analyzed. The results of the present study confirmed that the elastic energy dissipated was independent of the moisture content of the digestate and remained relatively constant for a wide range of the applied loads. Higher values of elastic strain energy were observed for the digestate with higher moisture content only when higher loads were applied. In the range of the studied loads, characteristic differences were noted in loading/unloading curves regardless of the load magnitude. The increase in the applied load led to an increase in pellet strength, but only when the moisture content of the digestate was 10%. The results of the pellet strength reflect well the results of irreversible energy and the conclusions about the area enclosed between loading and unloading curves.

1. Introduction

Anaerobic digestion (AD) is a technology widely applied for the sustainable treatment of biological wastes for the production of biogas. Solid anaerobic digestate (SAD), the residual product of AD, has been extensively studied in recent years, as it has been proven to be a source of valuable nutrients [1,2,3] and structural components [4,5] as well as energy [6,7,8]. SAD is also identified as a residue with a very high concentration of heavy metals [9,10] and an important component in gas emissions [11,12]. The pelleting of SAD may significantly expand the possibilities of its further use in the form of a fertilizer [13,14,15,16], solid biofuel [7,8,17,18], or digestate-derived products [19]. Pelletization also allows the better management of SAD, making it more environmentally friendly and sustainable.
Several reviews focusing on biomass as a sustainable energy source for different applications and obtaining different bioresidues have been published in the last decade [18,20,21,22]. Both the process of densification and the quality of the biomass pellets are affected by various factors, including (1) the type and properties of the raw material, i.e., particle size [23,24,25], composition [26,27,28,29], and moisture content [29,30,31,32]; (2) preprocessing operations, such as hydrothermal treatment, torrefaction [33,34,35], or the addition of binders [36,37,38]; and (3) operating parameters, such as pressure [39,40], loading speed [41,42], temperature [35,41,43], holding time [40,44,45], and die geometry [21,46].
The load (pressure) exerted on the compacted material is the only factor that causes an increase in its density. With the increase in pressure, the densification process proceeds in three stages, as follows: (1) the particles reorganize to form a tightly packed bed. Most of the particles in the bed retain almost all of their original properties, and energy is dissipated due to friction between the particles; (2) as the compaction pressure continues to increase, the particles are forced [20,21,22,23] to contact with each other while undergoing elastic and plastic strains. This increases the contact area between the particles, resulting in binding forces such as van der Waal forces; and (3) at higher pressures, the reduction in volume continues until the density of the compacted material reaches the actual density of the material [23,26,29,47].
Compaction pressure is generally considered a factor that positively affects the strength characteristics of pellets. Both plastic and elastic deformation, which particles undergo at higher pressures, cause an increase in the contact area of the particles and the formation of interparticle bonds. Additionally, sufficiently high pressure activates natural binders such as starch, protein, and lignin in the pressed material [48,49,50,51], facilitating the process of densification. Thus, when analyzing the effect of pressure on pellet quality, it is essential to take into account the interactive or synergistic effects of pressure with other factors affecting the process, such as the type of biomass, moisture, or temperature.
Several studies indicate that the density of the pellets is strongly and positively dependent on the applied pressure [23,39,52,53]. Adapa et al. [54] reported that the applied pressure most significantly correlated with pellet density. In contrast, in another study, the authors observed a weak correlation between pellet density and pressure and reported that pellets with a higher density can also be obtained under low pressure [55]. Rhen et al. [31] only observed a slight effect of pressure, in the range of 46–114 MPa, on the density of Norway spruce pellets. These authors postulated that the pressure in the die should not exceed 50 MPa. However, it must be noted that the effect of pressure may vary depending on the type of biomass.
The interactive effect of moisture and applied pressure was demonstrated by Mani et al. [56]. With higher levels of moisture, neither density nor durability increased with an increase in the applied loads. The effect of compression force was scarcely relevant [57]. Styks et al. [58] observed that with an increase in moisture and pressure, the density and durability of the pellets also increased, but only to a certain extent, depending on the material used. A synergic effect of pressure and temperature on the density of biomass has also been reported [59]. According to Kaliyan et al. [49], the natural binders in biomass (e.g., lignin, protein, starch, fat) can be activated (softened) at high pressure and in the presence of elevated moisture and temperature, and pressure has a much lower impact on pellet quality than temperature [48]. At higher temperatures, the lignin in the biomass softened and served as a binding agent. The softening of fiber resulted in lower compression energy and pressure magnitude, which, in turn, affected the quality of the pellets [35,60].
In summary, the outcomes of the pelletization of SAD, for the purpose of obtaining novel value-added products, depend on its susceptibility to densification. It should be noted that the existing research on biomass compaction is often limited to specific circumstances due to significant differences in properties, intended use, and the available technologies. Consequently, optimizing the process remains a challenge that requires a better understanding of the underlying mechanisms and their description. Despite the importance of elastic and plastic deformations in pellet formation and resistance, there is a dearth of literature evaluating their contribution to the compaction process. This study is therefore novel as it seeks to improve the understanding of the compaction behavior of anaerobic digestate under cyclic confined loading conditions, and the use of cyclic loading in biomass densification or pelletization is also innovative. In the study of Kulig et al. [61], a hysteresis test was successfully applied to predict the pelletizing outcomes of pea. Thus, the undertaken study constitutes a next step toward a better understanding of the mechanisms involved in the densification of bioresidues.
With a general aim of better understanding the mechanisms associated with the pelletization process, an earlier study [32] examined the effects of digestate moisture content on strain energy distribution and granule strength. The observed behavior of the digestate indicated interesting differences in the evolution of energy and deformations. The two most interesting observations were as follows:
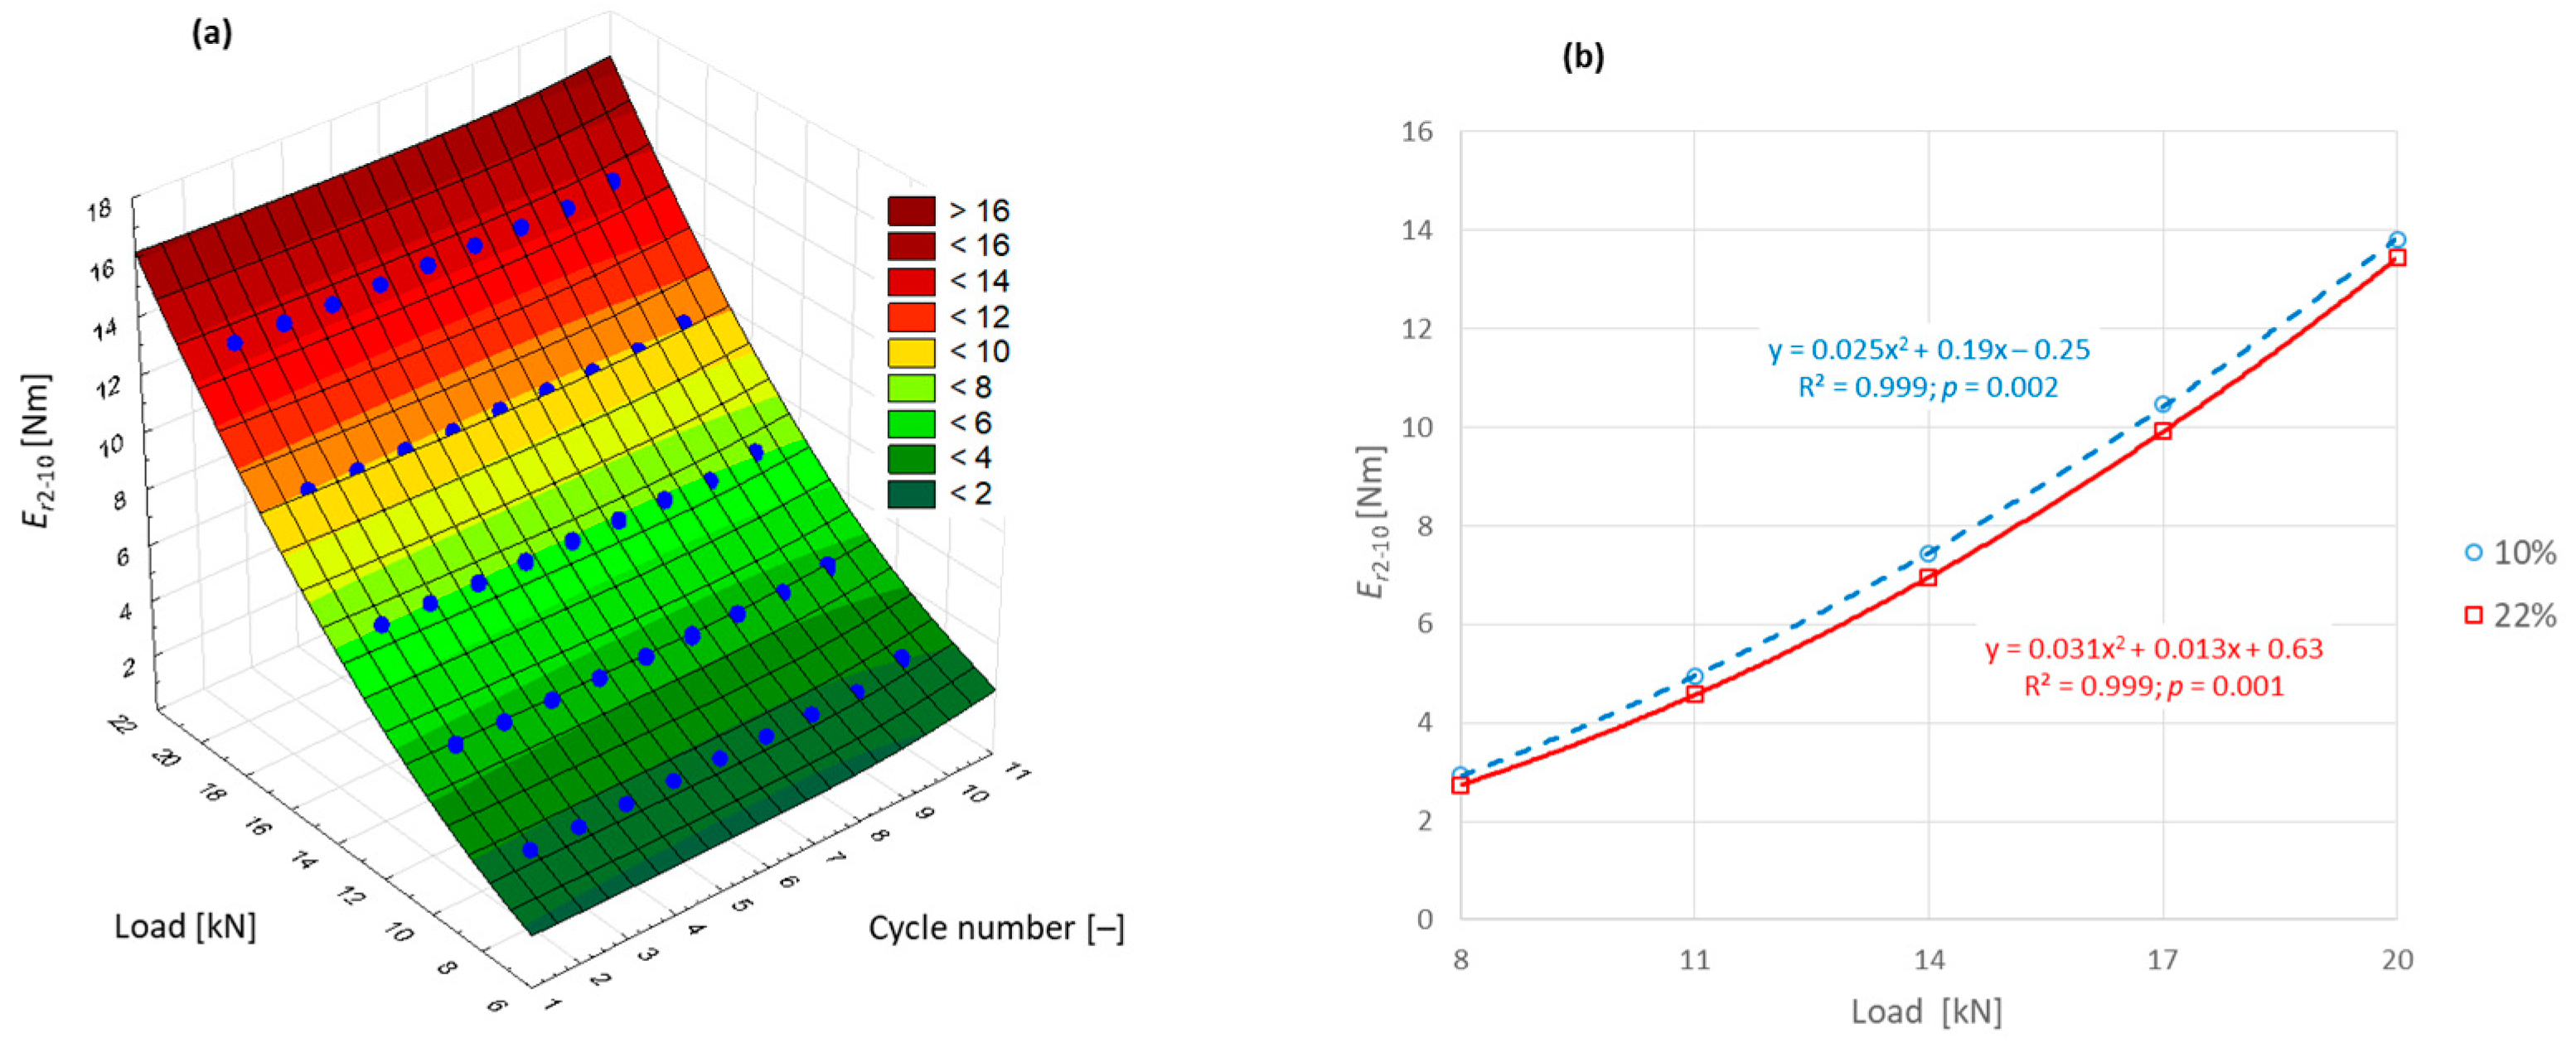
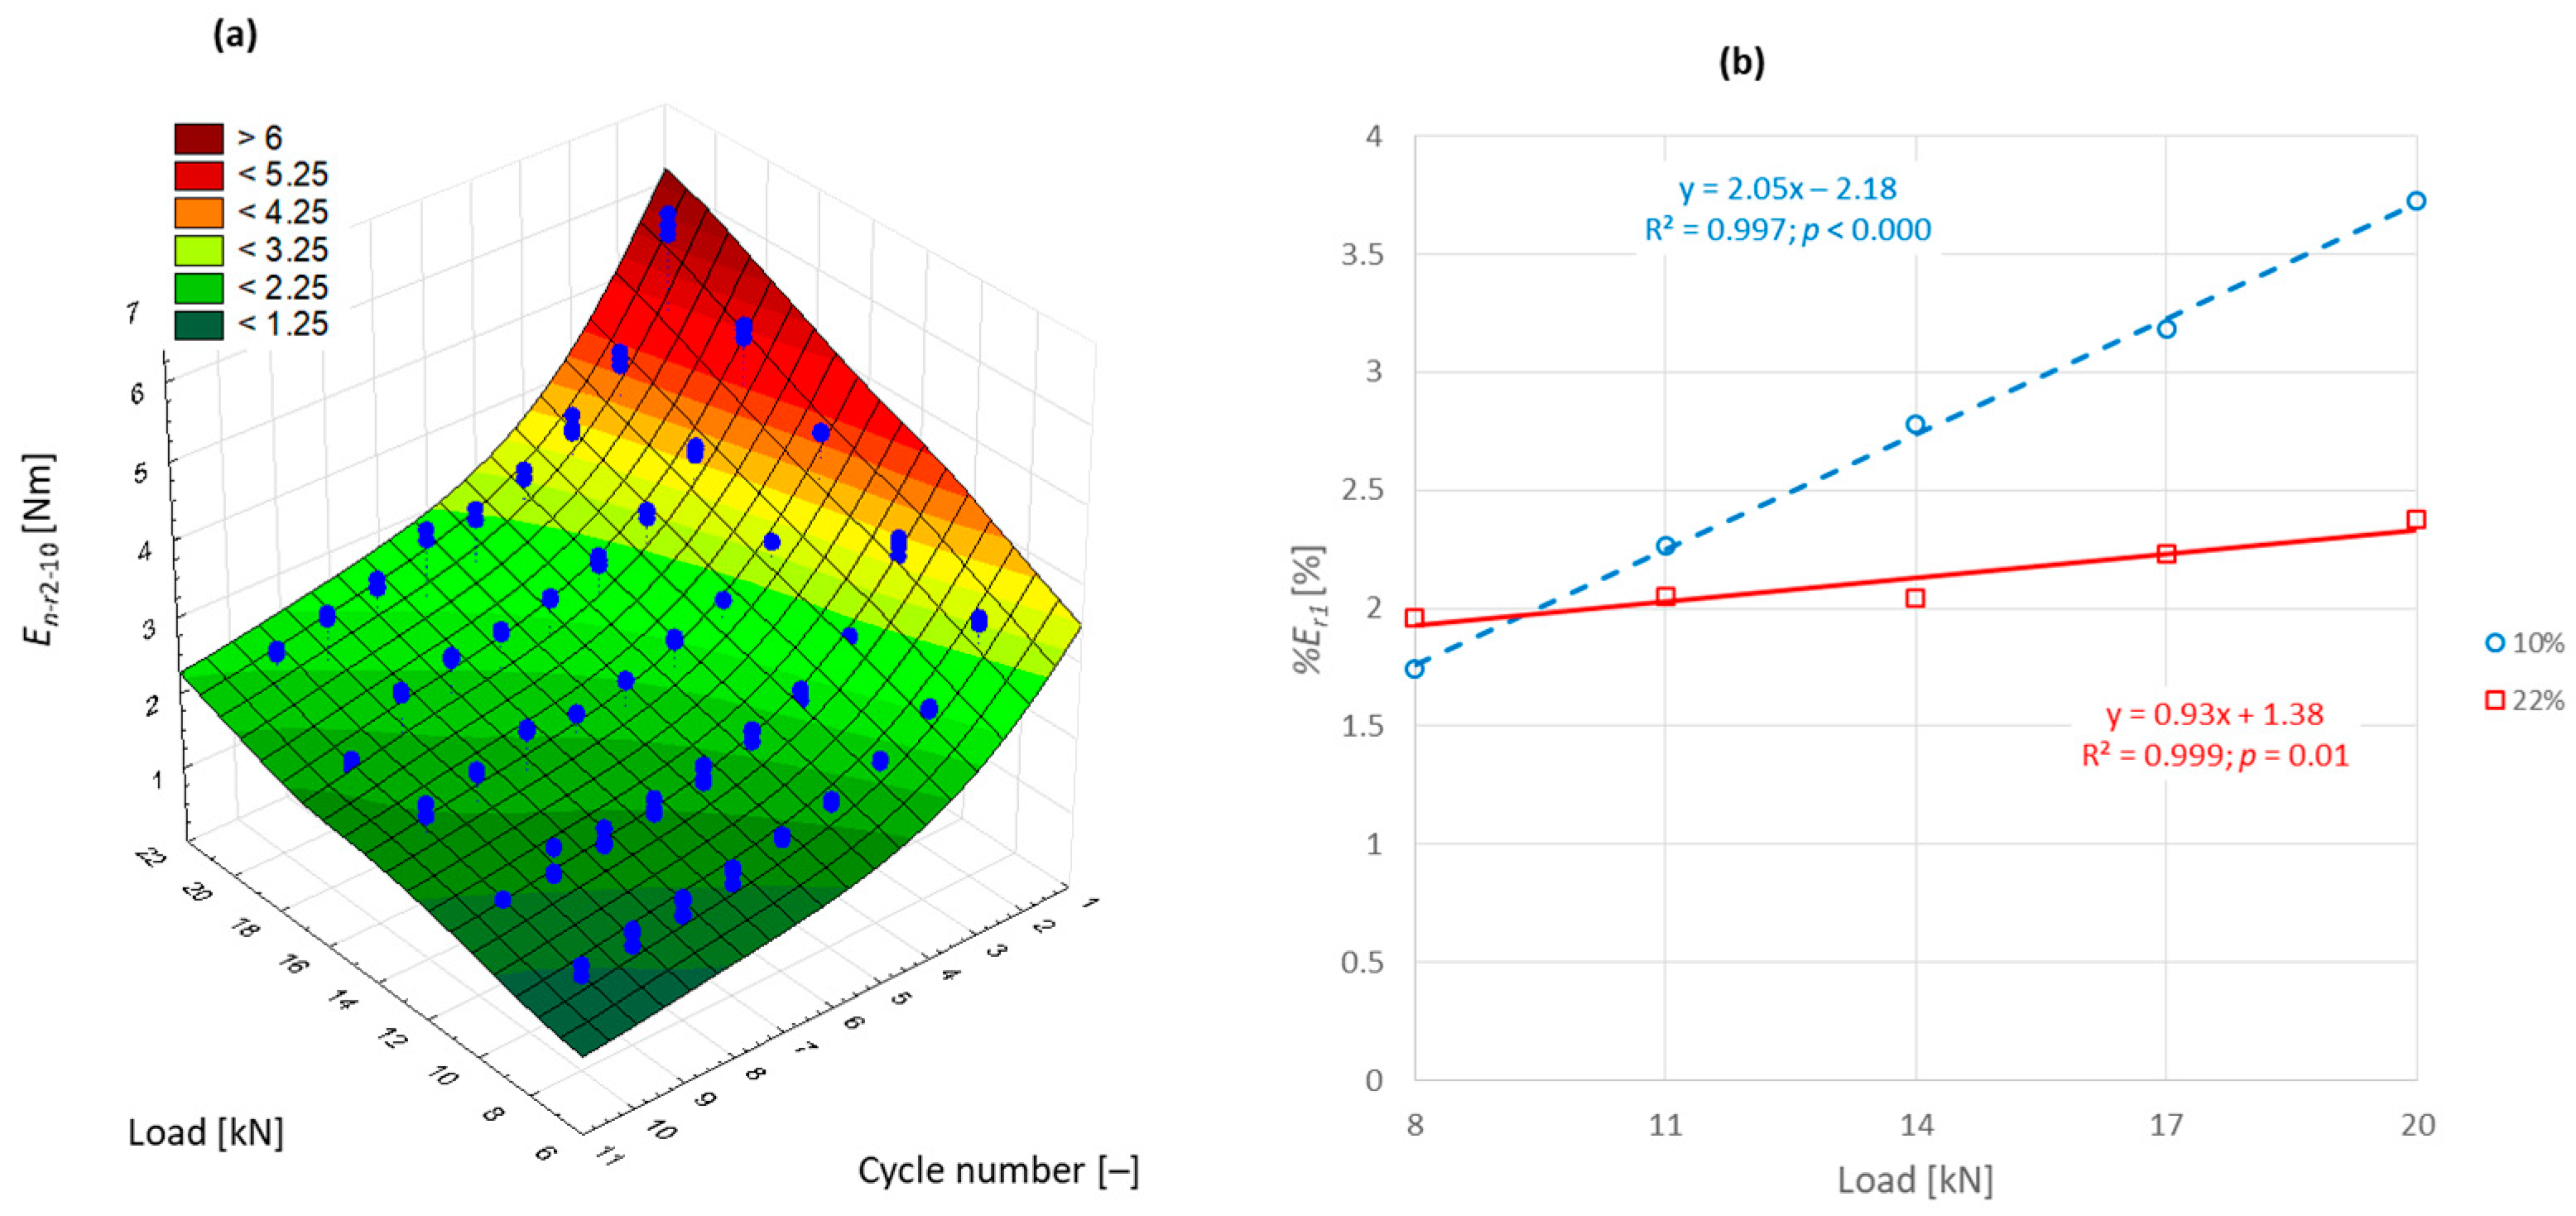
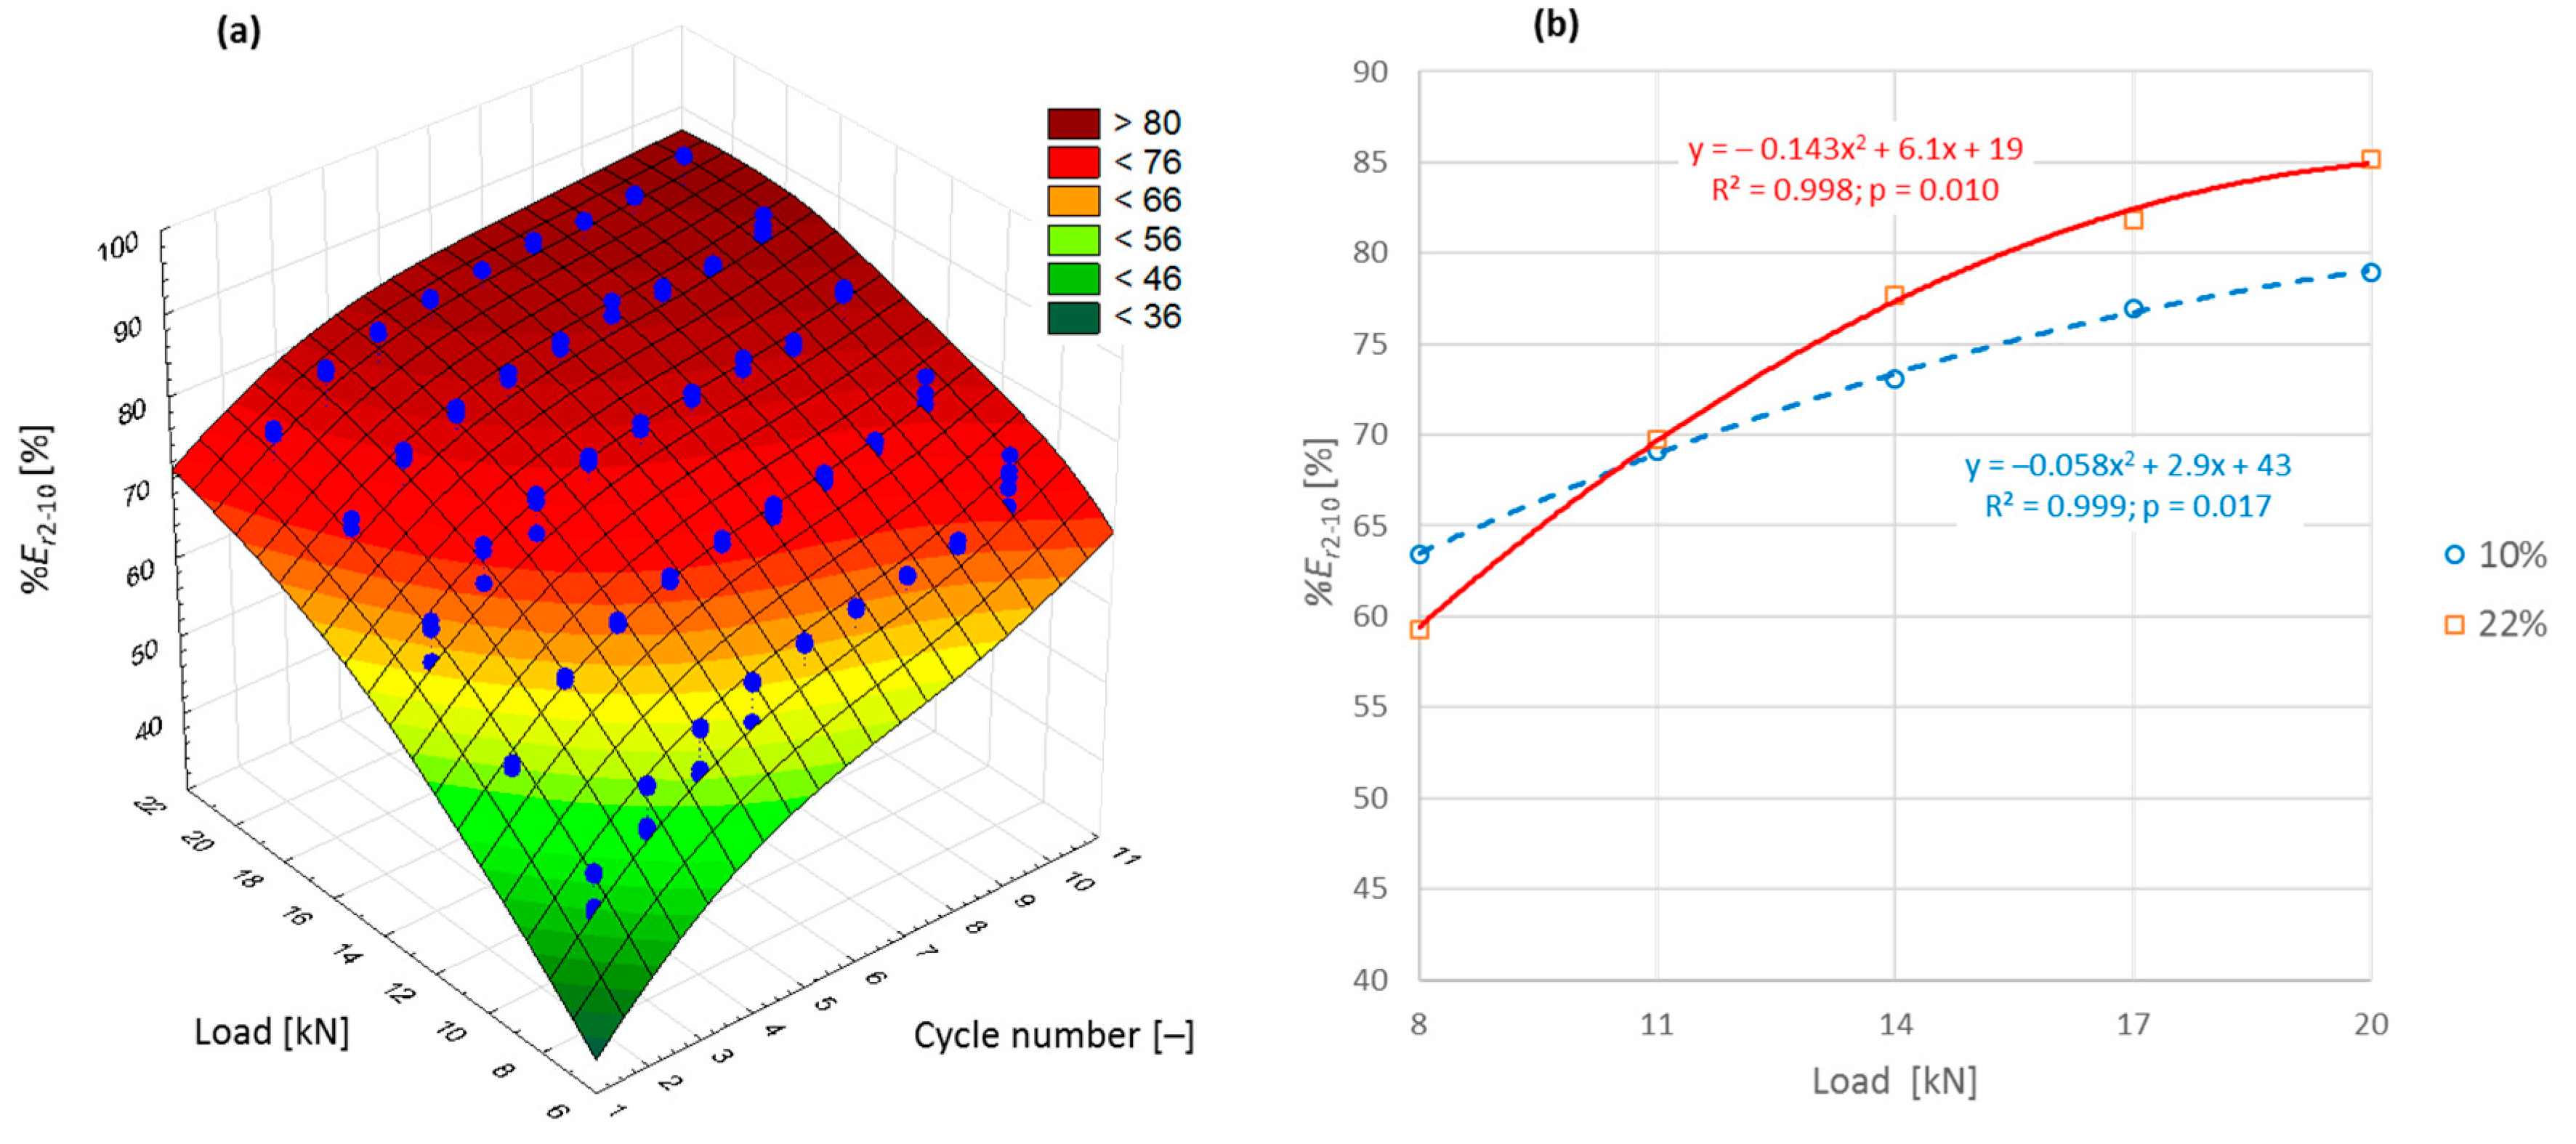
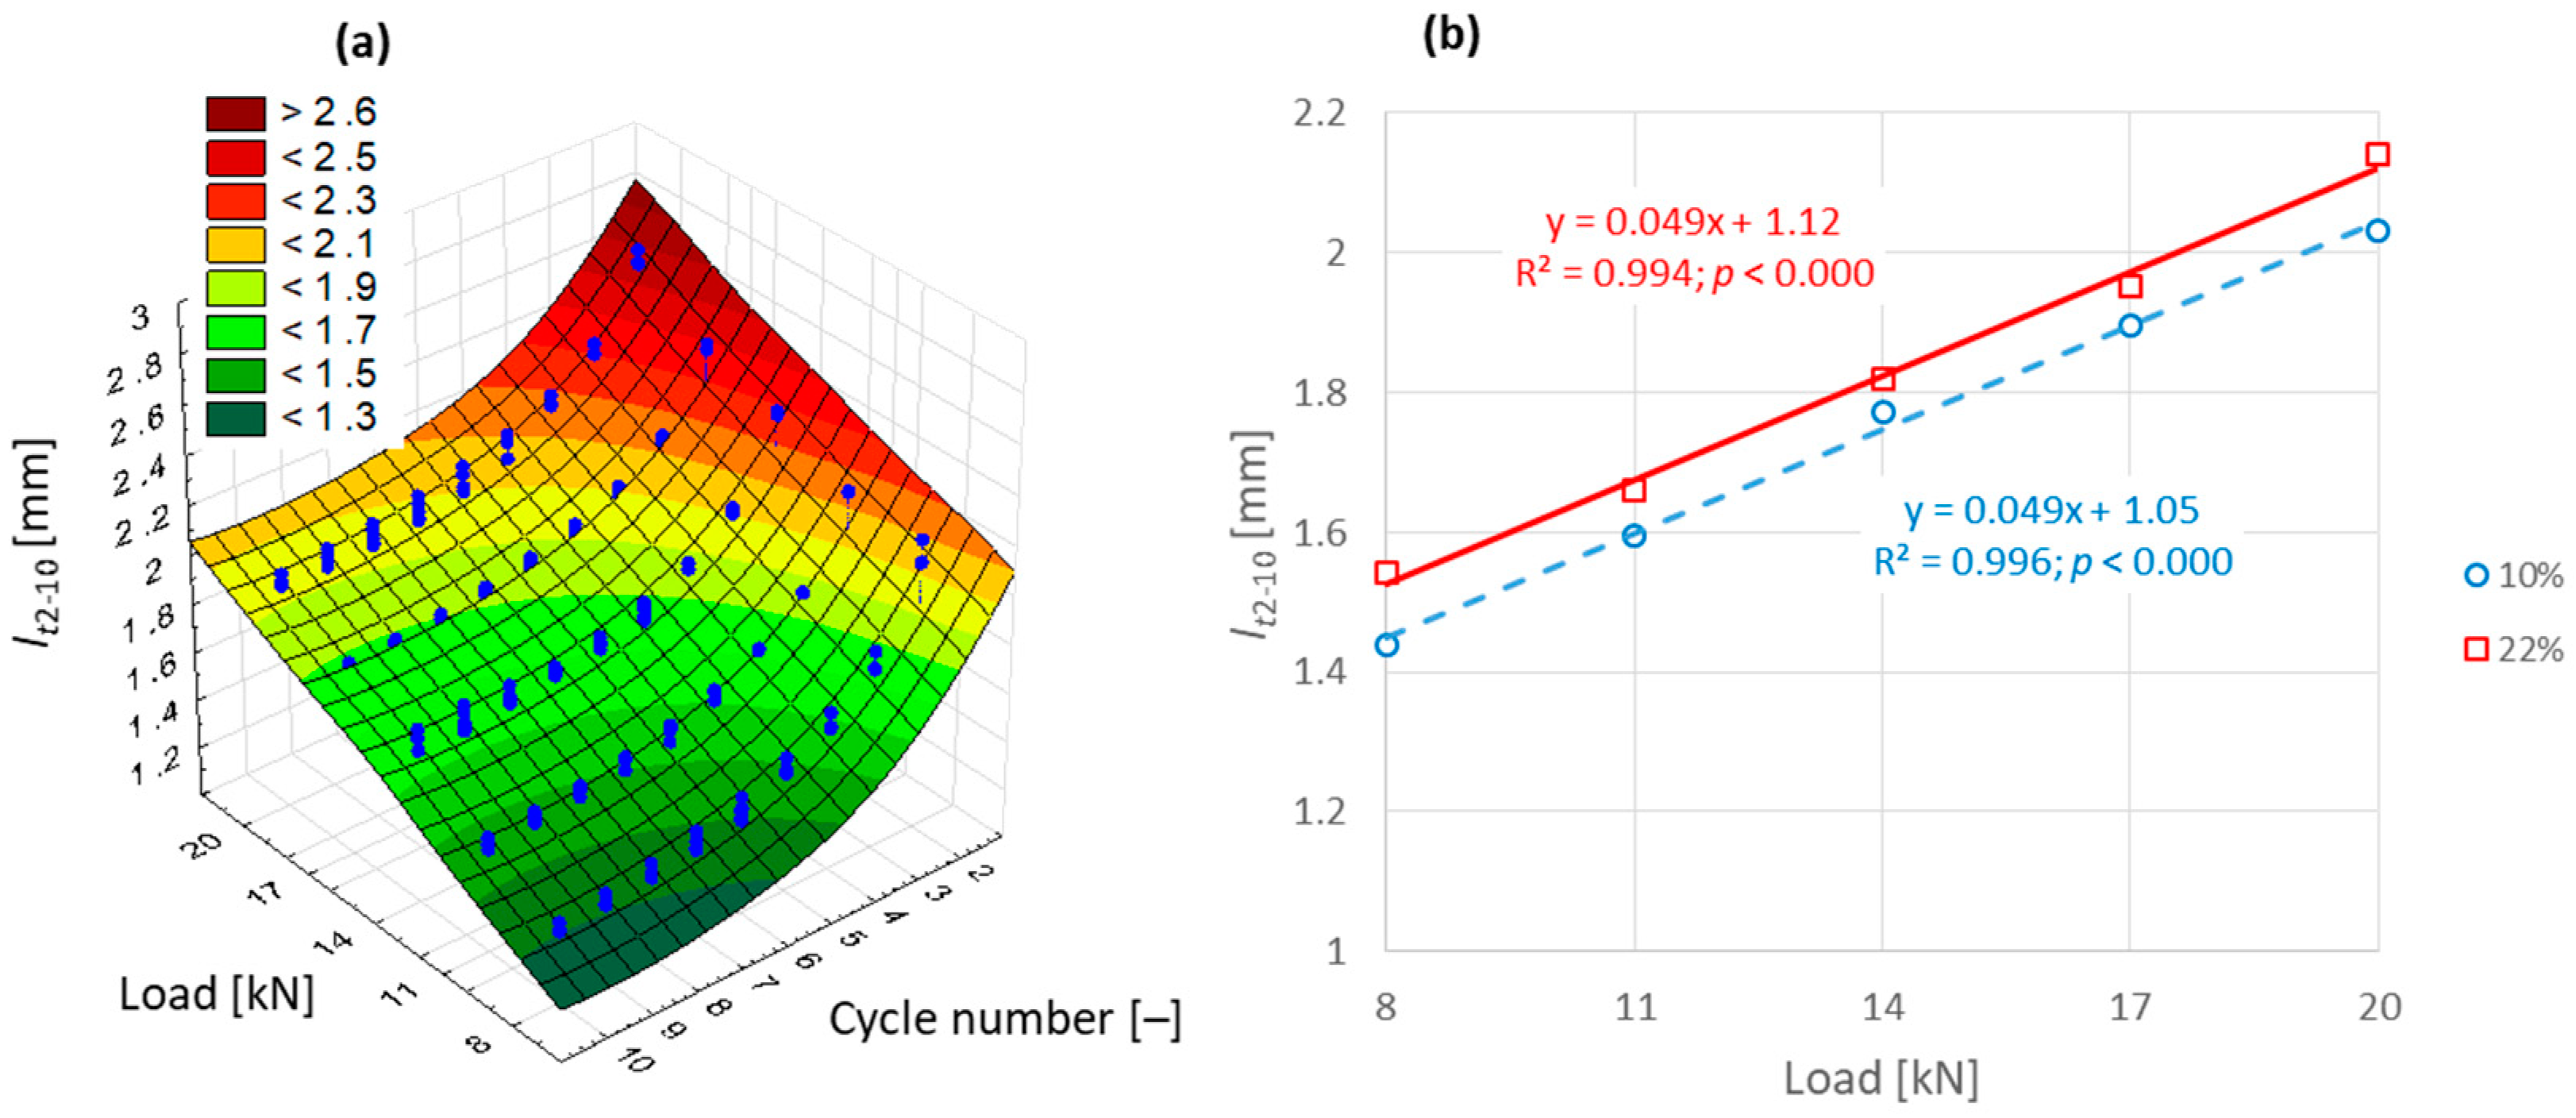
  • The elastic energy dissipated was independent of moisture content and cycle number and remained relatively constant. The pressure applied in the study was 113.2 MPa, which was high enough to obtain pellets with good strength characteristics. Hence, it was examined whether, at lower pressures, the elastic strain energy released as a result of strain relief is also independent of moisture content, which is a key factor in the thickening process. It was also noticed that the share of elastic energy increased with the moisture content of the digestate. This unexpected conclusion should also be verified (validated) under different loading conditions.
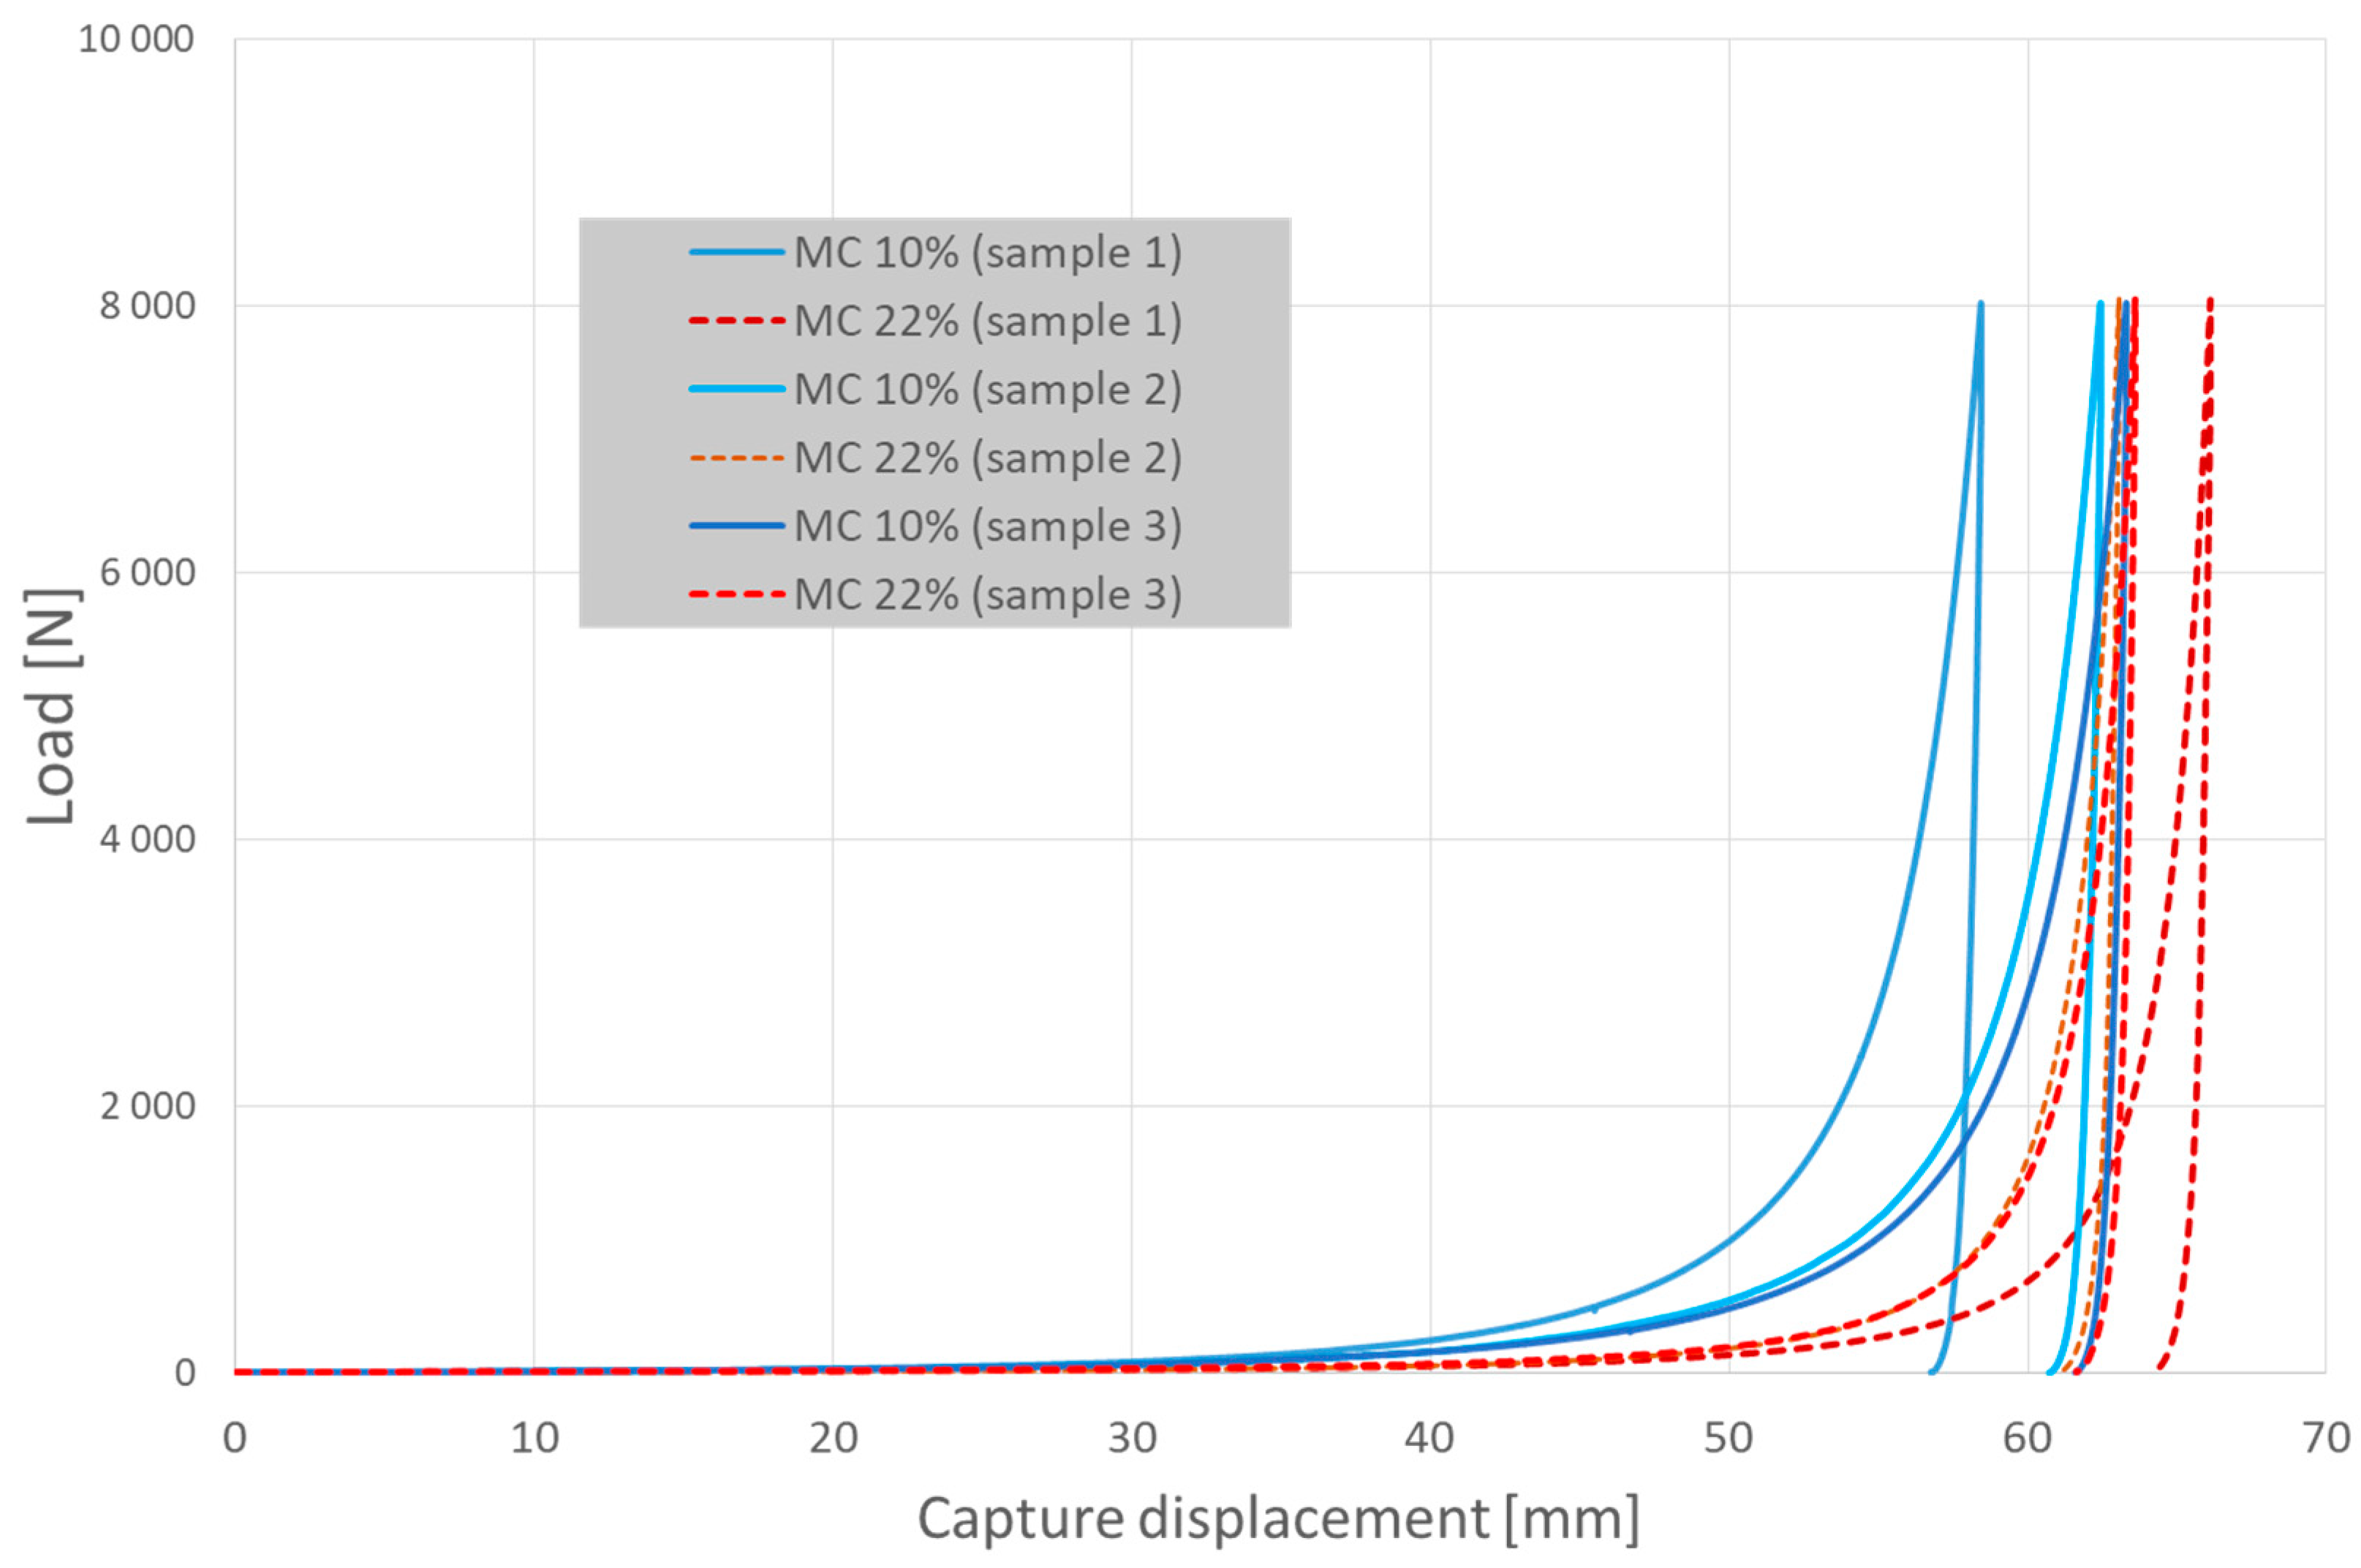
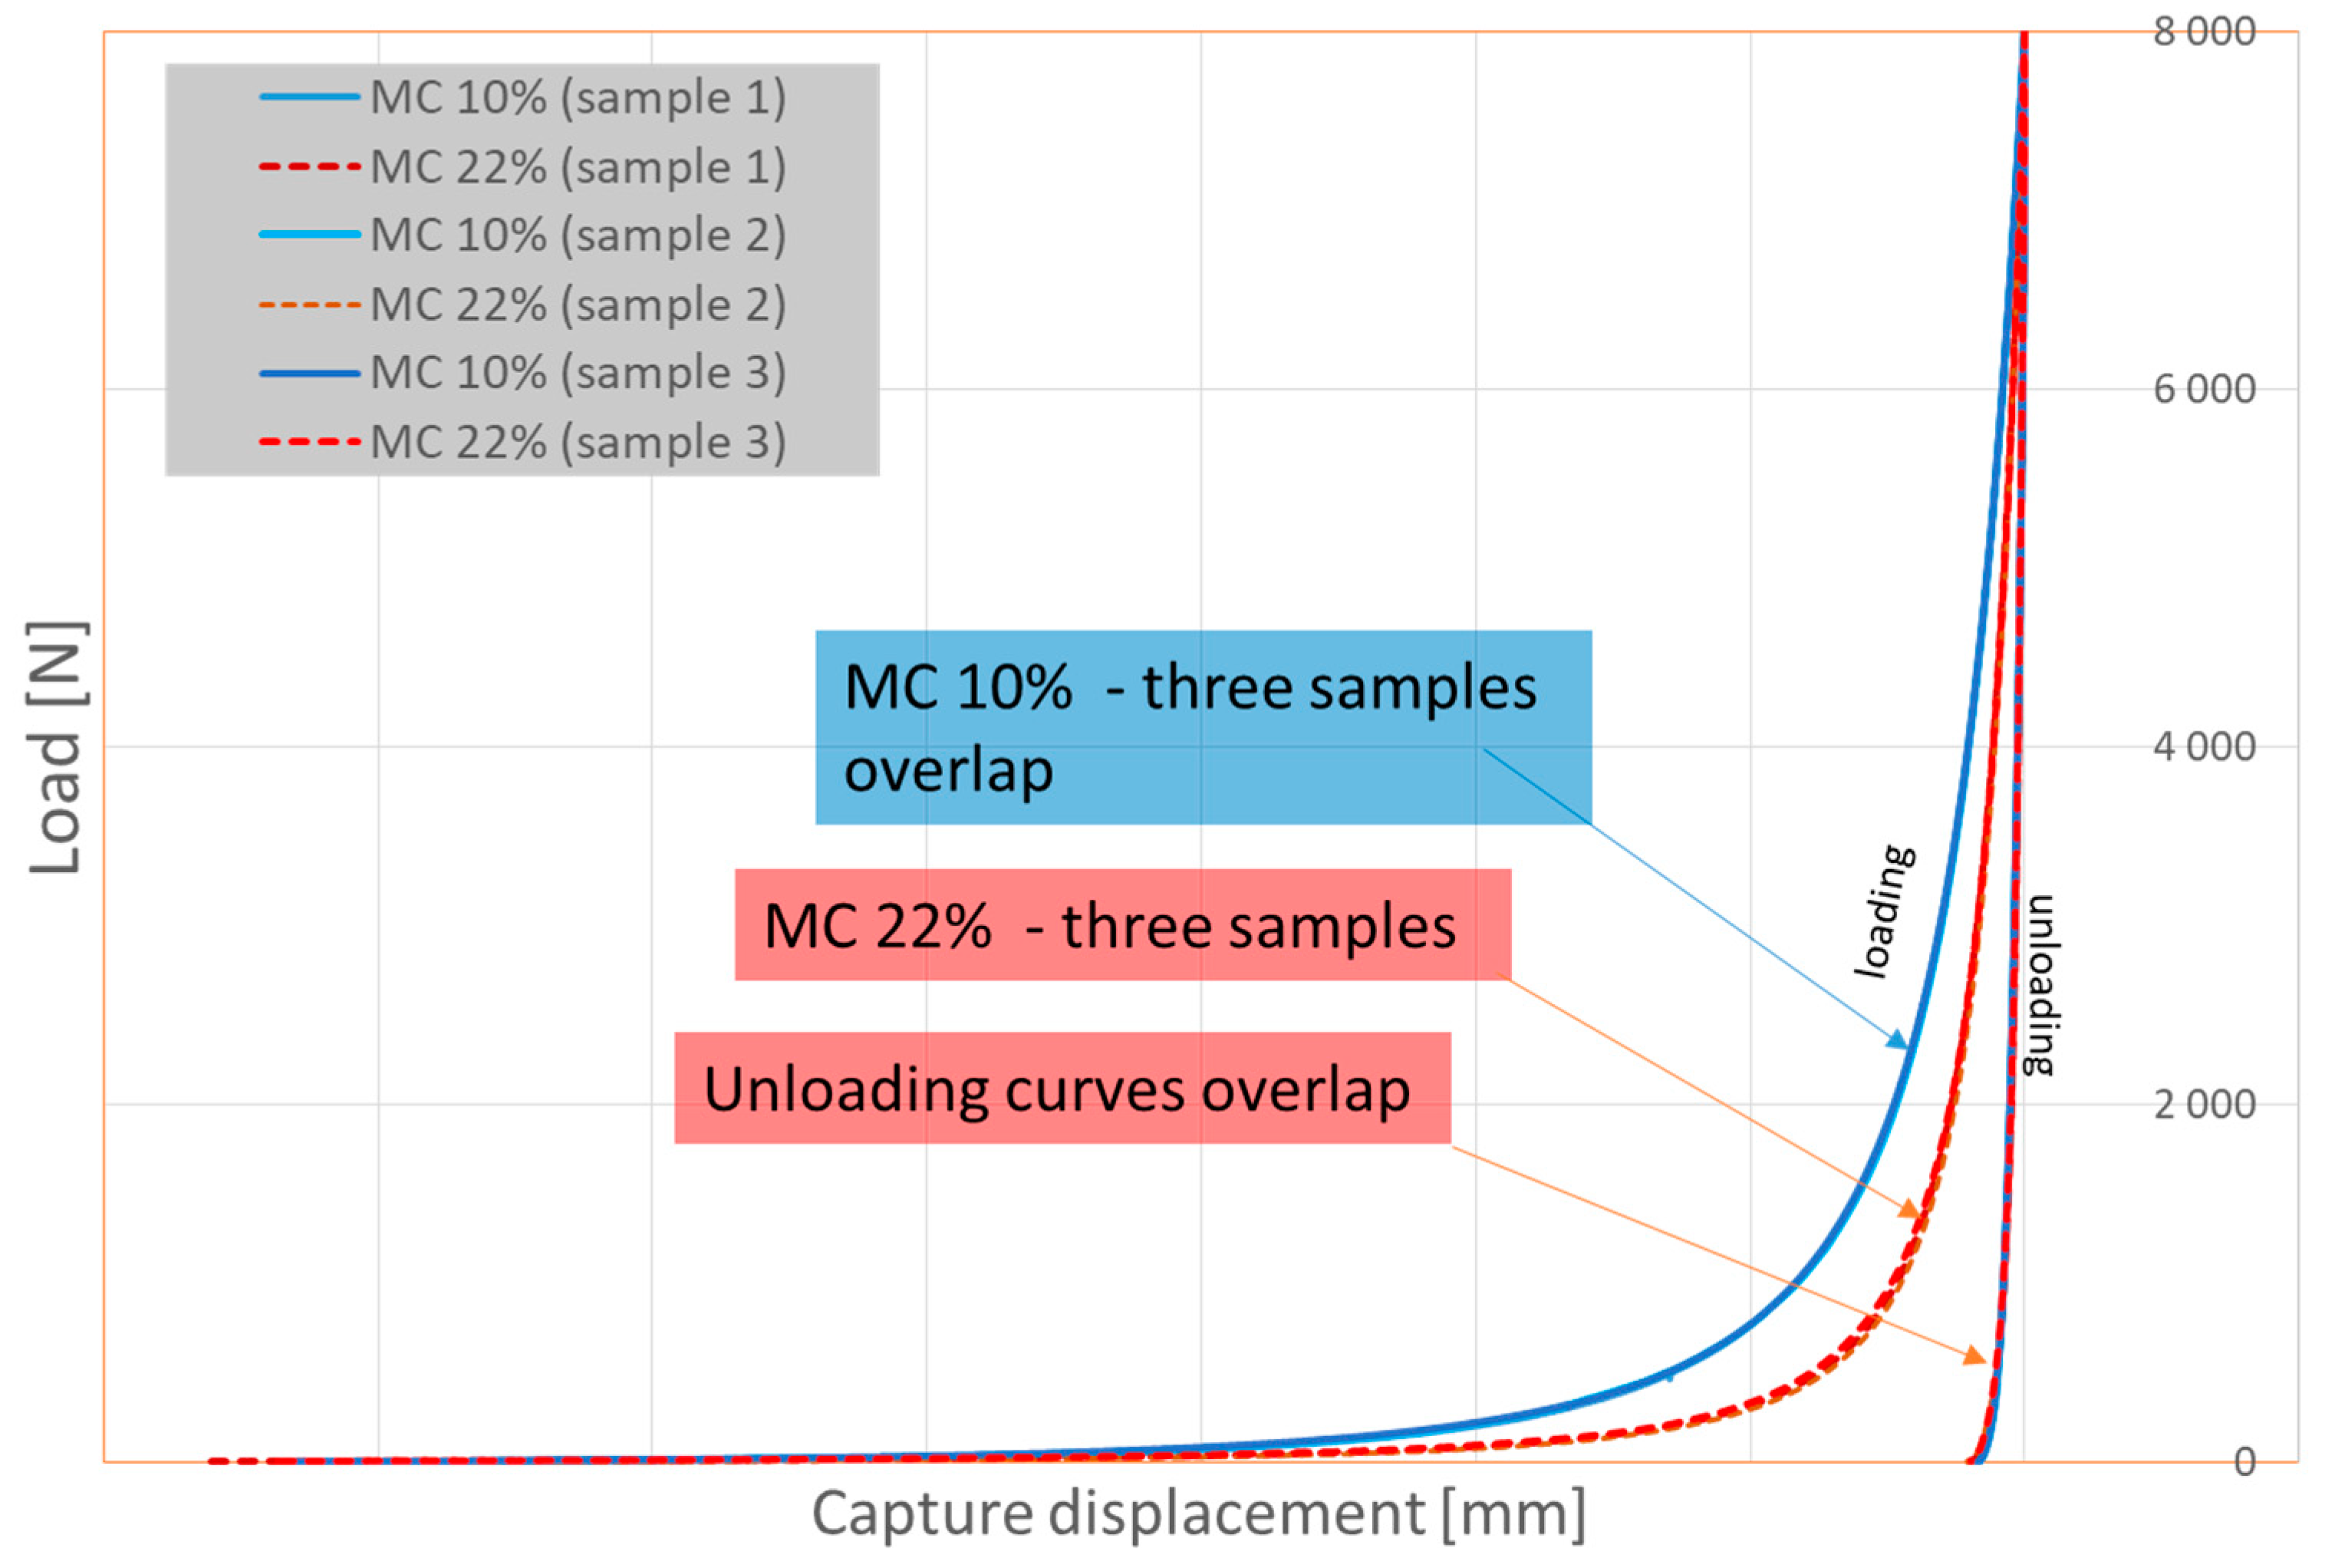
  • The second observation was related to the hysteresis loop (the shape of the field area enclosed between the loading and unloading curves). For wet SAD, an immediate elastic response (springback) was observed at the applied pressure, whereas a contrasting result was observed for dry digestate. This also suggests a possible effect of the loading force, which should be investigated in detail.
The objective of the present study was to analyze the influence of loading level on the behavior of anaerobic digestate during cyclic confined loading. The study validates the above-mentioned observations of the previous study at different pressure conditions.

2. Materials and Methods

The SAD used and the procedures followed in this part of the work were the same as in the first part [32], in which the effect of moisture content on the distribution of energy and deformation as a result of the cyclic loading of digestate in a closed matrix was analyzed. All other test conditions, such as the device, speed ranges, and operating parameters, were the same as those previously described [32]. In the present study, cyclic loading tests were performed with five loading levels—8, 11, 14, 17, and 20 kN. These levels corresponded to pressure in a range of 45.3–113.2 MPa. A quick overview of the study is illustrated in Figure 1.
Two-gram samples of SAD were placed in a closed die of 15 mm in diameter and loaded to achieve values of 8, 11, 14, 17, and 20 kN. These levels corresponded to pressure in a range of 45.3–113.2 MPa. The loading phase was followed by an unloading phase until the force decreased to 2 N. Then, another loading/unloading cycle began. The number of cycles was set to 10. For each applied load level, the experiments were carried out in triplicate. A quick overview of the methodology is illustrated in Figure 1.
Based on the recorded hysteresis loops, the total compressive energy Et, as well as the values of reversible (elastic) energy Er and irreversible (permanent) energy En-r, were established (Figure 1). Parallelly, the corresponding values of head displacements were used to determine the evolution of deformations, i.e., total, lt, elastic, lr, and permanent, ln-r. The relative percentages of reversible and irreversible energy and deformations were also estimated (%Er, %En-r, %lr, and %ln-r). All of the operating parameters were controlled using Zwick’s testXpert software. The results were compared for two distinct moisture contents of 10% and 22% (wet basis).
The pellets formed during ten loading cycles were removed from the compaction chamber, and their basic dimensions were determined using a digital caliper with an accuracy of 0.01 mm. The pellets were stored for 24 h in a refrigerator and then measured again. Subsequently, each individual pellet was loaded perpendicularly to its longitudinal axis according to the procedures determined in the Brazilian indirect tensile test [32]. The strength index (SI in MPa) was determined according to the relation:
S I = 2 F m a x π d l 24 [ Mpa ]
where Fmax is the force at the ultimate fracture point, l24 is the pellet length after 24 h, and d is the diameter of the pellet.

3. Results and Discussion

3.1. Effect of Load on Energy and Deformation Distribution—First Loading/Unloading Cycle

Figure 2 shows the total energy inputs for the first loading phase and for the proportion of recoverable and nonrecoverable energy components. As the loading pressure increased, the energy inputs, as expected, also increased. The linear relationships between these parameters were confirmed with strong determination coefficients. Interesting observations were noted when the effect of loading on recoverable and nonrecoverable energy inputs was investigated (Figure 2b,c). The value of recoverable (dissipated) energy ranged from about 2.80 to 13.3 Nm, and its effect was not dependent on the moisture content. This is in accordance with our previous study in which no effect of moisture on the dissipated energy was observed for the five moisture levels studied [32]. This trend was consistently observed for different loads and subsequent loading cycles. Moreover, the share of recoverable elastic energy increased with increasing moisture content. Notably, there are no comparable studies in the existing literature to draw comparisons from. During the first stage of compaction, mutual particle displacement occurs, and the majority of the applied energy is lost to it. However, the shape of the curves observed during the final stage of compaction was clearly influenced by the digestate moisture. For the moisture content of 22%, a significant amount of nonrecoverable energy resulted from the pure elastic response (the linear portion of the loading/unloading characteristics observed in the final stage of compaction). It is noteworthy that although the dissipated elastic energy was independent of the digestate moisture content, the shape of the area used to calculate it differed significantly. Further analyses are currently underway to explore this elastic recovery phenomenon, which indicates an increase in springback with moisture content. Hence, a more detailed analysis of the loading/unloading curves may provide valuable insights.
The results showed an interactive effect of moisture and loading force on the energy used for the consolidation of digestate particles (nonrecoverable part). For digestate with a low water content, the specific increase in energy was significantly higher. This is expressed in Figure 2c by a higher slope of the linear relation for digestate with a 10% moisture content. This value of the slope was almost 5-fold higher in comparison to the digestate with a 22% moisture content.
Figure 2d shows the proportion of recoverable energy. The share of the elastic component rose linearly with the loading force. This increase was also dependent on moisture. The absolute values of both recoverable energy and the relative increase in the applied load were higher for moister digestate. The shares of permanent energy inputs declined accordingly, but their values were only a few times higher than the shares of dissipated energy. In relation to the applied load, the values were 5–10-fold higher for digestate with 10% moisture and about 1.5–6-fold higher for digestate with 22% moisture.
While higher energy inputs at higher loads are an expected outcome, higher head displacements could also be expected for higher load values. However, the latter was not supported by the results (Figure 3a,c). An increase in total displacements up to 14 kN load values was observed for the 10% moisture content. On the other hand, higher loads (17 and 20 kN) did not significantly alter the displacements. The same trend was observed for the 22% moisture content, but in this case, the displacement values decreased as the load increased from 8 to 20 kN. As was seen in the previous study [32], the mean displacements were higher for the drier material. However, the displacements for moister material were larger for the lowest loads of 8 kN. It was noted that reversible deformation is the only parameter that increased with rising load level (similarly for the two moisture levels compared), which was confirmed for all levels of load tested. In the previous study [32], the values of elastic deformations, and the proportion of these deformations, were found to increase with increasing moisture content. Moreover, in the studied, albeit wide range of moisture content, the absolute values of elastic energy did not change significantly, while the percentage of elastic energy increased. The conclusion drawn from the above observations that the elasticity of digestate increases with increasing moisture content, which is quite ambiguous, was also proven by the results of the present study. The lack of influence of moisture content on the values of elastic energy (Er1) was confirmed over the entire range of applied loads. For all levels of loads tested, the proportion of elastic energy (%Er1) was also found to be higher for higher moisture levels. Similarly, in the present study, higher values of elastic deformation (lr1) and its share (%lr1) were observed in the first phase of compaction for all load levels (Figure 3b,d). The regressions were closely linear, with very high determination coefficients. It should be added that in this first cycle, the proportion of elastic deformation to total deformation was small, ranging from 2.76% to 4.20% (Figure 3c).
In the previous work [32], the analyses performed did not show a significant effect of moisture content on the deformation values for the first cycle. It was only indicated that for a higher moisture content, the value of the total deformation was lower. On the other hand, as deformation increased, the value of force increased at a faster rate (above 55 mm). However, the data shown in Figure 3 do not seem to confirm this observation. For a load of 8 kN, higher displacements were recorded for the digestate with higher moisture content. Figure 4 shows six loading/unloading characteristics of three individual samples with a 10% moisture content and three with a 22% moisture content, for 8 kN of loading.
A comparison of the above-presented curves proved to be complex and could possibly indicate the weak quality of the samples. However, it should be emphasized that the frequently observed mechanical behaviors vary over a wide range, particularly when dealing with the processes associated with the disintegration of the tested structures [62]. The data shown in the figure were rearranged in such a way that the maximum value for all curves was reached at the same time. This required shifting the characteristics, as shown in Figure 5.
As can be seen, the analysis performed allowed samples with different levels of moisture to be clearly distinguished. The waveforms of the curves for samples with the same moisture content practically overlapped for both 10% and 22% moisture contents. This confirms the homogeneity of the moisture content of the samples. Furthermore, it can be observed that at higher deformations, the measurements were very repeatable. It can therefore be presumed that the observed lack of significant differences is related to the uniqueness of the first phase of the compaction process. The low repeatability of this phase implies that it is often ignored in the modeling of the compaction process [26,50]. In this sense, the results obtained may have important implications for process modeling.
The above analysis helped to explain the effect of the applied load on energies and deformations. As shown in Figure 5, in the initial compaction stage, the increment of force as a function of deformation was markedly lower for the moist samples. In contrast, in the final compaction stage, a more pronounced load increase was observed, This can explain why the increment in energy was lower for higher moisture. Additionally, as the contribution of the effect increased in the final stage, larger differences were observed for higher loads. Considering that the elastic energy was independent of moisture content, the influence of the load on the values of total and nonrecoverable energies is closely related to the force–deformation course during the loading phase.
In the study of Frodeson et al. [29], the compression stage was divided into two phases, between 1–5 kN and 5–14 kN. Their results demonstrated that moisture did not affect compression energy up to 5 kN, while above it, the energy needed for the densification of stiffer polysaccharides (avicel, locus bean gum, and woods) decreased. In contrast with more flexible polysaccharides (xylan and pectin), an increase in energy demand was observed. During the second stage, a higher rate of increase in the compacting load for moister materials was generally observed. Lisowski et al. [63] reported that during the compaction of milled walnut shells at the moisture content of 11.3%, the pressure increase was almost directly proportional to displacement. The authors stated that only a rearrangement of particles and the filling of empty places without the deformation of particles occurred, because the compaction pressure did not exceed 8 MPa. Moreover, they reported that the change in the curve’s slope for higher moisture levels after the initial stable period indicates the beginning of elastic and plastic deformations. Laskowski et al. [64] conducted a study on the compaction behavior of over 50 biological materials and observed that, for high pressures (203.8 MPa), the energy required for the first densification stage and the total energy decreased as the moisture content increased. However, the energy required for the last phase (linear increase of the load) increased with rising moisture. On the other hand, when pressures were lower (50.8 MPa), all of the aforementioned energies decreased, although the smallest decrease was observed for the energy applied in the last compaction stage. Moreover, an increase in the moisture content led to a decrease or increase in the material density depending on the pressure applied.
It is reasonable to expect that as the pressure increases, the density of the material also increases due to the decrease in the volume of the compacted material [39,52]. Jiang et al. [55] reported that pellets with a higher density can also be obtained under low pressures. The limited effect of pressure in the range of 46–114 MPa on the density of Norway spruce pellets was reported by Rhen et al. [31]. Furthermore, it is necessary to distinguish between the density (volume) of the pellet in the die and the density of the pellet after its removal from the die. The pellet changes its lateral dimensions due to stress relaxation (springback) over a wide timescale [65,66]. Considering the effects of the applied pressure on changes in density and the formation of permanent bonds between particles, it is critical to take into account the following: (1) physical changes in the compacted material occur following the reorganization of its structure, accompanied by the removal of free spaces, packing and breakage of particles, and permanent and elastic deformation; (2) under favorable conditions such as adequate moisture or temperature, sufficiently high pressure causes the release of substances that act as a binder and regulate the flow, as well as the formation of strong bonds [49].

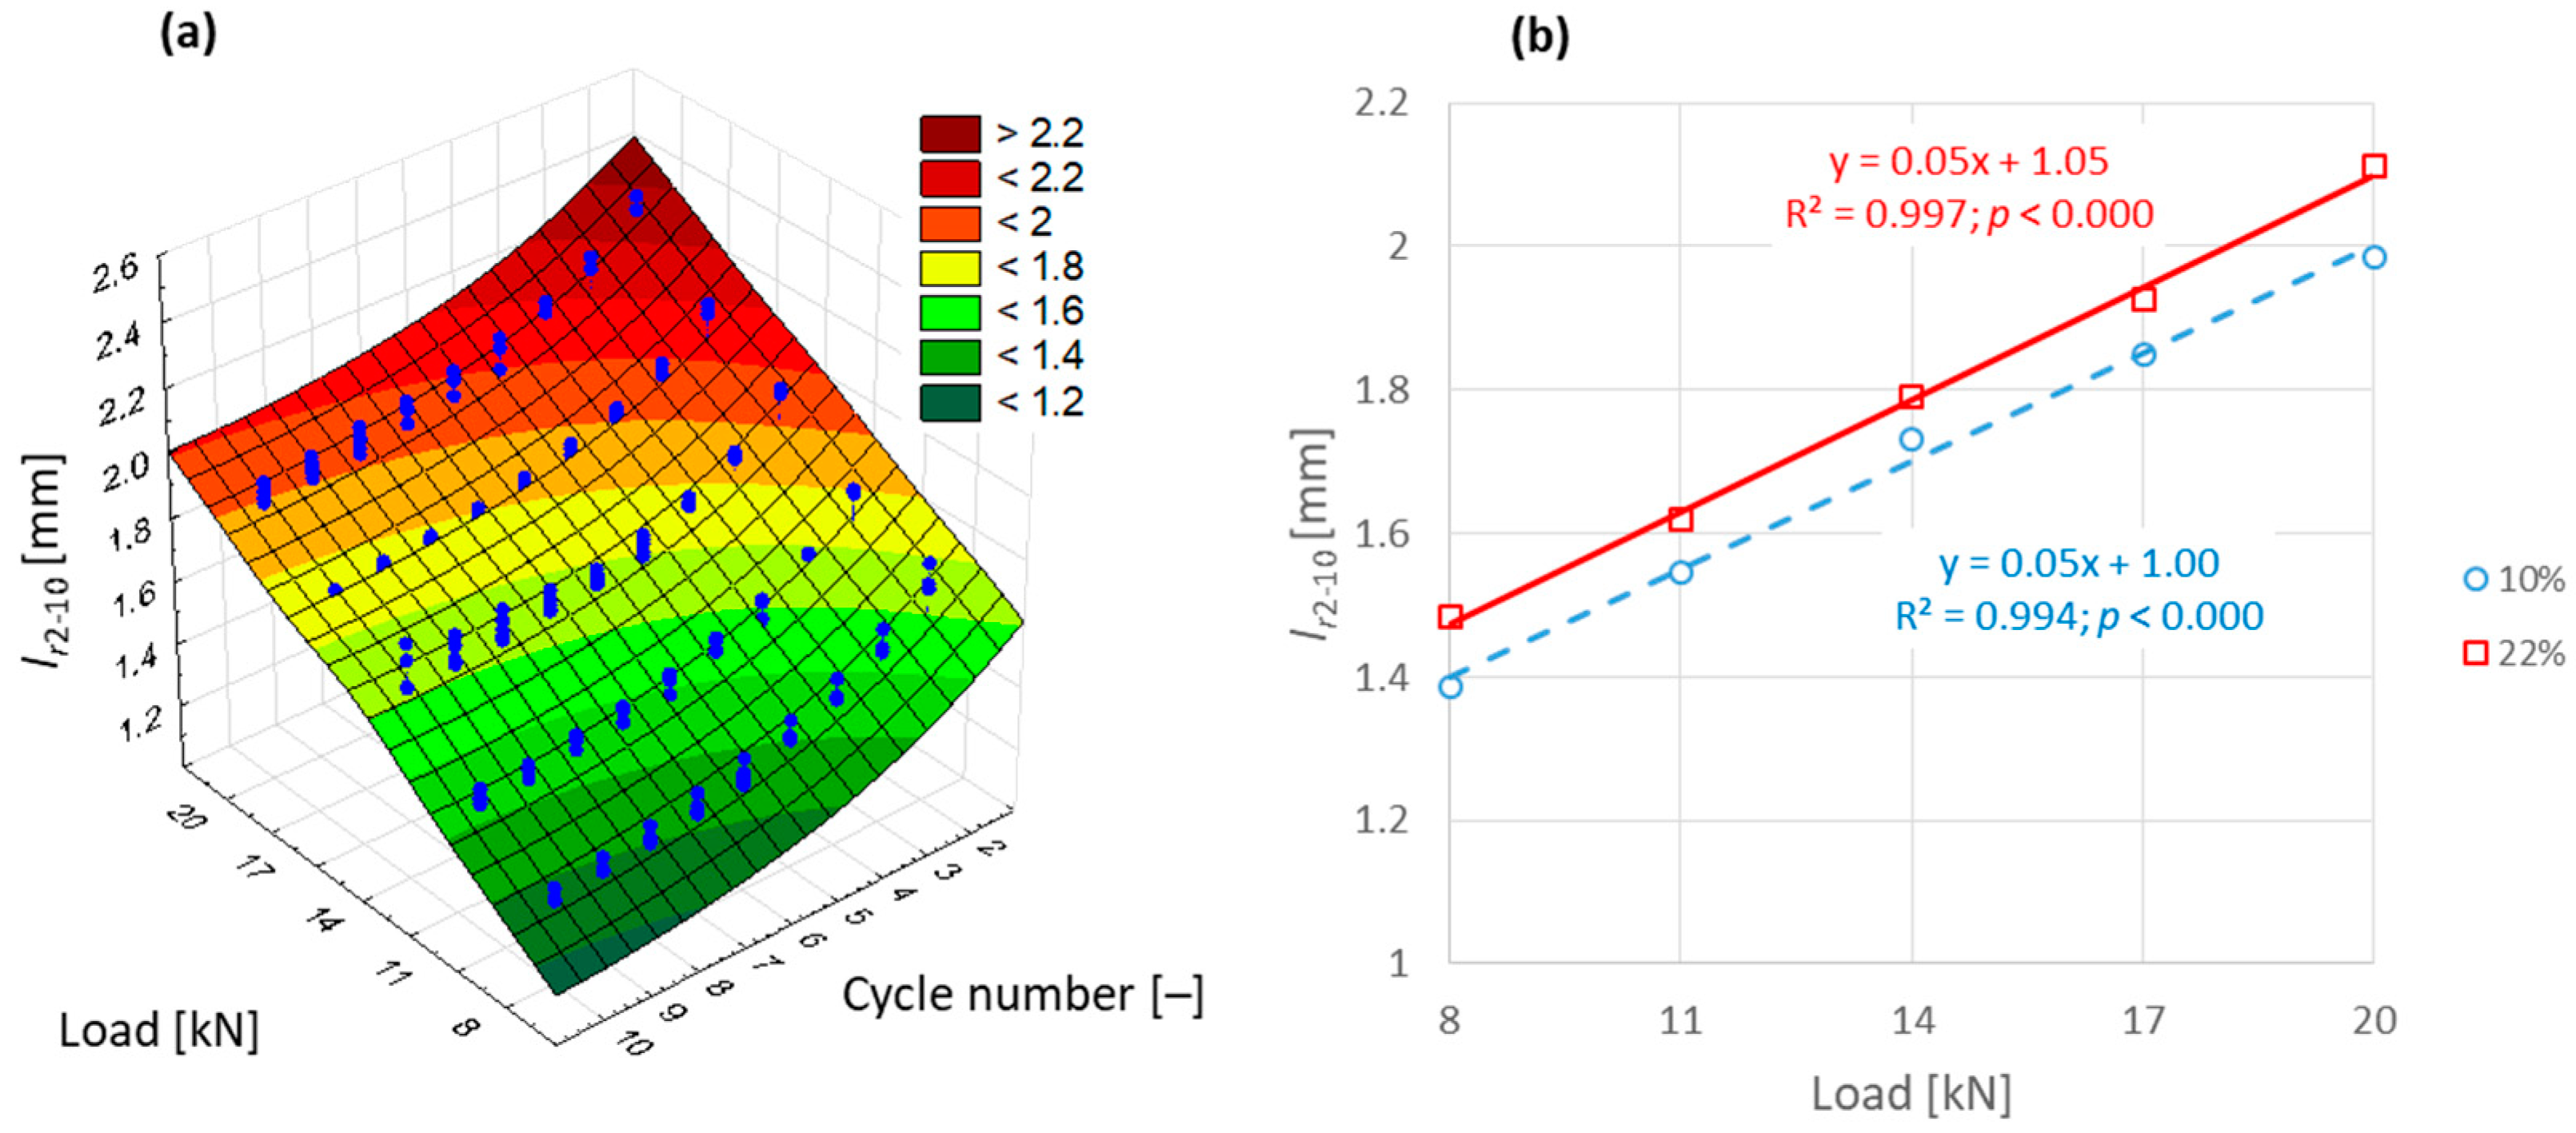
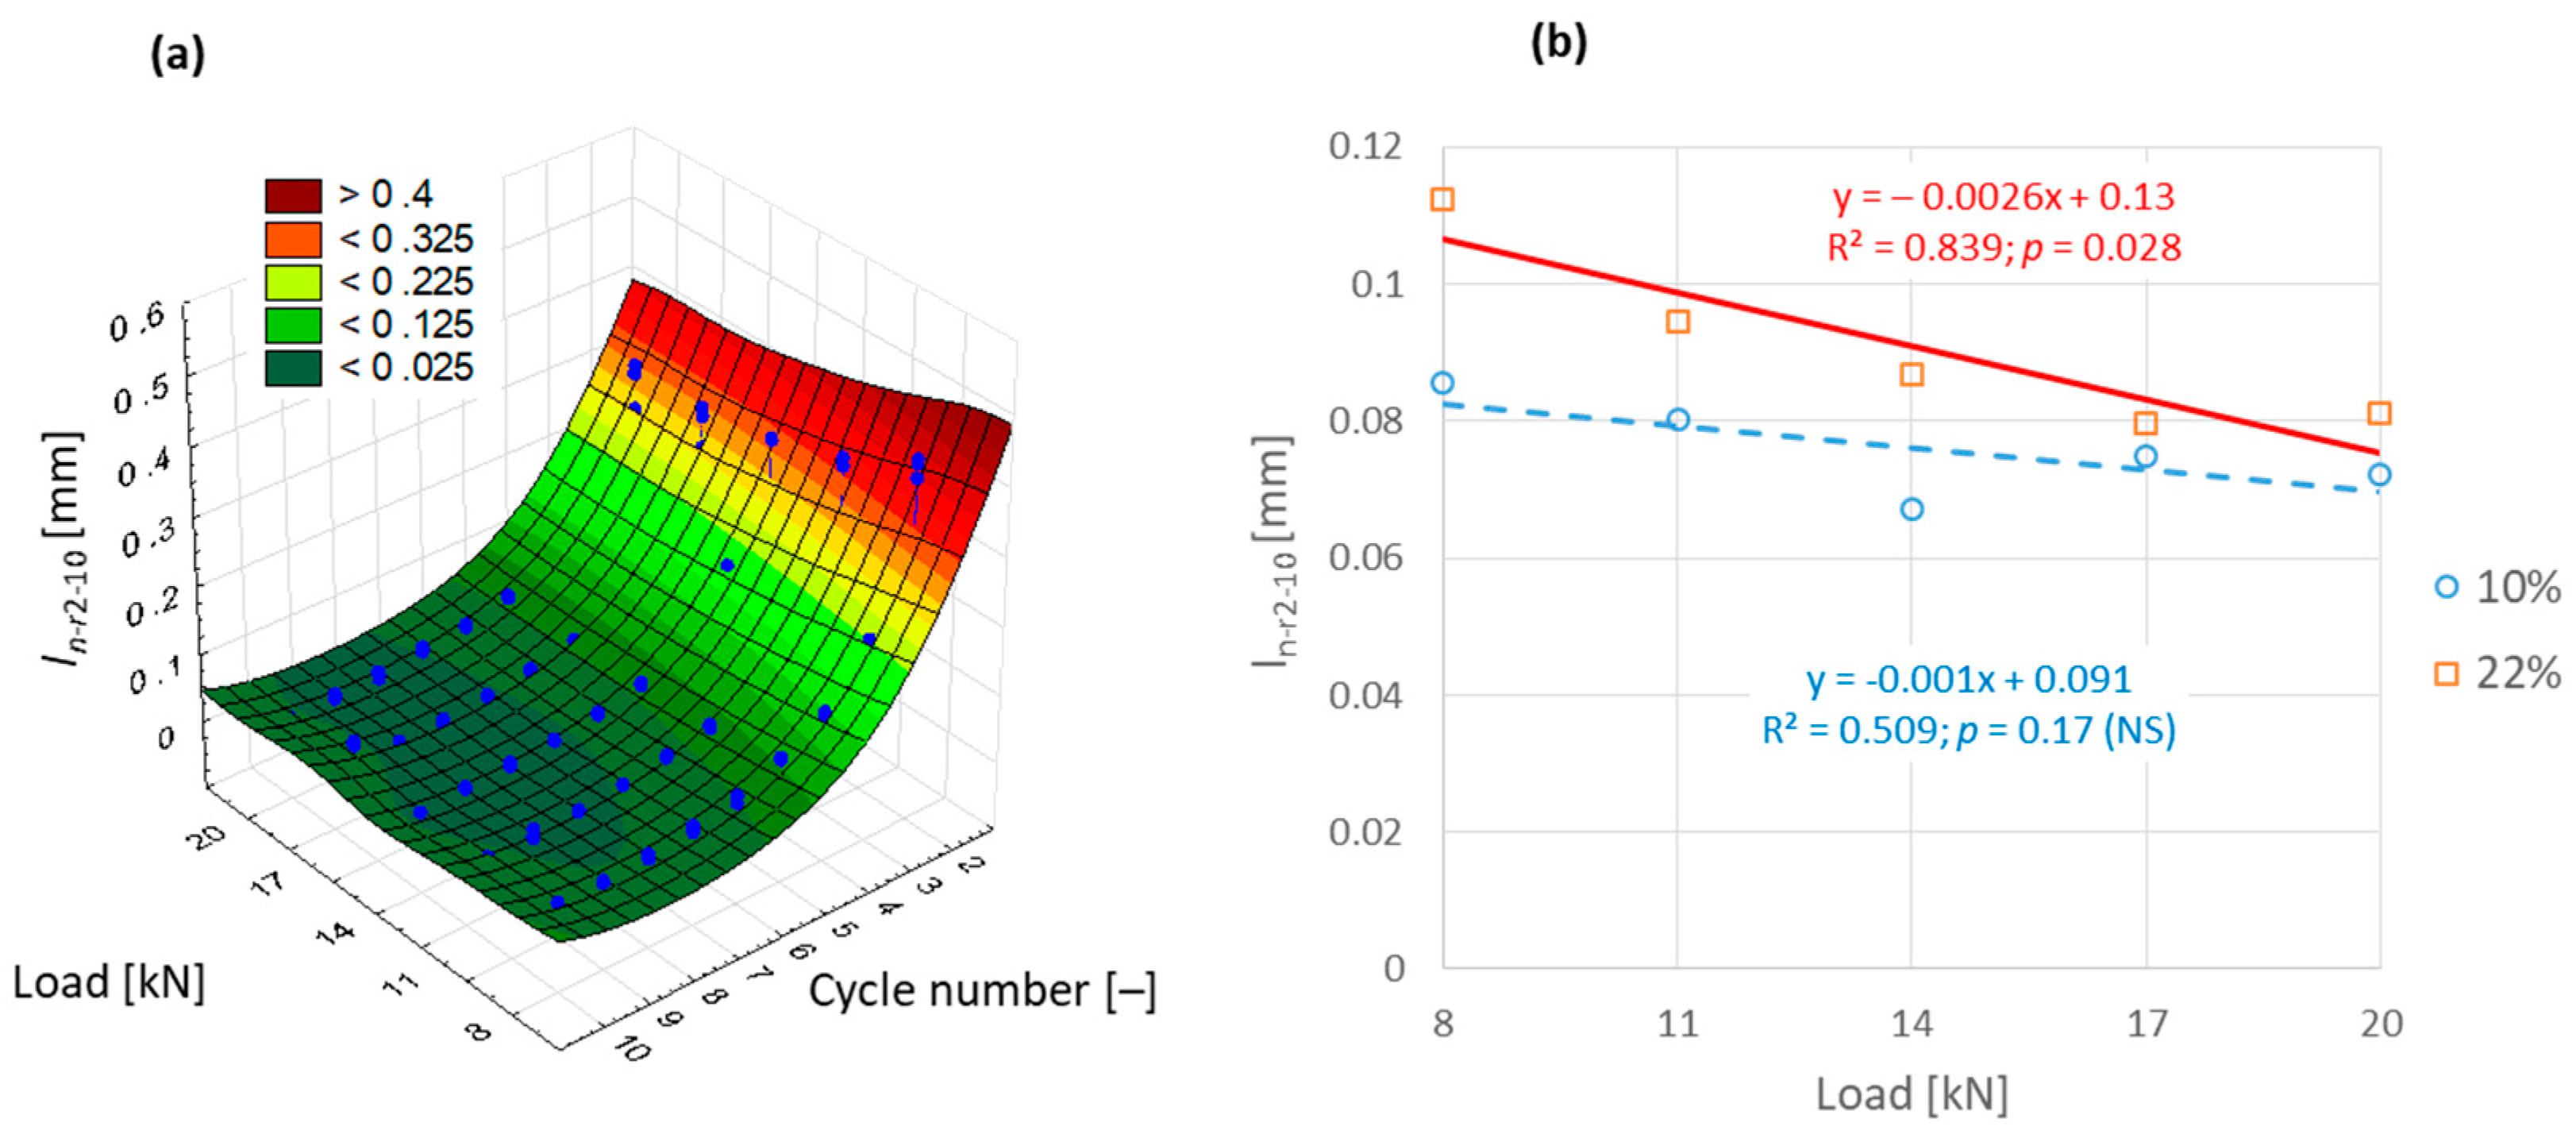
3.2. Effect of Load on Energy and Deformation Distribution—Cycles 2–10

The distribution of compaction energy during loading/unloading for cycles 2–10 is illustrated in Figure 6. The total energy increased with the load applied. The polynomial regressions were used to describe the relationships with very high determination coefficients (0.999). This increase in the compaction energy was slightly higher for the sample with a lower moisture level. The observed dissimilarities were also higher in the case of higher loads. At the load of 8 kN, no statistical differences were observed.
The effect of the loading level on the energy dissipated in cycles 2–10 is shown in Figure 7. A closely proportional increase in the energy was observed with increased load, though the slightly better approximations were obtained for polynomial functions (R2 = 0.999). It was confirmed that the value of dissipated energy was independent of cycle number and ranged from approximately 2 to 14 Nm in relation to the load applied. Interestingly, the same range of values was observed for the first loading cycle (Figure 2b). Practically no effect of moisture on the values of elastic energy was confirmed. These results agree with those of the previous study examining the effect of moisture [32]. This proves that for the range of the applied loads, the elastic energy dissipated by the compressed capsule was not dependent on the moisture content of the digestate. Due to the lack of similar studies in the literature, it is currently not possible to directly compare the results with the work of other authors.
The nonrecoverable energy increased with the level of loading. Furthermore, the energy decreased during successive loading cycles. In this case, an effect of moisture was also observed. Higher levels of loading caused an almost linear increase in nonrecoverable energy, but this increase occurred at a significantly lower rate for the moist digestate (22%) compared to the dry digestate (10%). This is illustrated by the regressions presented in Figure 8c. This confirms that the applied pressure exerts a significant effect on nonrecoverable compaction energy, but in interaction with moisture.
The average share of elastic energy in relation to the loading level is shown in Figure 9. This value increased asymptotically with an increase in the loading force. The high determination coefficients of the obtained polynomial relationships lead, on the one hand, to the conclusion that the share of elastic deformation increases with the increase in the load. On the other hand, it is justifiable to state that this increase was significantly higher for more moist digestate. As observed in the previous work [32], the digestate with 22% moisture content did not exhibit a more elastic behavior when the load was low (8 and 11 kN). This result is expected because the higher the pressure, the more compacted the pellet, and the greater the elastic response. However, this increase in the elastic response may not always occur.
The cycle number and moisture level both had an interactive influence on the load’s impact on deformations in cycles 2–10. The analyses of the influence of the applied loads on the evolution of deformations during successive loading are presented in Figure 10, Figure 11, Figure 12 and Figure 13.
An increase in the total deformations with the applied load was observed for all subsequent cycles (Figure 10). However, from the fifth cycle onward, the values of the deformations did not differ significantly regardless of the load magnitude. At the same time, the effect of moisture was found to be more pronounced in the first loading cycles. Similar observations were also noted for recoverable deformations (Figure 11). Linear regression equations were used with high accuracy to describe the influence of the applied load on both total and elastic deformations (R2 > 0.990).
The applied load only had a very slight effect on nonrecoverable deformations (Figure 12). The values of these deformations were very low, though they clearly decreased in the first five loading cycles. For subsequent cycles, the differences between the averages were not significant. However, the observed differences were found to be higher for smaller load values.
Finally, an increase in the share of reversible deformation was caused by the increase in the load applied (Figure 13). The percentage of this deformation was higher for the 10% moisture content; however, it was dependent on the load value and cycle number. Larger differences were observed for smaller loads and during the first cycles of the experiment. The dependencies were described by polynomial equations with high determination coefficients (R2 > 0.937).
Comparing the effect of the load level on the energy and deformation values, a greater variation in energy values (except for reversible energy), resulting from the difference in the moisture content of the digestate, was found for higher loads. On the other hand, for deformation, greater differences were observed for lower loads, but only in the case of nonrecoverable deformation (ln-r2-10) and its percentage.
The observed relationships prompted the analysis of the course of cyclic loading characteristics in more detail [32]. In the previous study, the area enclosed between the loading and unloading curves assumed different shapes [32]. In-depth analyses performed in the present study at different load levels confirmed these observations. Figure 14 presents the effect of the loading level on loading/unloading characteristics.
The figure shows the data for cycles 5 and 6, for which the courses practically coincided. Hence, the load applied in the previous study [32] was not responsible for the observed differences in the course. In addition, the effect of load on the area bound by loading and unloading curves and the shape of this area were different. It can be seen that for the dry digestate, this field clearly increases with increasing load compared to the digestate with a 22% moisture content. The average area bound by the loading and unloading curves over cycles 2–10 is represented by En-r2–10 and is shown in Figure 8b.
Several researchers are analyzing the springback effect, as it is a major factor in the process of compaction of materials [65,66,67,68,69]. Springback, or elastic recovery, may be defined as the ability of a densified material to recover after the applied load has been released [67]. It is also expressed quantitatively as the percentage elongation of the material in relation to the original dimension resulting from compaction [68] on a wide timescale. It should be noted that at all tested loads, for both moisture contents, the value of elastic deformation ranged from 93.5% to 96.5% (Figure 13b). Thus, a deeper analysis of the curves shown in Figure 14 can provide more intriguing information when springback (on a certain timescale) does not show significant differences. The springback effect in the matrix is another interesting topic for future analysis.

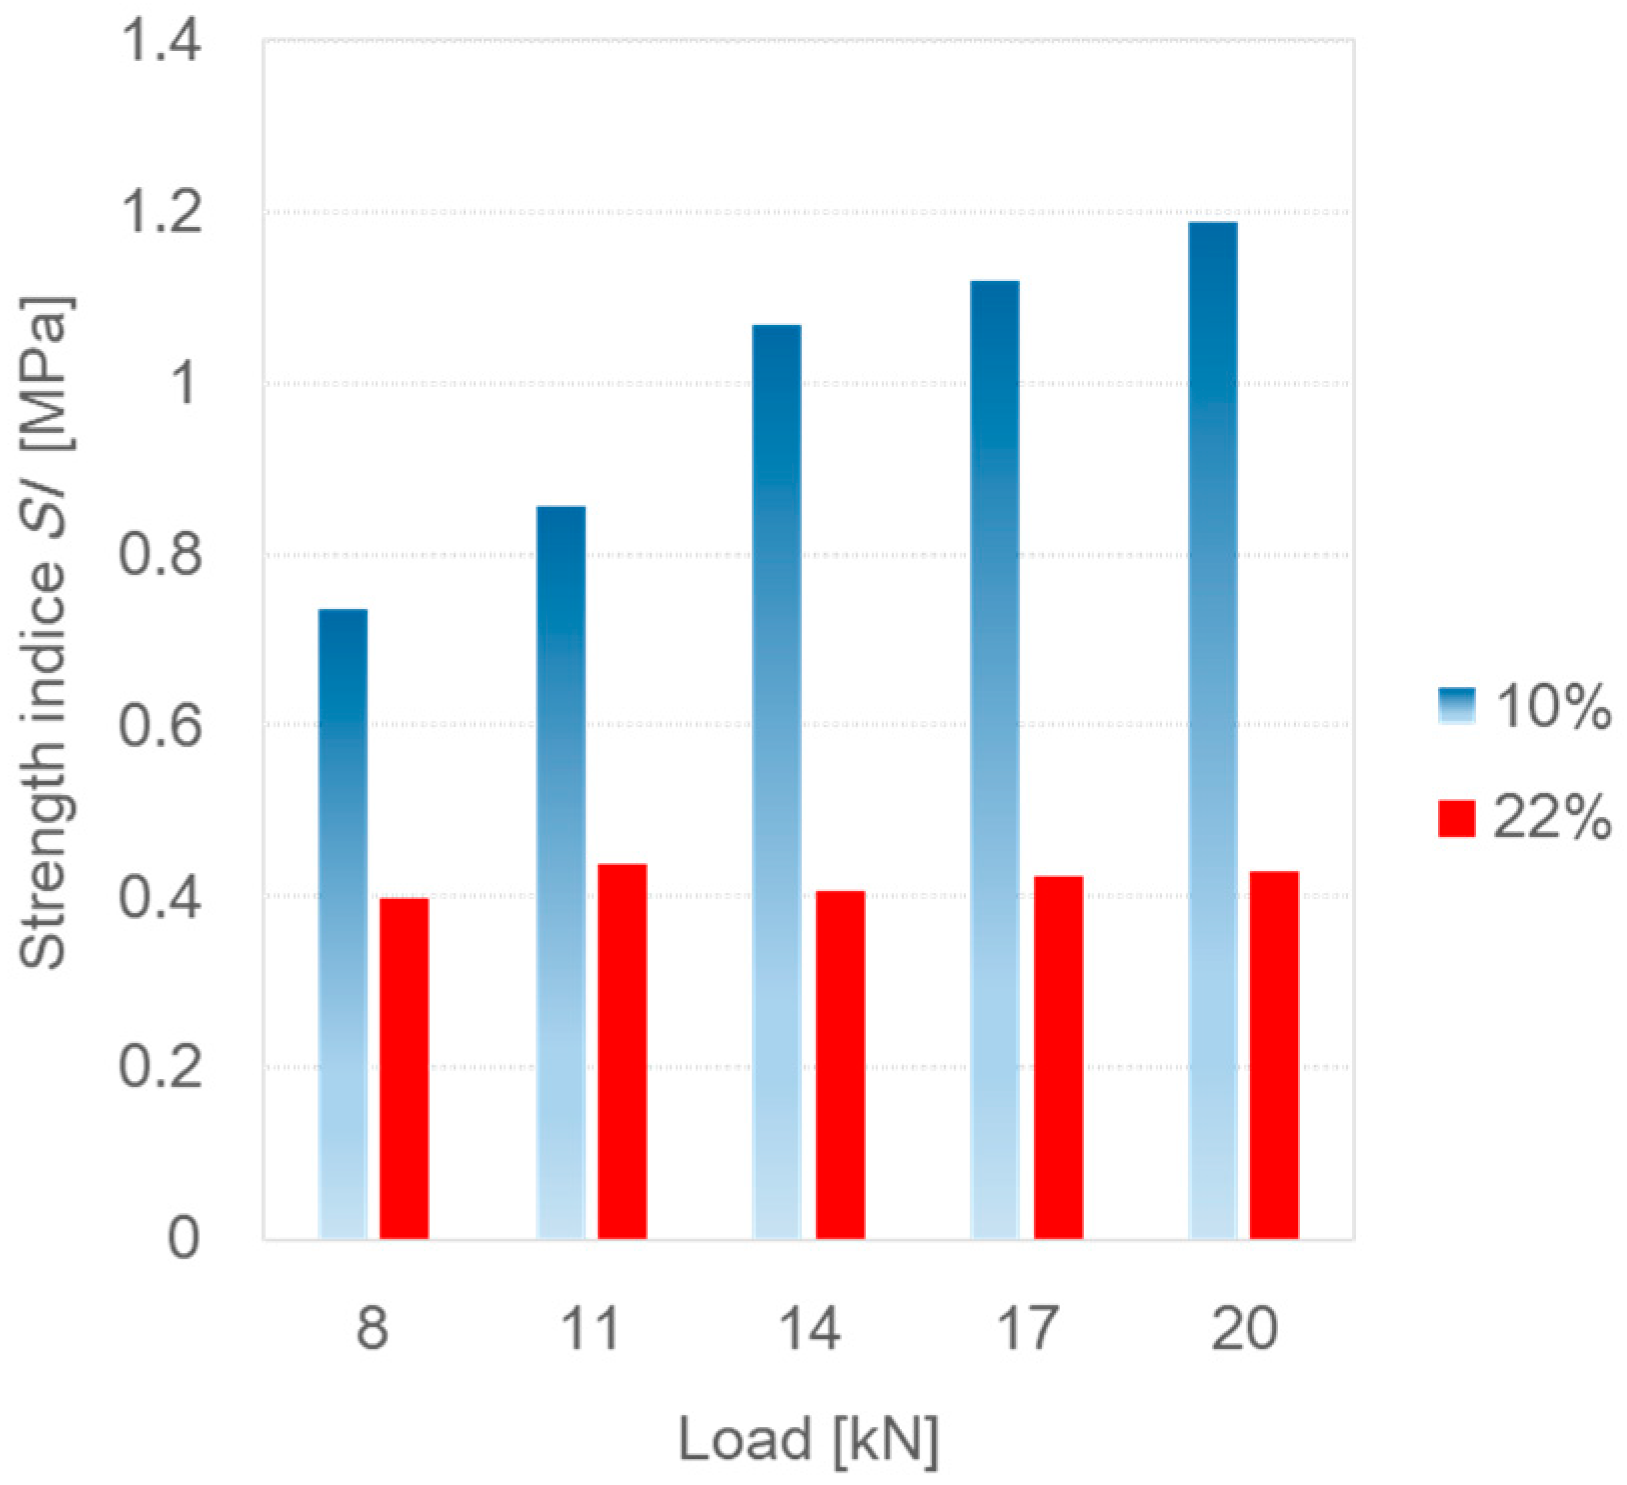
3.3. Effect of Load on Pellet Strength

One possible relationship between hysteresis loops presented in Figure 14 may be associated with pellet strength. Figure 15 depicts the course of the force related to the agglomerate length unit as a function of the load level. The mechanical strength of the obtained agglomerate was found to significantly depend on the load level for the digestate with 10% moisture. However, this relationship was not observed for the digestate with 22% moisture. Similar results were reported by Mani et al. [56] and Styks et al. [58] and were justified by the lubricating effect of water, which reduces binding effects even at high pressures.
For the digestate with 22% moisture, the application of higher loads had no positive impact on capsule strength. As demonstrated by the previous study [32], the energy of permanent deformation appears to have a significant influence on the strength characteristics of the granules. This energy in relation to applied loads, as presented in Figure 8, was relatively stable for 22% moisture, and clearly increased for 10% moisture. This observation can be supported by the curves presented in Figure 14. It can be clearly seen that the enclosed area increased for loads higher than 8 kN for 10% moisture. However, this is not the case for 22% moisture, for which the enclosed area for forces higher than 8 kN was not larger.

4. Conclusions

The use of the newly proposed cyclic loading method for studying the compaction process allowed the determination of energy and deformation evolutions during axial confined compression.
The increase in the loading level caused an increase in all of the analyzed energy inputs, both for the first loading cycle and subsequent ones (cycles 2–10). This effect was dependent on moisture with one exception—the recoverable energy part. Thus, the results of the study, carried out using a wide range of applied loads, confirm that the dissipated elastic energy was independent of the moisture and remained relatively constant through all loading cycles.
In turn, the effect of the load level on the nonrecoverable energy amount was strongly dependent on the moisture level of the digestate. This energy increased considerably for dry digestate and only very slightly at a moisture level of 22%. This was also characteristic for both the first cycle as well for the successive loading.
The influence of load on the evolution of deformations was strongly dependent on the cycle number. For the first cycle, no clear relationship of load for either total or nonrecoverable deformations was confirmed. With an increase in the load, the elastic deformation increased and subsequently the permanent one decreased. The share of elastic and permanent deformation was dependent on the loading level.
An immediate (pure) elastic response occurred for the digestate with a 22% moisture content at the loading level of approximately 8 kN. A further increase in the load did not cause any noteworthy increase in the area enclosed between the curves (nonrecoverable energy). Such a response has not been observed for dry digestate. In addition, the increase in the applied load caused an increase in the pellet strength, but only for the moisture content of 10%. The results of pellet strength reflect well the effect of the loading level on the nonreversible energy and the conclusions regarding the area enclosed between loading and unloading curves. Therefore, further in-depth analyses of the hysteresis loop in correlation with elastic recovery represent a promising avenue for future investigation.

Author Contributions

Conceptualization, G.Ł.; Methodology, R.K.; Software, G.Ł.; Validation, G.Ł.; Formal analysis, G.Ł. and R.K.; Resources, R.K. and A.K.-J.; Writing—original draft, G.Ł.; Writing—review & editing, G.Ł.; Visualization, G.Ł.; Supervision, G.Ł. and A.K.-J.; Project administration, R.K. and A.K.-J. All authors have read and agreed to the published version of the manuscript.

Funding

This publication was co-financed by the state budget under the program of the Ministry of Education and Science (Republic of Poland) in the name Excellent Science—Support for Scientific Conferences entitled “XXIII Polish Nationwide Scientific Conference ‘PROGRESS IN PRODUCTION ENGINEERING’ 2023” (project number DNK/SP/546290/2022). The amount of funding was PLN 162650,00 PLN, and the total value of the project was PLN 238 650,00 PLN (Poland).

Institutional Review Board Statement

Not applicable.

Informed Consent Statement

Not applicable.

Data Availability Statement

Not applicable.

Conflicts of Interest

The authors declare no conflict of interest.

Nomenclature

Ettotal compressive energy
Errecoverable (elastic) energy
En-rnonrecoverable (permanent) energy
lttotal capture displacement (deformation)
lrrecoverable (elastic) deformation
ln–rnonrecoverable (permanent) deformation
%Er, %En–rrelative shares of recoverable and nonrecoverable energy
%lr, %ln–rrelative shares of recoverable and nonrecoverable deformation
SIstrength index of a pellet
Indexes
1first loading/unloading cycle (compaction)
2-10cycles from 2 to 10

References

  1. Uddin, M.N.; Siddiki, S.Y.A.; Mofijur, M.; Djavanroodi, F.; Hazrat, M.A.; Show, P.L.; Ahmed, S.F.; Chu, Y.-M. Prospects of Bioenergy Production From Organic Waste Using Anaerobic Digestion Technology: A Mini Review. Front. Energy Res. 2021, 9, 627093. [Google Scholar] [CrossRef]
  2. Lamolinara, B.; Pérez-Martínez, A.; Guardado-Yordi, E.; Guillén Fiallos, C.; Diéguez-Santana, K.; Ruiz-Mercado, G.J. Anaerobic Digestate Management, Environmental Impacts, and Techno-Economic Challenges. Waste Manag. 2022, 140, 14–30. [Google Scholar] [CrossRef]
  3. Kunatsa, T.; Xia, X. A Review on Anaerobic Digestion with Focus on the Role of Biomass Co-Digestion, Modelling and Optimisation on Biogas Production and Enhancement. Bioresour. Technol. 2022, 344, 126311. [Google Scholar] [CrossRef] [PubMed]
  4. Czekała, W. Digestate as a Source of Nutrients: Nitrogen and Its Fractions. Water 2022, 14, 4067. [Google Scholar] [CrossRef]
  5. Slepetiene, A.; Ceseviciene, J.; Amaleviciute-Volunge, K.; Mankeviciene, A.; Parasotas, I.; Skersiene, A.; Jurgutis, L.; Volungevicius, J.; Veteikis, D.; Mockeviciene, I. Solid and Liquid Phases of Anaerobic Digestate for Sustainable Use of Agricultural Soil. Sustainability 2023, 15, 1345. [Google Scholar] [CrossRef]
  6. Đurđević, D.; Blecich, P.; Lenić, K. Energy Potential of Digestate Produced by Anaerobic Digestion in Biogas Power Plants: The Case Study of Croatia. Environ. Eng. Sci. 2018, 35, 1286–1293. [Google Scholar] [CrossRef]
  7. Czekała, W.; Bartnikowska, S.; Dach, J.; Janczak, D.; Smurzyńska, A.; Kozłowski, K.; Bugała, A.; Lewicki, A.; Cieślik, M.; Typańska, D.; et al. The Energy Value and Economic Efficiency of Solid Biofuels Produced from Digestate and Sawdust. Energy 2018, 159, 1118–1122. [Google Scholar] [CrossRef]
  8. Cathcart, A.; Smyth, B.M.; Lyons, G.; Murray, S.T.; Rooney, D.; Johnston, C.R. An Economic Analysis of Anaerobic Digestate Fuel Pellet Production: Can Digestate Fuel Pellets Add Value to Existing Operations? Clean. Eng. Technol. 2021, 3, 100098. [Google Scholar] [CrossRef]
  9. Golovko, O.; Ahrens, L.; Schelin, J.; Sörengård, M.; Bergstrand, K.J.; Asp, H.; Hultberg, M.; Wiberg, K. Organic Micropollutants, Heavy Metals and Pathogens in Anaerobic Digestate Based on Food Waste. J. Environ. Manag. 2022, 313, 114997. [Google Scholar] [CrossRef] [PubMed]
  10. Wang, W.; Chang, J.S.; Lee, D.J. Anaerobic Digestate Valorization beyond Agricultural Application: Current Status and Prospects. Bioresour. Technol. 2023, 373, 128742. [Google Scholar] [CrossRef]
  11. Zeng, Q.; Zhen, S.; Liu, J.; Ni, Z.; Chen, J.; Liu, Z.; Qi, C. Impact of Solid Digestate Processing on Carbon Emission of an Industrial-Scale Food Waste Co-Digestion Plant. Bioresour. Technol. 2022, 360, 127639. [Google Scholar] [CrossRef] [PubMed]
  12. Petrova, I.P.; Ruser, R.; Guzman-Bustamante, I. Pellets from Biogas Digestates: A Substantial Source of N2O Emissions. Waste Biomass Valorization 2021, 12, 2433–2444. [Google Scholar] [CrossRef]
  13. Samoraj, M.; Mironiuk, M.; Izydorczyk, G.; Witek-Krowiak, A.; Szopa, D.; Moustakas, K.; Chojnacka, K. The Challenges and Perspectives for Anaerobic Digestion of Animal Waste and Fertilizer Application of the Digestate. Chemosphere 2022, 295, 133799. [Google Scholar] [CrossRef] [PubMed]
  14. Czekała, W.; Nowak, M.; Piechota, G. Sustainable Management and Recycling of Anaerobic Digestate Solid Fraction by Composting: A Review. Bioresour. Technol. 2023, 375, 128813. [Google Scholar] [CrossRef]
  15. Valentinuzzi, F.; Cavani, L.; Porfido, C.; Terzano, R.; Pii, Y.; Cesco, S.; Marzadori, C.; Mimmo, T. The Fertilising Potential of Manure-Based Biogas Fermentation Residues: Pelleted vs. Liquid Digestate. Heliyon 2020, 6, e03325. [Google Scholar] [CrossRef]
  16. Rizzioli, F.; Bertasini, D.; Bolzonella, D.; Frison, N.; Battista, F. A Critical Review on the Techno-Economic Feasibility of Nutrients Recovery from Anaerobic Digestate in the Agricultural Sector. Sep. Purif. Technol. 2023, 306, 122690. [Google Scholar] [CrossRef]
  17. Cathcart, A.; Smyth, B.M.; Forbes, C.; Lyons, G.; Murray, S.T.; Rooney, D.; Johnston, C.R. Effect of Anaerobic Digestate Fuel Pellet Production on Enterobacteriaceae and Salmonella Persistence. GCB Bioenergy 2022, 14, 1055–1064. [Google Scholar] [CrossRef]
  18. Sarker, T.R.; Nanda, S.; Meda, V.; Dalai, A.K. Densification of Waste Biomass for Manufacturing Solid Biofuel Pellets: A Review. Environ. Chem. Lett. 2022, 21, 231–264. [Google Scholar] [CrossRef]
  19. Mohammadi, A. Overview of the Benefits and Challenges Associated with Pelletizing Biochar. Processes 2021, 9, 1591. [Google Scholar] [CrossRef]
  20. Ibitoye, S.E.; Jen, T.C.; Mahamood, R.M.; Akinlabi, E.T. Densification of Agro-Residues for Sustainable Energy Generation: An Overview. Bioresour. Bioprocess. 2021, 8, 75. [Google Scholar] [CrossRef]
  21. Mostafa, M.E.; Hu, S.; Wang, Y.; Su, S.; Hu, X.; Elsayed, S.A.; Xiang, J. The Significance of Pelletization Operating Conditions: An Analysis of Physical and Mechanical Characteristics as Well as Energy Consumption of Biomass Pellets. Renew. Sustain. Energy Rev. 2019, 105, 332–348. [Google Scholar] [CrossRef]
  22. Bajwa, D.S.; Peterson, T.; Sharma, N.; Shojaeiarani, J.; Bajwa, S.G. A Review of Densified Solid Biomass for Energy Production. Renew. Sustain. Energy Rev. 2018, 96, 296–305. [Google Scholar] [CrossRef]
  23. Guo, L.; Wang, D.; Tabil, L.G.; Wang, G. Compression and Relaxation Properties of Selected Biomass for Briquetting. Biosyst. Eng. 2016, 148, 101–110. [Google Scholar] [CrossRef]
  24. Demirel, C.; Gürdil, G.A.K.; Kabutey, A.; Herak, D. Effects of Forces, Particle Sizes, and Moisture Contents on Mechanical Behaviour of Densified Briquettes from Ground Sunflower Stalks and Hazelnut Husks. Energies 2020, 13, 2542. [Google Scholar] [CrossRef]
  25. Harun, N.Y.; Afzal, M.T. Effect of Particle Size on Mechanical Properties of Pellets Made from Biomass Blends. Procedia Eng. 2016, 148, 93–99. [Google Scholar] [CrossRef] [Green Version]
  26. Kaliyan, N.; Morey, R.V. Constitutive Model for Densification of Corn Stover and Switchgrass. Biosyst. Eng. 2009, 104, 47–63. [Google Scholar] [CrossRef]
  27. Tumuluru, J.S.; Wright, C.T.; Hess, J.R.; Kenney, K.L. A Review of Biomass Densifi Cation Systems to Develop Uniform Feedstock Commodities for Bioenergy Application. Biofuels Bioprod. Bioref. 2011, 6, 683–707. [Google Scholar] [CrossRef]
  28. Anukam, A.; Berghel, J.; Henrikson, G.; Frodeson, S.; Ståhl, M. A Review of the Mechanism of Bonding in Densified Biomass Pellets. Renew. Sustain. Energy Rev. 2021, 148, 111249. [Google Scholar] [CrossRef]
  29. Frodeson, S.; Henriksson, G.; Berghel, J. Effects of Moisture Content during Densification of Biomass Pellets, Focusing on Polysaccharide Substances. Biomass Bioenergy 2019, 122, 322–330. [Google Scholar] [CrossRef]
  30. Ungureanu, N.; Vladut, V.; Voicu, G.; Dinca, M.N.; Zabava, B.S. Influence of Biomass Moisture Content on Pellet Properties—Review. In Proceedings of the Engineering for Rural Development, Jelgava, Latvia, 23–25 May 2018; Latvia University of Agriculture: Jelgava, Latvia, 2018; Volume 17, pp. 1876–1883. [Google Scholar]
  31. Rhén, C.; Gref, R.; Sjöström, M.; Wästerlund, I. Effects of Raw Material Moisture Content, Densification Pressure and Temperature on Some Properties of Norway Spruce Pellets. Fuel Process. Technol. 2005, 87, 11–16. [Google Scholar] [CrossRef]
  32. Łysiak, G.; Kulig, R.; Aridhee, J.K. Toward New Value-Added Products Made from Anaerobic Digestate: Part 1—Study on the Effect of Moisture Content on the Densification of Solid Digestate. Sustainability 2023, 15, 4548. [Google Scholar] [CrossRef]
  33. Chen, C.; Yang, R.; Wang, X.; Qu, B.; Zhang, M.; Ji, G.; Li, A. Effect of In-Situ Torrefaction and Densification on the Properties of Pellets from Rice Husk and Rice Straw. Chemosphere 2022, 289, 133009. [Google Scholar] [CrossRef]
  34. Sharma, H.B.; Sarmah, A.K.; Dubey, B. Hydrothermal Carbonization of Renewable Waste Biomass for Solid Biofuel Production: A Discussion on Process Mechanism, the Influence of Process Parameters, Environmental Performance and Fuel Properties of Hydrochar. Renew. Sustain. Energy Rev. 2020, 123, 109761. [Google Scholar] [CrossRef]
  35. Li, W.; Wang, M.; Meng, F.; Zhang, Y.; Zhang, B. A Review on the Effects of Pretreatment and Process Parameters on Properties of Pellets. Energies 2022, 15, 7303. [Google Scholar] [CrossRef]
  36. Afra, E.; Abyaz, A.; Saraeyan, A. The Production of Bagasse Biofuel Briquettes and the Evaluation of Natural Binders (LNFC, NFC, and Lignin) Effects on Their Technical Parameters. J. Clean. Prod. 2021, 278, 123543. [Google Scholar] [CrossRef]
  37. Tumuluru, J.S.; Conner, C.C.; Hoover, A.N. Method to Produce Durable Pellets at Lower Energy Consumption Using High Moisture Corn Stover and a Corn Starch Binder in a Flat Die Pellet Mill. J. Vis. Exp. 2016, 2016, e54092. [Google Scholar] [CrossRef] [Green Version]
  38. Ahmed, I.; Ali, A.; Ali, B.; Hassan, M.; Hussain, S.; Hashmi, H.; Ali, Z.; Soomro, A.; Mukwana, K. Production of Pellets from Furfural Residue and Sawdust Biomass: Effect of Moisture Content, Particle Size and a Binder on Pellet Quality and Energy Consumption. Bioenergy Res. 2022, 15, 1292–1303. [Google Scholar] [CrossRef]
  39. Cavallo, E.; Pampuro, N. Effects of Compressing Pressure on Briquettes Made from Woody Biomass. Chem. Eng. Trans. 2017, 58, 517–522. [Google Scholar] [CrossRef]
  40. Granado, M.P.P.; Suhogusoff, Y.V.M.; Santos, L.R.O.; Yamaji, F.M.; de Conti, A.C. Effects of Pressure Densification on Strength and Properties of Cassava Waste Briquettes. Renew. Energy 2021, 167, 306–312. [Google Scholar] [CrossRef]
  41. Orisaleye, J.I.; Jekayinfa, S.O.; Dittrich, C.; Obi, O.F.; Pecenka, R. Effects of Feeding Speed and Temperature on Properties of Briquettes from Poplar Wood Using a Hydraulic Briquetting Press. Resources 2023, 12, 12. [Google Scholar] [CrossRef]
  42. Obidziński, S.; Piekut, J. Influence of Speed of Densification Piston and Particle Size of Densified Material on the Value of Densifying Pressures and Pellets Density. J. Res. App. Agricul. Eng. 2015, 60, 63–68. Available online: http://yadda.icm.edu.pl/baztech/element/bwmeta1.element.baztech-d891bafd-387e-4b4e-b6c6-a55cff7dd44d (accessed on 12 March 2023).
  43. Kaliyan, N.; Morey, R.V. Densification Characteristics of Corn Cobs. Fuel Process. Technol. 2010, 91, 559–565. [Google Scholar] [CrossRef]
  44. Li, Y.; Liu, H. High-Pressure Densification of Wood Residues to Form an Upgraded Fuel. Biomass Bioenergy 2000, 19, 177–186. [Google Scholar] [CrossRef]
  45. Orisaleye, J.I.; Jekayinfa, S.O.; Braimoh, O.M.; Edhere, V.O. Empirical Models for Physical Properties of Abura (Mitragyna Ciliata) Sawdust Briquettes Using Response Surface Methodology. Clean. Eng. Technol. 2022, 7, 100447. [Google Scholar] [CrossRef]
  46. Tumuluru, J.S. Effect of Pellet Die Diameter on Density and Durability of Pellets Made from High Moisture Woody and Herbaceous Biomass. Carbon Resour. Convers. 2018, 1, 44–54. [Google Scholar] [CrossRef]
  47. Mani, S.; Tabil, L.G.; Sokhansanj, S. Evaluation of Compaction Equations Applied to Four Biomass Species. Can. Biosyst. Eng. 2004, 46, 55. [Google Scholar]
  48. Gilbert, P.; Ryu, C.; Sharifi, V.; Swithenbank, J. Effect of Process Parameters on Pelletisation of Herbaceous Crops. Fuel 2009, 88, 1491–1497. [Google Scholar] [CrossRef]
  49. Kaliyan, N.; Morey, R.V. Natural Binders and Solid Bridge Type Binding Mechanisms in Briquettes and Pellets Made from Corn Stover and Switchgrass. Bioresour. Technol. 2010, 101, 1082–1090. [Google Scholar] [CrossRef]
  50. Li, W.; Guo, W.; Bu, W.; Jiang, Y.; Wang, Y.; Yang, W.; Yin, X. A Non-Liner Constitutive Model of Three Typical Biomass Material Pelletization for Capturing Particle Mechanical Behaviors during the Elasto-Visco-Plastic Deformation Stage. Renew. Energy 2020, 149, 1370–1385. [Google Scholar] [CrossRef]
  51. Okot, D.K.; Bilsborrow, P.E.; Phan, A.N. Effects of Operating Parameters on Maize COB Briquette Quality. Biomass Bioenergy 2018, 112, 61–72. [Google Scholar] [CrossRef] [Green Version]
  52. Stasiak, M.; Molenda, M.; Bańda, M.; Wiącek, J.; Parafiniuk, P.; Gondek, E. Mechanical and Combustion Properties of Sawdust-Straw Pellets Blended in Different Proportions. Fuel Process. Technol. 2017, 156, 366–375. [Google Scholar] [CrossRef]
  53. Poddar, S.; Kamruzzaman, M.; Sujan, S.M.A.; Hossain, M.; Jamal, M.S.; Gafur, M.A.; Khanam, M. Effect of Compression Pressure on Lignocellulosic Biomass Pellet to Improve Fuel Properties: Higher Heating Value. Fuel 2014, 131, 43–48. [Google Scholar] [CrossRef]
  54. Adapa, P.K.; Tabil, L.G.; Schoenau, G.J. Compression Characteristics of Non-Treated and Steam-Exploded Barley, Canola, Oat, and Wheat Straw Grinds. Appl. Eng. Agric. 2010, 26, 617–632. [Google Scholar] [CrossRef]
  55. Jiang, L.; Liang, J.; Yuan, X.; Li, H.; Li, C.; Xiao, Z.; Huang, H.; Wang, H.; Zeng, G. Co-Pelletization of Sewage Sludge and Biomass: The Density and Hardness of Pellet. Bioresour. Technol. 2014, 166, 435–443. [Google Scholar] [CrossRef]
  56. Mani, S.; Tabil, L.G.; Sokhansanj, S. Specific Energy Requirement for Compacting Corn Stover. Bioresour. Technol. 2006, 97, 1420–1426. [Google Scholar] [CrossRef] [PubMed]
  57. Carone, M.T.; Pantaleo, A.; Pellerano, A. Influence of Process Parameters and Biomass Characteristics on the Durability of Pellets from the Pruning Residues of Olea Europaea L. Biomass Bioenergy 2011, 35, 402–410. [Google Scholar] [CrossRef]
  58. Styks, J.; Wróbel, M.; Frączek, J.; Knapczyk, A. Effect of Compaction Pressure and Moisture Content on Quality Parameters of Perennial Biomass Pellets. Energies 2020, 13, 1859. [Google Scholar] [CrossRef] [Green Version]
  59. Orisaleye, J.I.; Jekayinfa, S.O.; Adebayo, A.O.; Ahmed, N.A.; Pecenka, R. Effect of Densification Variables on Density of Corn Cob Briquettes Produced Using a Uniaxial Compaction Biomass Briquetting Press. Energy Sources Part A Recovery Util. Environ. Eff. 2018, 40, 3019–3028. [Google Scholar] [CrossRef]
  60. Li, H.; Jiang, L.B.; Li, C.Z.; Liang, J.; Yuan, X.Z.; Xiao, Z.H.; Xiao, Z.H.; Wang, H. Co-Pelletization of Sewage Sludge and Biomass: The Energy Input and Properties of Pellets. Fuel Process. Technol. 2015, 132, 55–61. [Google Scholar] [CrossRef]
  61. Kulig, R.; Łysiak, G.; Skonecki, S. Prediction of Pelleting Outcomes Based on Moisture versus Strain Hysteresis during the Loading of Individual Pea Seeds. Biosyst. Eng. 2015, 129, 226–236. [Google Scholar] [CrossRef]
  62. Łysiak, G. Fracture Toughness of Pea: Weibull Analysis. J. Food Eng. 2007, 83, 436–443. [Google Scholar] [CrossRef]
  63. Lisowski, A.; Pajor, M.; Świętochowski, A.; Dąbrowska, M.; Klonowski, J.; Mieszkalski, L.; Ekielski, A.; Stasiak, M.; Piątek, M. Effects of Moisture Content, Temperature, and Die Thickness on the Compaction Process, and the Density and Strength of Walnut Shell Pellets. Renew. Energy 2019, 141, 770–781. [Google Scholar] [CrossRef]
  64. Laskowski, J.; Łysiak, G.; Skonecki, S. Mechanical Properties of Granular Agro-materials and Food Powders for Industrial Practice Part II Material Properties for Grinding and Agglomeration; Institute of Agrophysics PAS: Lublin, Poland, 2005; pp. 1–160. Available online: https://www.ipan.lublin.pl/wp-content/uploads/2017/03/mat_coe25.pdf (accessed on 12 March 2023).
  65. Styks, J.; Knapczyk, A.; Łapczyńska-Kordon, B. Effect of Compaction Pressure and Moisture Content on Post-Agglomeration Elastic Springback of Pellets. Materials 2021, 14, 879. [Google Scholar] [CrossRef] [PubMed]
  66. Ilic, D.; Williams, K.C.; Ellis, D. Assessment of Biomass Bulk Elastic Response to Consolidation. Chem. Eng. Res. Des. 2018, 135, 185–196. [Google Scholar] [CrossRef]
  67. Karamchandani, A.; Yi, H.; Puri, V.M. Fundamental Mechanical Properties of Ground Switchgrass for Quality Assessment of Pellets. Powder Technol. 2015, 283, 48–56. [Google Scholar] [CrossRef]
  68. Salim, N.; Hashim, R.; Sulaiman, O.; Ibrahim, M.; Sato, M.; Hiziroglu, S. Optimum Manufacturing Parameters for Compressed Lumber from Oil Palm (Elaeis Guineensis) Trunks: Respond Surface Approach. Compos. Part B Eng. 2012, 43, 988–996. [Google Scholar] [CrossRef]
  69. Frodeson, S.; Lindén, P.; Henriksson, G.; Berghel, J. Compression of Biomass Substances—A Study on Springback Effects and Color Formation in Pellet Manufacture. Appl. Sci. 2019, 9, 4302. [Google Scholar] [CrossRef] [Green Version]
Figure 1. Scheme of the experiment.
Sustainability 15 07396 g001
Figure 2. Effect of digestate moisture on energy distribution during the first loading/unloading cycle: (a) total compression energy, (b) recoverable energy, (c) nonrecoverable energy, and (d) share of recoverable energy (R2—determination coefficient, p—significance level).
Sustainability 15 07396 g002
Figure 3. Distribution of deformations in relation to the loading level: (a) total deformation, (b) recoverable deformation, (c) nonrecoverable deformation, and (d) share of recoverable deformation (R2—determination coefficient, p—significance level).
Sustainability 15 07396 g003
Figure 4. Experimental loading/unloading curves for samples with 10% and 22% moisture content (MC) compressed at 8 kN load.
Sustainability 15 07396 g004
Figure 5. Experimental loading/unloading curves for samples with 10% and 22% moisture content (MC) compressed at 8 kN load.
Sustainability 15 07396 g005
Figure 6. Effect of loading level on total energy inputs for cycles 2–10 (a); (b) effect of load and moisture content (R2—determination coefficient, p—significance level).
Sustainability 15 07396 g006
Figure 7. Effect of loading level on recoverable energy inputs for cycles 2–10 (a); (b) effect of load and moisture content (R2—determination coefficient, p—significance level).
Sustainability 15 07396 g007
Figure 8. Effect of loading level on nonrecoverable energy inputs for cycles 2–10 (a); (b) effect of load and moisture content (R2—determination coefficient, p—significance level).
Sustainability 15 07396 g008
Figure 9. Effect of loading level on the share of recoverable energy inputs for cycles 2–10 (a); (b) effect of load and moisture content (R2—determination coefficient, p—significance level).
Sustainability 15 07396 g009
Figure 10. Effect of loading level on total deformation for cycles 2–10 (a); (b) effect of load and moisture content (R2—determination coefficient, p—significance level).
Sustainability 15 07396 g010
Figure 11. Effect of loading level on recoverable deformations for cycles 2–10 (a); (b) effect of load and moisture content (R2—determination coefficient, p—significance level).
Sustainability 15 07396 g011
Figure 12. Effect of loading level on nonrecoverable deformations for cycles 2–10 (a); (b) effect of load and moisture content (R2—determination coefficient, p—significance level, NS—not significant at α = 0.05).
Sustainability 15 07396 g012
Figure 13. Effect of loading level on the share of recoverable deformations for cycles 2–10 (a); (b) effect of load and moisture content (R2—determination coefficient, p—significance level, NS—not significant at α = 0.05).
Sustainability 15 07396 g013
Figure 14. Effect of moisture and load level on the enclosed area between loading and unloading curves (cycles 5 and 6 overlap; the applied loads are marked with different colors).
Sustainability 15 07396 g014
Figure 15. Effect of loading level on the strength of agglomerates.
Sustainability 15 07396 g015
Disclaimer/Publisher’s Note: The statements, opinions and data contained in all publications are solely those of the individual author(s) and contributor(s) and not of MDPI and/or the editor(s). MDPI and/or the editor(s) disclaim responsibility for any injury to people or property resulting from any ideas, methods, instructions or products referred to in the content.

