1. Introduction
1.1. Motivation and Incitement
According to the Paris Agreement, 196 countries have committed to keep the global average temperature rise below 2 °C based on preindustrial levels, in order to fight climate change [
1,
2]. Solar and geothermal energy are considered to be key renewable technologies to accomplish the mitigation task [
3]. Among the prominent alternatives, solar thermal panels and geothermal heat pumps have theoretically high potential, since they can be easily installed and connected to both single buildings and district networks, for heating and cooling purposes [
4]. However, some barriers still exist, which need to be tackled to effectively boost their diffusion [
5]. Regarding solar thermal energy, apart from radiation differences due to latitude, the main challenge resides in the necessity of short- and long-term energy storage able to match the solar energy provision with the effective demand [
6]. This role can be played by the devices known as “borehole heat exchangers” (BHE), which are usually installed in the ground to exploit shallow geothermal energy for further heat exchange with a heat pump [
7]. The use of BHEs for long-term thermal energy storage (from solar, waste heat, and other sources) is called BTES (borehole thermal energy storage). The depth of BHEs can vary from a few meters to even 200 m and beyond, depending on the energy needs, the available space, and the ground conditions [
8]. In fact, shallow geothermal exploitation is strongly affected by the thermal and hydraulic properties of the ground layers and by the presence of aquifers [
9]. For both uses of heat extraction alone and BTES, the BHE system becomes hardly economically sustainable in subsoils lacking groundwater, which is the main heat medium [
10]. On the other hand, the type and characteristics of the aquifer strongly influence the BHE for extraction alone and for energy storage, in different manners: For energy-extraction-only solutions, the more groundwater flow, the more thermal recharge of the medium takes place, favoring the function of the BHE [
11]. For energy storage solutions, a major balance should be found, since excessively strong groundwater flows can transport away the stored heat, compromising the work of the whole system [
12].
1.2. Literature Review
Thermal energy storage can be divided into three macro-categories: sensible heat, latent heat, and thermochemical energy storage. Sensible heat storage relates to simple water tanks, but also to seasonal thermal energy storage (STES), including underground thermal energy storage (UTES). Latent heat storage is associated with phase transition and commonly uses phase-change materials (PCMs): the transition phase is exploited by injecting heat without changing the material temperature. Finally, thermochemical energy storage (TCES) exploits reversible chemical reactions or sorption systems to achieve heat storage capacity. BTES systems belong to the category of sensible heat storage; thus, they are theoretically one of the simplest ways of storing thermal energy for long periods of time. Despite this, many issues arise, related to the suitable conditions for drilling, the incertitude of the variable physical properties of the ground, and the need for aquifer protection; this makes them less widespread, and they remain the object of deep research. Due to the intermittent nature of solar energy, researchers and scientists are working to develop thermal energy storage (TES) systems for the effective utilization of solar energy [
13]. Photovoltaic thermal collectors (PVTs) can be an interesting solution for coupling the conversion of solar energy into both heat and electricity. Photovoltaic systems have the disadvantage of experiencing a consistent decrease in electric conversion efficiency when the temperature in the solar collectors rises, and this is particularly evident at the latitudes of Southern Europe. A possible solution is to dissipate the excess heat of the solar collectors through pipes into the ground. The circulating fluid in the pipes can be either air or water. When using air, the earth tubes are generally horizontally displaced 2–3 m deep from the surface, exchanging heat with the shallow ground. In this context, the heat exchange is strongly affected by seasonal temperature fluctuations. Essentially, the only purpose of such earth air tubes is reducing the heat of solar panels, without the possibility of long-term storage [
14]. On the other hand, when using water, the pipes are generally displaced vertically in the form of BHEs, and the heat can be initially stored in BTES and then recovered through the use of a heat pump (HP) unit [
15].
1.3. Contribution and Paper Organization
The target of this research was the development and the implementation of a pilot project of BTES specifically devoted to storing the excess solar heat produced by PVT collectors for exploitation during the cold season, through a dual-source heat pump (DSHP) unit. Currently, the use of BTES technology is still not widespread, since the exploitation of shallow geothermal energy from standard coupling between BHEs and HPs is considered sufficient to meet a consistent part of the overall energy needs in Southern Europe and the Mediterranean area, where the climate conditions are generally mild [
16]. Moreover, BHEs and solar thermal panels have been generally considered by customers as alternatives to one another, and their integration is generally limited [
17], while the integration of HPs and PV panels has become common practice [
18]. In particular, the market of systems combining HPs and PVs has recently been boosted by the diffusion of electric batteries and the setup of energy communities [
19]. In such conditions, the combined use of PVs and ground-source heat pumps (GSHPs), air-source heat pumps (ASHPs) or, more recently, DSHPs, can provide significant amounts of renewable energy. However, due to the low enthalpy level of the shallow subsoil—in Italy, the ground temperature varies from 10 °C in the Alps to 20 °C in the south and below urban settlements [
20]—a certain energy gap still exists and needs to be filled. The storage of solar thermal energy provided by PVT collectors in the BTES can be an effective solution to fill this gap, due to the artificial increase in ground temperature in summer, resulting in a performance enhancement of the GSHP or DSHP in winter [
21]. The large-scale market application of BTES faces three issues: two are related to the difficulty in storing the heat underground for long periods, while the other is related to the aquifer protection. Excessively fast dissipation of the heat stored in the BTES is caused by (1) the thermal impact of seasonal ambient temperature fluctuations, mainly affecting the short BHEs, not reaching the neutral zone [
22]; and (2) the presence of strong groundwater flow, affecting all of the BHEs intersecting the aquifers in such hydrogeological conditions [
23]. Referring to the environmental impact, it was found that increasing the aquifer temperature over 40 °C can provide alterations of pH, total inorganic carbon, and major cations, and can even create suitable conditions for the growth of pathogenic organisms [
24]. For the latter reason, as an example, the aquifer protection legislation of the Emilia-Romagna region in Italy prevents the injection of heat in the ground at temperatures higher than 35 °C.
Within this framework, the general objective of this research was to design, implement, and demonstrate the feasibility of BTES in a hydrogeological context of stable aquifer conditions. Additionally, the specific objectives included the definition, development, and achievement of the main phases necessary to set the system up and install it in a real case, i.e., characterization of the underground, modeling of the geothermal storage, simulation of the flows, and design and installation of the integrated system.
This paper presents the methods adopted to allow the balance between the underground solar thermal storage and the geothermal heat extraction, in a specific climatic and geological context, to achieve an almost 100% exploitation of renewable energy by the efficient integration of PVT, BTES, and DSHP. The intervention relies on a project of energy renovation of a livestock building for weaning piglets in a swine farm in Mirandola (Modena, Emilia-Romagna, Italy), within the framework of the RES4LIVE Horizon 2020 Project “Energy Smart Livestock Farming towards Zero Fossil Fuel Consumption” [
25]. A BHE field was implemented, with the aim of long-term underground storage of the excess heat coming from the PVT panels. In order to verify the feasibility and sustainability of such a BTES system, it was necessary to characterize the underground properties and to carry out preliminary analyses over test BHEs and dedicated piezometers. Specifically, this paper is arranged with reference to the following phases of the research:
Investigation of geological, hydrogeological, and geothermal conditions;
Pre-feasibility study of the project alternatives;
Numerical modeling of the underground transport of flow and heat;
Detailed design of the final system;
System implementation in the farm.
The next section describes the case study, the investigation phase, the project alternatives evaluated, and the modeling and design procedure adopted. Afterwards, the results of the short- and long-term simulation are presented and discussed, together with a comparison of potential alternatives. The contribution of BTES towards reaching long-term energy stability is highlighted. For the sake of clarity, in figures and graphs, the symbols presented in
Table 1 are used:
2. Materials and Methods
2.1. The Case Study
Among the demonstration interventions of the RES4LIVE H2020 Project, the implementation of a technologically advanced experimental system using renewable energies was planned within the “Golinelli Farm”, specialized in the production of fruit and vegetables and in pig farming, located in Mirandola (MO), Northern Italy. The intervention was located within a territory with a predominantly agricultural vocation, located a few kilometers south of the Po River (
Figure 1). The territorial area is mapped in section No. 184061 “Mirandola Nord” of the Emilia-Romagna Regional Technical Map, at a scale of 1:5000. The coordinates of the intervention area within the property of the “Golinelli Farm” are as follows:
Longitude X: 6,680,193 (EPSG 5659, UTMRER)—11°07′50″ (WGS84);
Longitude Y: 978,682 (EPSG 5659 UTMRER)—44°56′24″ (WGS84);
Altitude: 10.2—10.4 m a.s.l.
2.2. Geology and Hydrogeology Data Collection
From a geological point of view, the investigated area is covered by Quaternary fluvial sediments, which resulted from the depositional activity of the Po River and its right-hand tributaries draining the Northern Apennines (the Panaro and Secchia rivers) and can be divided into two main stratigraphic units [
26]: the lower Emilia-Romagna Synthem (0.65–0.45 Ma) and the Upper Emilia-Romagna Synthem (0.45 Ma–present). Their thicknesses and horizontal distribution have been strongly influenced by the underlying tectonic structures [
27,
28]. The most superficial Pliocene–Quaternary deposits are characterized by alternating coarse (primarily sands of different granulometric composition, and secondarily gravels) and fine (i.e., clays, silts, silty–muddy) sediments [
26,
29]. In agreement with the general geological framework, and on the basis of the available stratigraphic data and direct drilling cuttings released in the investigated area, it is possible to distinguish two principal lithological units within the shallowest 30 m. The first one, from 0 to about 12 m
b.g.l., consists of alternating clay and silt levels, with sandy and clayey lenses at the base (10–12 m); the second one, from 12 to 30 m
b.g.l., is instead characterized by prevailing sandy material of different granulometric compositions (
Figure 2). Based on these data, from a hydrogeological point of view, the confined aquifer system (Würmian age)—which is mainly developed in the sandy layer, referred to as A1 at the regional scale—can be recognized from 12 m deep down to the bottom of the investigation, although vertical and horizontal heterogeneities could occur. Grain size tests were carried out on samples of alluvial material extracted during drilling (
Figure 3). Based on the particle size distribution analysis using the empirical formula of Hazen [
30], it was possible to attribute an indicative hydraulic conductivity to the sands between 10 and 15 m/d, which means around 10
−4 m/s, at the highest boundary of the expected range of hydraulic conductivity for sands. Additionally, the aquifer is confined, with a potential level at around −2 m from ground level. Being in a lowland area, the hydraulic gradient is very small, in the order of 0.1 ‰. Despite the high hydraulic conductivity, the groundwater flow is low.
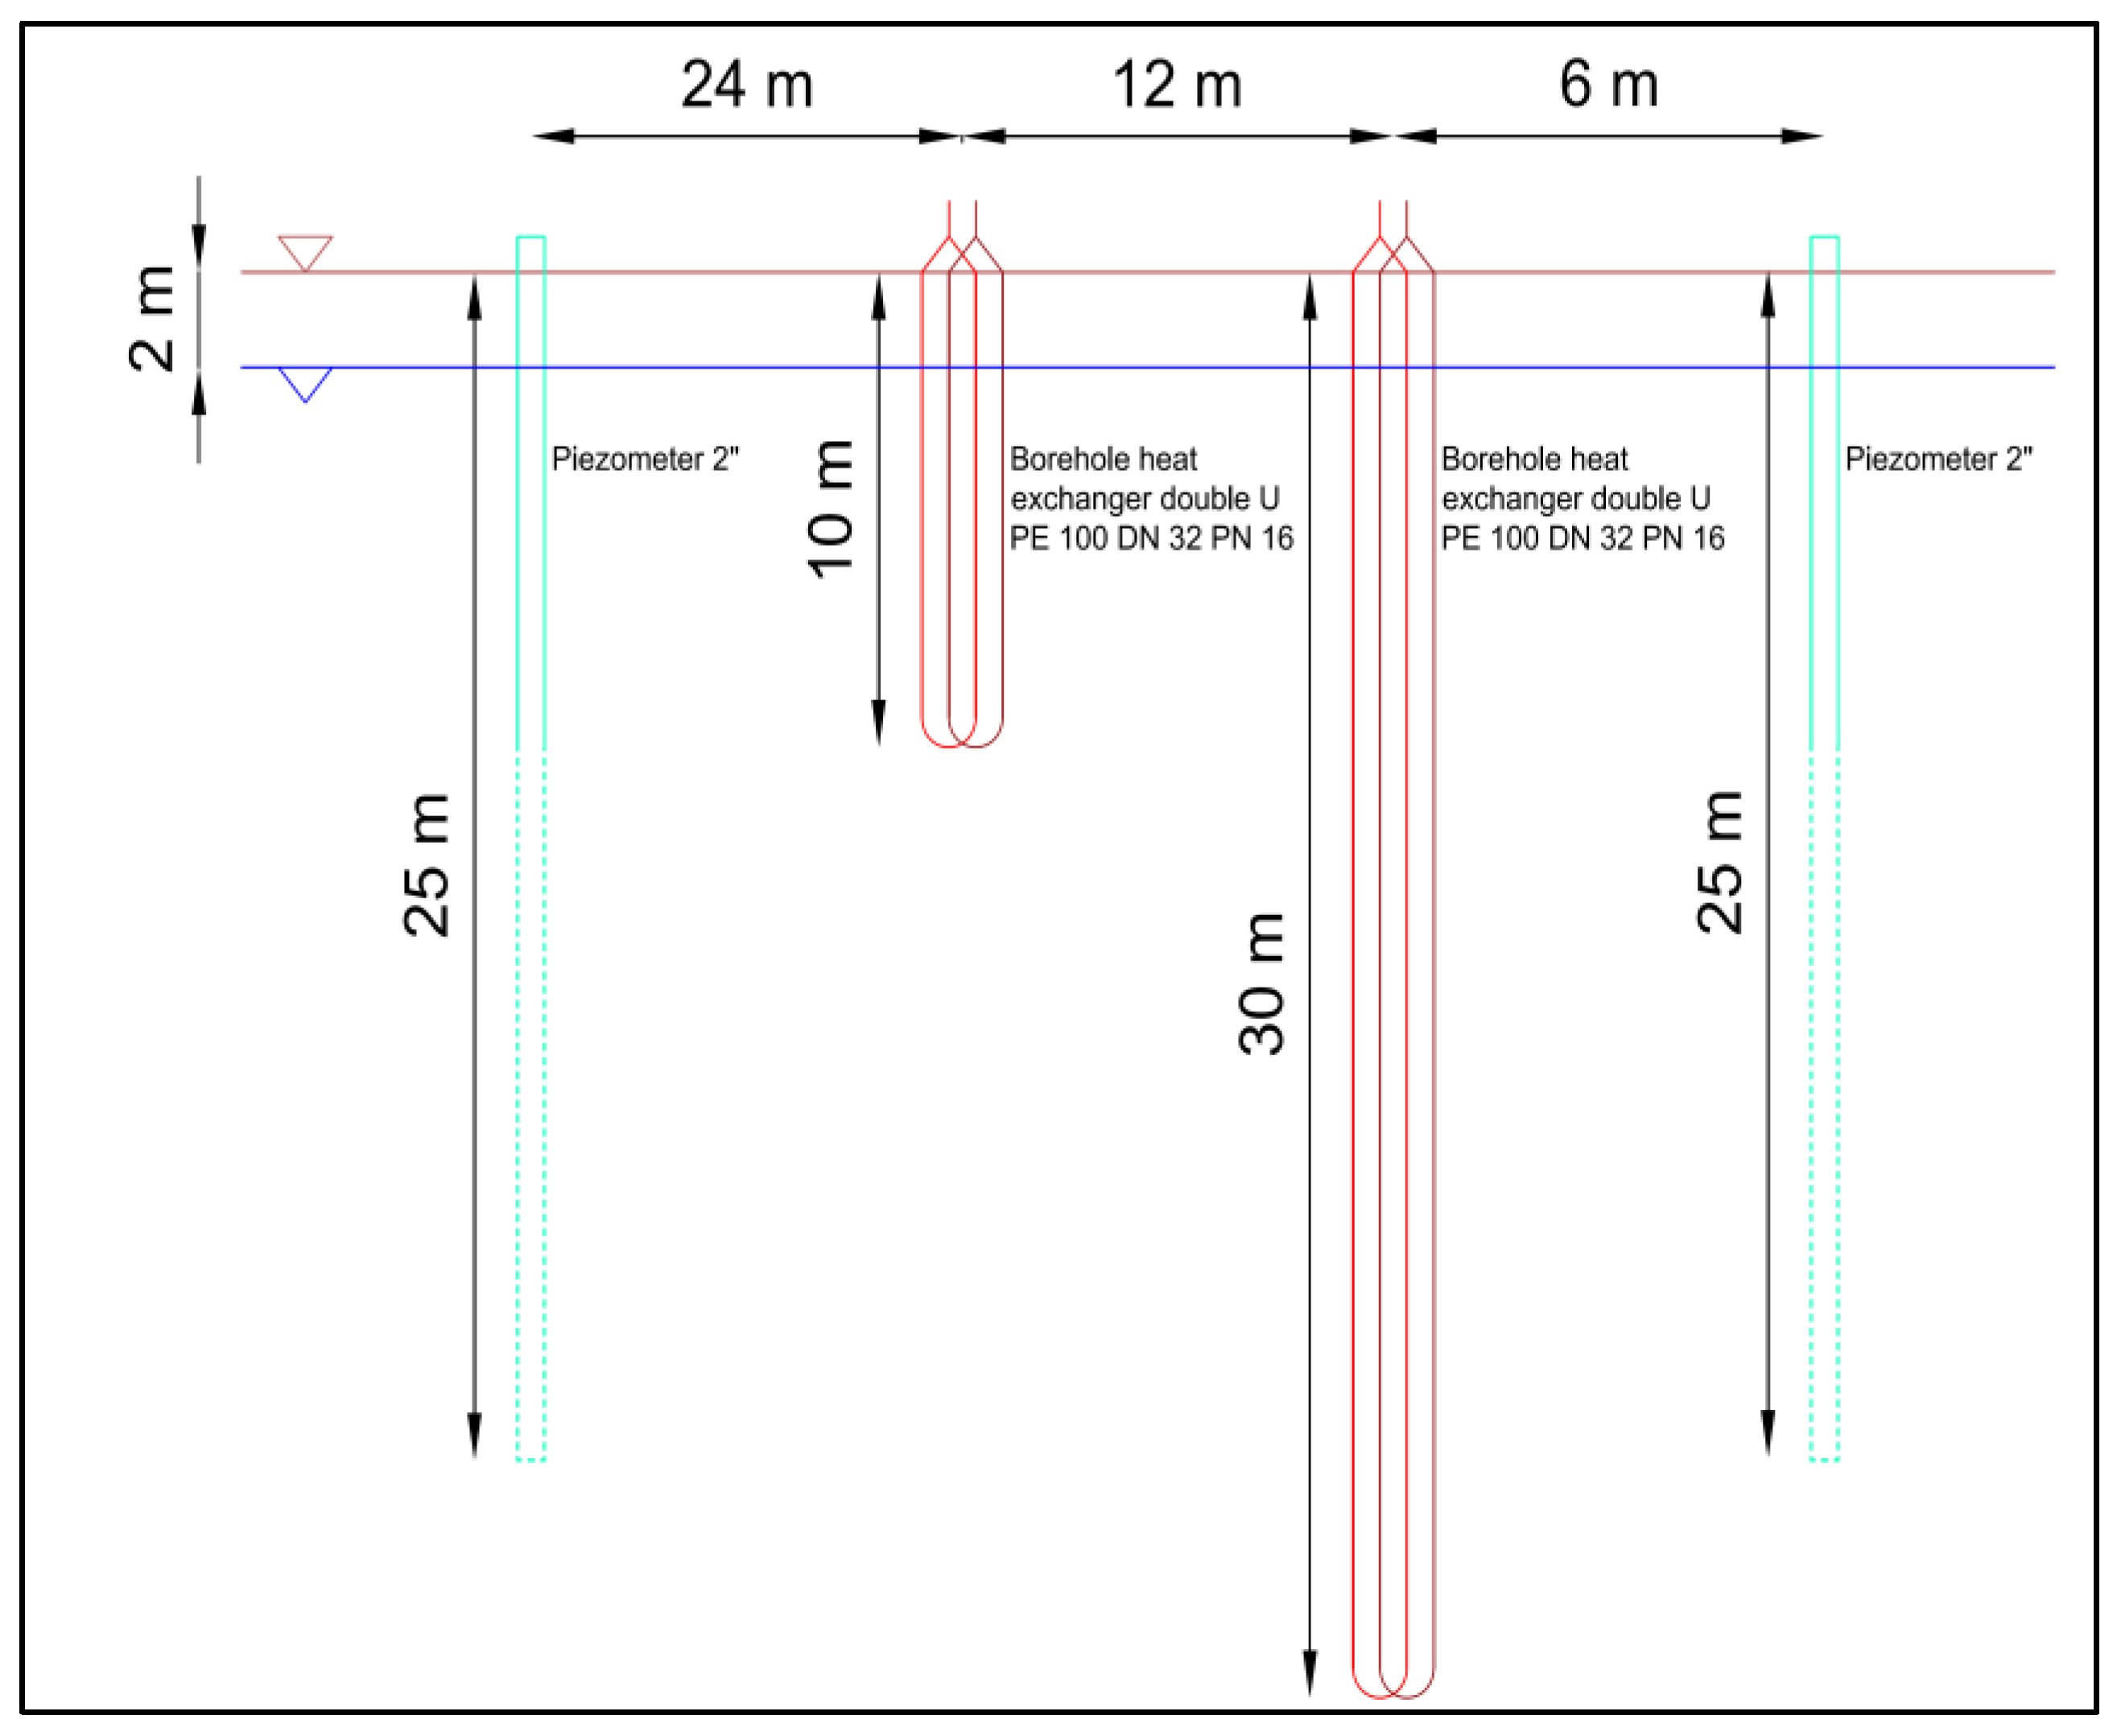
Two test BHEs (10 and 30 m depth, respectively) and two piezometers (both 25 m depth) were installed through core-destruction rotary drilling with direct water circulation. The drilling diameter was 150 mm, sufficient to install the two “PE100 DN32 PN16 double-U” BHEs and the two “2 inches PVC” piezometers. Considering the sandy–clayey nature of the subsoil traversed and the limited drilling depth, the addition of bentonite to the circulating fluid was not envisaged. During the drilling phases, through analysis of cuttings, the stratigraphy and the actual level of the groundwater were detected. Regarding the BHEs, they were lowered into the hole with the aid of a weight. Together with the BHEs, another pipe was lowered, so as to inject the grouting (composed of concrete, bentonite, and silica sand) into the annulus, starting from the bottom of the hole. At the end of each installation, a flow test and a pressure test were performed, in order to verify the sealing of the pipes and the absence of abrasions or clogging. Regarding the piezometers, the filter was between −10 and −25 m, and a nonwoven fabric was used to prevent the entry of fine material.
Table 2 shows ranges of values for the thermal and hydraulic properties of the different layers, taken from national technical standards [
31], recognized research works [
32], bibliographic references [
33,
34], and laboratory measurements.
2.3. Thermal Response Tests
The thermal parameters were obtained from two thermal response tests (TRTs) carried out on the two BHEs. The standard TRT procedure consists of a constant heat injection into the BHE, at a constant flow, for a fixed period of time. The circulating fluid inlet and outlet temperatures at the borehole head are continuously measured. The analysis of the behavior of the fluid temperature curves allows the determination of the main thermophysical parameters of the ground [
35]. After the end of the injection period, the heat release period provides additional information on the ground’s heat capacity [
36]. The injected power chosen was 1500 W for both BHEs. The results are presented in
Figure 4 and
Figure 5.
The equivalent thermal properties found along the 30 m borehole, using the line source model [
37], together with the related uncertainties of the calculation, were as follows:
Thermal conductivity (λ): 2 ± 0.2 W/(m·K);
Volumetric heat capacity (ρC): 1.7 ± 0.5 MJ/(m3·K);
Thermal diffusivity (α): 0.11 ± 0.05 m2/d.
Similar to the hydraulic conductivity, the values of thermal conductivity and thermal diffusivity fell within the boundaries of the ranges shown in
Table 2, precisely at the lower limit for thermal conductivity and at the upper limit for thermal diffusivity. It is worth mentioning that thermal diffusivity and thermal conductivity are related to the volumetric heat capacity, as shown in Equation (1):
Moreover, the thermal conductivity of sand samples was measured at the Geoth lab of Ferrara University [
38], and the results were as follows:
Regarding the groundwater level and temperature, they were measured in the “North” and “South” piezometers. In undisturbed conditions, the measurements reported similar results for both piezometers (
Figure 6).
The graphs show that the ground temperature follows the usual damping below the ground, typical of the investigation area [
39]. Some perturbances due to drilling works and the execution of the two TRTs were perceived in the “North” piezometer (below the BHEs) up to February 2022; afterwards, the situation tended to stabilize, and the curves started to follow the usual path.
Table 3 presents two measurements with a thermophreatimeter with accuracy of ±0.1 K. The two measurements were taken in summer and in winter. The comparison shows how the neutral zone, where the temperature remains constant and independent of the effects of seasonality, is fully manifested beyond 20 m depth.
Furthermore, by means of a multiparameter probe, installed at a depth of 10 m in the “North” piezometer, the water level and temperature were measured continuously in the period between 22 February and 15 April 2022. The results are shown in
Figure 7.
It should be mentioned that, on days 1–3 of the measurements, the abovementioned TRT was in progress on the 10 m deep BHE, located 18 m away from the “North” piezometer. The second TRT on the 30 m deep BHE, located 6 m away, was performed on days 14–17. Finally, 2 wells catching water from Aquifer A1 for the needs of the farm are located about 50 m away from the “North” piezometer. The exact arrangement of the artifacts is shown in
Figure 8.
2.4. Numerical Modeling
All measured and estimated parameters were inserted into a numerical model of the system. The use of numerical simulation was necessary to verify the effective impacts of groundwater flow (natural and enhanced by water pumping from wells) on the operation of the BTES system during the solar heat storage phase in summer and the geothermal heat exploitation phase in winter. It was necessary to verify that the thermal plume caused by the summer heat storage remained around the BTES field, in order to subsequently exploit the heat in winter by means of the heat pump.
The model of the BTES was created with FEFLOW
® [
40,
41]—a software platform for the simulation of flow, heat, and mass transport in the subsoil. The software has a specific section dedicated to the equations governing the heat exchange in BHEs, as well as for the extraction of water from wells; therefore, it was deemed suitable for our purposes.
The subsoil was discretized into 21 layers, starting from the surface to a depth of 50 m. The model area was 65 × 110 m2, sufficient to include all of the main buildings of the Golinelli farm, the whole area where the BHEs and piezometers were located, and the 2 existing wells.
The hydraulic and thermal properties obtained from the in situ and lab measurements were assigned to the different layers into which the model was discretized. The surface temperature of the Mirandola climate was set, with the thermal damping corresponding with the depth, and calibrated due to the measurements taken by the piezometers, and then it was taken as the boundary thermal condition. The temperature at a depth of 50 m was set at 14 °C. The temperature under the 3 buildings in the first surface layer was set at 19 °C. Concerning the hydraulic gradient, it followed the values taken from the measurements and was considered equal to 0.2 m/100 m along the south–north direction, with a level varying from −1.65 m on the southern border to −1.85 m on the northern border.
The two existing wells were modeled with the “Well BC” boundary condition, with the extraction flow rate set at 4 dm3/s. This value is the maximum allowable according to the authorization by the Environmental Authority.
The “North” and “South” piezometers and the BHEs at a depth of 10 m were modeled as “Observation Points” to measure and record the dynamic results of the simulation in terms of hydraulic pressure and soil temperature. This allowed a systematic comparison of the simulation results with the experimental values during the operation of the integrated system.
The BHEs at 30 m depth, composing the BTES field, were modeled with the boundary condition “Borehole Heat Exchanger”. The construction parameters were assigned to each of them, as well as the use of a heat transfer fluid with a 35% propylene glycol content (allowed by the Environmental Authority and necessary to avoid freezing of the thermovector fluid from the solar panels). Using the “Link Borehole Heat Exchanger” command, the optimal configuration for energy storage was indicated.
3. Results
3.1. Design of the BTES System
The design of the BTES field considered the hydrogeological and thermophysical characteristics of the soils. On the basis of the information collected, the total loads and flows in the pipes were set as indicated in
Table 4.
The injected/extracted heat for each month was the result of the difference between the injected heat from the PVT and the extracted heat to the HP.
The TRTs carried out showed how the operation of the BHE at 10 m depth is excessively influenced by the climatic conditions in order to guarantee the stability of the long-term thermal storage. The hydrogeological conditions of the aquifer present in the sand deposit (high hydraulic conductivity, but reduced hydraulic gradient between the “North” and “South” piezometers, 50 m apart) seemed to guarantee a limited flow and substantial groundwater stability; therefore, proficient long-term solar heat storage should be performed by means of BTES at a depth of 30 m in Aquifer A1. In order to enhance the performance of the solar storage, all year long, it was decided to keep the “solar” source (the thermal storage circuit) separate from the “geothermal” source (the heat exploitation circuit). For this reason, each “Double U” probe was divided into two separate single-U circuits: one fully dedicated to heat storage, and the second fully dedicated to heat exploitation.
The heat loads to be stored in Aquifer A1 by means of the BTES and later exploited are presented in
Table 5.
From the analysis of
Table 5, the heat loads were unbalanced towards the heat injection at a 3:2 ratio with respect to the heat extraction. The heat pump only works in heating mode; therefore, all of the heat injected into the subsoil comes from the solar source, without the need of dissipating heat from the building. Moreover, the heat pump is a dual-source one, i.e., it is able to exploit heat both from the BTES field and from the air [
42]. Sophisticated control systems allow us to choose, for each condition, the best source to ensure the maximum possible performance [
43,
44].
Due to the latitude and climatic conditions of Northern Italy, the injection of solar heat into the subsoil takes place all year round, even in the coldest months. The design choice to use the two separate circuits allows the subsoil to be thermally “recharged” via the solar source even during the winter extraction periods and, to a limited extent, simultaneously with them. According to the prescription of the local environmental agency, the temperature of the injected fluid must be lower than 35 °C. Thermal overload can arise in the central hours of the day in the summer season, for which proper safety systems are foreseen, in order to distribute the heat over several hours per day.
In the common practice of BHE fields, the distance between adjacent BHEs is around 6–8 m. This safety aspect is needed to avoid superimposition of thermal effects between nearby BHEs, with subsequent ground heat depletion during the operation of the system [
45]. On the other hand, the main purpose of the BTES field is to enhance the heat storage for its subsequent reuse. Therefore, in this case, the superimposition of effects is beneficial to increase the subsoil temperature [
46]. In order to create an efficient “thermal core” (TC), it was decided to keep the BHEs 2–3 m away from one another, as per the practice of similar cases of BTES systems present in the international literature. For example, Haq et al. proposed a BTES system composed of 144 vertical probes 35 m deep, spaced 2.25 m apart, to be installed in Finland [
47]. The Finnish project is similar to a historical BTES facility—the Drake Landing Solar Community in Canada, in which 144 probes 35 m deep were organized in six parallel groups of 24 probes each and 2.25 m apart from one another [
48]. In Italy, similar experiences exist on a small scale. An example is the pilot plant of the University of Turin, where three vertical probes of 27 m each, 2 m apart, were built—arranged to form the vertices of an equilateral triangle—for research purposes [
49]. The TC in the middle of the BTES field is kept warm for the whole season, until the beginning of heat extraction and beyond [
50]. In any case, by injecting fluid at a maximum temperature of 35 °C, the subsoil temperature increase in the TC can never exceed this value.
In order to obtain a TC suitable for thermal storage, in BTES practice it is preferable to create hybrid connections in series/parallel among the BHEs. Connecting the BHEs in series and injecting heat from the center of the field to the boundaries leads to a greater temperature rise in the TC, in comparison to different configurations. During the exploitation phase, the direction is reversed, extracting heat first from the boundary and then from the center. Fixing all of the boundaries, the designed BTES field, capable of supplying the required thermal loads of the piglets’ nursery building, is made up of eight BHEs, each 30 m deep and 2/3 m apart from one another, in a rectangular configuration, in order to optimize the spaces in the available area of the farm. The scheme of the assumed BTES field is shown in
Figure 9.
3.2. Results of the Numerical Simulation
The 3D numerical model, carried out according to the criteria described in
Section 2.4, is represented in
Figure 10.
The initial state was reconstructed with a long-term simulation, without activating the BHEs, but only the two wells (
Figure 11). The simulation results confirmed how, with the hydraulic characteristics set and the extraction flow rates involved, the influence area of the wells is circumscribed and its impact on the BTES should be very limited. On the other hand, the thermal impact of the buildings on the subsoil is not negligible, and it is plausible that it extends between 5 and 10 m in depth. Given the proximity of the buildings to the BTES, the heat exchange in the ground could be influenced.
The simulation time was set at 10 years. November was chosen as the initial month, so as to simulate the operation of the geothermal system in the first year without the contribution of solar heat, and then comparing it with the subsequent years.
The main result of the numerical simulation was the dynamic behavior of the inlet and outlet temperatures in the BTES over the course of the simulation time; moreover, the temperature and the hydraulic level in the monitoring points (the piezometers and the 10 m depth BHE) were returned as well. Due to the hydraulic gradient caused by the continuous operation of the two wells, based on the simulation results in the monitoring points, it is possible that a thermal plume occurs along the south–north direction, but with limited intensity and unable to transport the stored heat away from the BTES in the summer season, before subsequent heat extraction in winter. The inlet and outlet temperature results showed how the system becomes balanced due to the cycles of injection and extraction; in this way, it is able to keep a minimum water temperature of about 6 °C in winter, and a maximum water temperature of about 32 °C in summer, without significant variations over the years and with substantial long-term stability. This performance is reduced in the first year of operation, in the absence of prior solar thermal storage, with the result of the minimum temperature reaching 3.5 °C. Regarding the variation from the stationary condition of ground temperature at the monitoring points, it is evident in the “North” piezometer (maximum temperature of 20 °C and minimum of 5 °C, with respect to the undisturbed ground temperature between 14 and 16 °C), while a much more limited impact is expected in the BHE 10 m deep (maximum temperature of 17 °C and minimum of 8 °C) and, finally, zero impact is expected in the “South” piezometer. Any local surface variations could also be due to the thermal impact of the surrounding buildings. A graphical representation of the results for selected ground layers (5, 10, 20, and 30 m depth) can be found in
Figure 12 (hydraulic head) and
Figure 13 (temperature).
Finally, the results of the fluid temperature evolution in the BTES can be found in
Figure 14. The ground and aquifer temperature variations at the measuring points are illustrated in
Figure 15 (“North” piezometer) and
Figure 16 (BHE 10 m deep). According to the simulation, the temperature of the aquifer in the “South” piezometer (27 m away from the BTES) is unaffected and keeps its natural behavior.
3.3. Realization of the BTES System
The drillings for the installation of the BTES and the excavation for connections were carried out in line with the planned scheme (
Figure 17). During the drilling activities, it was verified that the stratigraphy and lithology of the soils remained almost identical throughout the whole BTES field. For each BHE, the two single-U pipes—for solar heat storage and geothermal heat extraction—were kept as close as possible, in order to maximize the heat exchange between them. The works for the installation of the remaining BHEs and to complete the BTES took around one week. Afterwards, flow and pressure tests were conducted on each geothermal probe to verify their correct functioning. Using the farm’s excavation equipment, a trench 40 cm deep was dug for the placement of the connections. All pipes were duly insulated—even those placed in the trench.
4. Discussion
The results underline that the underground areas of farmyards can be effectively exploited to install BTES, to store the excess heat produced by RES systems, such as solar panels, PVTs, or CHP plants fed by biogas. These applications prove particularly appropriate in livestock farms, which are characterized by a great availability of rooftop areas suitable for the installation of solar panels, and large outdoor paved areas necessary for the passage and maneuvering of trucks, tractors, and farming machinery. At the same time, livestock farms can be equipped with biogas plants to produce electricity and a constant flux of thermal energy, which must be stored in the warm season to prevent its dissipation. Moreover, intensive animal husbandry is characterized by high energy demands and, in particular, continuous and huge heat demands in the cold season.
The adopted approach and the developed analysis method to model and design the pilot BTES system proved effective to define the optimal size of the storage, in terms of the depth, number, and distribution of BHEs. In fact, these results depend on the geological and hydrogeological properties of the area. Unlike standard ground-source heat pump systems, a complete characterization of the underground—through lab and in situ analysis and temperature monitoring—was necessary to confirm the suitability of underground thermal energy storage and its sustainability over time. In particular, the presence and features of aquifers represent crucial factors for the quantification of the heat storage capacity. A numerical model, able to simulate the flow and heat transport in the underground, can support understanding of the heat exchange dynamics between the BTES, the subsoil, and the groundwater. Thus, the potential thermal plume was quantified, and the simulation results clearly showed that the temperatures measured in the underground and in the aquifer along the “South” piezometer upwards, 27 m from the BTES, are not expected to be affected by heat injections and extractions. In contrast, the temperature in the 10 m deep BHE upwards of the BTES, but close to the TC (only 3 m from the southern BHE), followed the oscillation caused by the injection/extraction cycles, but with a relatively small amplitude, with an upper peak of 18 °C. This difference in temperature is also due to the low depth of this test BHE. Conversely, along the depth of the north piezometer downwards from the BTES, the temperature variations were not negligible, with upper peaks greater than 20 °C. This is a clear effect of the thermal plume, which involves the northern area of the TC, along the direction of the groundwater flow, at least up to 6 m, i.e., the distance of the piezometer from the northern BHE. In any case, the heat dispersion seems not to be very relevant, and only marginally influenced by the work of the two wells of the farm; moreover, the temperature peaks are expected to be included inside the aquifer protection limits. The results of the numerical simulations will be verified and validated during the work of the plant, to confirm the suitability of the BTES systems recharged by solar heat in such specific hydrogeological conditions, for its further replicability at the local level. During the experimental phases, various factors are expected to affect the results. The most relevant were identified as follows:
The effective use of the system, based on climate and solar conditions. The energy data were based on the standard behavior for the investigated area. However, fluctuations around the hypothesized conditions should be expected.
The aquifer conditions, due to hydrogeology. The entire model of the BTES is based on the information acquired over the aquifer during the preliminary investigation phase. Unpredictable changes of the aquifer will affect the operation of the system.
In order to verify the validity of the model, various measuring and monitoring systems were set up and activated: continuous monitoring of the solar station and of the heat pump’s working parameters; temperature monitoring of the aquifer and the ground, through sensor strings inside the two piezometers 25 m deep and the test BHE 10 m deep; and temperature monitoring of the BTES, through proper temperature sensors placed along the two circuits and the four lines of the system.
With respect to cost and environmental analysis, the target of this project is to provide the farm with almost 100% free, local, and renewable energy through the optimal integration of PVT, DSHP, and BTES, thereby substituting the existing LPG boiler. Proper monitoring of the energy flows will complete the measurement package and be reported at the end of the RES4Live Project in 2024.
5. Conclusions
The results demonstrate that the energy demand of a livestock farm can be met by a mix of properly defined and specifically designed RES, to optimally exploit the renewable resources available in farming environments.
A step-by-step procedure was developed and tested to characterize the shallow geothermal reservoir and define the optimal design of a BTES system. The study carried out and the pilot application implemented showed that the definition of an effective solution requires the collection of all of the in-depth information that it is possible to obtain with regard to the geological and hydrogeological conditions of the site and the physical properties of the ground. This step of the analysis phase is also necessary to provide the information required by the environmental authorities to issue the authorization of drilling works and of the installation of the BTES. In addition to the collection of the available data for the area under study, the installation of piezometers and test BHEs at different depths represents an efficient approach to define the complete and reliable knowledge framework of the hydrogeological context of the project.
For the purpose of an accurate definition of the thermodynamic parameters of the underground, the execution of TRTs at different depths proved to be fundamental to verify the performances of the BHEs and to properly set up a digital model of the system. The study showed that numerical simulations, based on data collected onsite and in the lab, are needed to define effective and efficient design solutions.
Finally, once the BTES is realized and operational, continuous monitoring of flows and temperatures and efficiency evaluations of the system are necessary to assess its performance and take any possible action needed to calibrate and optimize its functioning. Therefore, smart monitoring and control devices should be included in the installation, in order to record data on heat exchange dynamics and to properly control the vector flows for the two system circuits: from PVT to BTES, and from BTES to HP.
Author Contributions
Conceptualization, F.T., P.T. and S.B.; methodology, F.T. and S.B.; software, F.T.; validation, F.T., P.T. and S.B.; formal analysis, F.T.; investigation, F.T., D.R. and S.B.; resources, F.T., D.R., and S.B.; data curation, F.T. and D.R.; writing—original draft preparation, F.T., D.R. and S.B.; writing—review and editing, F.T. and S.B.; visualization, F.T.; supervision, P.T. and S.B.; project administration, S.B.; funding acquisition, S.B. All authors have read and agreed to the published version of the manuscript.
Funding
This research was funded by the European Commission, within the Horizon 2020 program for the innovation project RES4LIVE “Energy Smart Livestock Farming towards Zero Fossil Fuel Consumption”, running in the period 2020–2024, Grant agreement ID: 101000785, DOI 10.3030/101000785”. The research activities of D.R. are supported by a contract in the framework of the PON REACT EU Project by the Italian MUR.
Institutional Review Board Statement
Not applicable.
Informed Consent Statement
Not applicable.
Data Availability Statement
The collected, primary raw data from the pilot farms of the project RES4LIVE are not openly available, with access limited to the members of the project consortium. Data and deliverables are made openly available, depending on ethics and IP rights. The data are downloadable through the RES4LIVE website at
https://res4live.eu/.
Acknowledgments
The authors wish to thank the Agricola Golinelli farm in Mirandola (MO), Italy—partner of the RES4LIVE project—for the availability and the collaboration. The authors also wish to thank all technicians and researchers who participated in the practical system installation and measurements—in particular, thanks to Sara Kasmaeeyazdi from DICAM, researcher at University of Bologna; Carlos Alejandro Perez Garcia, PhD student of Agricultural Engineering at DISTAL, University of Bologna; and Riccardo Caputo, Professorat the University of Ferrara.
Conflicts of Interest
The authors declare no conflict of interest. The funders had no role in the design of the study; in the collection, analyses, or interpretation of data; in the writing of the manuscript; or in the decision to publish the results.
References
- IPCC. Climate Change 2021: The Physical Science Basis. Contribution of Working Group I to the Sixth Assessment Report of the Intergovernmental Panel on Climate Change; IPCC: Geneva, Switzerland, 2021; Available online: https://www.ipcc.ch/report/sixth-assessment-report-working-group-i/ (accessed on 1 March 2023).
- United Nations. Paris Agreement to the United Nations Framework Convention on Climate Change; United Nations: New York, NY, USA, 2016. [Google Scholar]
- Edenhofer, O.; Pichs-Madruga, R.; Sokona, Y.; Seyboth, K.; Matschoss, P.; Kadner, S.; Zwickel, T.; Eickemeier, P.; Hansen, G.; Schlömer, S.; et al. (Eds.) Special Report on Renewable Energy Sources and Climate Change Mitigation; Cambridge University Press: Cambridge, UK; New York, NY, USA, 2011. [Google Scholar]
- Corà, E. (Ed.) 2050 Vision for 100% Renewable Heating and Cooling in Europe; Bruxelles, Belgium, 2020. Available online: https://www.rhc-platform.org/content/uploads/2019/10/RHC-VISION-2050-WEB.pdf (accessed on 1 March 2023).
- Misech, A.; Spoden, A.; Blanco, A. (Eds.) Strategic Report on Implementation of Research and Innovation Priorities and Deployment Trends of the Renewable Heating and Cooling Technologies; Bruxelles, Belgium, 2021. Available online: https://www.rhc-platform.org/content/uploads/2021/10/RHC-Report-MRes-1.pdf (accessed on 1 March 2023).
- Paksoy, H.O.; Andersson, O.; Abaci, S.; Evliya, H.; Turgut, B. Heating and Cooling of a Hospital Using Solar Energy Coupled with Seasonal Thermal Energy Storage in an Aquifer. Renew. Energy 2000, 19, 117–122. [Google Scholar] [CrossRef]
- Eskilson, P. Thermal Analysis of Heat Extraction Boreholes. Ph.D. Thesis, Lund Institute of Technology, Lund, Sweden, 1987. [Google Scholar]
- Focaccia, S.; Tinti, F.; Monti, F.; Amidei, S.; Bruno, R. Shallow Geothermal Energy for Industrial Applications: A Case Study. Sustain. Energy Technol. Assess. 2016, 16, 93–105. [Google Scholar] [CrossRef]
- Liuzzo-Scorpo, A.; Nordell, B.; Gehlin, S. Influence of Regional Groundwater Flow on Ground Temperature around Heat Extraction Boreholes. Geothermics 2015, 56, 119–127. [Google Scholar] [CrossRef]
- Zhao, Z.; Lin, Y.-F.; Stumpf, A.; Wang, X. Assessing Impacts of Groundwater on Geothermal Heat Exchangers: A Review of Methodology and Modeling. Renew. Energy 2022, 190, 121–147. [Google Scholar] [CrossRef]
- Rivera, J.A.; Blum, P.; Bayer, P. Analytical Simulation of Groundwater Flow and Land Surface Effects on Thermal Plumes of Borehole Heat Exchangers. Appl. Energy 2015, 146, 421–433. [Google Scholar] [CrossRef]
- Ramos-Escudero, A.; Bloemendal, M. Assessment of Potential for Aquifer Thermal Energy Storage Systems for Spain. Sustain. Cities Soc. 2022, 81, 103849. [Google Scholar] [CrossRef]
- Kalidasan, B.; Pandey, A.K.; Rahman, S.; Yadav, A.; Samykano, M.; Tyagi, V.V. Graphene–Silver Hybrid Nanoparticle based Organic Phase Change Materials for Enhanced Thermal Energy Storage. Sustainability 2022, 14, 13240. [Google Scholar] [CrossRef]
- Nethra, M.R.; Kalidasan, B. Earth tube heat exchanger design for efficiency enhancement of PV panel. Mater. Today Proc. 2021, 45, 587–591. [Google Scholar] [CrossRef]
- Gao, L.; Zhao, J.; Tang, Z. A Review on Borehole Seasonal Solar Thermal Energy Storage. Energy Procedia 2015, 70, 209–218. [Google Scholar] [CrossRef]
- Tinti, F.; Pangallo, A.; Berneschi, M.; Tosoni, D.; Rajver, D.; Pestotnik, S.; Jovanović, D.; Rudinica, T.; Jelisić, S.; Zlokapa, B.; et al. How to boost shallow geothermal energy exploitation in the adriatic area: The LEGEND project experience. Energy Policy 2016, 92, 190–214. [Google Scholar] [CrossRef]
- Chiavetta, C.; Tinti, F.; Bonoli, A. Comparative life cycle assessment of renewable energy systems for heating and cooling. Procedia Eng. 2011, 21, 591–597. [Google Scholar] [CrossRef]
- Lorenzo, C.; Narvarte, L.; Cristóbal, A.B. A Comparative Economic Feasibility Study of Photovoltaic Heat Pump Systems for Industrial Space Heating and Cooling. Energies 2020, 13, 4114. [Google Scholar] [CrossRef]
- Canova, A.; Lazzeroni, P.; Lorenti, G.; Moraglio, F.; Porcelli, A.; Repetto, M. Decarbonizing residential energy consumption under the Italian collective self-consumption regulation. Sustain. Cities Soc. 2022, 87, 104196. [Google Scholar] [CrossRef]
- Tinti, F.; Kasmaee, S. A method to evaluate the impact of urbanization on ground temperature evolution at regional scale. Rud. -Geološko-Naft. Zb. 2018, 33, 1–12. [Google Scholar] [CrossRef]
- Maragna, C.; Rey, C.; Perreaux, M. A novel and versatile solar Borehole Thermal Energy Storage assisted by a Heat Pump. Part 1: System description. Renew. Energy 2023, 208, 709–725. [Google Scholar] [CrossRef]
- Tinti, F.; Kasmaee, S.; Elkarmoty, M.; Bonduà, S.; Bortolotti, V. Suitability Evaluation of Specific Shallow Geothermal Technologies Using a GIS-Based Multi Criteria Decision Analysis Implementing the Analytic Hierarchic Process. Energies 2018, 11, 457. [Google Scholar] [CrossRef]
- Nguyen, A.; Pasquier, P.; Marcotte, D. Borehole thermal energy storage systems under the influence of groundwater flow and time-varying surface temperature. Geothermics 2017, 66, 110–118. [Google Scholar] [CrossRef]
- Jesußek, A.; Grandel, S.; Dahmke, A. Impacts of subsurface heat storage on aquifer hydrogeochemistry. Environ. Earth Sci. 2013, 69, 1999–2012. [Google Scholar] [CrossRef]
- Available online: https://cordis.europa.eu/project/id/101000785/results (accessed on 1 March 2023).
- Regione Emilia-Romagna; ENI-AGIP. Riserve Idriche Sotterranee Della Regione Emilia-Romagna [Underground Water Reservoirs in the Emilia-Romagna Region]; A cura di G. Di Dio, S.EL.CA.; ENI-AGIP: Firenze, Italy, 1998; 120p. [Google Scholar]
- Albarello, D.; Martinelli, G. Piezometric levels as possible geodynamic indicators: Analysis of the data from a regional deep waters monitoring network in Northern Italy. Geophys. Res. Lett. 1994, 21, 1955–1958. [Google Scholar] [CrossRef]
- Pieri, M.; Groppi, G. Subsurface Geological Structure of the Po Plain, Italy; Consiglio Nazionale delle Ricerche, Progetto Finalizzato Geodinamica, Modello Strutturale; Consiglio Nazionale delle Ricerche: Roma, Italy, 1981; Volume 414, 23p. [Google Scholar]
- Rapti-Caputo, D.; Martinelli, G. The geochemical and isotopic composition of aquifer systems in the deltaic region of the Po River plain (northern Italy). Hydrogeol. J. 2009, 17, 467–480. [Google Scholar] [CrossRef]
- Hazen, A. Discussion of “Dams on Sand Foundations” by A. C. Koenig. Trans. Am. Soc. Civ. Eng. 1911, 73, 199–203. [Google Scholar]
- UNI 11466:2012; Sistemi Geotermici a Pompa Di Calore—Requisiti per Il Dimensionamento e La Progettazione. UNI: Rome, Italy, 2012.
- Rapti-Caputo, D.; Bratus, A.; Santarato, G. Strategic groundwater resources in the Tagliamento River basin (northern Italy): Hydrogeological investigation integrated with geophysical exploration. Hydrogeol. J. 2009, 17, 1393–1409. [Google Scholar] [CrossRef]
- Freeze, R.A.; Cherry, J.A. Groundwater; Prentice-Hall Inc.: Englewood Cliffs, NJ, USA, 1979; Volume 7632, 604p, ISBN 0133653129. [Google Scholar]
- Fetter, C.W. Applied Hydrogeology, 4th ed.; Prentice Hall: Hoboken, NJ, USA, 2001; 598p, ISBN 0131226878/9780131226876. [Google Scholar]
- Spitler, J.D.; Gehlin, S.E.A. Thermal response testing for ground source heat pump systems—An historical review. Renew. Sustain. Energy Rev. 2015, 50, 1125–1137. [Google Scholar] [CrossRef]
- Javed, S.; Claesson, J.; Beier, R. Recovery times after thermal response tests on vertical borehole heat exchangers. In Proceedings of the 23rd IIR International Congress of Refrigeration (ICR2011) 2011, Prague, Czech Republic, 21–26 August 2011. [Google Scholar]
- Bandos, T.V.; Montero, Á.; Fernández, E.; Santander, J.L.G.; Isidro, J.M.; Pérez, J.; Córdoba, P.J.F.d.; Urchueguía, J.F. Finite Line-Source Model for Borehole Heat Exchangers: Effect of Vertical Temperature Variations. Geothermics 2009, 38, 263–270. [Google Scholar] [CrossRef]
- Rapti, D.; Marchetti, A.; Andreotti, M.; Neri, I.; Caputo, R. GeoTh: An Experimental Laboratory Set-Up for the Measurement of the Thermal Conductivity of Granular Materials. Soil Syst. 2022, 6, 88. [Google Scholar] [CrossRef]
- Tinti, F.; Barbaresi, A.; Benni, S.; Torreggiani, D.; Bruno, R.; Tassinari, P. Experimental analysis of shallow underground temperature for the assessment of energy efficiency potential of under-ground wine cellars. Energy Build. 2014, 80, 451–460. [Google Scholar] [CrossRef]
- Diersch, H.-J.G.; Bauer, D.; Heidemann, W.; Rühaak, W.; Schätzl, P. Finite Element Modeling of Borehole Heat Exchanger Systems: Part 2. Numerical Simulation. Comput. Geosci. 2011, 37, 1136–1147. [Google Scholar] [CrossRef]
- Al-Khoury, R.; Kölbel, T.; Schramedei, R. Efficient Numerical Modeling of Borehole Heat Exchangers. Comput. Geosci. 2010, 36, 1301–1315. [Google Scholar] [CrossRef]
- Corberán, J.M.; Cazorla-Marín, A.; Marchante-Avellaneda, J.; Montagud, C. Dual source heat pump, a high efficiency and cost-effective alternative for heating, cooling and DHW production. Int. J. Low-Carbon Technol. 2018, 13, 161–176. [Google Scholar] [CrossRef]
- Zanetti, E.; Azzolin, M.; Bortolin, S.; Busato, G.; del Col, D. Experimental Data and Modelling of a Dual Source Reversible Heat Pump Equipped with a Minichannels Evaporator. Therm. Sci. Eng. Prog. 2022, 35, 101471. [Google Scholar] [CrossRef]
- Zanetti, E.; Bonduà, S.; Bortolin, S.; Bortolotti, V.; Azzolin, M.; Tinti, F. Sequential coupled numerical simulations of an air/ground-source heat pump: Validation of the model and results of yearly simulations. Energy Build. 2022, 277, 112540. [Google Scholar] [CrossRef]
- Fossa, M.; Rolando, D. Improved Ashrae Method for BHE Field Design at 10 Year Horizon. Energy Build. 2016, 116, 114–121. [Google Scholar] [CrossRef]
- Nordell, B.; Hellström, G. High Temperature Solar Heated Seasonal Storage System for Low Temperature Heating of Buildings. Sol. Energy 2000, 69, 511–523. [Google Scholar] [CrossRef]
- Haq, H.; Välisuo, P.; Mesquita, L.; Kumpulainen, L.; Niemi, S. An Application of Seasonal Borehole Thermal Energy System in Finland. Clean Eng. Technol. 2021, 2, 100048. [Google Scholar] [CrossRef]
- Sibbitt, B.; McClenahan, D.; Djebbar, R.; Thornton, J.; Wong, B.; Carriere, J.; Kokko, J. The Performance of a High Solar Fraction Seasonal Storage District Heating System—Five Years of Operation. Energy Procedia 2012, 30, 856–865. [Google Scholar] [CrossRef]
- Giordano, N.; Comina, C.; Mandrone, G.; Cagni, A. Borehole Thermal Energy Storage (BTES). First Results from the Injection Phase of a Living Lab in Torino (NW Italy). Renew. Energy 2016, 86, 993–1008. [Google Scholar] [CrossRef]
- Elhashmi, R.; Hallinan, K.P.; Chiasson, A.D. Low-Energy Opportunity for Multi-Family Residences: A Review and Simulation-Based Study of a Solar Borehole Thermal Energy Storage System. Energy 2020, 204, 117870. [Google Scholar] [CrossRef]
Figure 1.
Location of the case study (left) and satellite orthophoto of the farm (right).
Figure 1.
Location of the case study (left) and satellite orthophoto of the farm (right).
Figure 2.
Lithological sequences, based on cutting.
Figure 2.
Lithological sequences, based on cutting.
Figure 3.
Particle grain size distribution.
Figure 3.
Particle grain size distribution.
Figure 4.
Thermal response test conducted over the 10 m deep borehole: injection (top) and discharge (bottom) phases.
Figure 4.
Thermal response test conducted over the 10 m deep borehole: injection (top) and discharge (bottom) phases.
Figure 5.
Thermal response test conducted over the 30 m deep borehole: injection (top) and discharge (bottom) phases.
Figure 5.
Thermal response test conducted over the 30 m deep borehole: injection (top) and discharge (bottom) phases.
Figure 6.
Measurements of temperature along depth measured by two piezometers (“South” and “North”) in different periods.
Figure 6.
Measurements of temperature along depth measured by two piezometers (“South” and “North”) in different periods.
Figure 7.
Measurements of water level and temperature measured at the “North” piezometer.
Figure 7.
Measurements of water level and temperature measured at the “North” piezometer.
Figure 8.
Arrangement of borehole heat exchangers and piezometers for preliminary assessment: map and section.
Figure 8.
Arrangement of borehole heat exchangers and piezometers for preliminary assessment: map and section.
Figure 9.
Arrangement of the BTES field: aerial photo, scheme of the connections among the BHEs, and scheme of the connections with the collector and details of the four lines.
Figure 9.
Arrangement of the BTES field: aerial photo, scheme of the connections among the BHEs, and scheme of the connections with the collector and details of the four lines.
Figure 10.
A 3D mesh of the numerical model.
Figure 10.
A 3D mesh of the numerical model.
Figure 11.
Initial state: hydraulic head (top) and temperature (bottom) at 2 m depth.
Figure 11.
Initial state: hydraulic head (top) and temperature (bottom) at 2 m depth.
Figure 12.
Results of 10-year numerical simulation of BTES system cycles of storage and extraction for selected ground layers: hydraulic head (m).
Figure 12.
Results of 10-year numerical simulation of BTES system cycles of storage and extraction for selected ground layers: hydraulic head (m).
Figure 13.
Results of 10-year numerical simulation of BTES system cycles of storage and extraction for selected ground layers: temperature (°C).
Figure 13.
Results of 10-year numerical simulation of BTES system cycles of storage and extraction for selected ground layers: temperature (°C).
Figure 14.
The 10-year evolution of the working fluid temperature in the BTES array composed of the 8 BHEs.
Figure 14.
The 10-year evolution of the working fluid temperature in the BTES array composed of the 8 BHEs.
Figure 15.
The 10-year evolution of the aquifer temperature at the “North” piezometer monitoring point.
Figure 15.
The 10-year evolution of the aquifer temperature at the “North” piezometer monitoring point.
Figure 16.
The 10-year evolution of the subsoil temperature at the 10 m deep BHE monitoring point.
Figure 16.
The 10-year evolution of the subsoil temperature at the 10 m deep BHE monitoring point.
Figure 17.
Realization of the BTES system: installation of the 8 BHEs and pipe connections.
Figure 17.
Realization of the BTES system: installation of the 8 BHEs and pipe connections.
Table 1.
Symbols used in figures and graphs.
Table 1.
Symbols used in figures and graphs.
| Symbol | Variable | Unit |
|---|
| D | Depth | m |
| T | Temperature | °C, K |
| P | Power | W |
| t | Time | days |
| L | Water level | m |
| H | Hydraulic head | m |
Table 2.
Lithological sequences and corresponding ranges of values for various physical properties.
Table 2.
Lithological sequences and corresponding ranges of values for various physical properties.
Via Falconiera 35
Mirandola (MO)—Italy | Ranges |
|---|
Depth
Interval
m | Lithology | Hydraulic
Conductivity
m/s | Porosity
% | Thermal
Conductivity W/(m∙K) | Thermal
Diffusivity
m2/d |
|---|
| 0–10 | Clay and silt | 10−10–10−9 | 0–5% | 0.55–0.65 | 0.02–0.03 |
| 10–12 | Sandy and clayey lenses | 10−6–10−5 | 10–15% | 1–2 | 0.06–0.07 |
| 12–50 | Sand | 10−5–10−4 | 30–40% | 2–3 | 0.09–0.10 |
Table 3.
Comparison of temperature measurements along the depth of a BHE: summer and winter.
Table 3.
Comparison of temperature measurements along the depth of a BHE: summer and winter.
| Depth (m) | Temperature Measurements (°C) |
|---|
| Summer 2022 | Winter 2022 |
|---|
| 0 | 26.8 | 12.9 |
| 1 | 23.6 | 13.0 |
| 2 | 22.3 | 13.3 |
| 3 | 21.0 | 14.3 |
| 4 | 19.7 | 15.1 |
| 5 | 18.6 | 15.6 |
| 6 | 18.0 | 16.0 |
| 7 | 17.7 | 16.2 |
| 8 | 17.3 | 16.2 |
| 9 | 17.1 | 16.1 |
| 10 | 16.8 | 15.8 |
| 11 | 16.6 | 15.7 |
| 12 | 16.3 | 15.5 |
| 13 | 16.1 | 15.3 |
| 14 | 15.8 | 15.2 |
| 15 | 15.6 | 15.1 |
| 16 | 15.4 | 15.0 |
| 17 | 15.2 | 14.8 |
| 18 | 15.0 | 14.7 |
| 19 | 14.9 | 14.6 |
| 20 | 14.7 | 14.5 |
| 21 | 14.6 | 14.4 |
| 22 | 14.4 | 14.3 |
| 23 | 14.3 | 14.3 |
| 24 | 14.3 | 14.3 |
| 25 | 14.2 | 14.2 |
| 26 | 14.2 | 14.2 |
| 27 | 14.1 | 14.2 |
| 28 | 14.1 | 14.1 |
| 29 | 13.9 | 14.0 |
| 30 | 13.9 | 14.0 |
Table 4.
Heat loads and flows in the BTES system.
Table 4.
Heat loads and flows in the BTES system.
| | Heat Injection (-)/Extraction (kWh) | Flow (dm3/min) |
|---|
| Jan | 3599.00 | 80 |
| Feb | 3398.50 | 80 |
| Mar | −683.33 | 46 |
| Apr | −1909.65 | 46 |
| May | −3438.23 | 46 |
| Jun | −3724.11 | 46 |
| Jul | −4755.20 | 46 |
| Aug | −3983.22 | 46 |
| Sep | −2832.97 | 46 |
| Oct | −756.53 | 46 |
| Nov | 1306.33 | 80 |
| Dec | 2960.14 | 80 |
| TOT | −10,819.27 | |
Table 5.
Heat loads to be exchanged with Aquifer A1, according to the thermotechnical design.
Table 5.
Heat loads to be exchanged with Aquifer A1, according to the thermotechnical design.
| | Heat Extraction (kWh) | Heat Injection and Storage (kWh) |
|---|
| Jan | 4503 | 904 |
| Feb | 4442 | 1043 |
| Mar | 1807 | 2490 |
| Apr | 810 | 2720 |
| May | 404 | 3842 |
| Jun | 11 | 3735 |
| Jul | 1 | 4756 |
| Aug | 1 | 3984 |
| Sep | 26 | 2859 |
| Oct | 1149 | 1905 |
| Nov | 2319 | 1013 |
| Dec | 3965 | 1005 |
| TOT | 19,437 | 30,256 |
| Disclaimer/Publisher’s Note: The statements, opinions and data contained in all publications are solely those of the individual author(s) and contributor(s) and not of MDPI and/or the editor(s). MDPI and/or the editor(s) disclaim responsibility for any injury to people or property resulting from any ideas, methods, instructions or products referred to in the content. |
© 2023 by the authors. Licensee MDPI, Basel, Switzerland. This article is an open access article distributed under the terms and conditions of the Creative Commons Attribution (CC BY) license (https://creativecommons.org/licenses/by/4.0/).


