
Ecological Footprint Assessment of Concrete: Partial Replacement of Cement by Water Treatment Sludge and Stone Dust
 , and
, and
Abstract
:1. Introduction
2. Materials and Methods
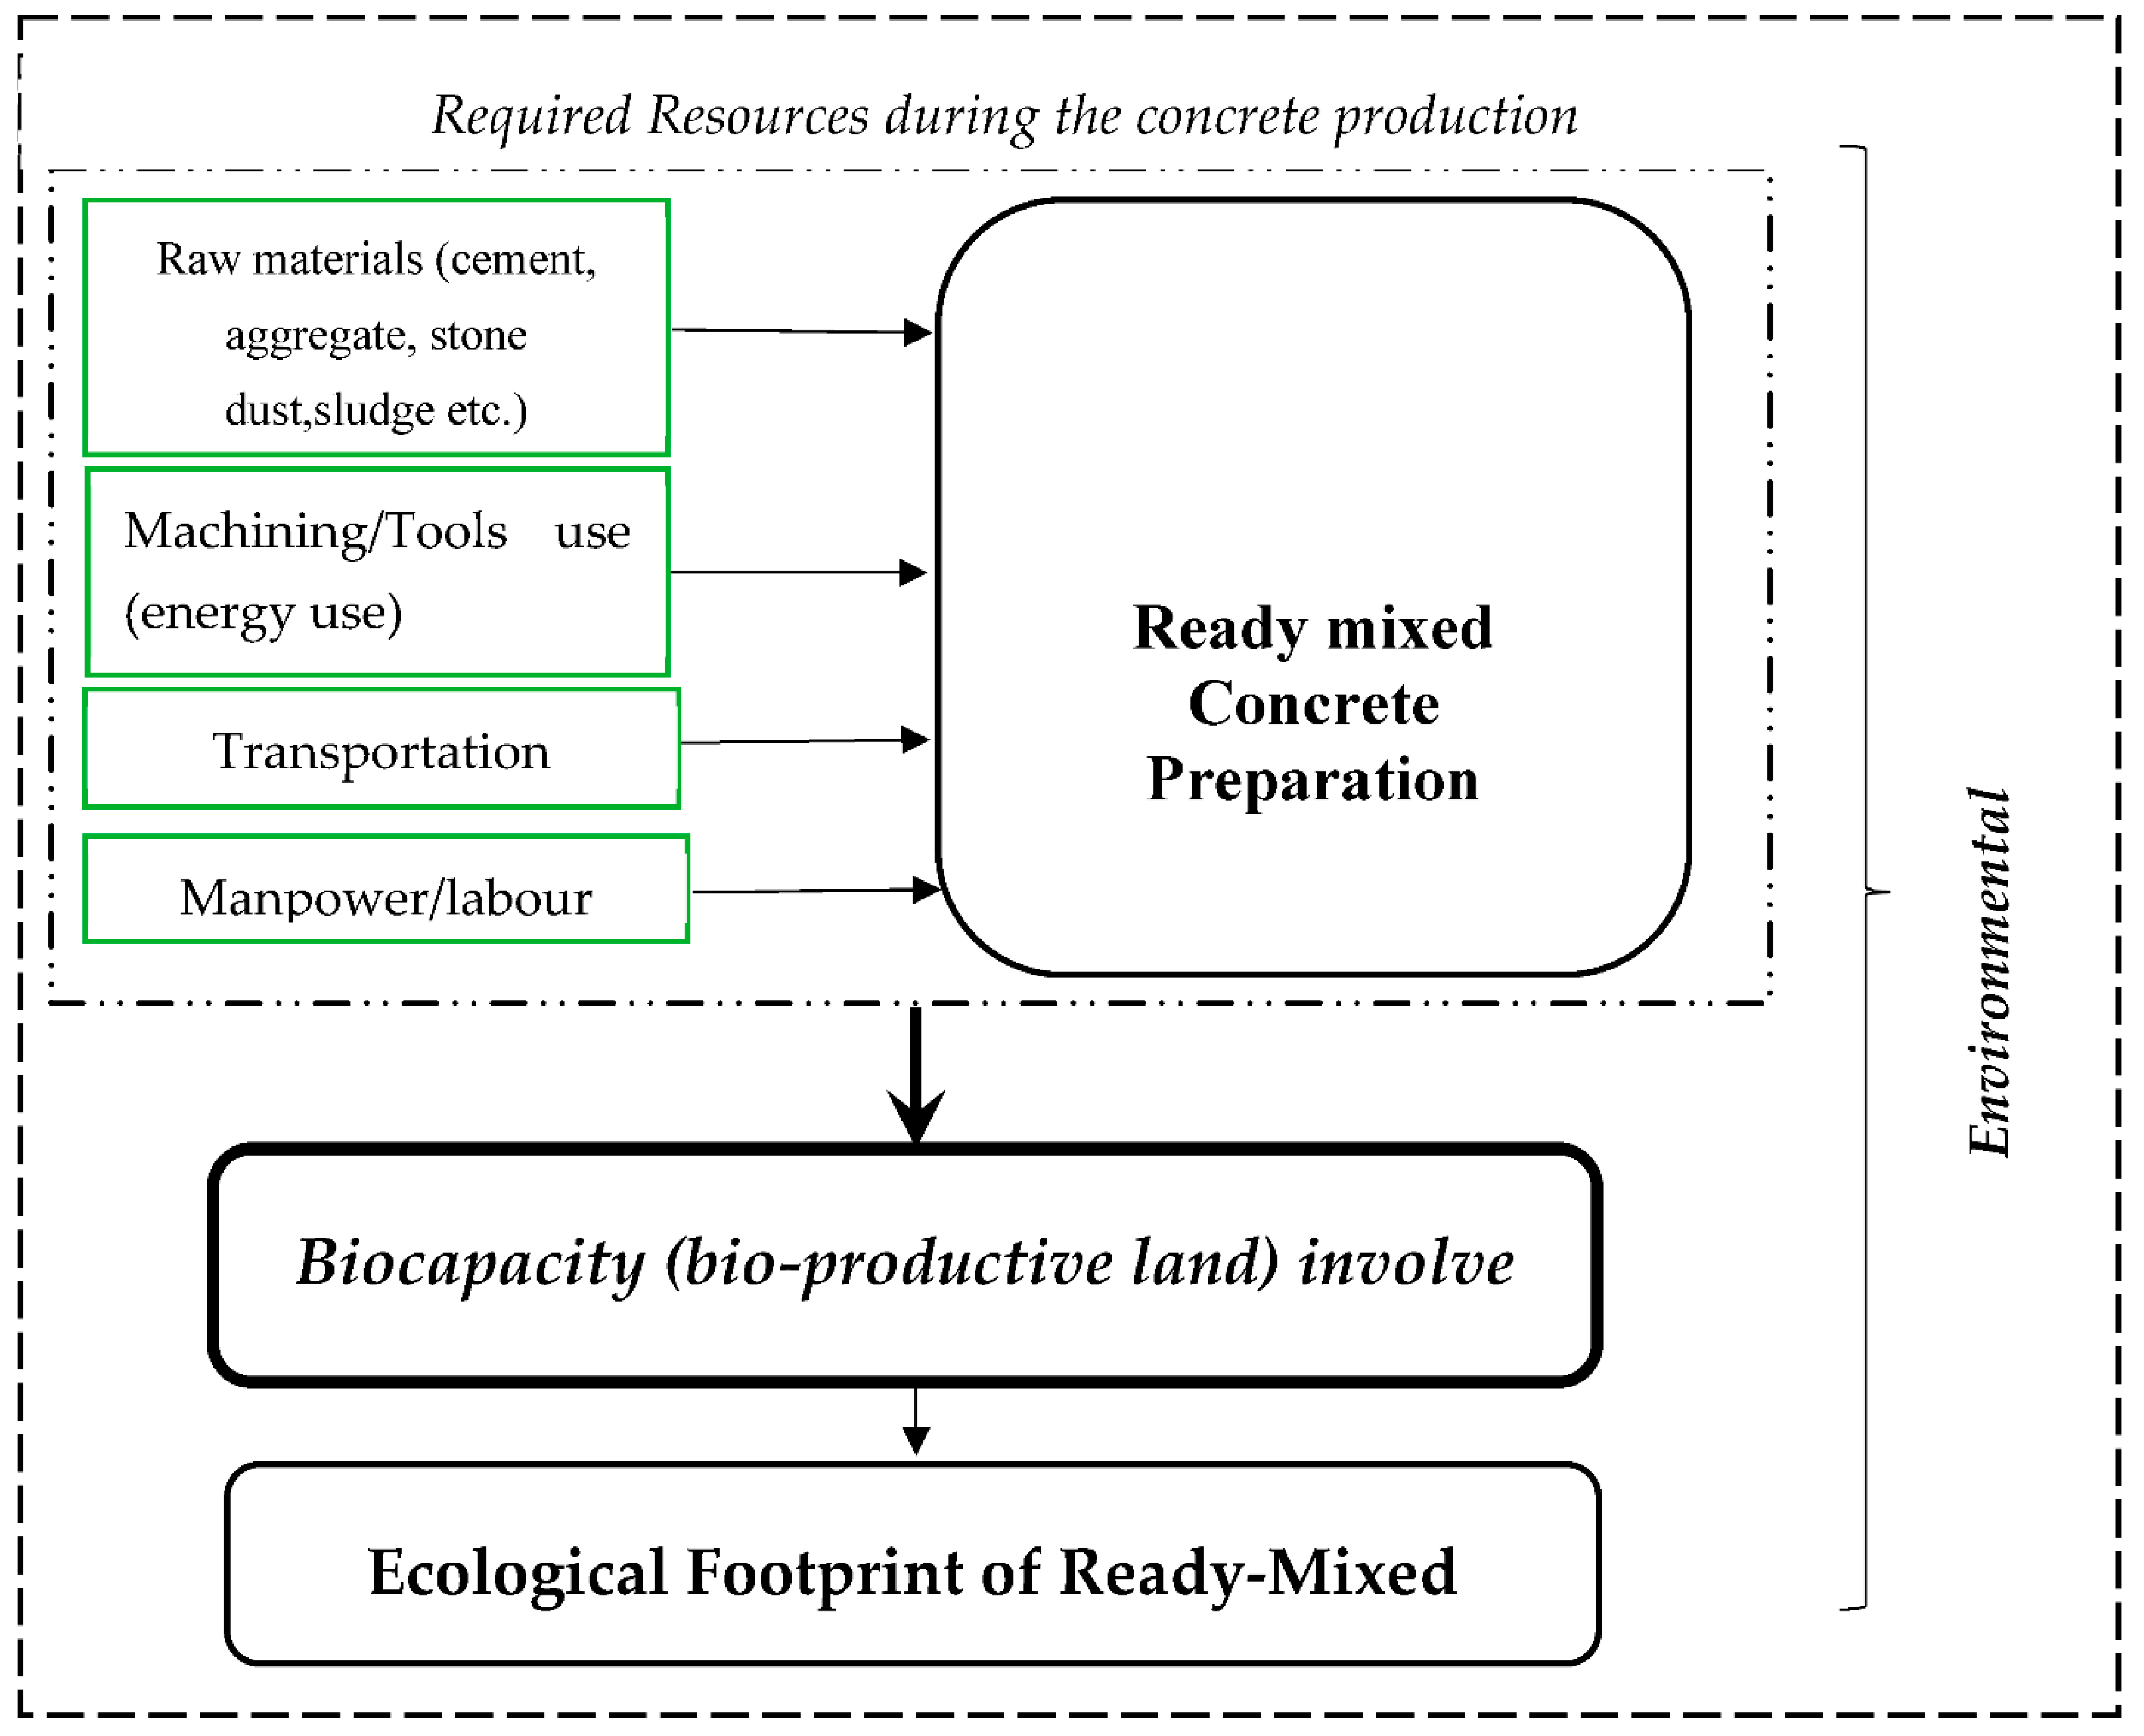
2.1. Ecological Footprint of Ready-Mixed Concrete (EFRMC)
2.1.1. EF of Raw Material Use (EFm)
2.1.2. EF of Energy Consumption (EFe)
2.1.3. Labor (EFl)
2.1.4. Transportation (EFt)
2.2. Ready-Mixed Concrete Materials
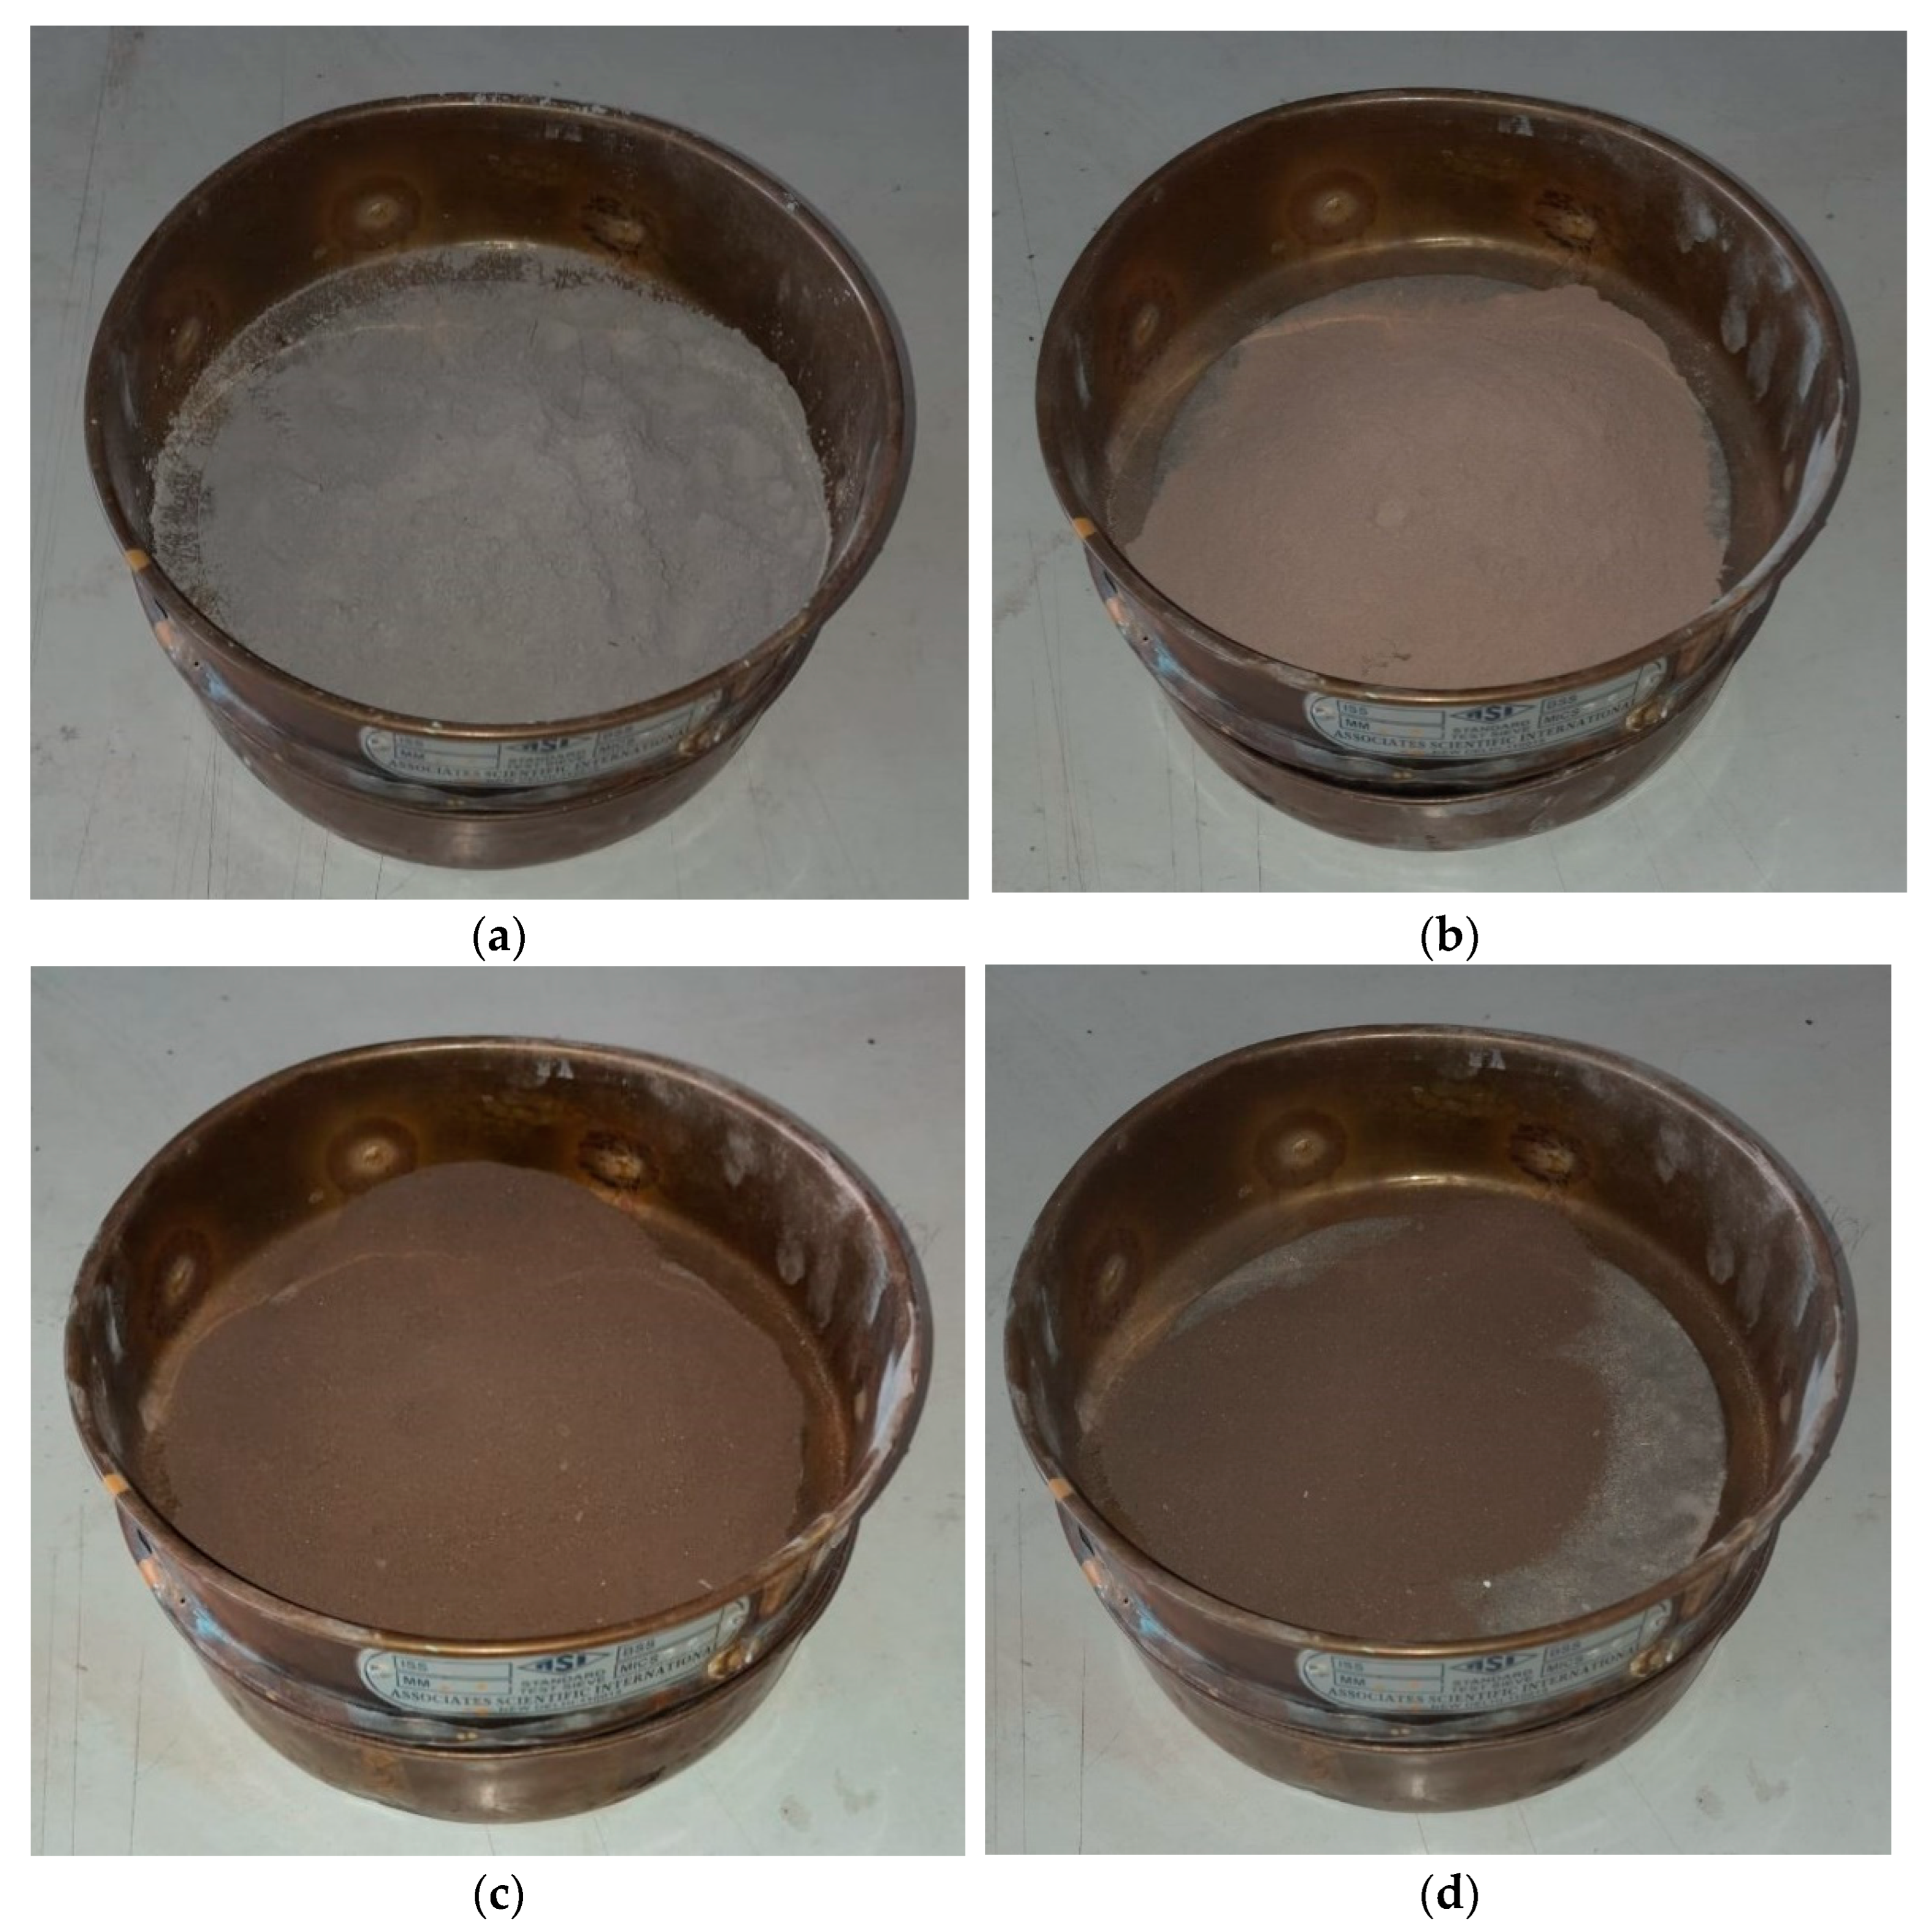
2.2.1. Stone Dust Properties
2.2.2. Water Treatment Sludge (WTS) Properties
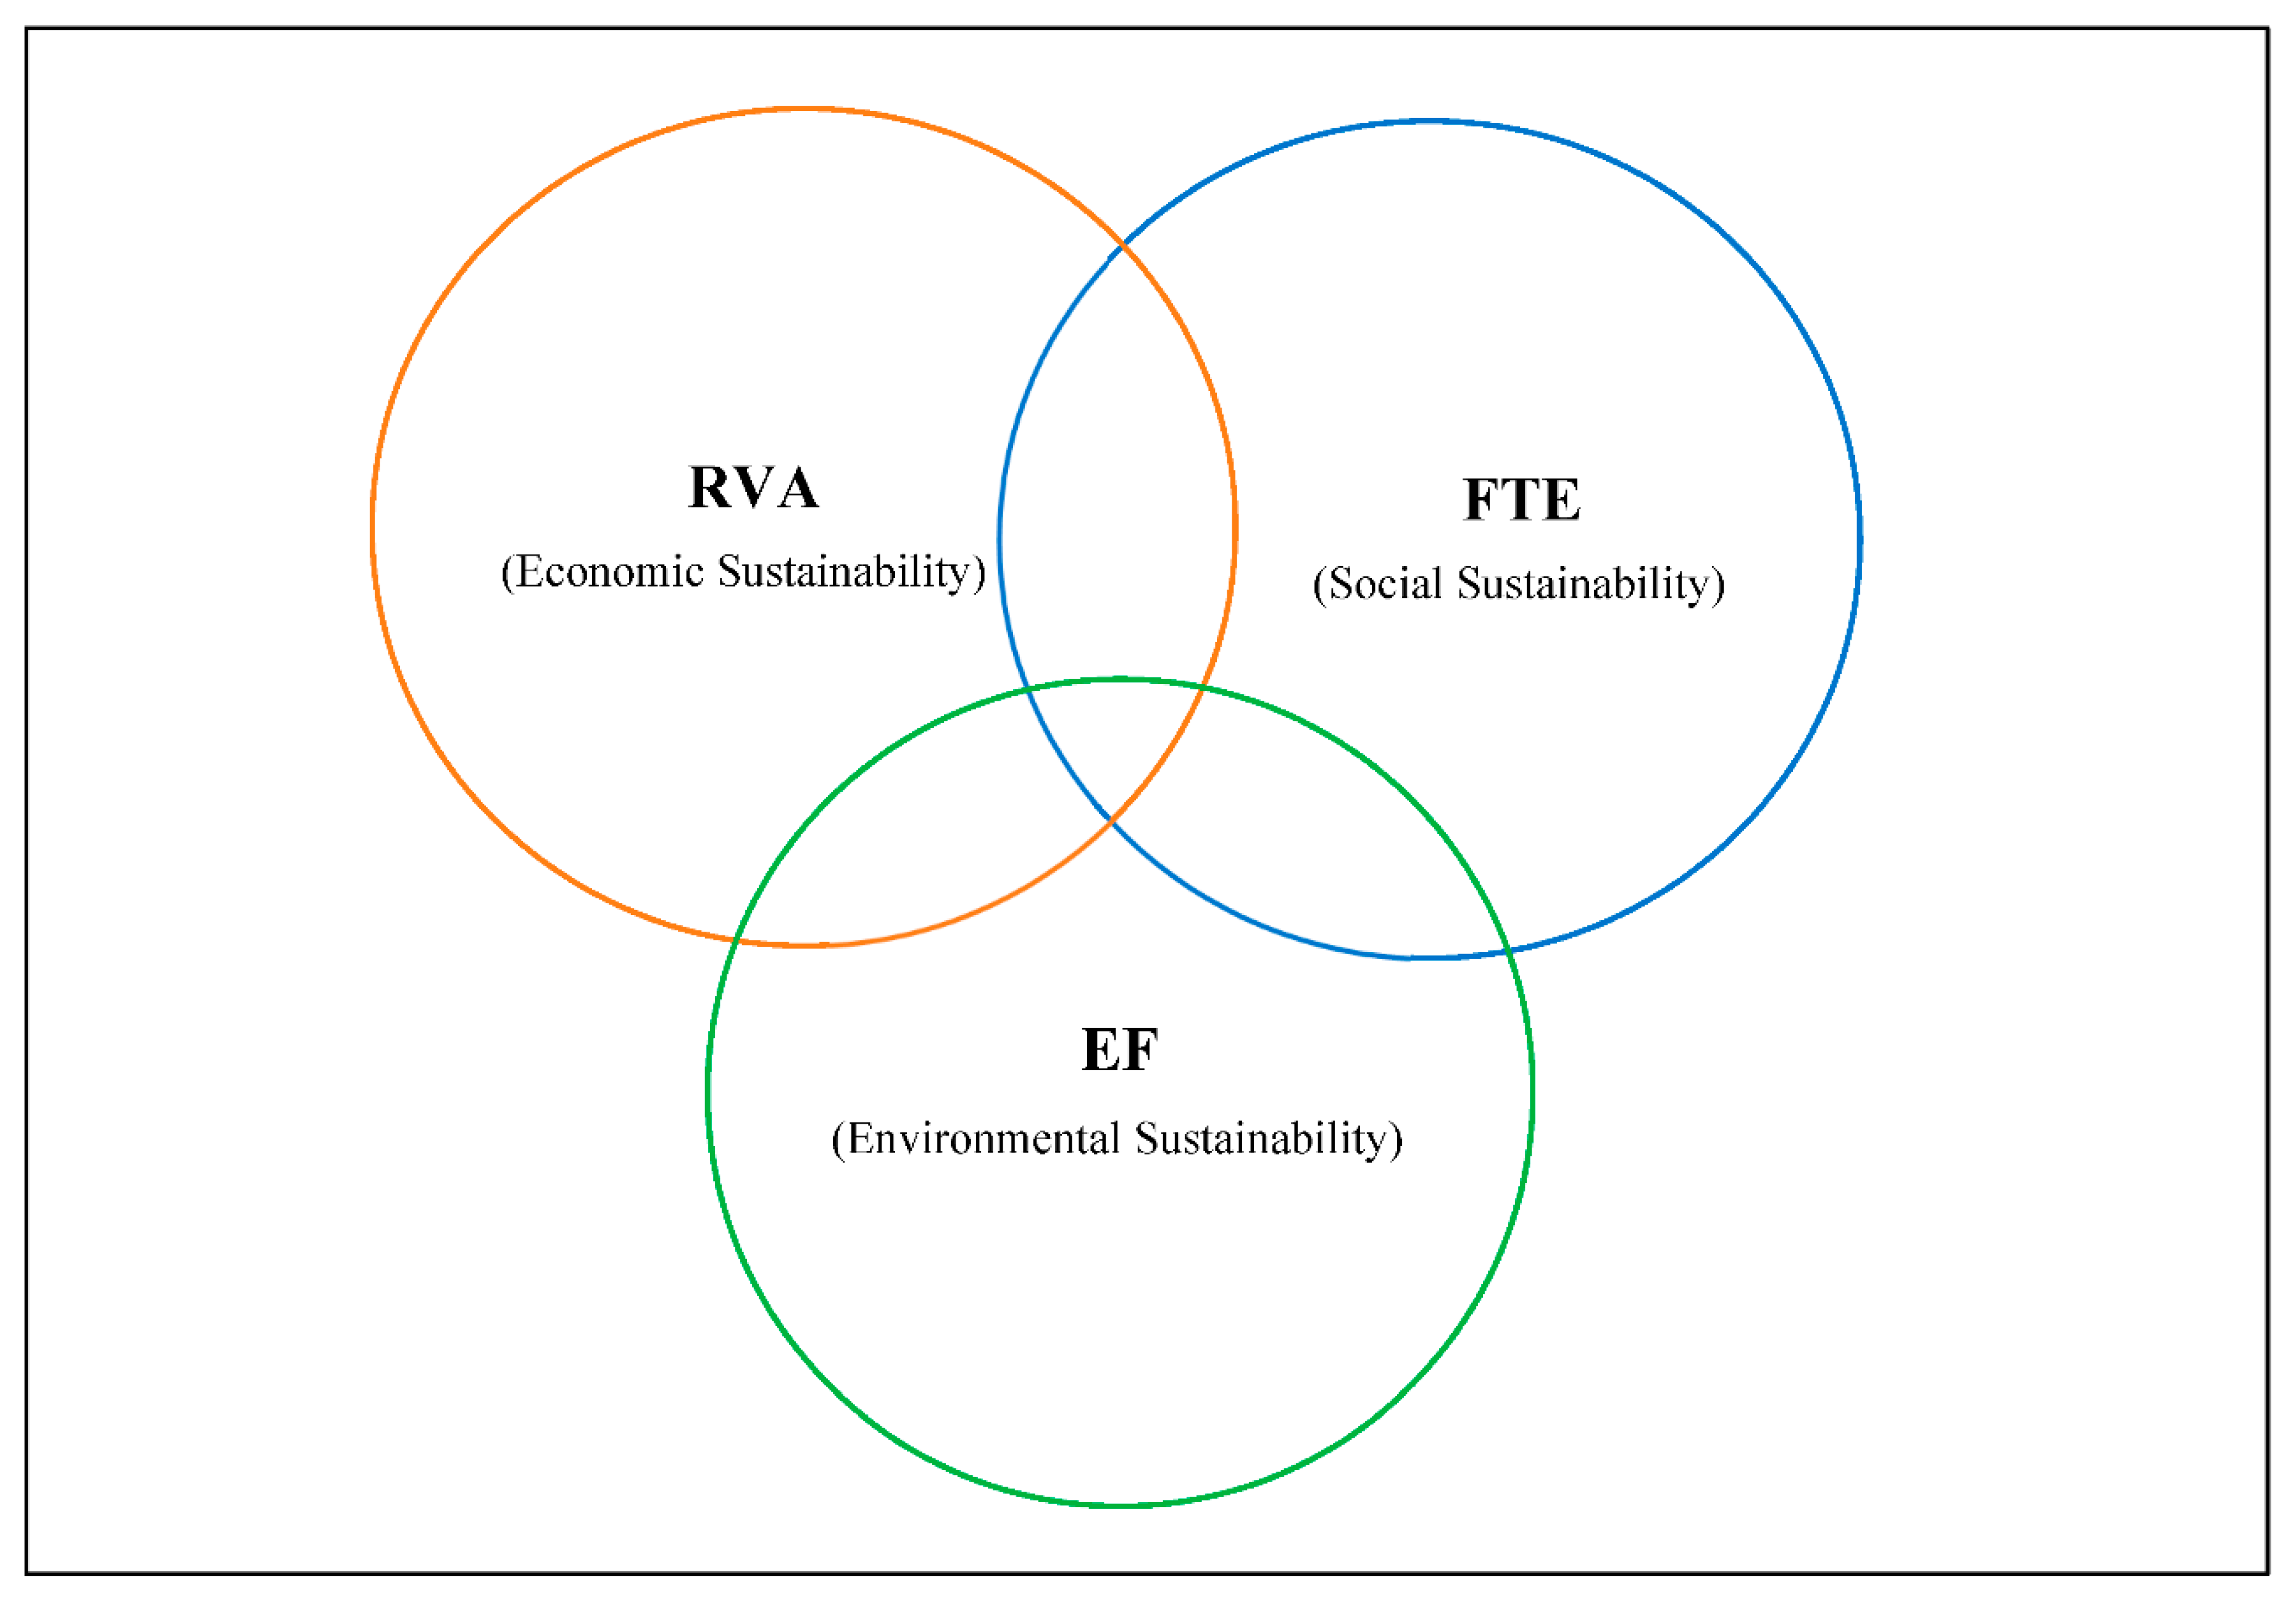
2.3. Ecological Sustainability Index (ESI)
3. Plant Description
4. Results and Discussions
4.1. Ecological Footprint of Ready-Mixed Concrete (EFRMC)
4.1.1. EF of Raw Material Use (EFm)
4.1.2. EF of Energy Consumption (EFe)
4.1.3. Labor (EFl)
4.1.4. Transportation (EFt)
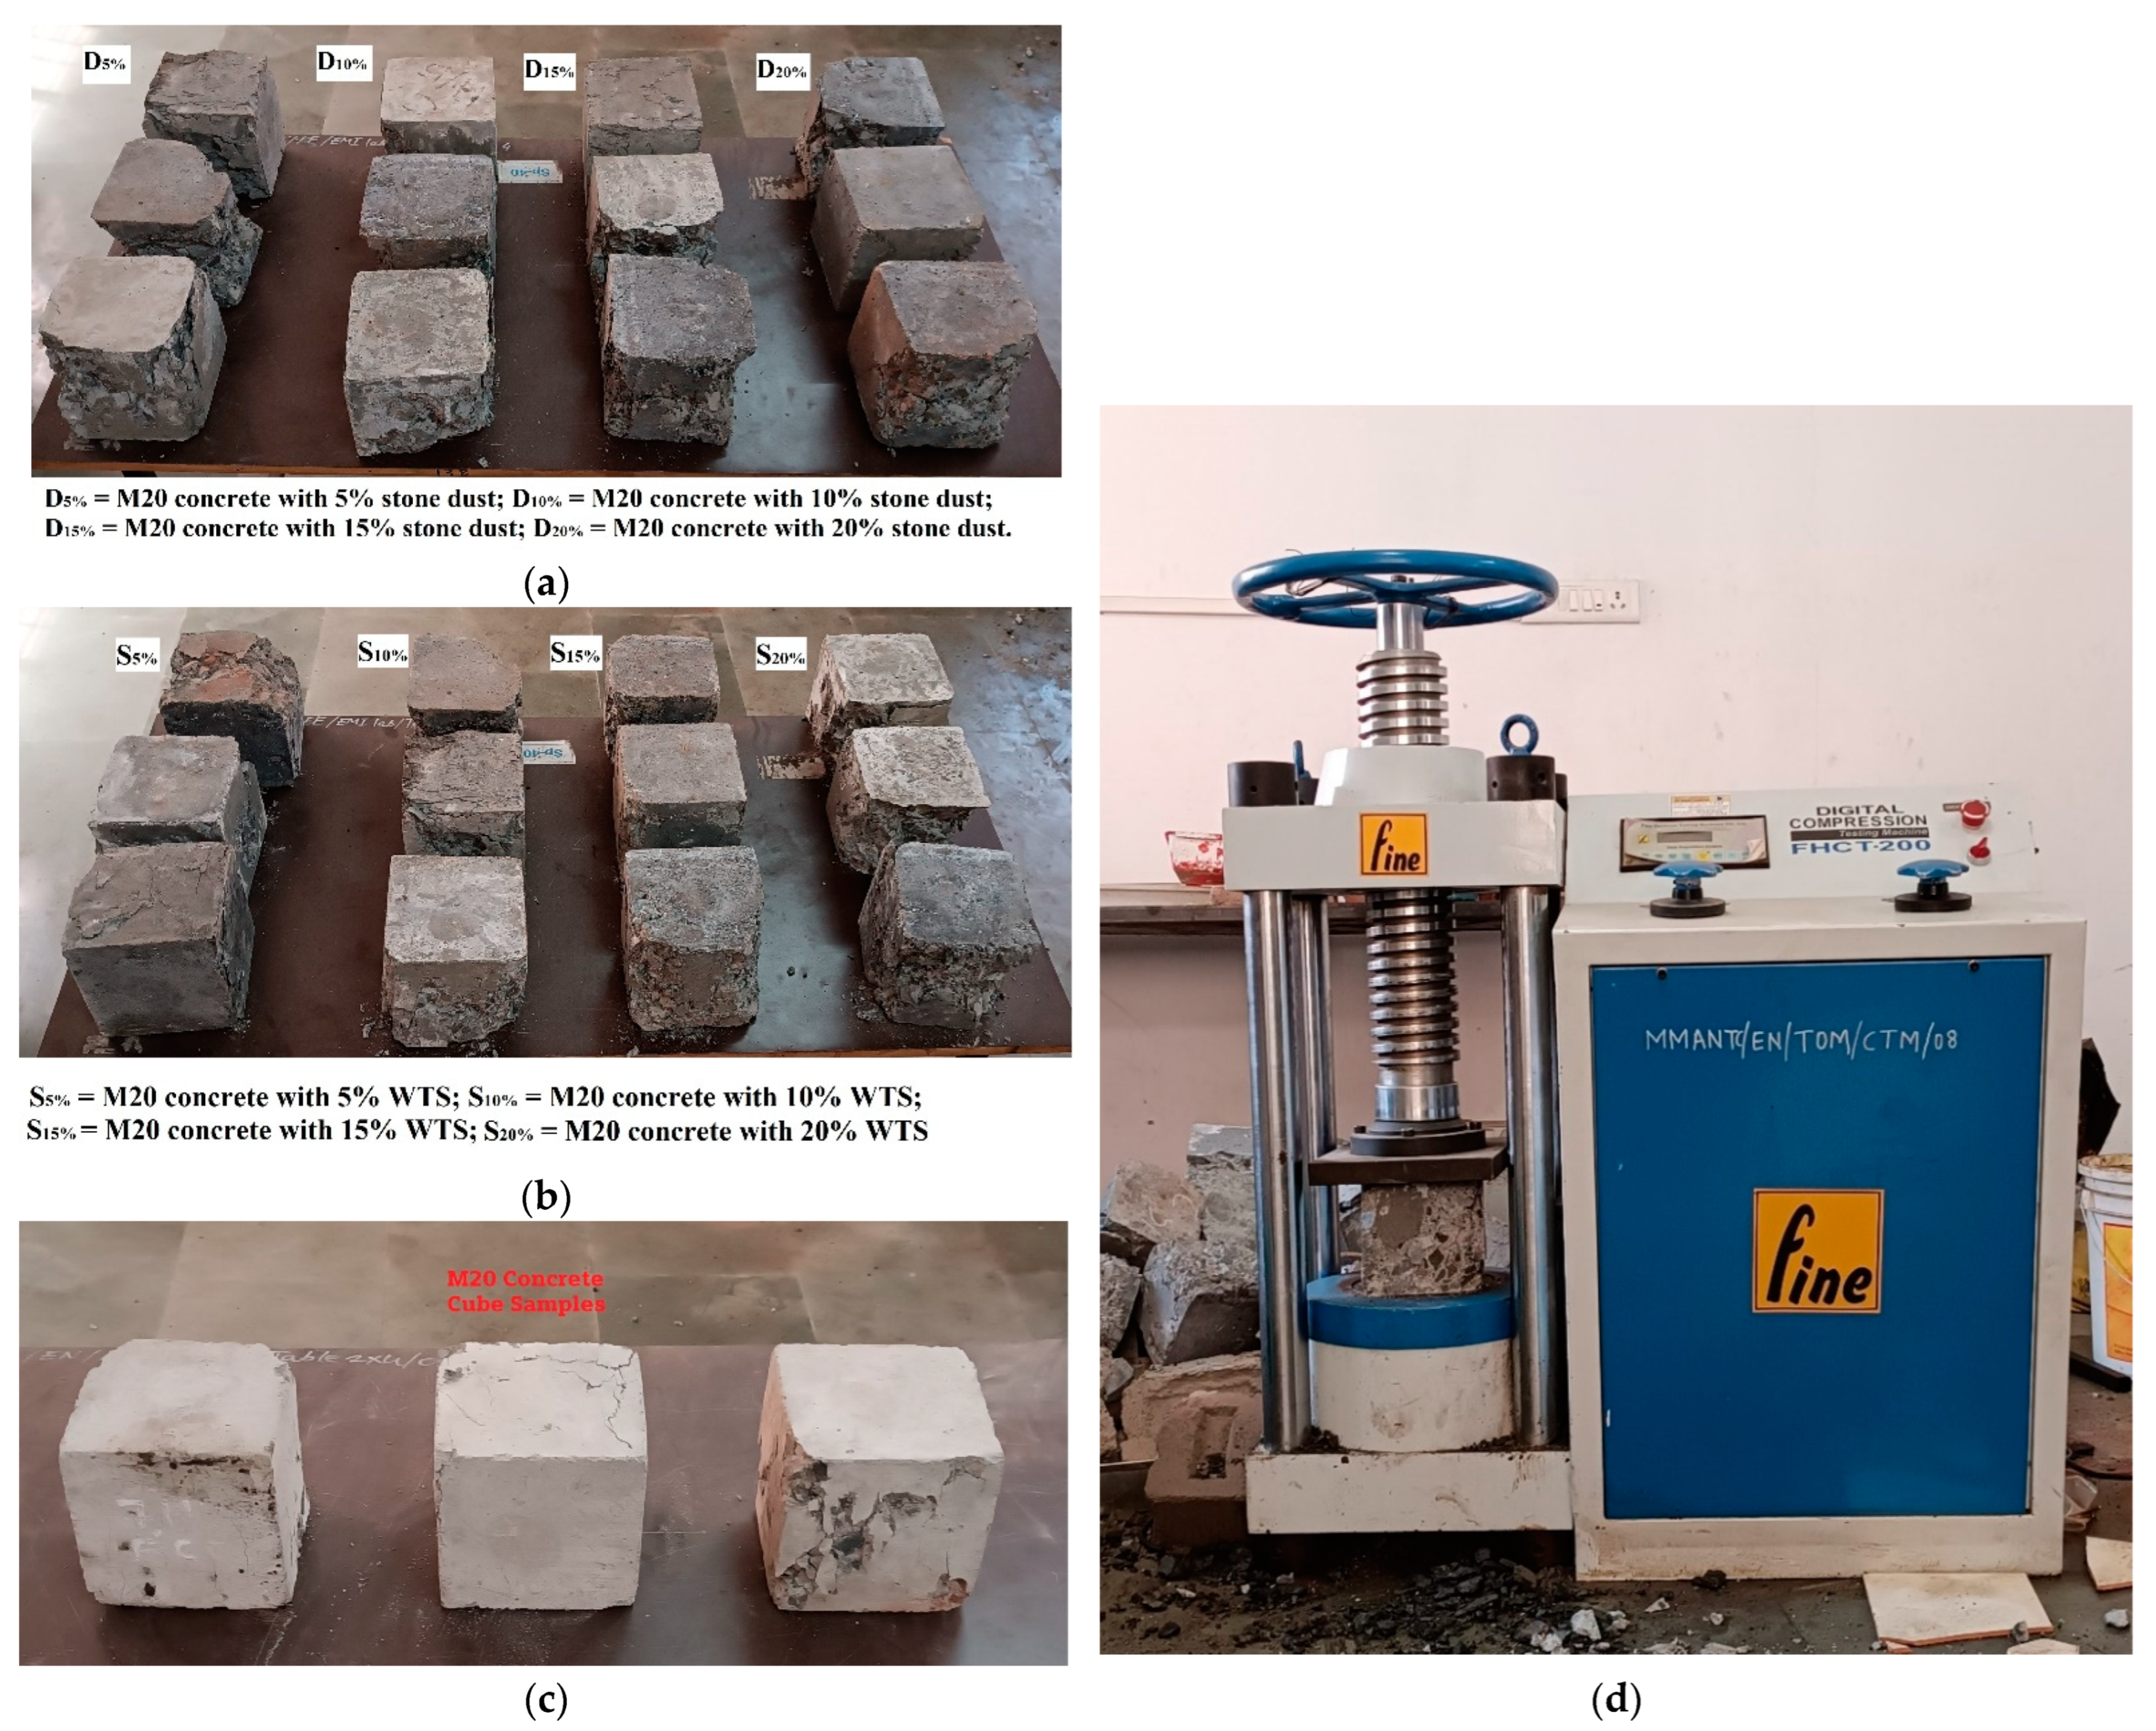
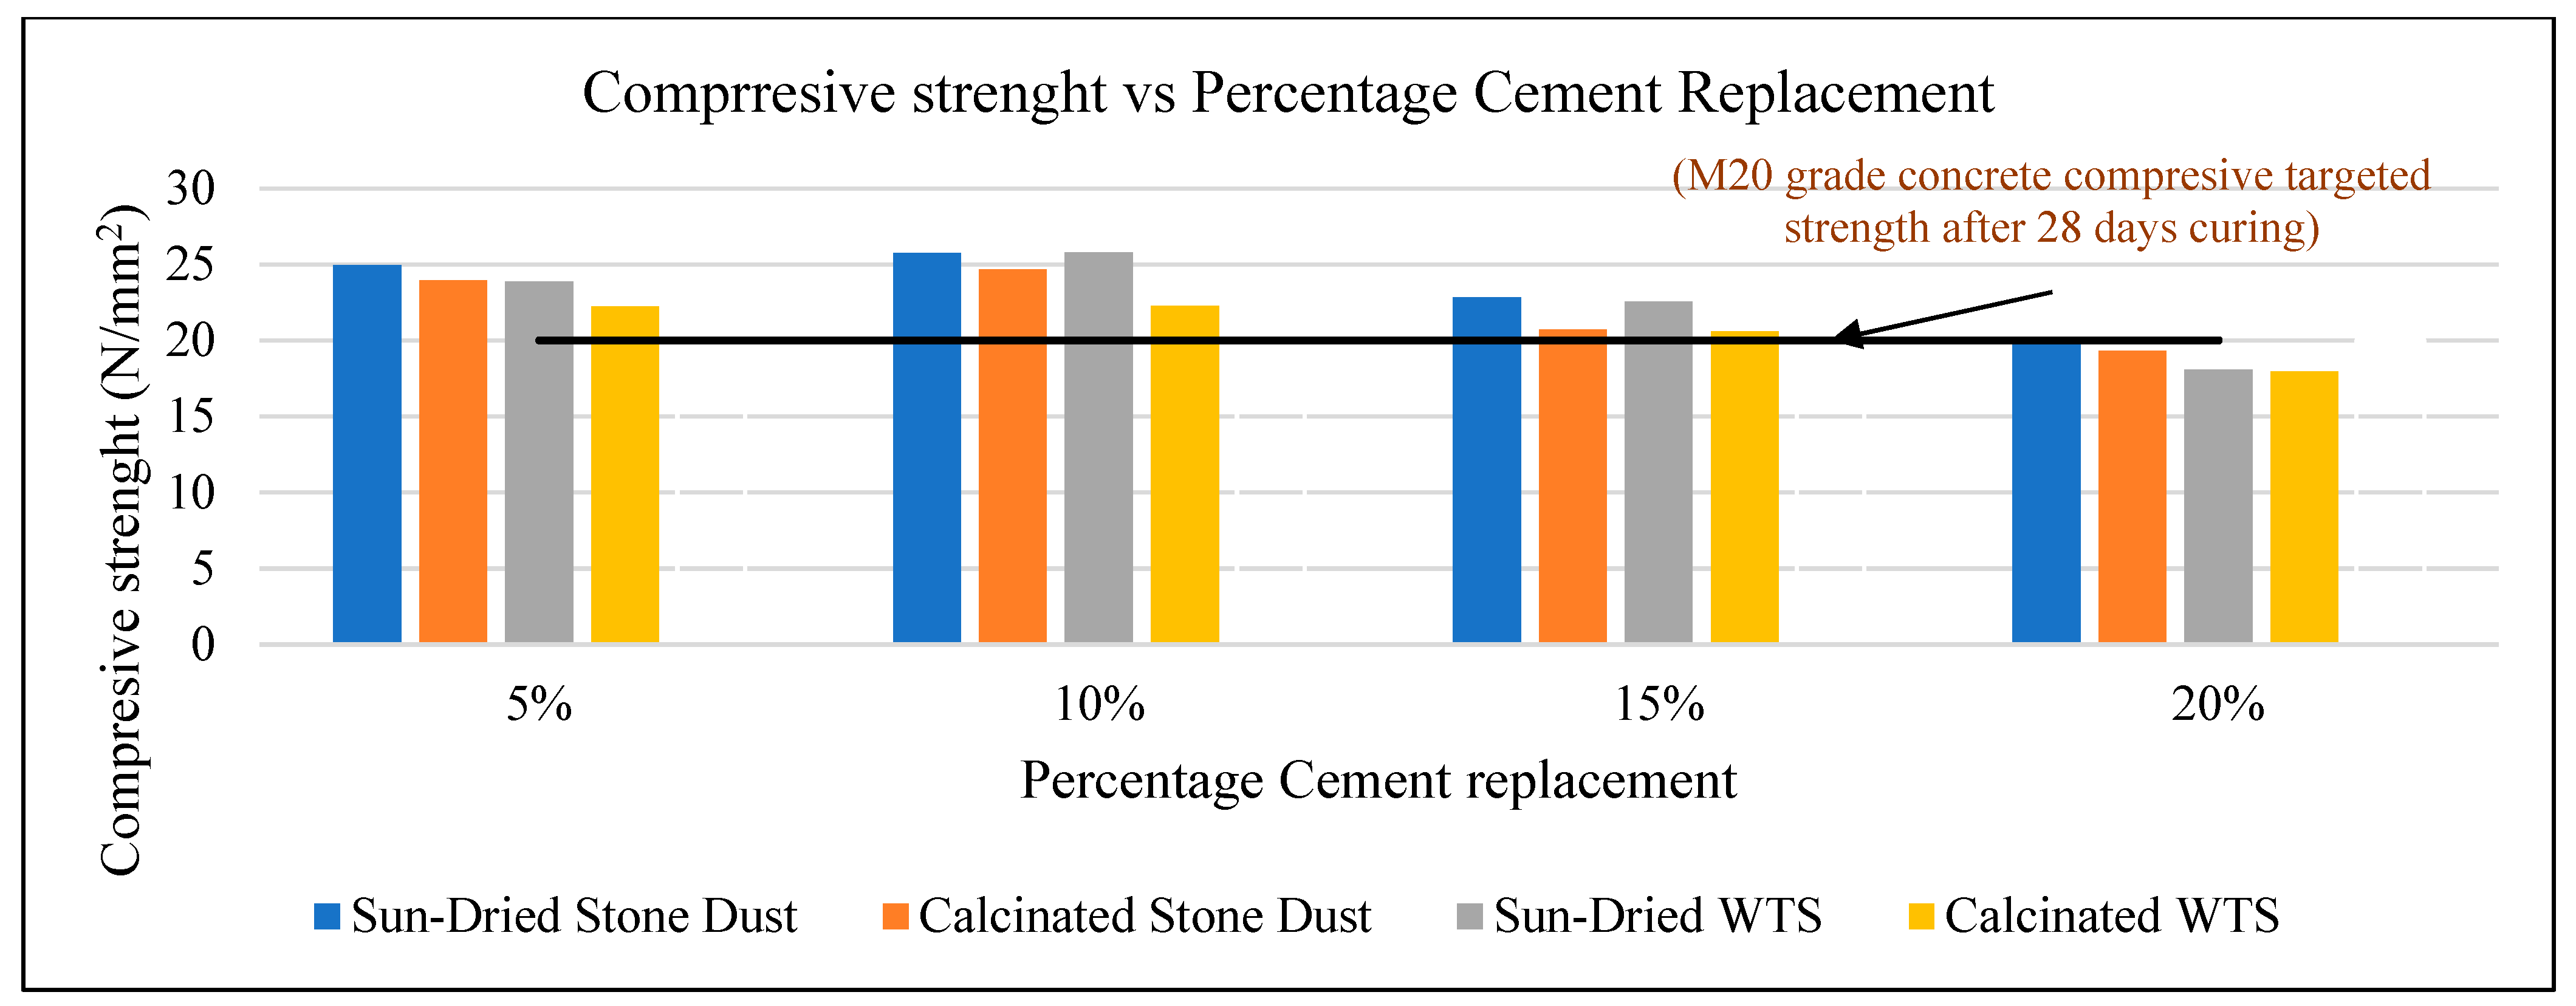
4.2. Performance and Economic Assessment
4.3. Ecological Sustainability Index (ESI) of the Ready-Mixed Plant
5. Conclusions
- The EF of conventional RMC was estimated as 0.0295 gha/m3. Its compressive strength was 23.93 N/mm2, and the production cost was 72.78 $/m3.
- The EF of RMC for 15% cement replacement with sun-dried stone dust was 0.0256 gha/m3 (i.e., 13.14% less than the conventional ready-mix concrete). Its compressive strength was 22.82 N/mm2, and the production cost was 68.60 $/m3.
- The EF of RMC for 10% cement replacement with calcinated stone dust was 0.0294 gha/m3 (i.e., 0.27% less than the conventional RMC). Its compressive strength was 24.65 N/mm2, and the production cost was 70.57 $/m3.
- The EF of RMC for 15% cement replacement with sun-dried WTS was 0.0255 gha/m3 (i.e., 8.81% less than the total EF of conventional RMC). Its compressive strength was 30.78 N/mm2, and the production cost was 69.4 $/m3.
- The EF of RMC for the 10% cement replacement with calcinated WTS was 0.0287 gha/m3 (i.e., 4.26% less than the total EF of conventional RMC). Its compressive strength was 22.58 N/mm2, and the production cost was 70.2 $/m3.
Author Contributions
Funding
Institutional Review Board Statement
Informed Consent Statement
Data Availability Statement
Conflicts of Interest
Abbreviations
| CHDV | Capacity of heavy-duty vehicle |
| αe | Direct energy source’s emission factor |
| Ce | Direct energy used by machinery |
| Af | Absorption factor |
| Aoc | Annual oceanic emission |
| Ci | Material consumption |
| Cmi | Natural materials consumed in concrete |
| EFe | Ecological Footprint of energy consumption in the concrete plant. |
| EFf | Annual Ecological Footprint of food consumption |
| EFl | Ecological Footprint of labor in concrete production |
| EFl | Ecological Footprint of labor |
| EFm | Ecological Footprint of raw materials use in concrete |
| EFme | Energy consumption |
| EFRMC | Ecological footprint of ready-mixed concrete |
| EFt | Ecological Footprint for transportation of raw materials from their source |
| Ei | Bio-productive lands and the equivalency factor |
| Emi | Embodied emission of the material |
| ESI | Ecological sustainability index |
| gha | Global hector |
| GHG | Greenhouse gas |
| LCA | Life cycle assessment |
| Mr | Metabolic rate of human activities |
| OPC | Ordinary Portland cement |
| PM | Particulate matter |
| RAC | Recycled aggregate concrete |
| Ri | Waste creation |
| rue | County’s unemployment rate |
| THDV | Average fuel efficiency of HDV |
| Tmi | Transportation distance |
| WTS | Water treatment sludge |
| Xmi | Materials consumption |
| Ymi | Production yield factor |
| αfuel | Emission factor of fossil fuel |
References
- York, I.N.; Europe, I. Concrete needs to lose its colossal carbon footprint. Int. J. Sci. Nat. 2021, 597, 593–594. [Google Scholar]
- Miller, S.A.; Horvath, A.; Monteiro, P.J. Readily implementable techniques can cut annual CO2 emissions from the production of concrete by over 20%. Environ. Res. Lett. 2016, 11, 074029. [Google Scholar] [CrossRef]
- Habert, G.; Miller, S.A.; John, V.M.; Provis, J.L.; Favier, A.; Horvath, A.; Scrivener, K.L. Environmental impacts and decarbonization strategies in the cement and concrete industries. Nat. Rev. Earth Environ. 2020, 1, 559–573. [Google Scholar] [CrossRef]
- Monteiro, P.J.M.; Miller, S.; Horvath, A. Towards sustainable concrete. Nat. Mater. 2017, 16, 698–699. [Google Scholar] [CrossRef] [PubMed]
- Ansari, Y.; Husain, D.; Haadi, S.M.; Haloi, J.; Prakash, R. Life cycle ecological footprint of building: A case study of low-rise tropical residential building. Int. J. Environ. Sci. Technol. 2022, 1–16. [Google Scholar] [CrossRef]
- Jiang, T.; Cui, K.; Chang, J. Development of low-carbon cement: Carbonation of compounded C2S by β-C2S and γ-C2S. Cem. Concr. Compos. 2023, 139, 105071. [Google Scholar] [CrossRef]
- Vieira, D.R.; Calmon, J.L.; Coelho, F.Z. Life cycle assessment (LCA) applied to the manufacturing of common and ecological concrete: A review. Constr. Build. Mater. 2016, 124, 656–666. [Google Scholar] [CrossRef]
- Cui, K.; Chang, J. Hydration, reinforcing mechanism, and macro performance of multi-layer graphene-modified cement composites. J. Build. Eng. 2022, 57, 104880. [Google Scholar] [CrossRef]
- International Energy Agency (IEA). Tecnnology Roadmap: Low-Carbon Transistion in Cement Industry. France. 2018. Available online: https://www.wbcsd.org/contentwbc/download/4586/61682/1 (accessed on 20 December 2022).
- Environment, U.N.; Scrivener, K.L.; John, V.M.; Gartner, E.M. Eco-efficient cements: Potential economically viable solutions for a low-CO2 cement-based materials industry. Cem. Concr. Res. 2018, 114, 2–26. [Google Scholar]
- Schiller, G.; Gruhler, K.; Ortlepp, R. Continuous Material Flow Analysis Approach for Bulk Nonmetallic Mineral Building Materials Applied to the German Building Sector. J. Ind. Ecol. 2017, 21, 673–688. [Google Scholar] [CrossRef]
- Cui, K.; Liang, K.; Chang, J.; Lau, D. Investigation of the macro performance, mechanism, and durability of multiscale steel fiber reinforced low-carbon ecological UHPC. Constr. Build. Mater. 2022, 327, 126921. [Google Scholar] [CrossRef]
- Dobiszewska, M.; Bagcal, O.; Beycioğlu, A.; Goulias, D.; Köksal, F.; Płomiński, B.; Ürünveren, H. Utilization of rock dust as cement replacement in cement composites: An alternative approach to sustainable mortar and concrete productions. J. Build. Eng. 2023, 69, 106180. [Google Scholar] [CrossRef]
- Karalar, M.; Özkılıç, Y.O.; Aksoylu, C.; Sabri, M.M.S.; Beskopylny, A.N.; Stel’makh, S.A.; Shcherban, E.M. Flexural behavior of reinforced concrete beams using waste marble powder towards application of sustainable concrete. Front. Mater. 2022. [Google Scholar] [CrossRef]
- Zeybek, Ö.; Özkılıç, Y.O.; Karalar, M.; Çelik, A.İ.; Qaidi, S.; Ahmad, J.; Burduhos-Nergis, D.D.; Burduhos-Nergis, D.P. Influence of replacing cement with waste glass on mechanical properties of concrete. Materials 2022, 15, 7513. [Google Scholar] [CrossRef]
- Ahmad, T.; Ahmad, K.; Alam, M. Sustainable management of water treatment sludge through 3‘R’ concept. J. Clean. Prod. 2016, 124, 1–13. [Google Scholar] [CrossRef]
- Owaid, H.M.; Hamid, R.; Taha, M. Influence of thermally activated alum sludge ash on the engineering properties of multiple-blended binders concretes. Constr. Build. Mater. 2014, 61, 216–229. [Google Scholar] [CrossRef]
- Zhao, Y.; Nzihou, A.; Ren, B.; Lyczko, N.; Shen, C.; Kang, C.; Ji, B. Waterworks sludge: An underrated material for beneficial reuse in water and environmental engineering. Waste Biomass Valorization 2020, 12, 4239–4251. [Google Scholar] [CrossRef]
- Wackernagel, M.; Rees, W. Our Ecological Footprint: Reducing Human Impact on the Earth; New Society: Gabriola Island, BC, Canada, 1996. [Google Scholar]
- Akhtar, N.; Ahmad, T.; Husain, D.; Majdi, A.; Alam, T.; Husain, N.; Wayal, A.K.S. Ecological footprint and economic assessment of conventional and geopolymer concrete for sustainable construction. J. Clean. Prod. 2022, 380, 134910. [Google Scholar] [CrossRef]
- Husain, D.; Prakash, R. Ecological footprint reduction of built envelope in India. J. Build. Eng. 2019, 21, 278–286. [Google Scholar] [CrossRef]
- Mancini, M.S.; Galli, A.; Niccolucci, V.; Lin, D.; Bastianoni, S.; Wackernagel, M.; Marchettini, N. Ecological Footprint: Refining the carbon Footprint calculation. Ecol. Indic. 2016, 61, 390–403. [Google Scholar] [CrossRef]
- Scripps Institution of Oceanography (SIO). The Keeling Curve. 2017. Available online: https://scripps.ucsd.edu/programs/keelingcurve/2013/07/03/how-much-co2-can-the-oceans-take-up/ (accessed on 1 November 2022).
- Global Footprint Network (GFN, 2016) Working Guidebook to the National Footprint Accounts. Available online: https://www.footprintnetwork.org/content/documents/National_Footprint_Accounts_2016_Guidebook.pdf (accessed on 10 November 2022).
- NTP 1011. Determinación del Metabolismo Energético Mediantetablas/Determination of Energetic Metabolism through Tables. 2014. Available online: https://www.insst.es/documents/94886/327975/ntp-1011.pdf/88e68db1-426e-4d88-85ff-6ec77f1f9204 (accessed on 16 November 2022).
- FAOSTAT. Available online: https://www.fao.org/faostat/en/#home (accessed on 17 December 2022).
- Panesar, D.K.; Zhang, R. Performance comparison of cement replacing materials in concrete: Limestone fillers and supplementary cementing materials—A review. Constr. Build. Mater. 2020, 251, 118866. [Google Scholar] [CrossRef]
- European Environment Agency (EEA). EMEP/EEA air Pollutant Emission Inventory Guidebook—2013. 2013. Available online: http://www.eea.europa.eu/publications/emep-eea-guidebook-2013 (accessed on 6 November 2022).
- IS 460 (Part). Bureau of Indian Standard Specification for Test Sieves. BIS, New Delhi, India. 1985. Available online: https://www.cracindia.in/admin/uploads/IS--460---1.pdf (accessed on 15 November 2022).
- Ministry of Power Central Electricity Authority (MPCEA), Government of India. CO2 Baseline Database for the Indian Power Sector, User Guide, 2018. 2018. Available online: https://cea.nic.in/wp-content/uploads/baseline/2020/07/user_guide_ver14.pdf (accessed on 19 November 2022).
- Ruviaro, A.S.; Silvestro, L.; Scolaro, T.P.; de Matos, P.R.; Pelisser, F. Use of calcined water treatment plant sludge for sustainable cementitious composites production. J. Clean. Prod. 2021, 327, 129484. [Google Scholar] [CrossRef]
- El-Didamony, H.; Khalil, K.; Heikal, M. Physico-chemical and surface characteristics of some granulated slag–fired drinking water sludge composite cement pastes. HBRC J. 2014, 10, 73–81. [Google Scholar] [CrossRef]
- Chen, H.; Ma, X.; Dai, H. Reuse of water purification sludge as raw material in cement production. Cem. Concr. Compos. 2010, 32, 436–439. [Google Scholar] [CrossRef]
- The World Bank. Unemployment, Total (% of Total Labor Force) (Modeled ILO Estimate). 2022. Available online: https://data.worldbank.org/indicator/SL.UEM.TOTL.ZS (accessed on 15 November 2022).


| Bio Productive Land | Equivalence Factor ei (gha/ha) |
|---|---|
| CO2 absorption land (eCO2 land) | 1.28 |
| Forest land (eforest land) | 1.28 |
| Crop land (ecropland) | 2.52 |
| Pasture land (epasture land) | 0.43 |
| Sea productive/marine land (emarine land) | 0.35 |
| Activity | Metabolic Rate (kcal/h) [25] | Avg. Ecological Footprint (gha/h) |
|---|---|---|
| High metabolic rate | 312.2–403.8 | 2.09 × 10⁻⁴ |
| Moderate metabolic rate | 203.4–310.6 | 1.50 × 10⁻⁴ |
| Low metabolic rate | 110.3–201.9 | 0.91 × 10⁻⁴ |
| Machinery driver | 132.0–170.8 | 0.88 × 10⁻⁴ |
| Crane operator | 100.9–225.2 | 0.95 × 10⁻⁴ |
| Mason | 170.8–248.5 | 1.22 × 10⁻⁴ |
| S. No | Materials | Unit | Quantity | ||||
|---|---|---|---|---|---|---|---|
| M20 | 5% Cement Replacement | 10% Cement Replacement | 15% Cement Replacement | 20% Cement Replacement | |||
| 1 | Cement | kg | 340 | 323 | 306 | 289 | 272 |
| 2 | Stone Dust | kg | - | 22.6 | 45.2 | 67.86 | 90.48 |
| 3 | Water treatment sludge | kg | - | 15.1 | 30.22 | 45.33 | 60.44 |
| 4 | Sand | kg | 941.16 | 941.16 | 941.16 | 941.16 | 941.16 |
| 5 | Aggregate 10 mm size | kg | 487.30 | 487.30 | 487.30 | 487.30 | 487.30 |
| 6 | Aggregate 20 mm size | kg | 493.61 | 493.61 | 493.61 | 493.61 | 493.61 |
| 7 | Water for mixing and workability | kg | 197 | 197 | 197 | 197 | 197 |
| 8 | Labor | days | 0.019 | 0.019 | 0.019 | 0.019 | 0.019 |
| 9 | Electricity consumption | kWh | 1.52 | 1.52 | 1.52 | 1.52 | 1.52 |
| S. No. | Description | Details |
|---|---|---|
| 1 | Manufacturer | KYB Conmat |
| 2 | Capacity | 60 m3/h |
| 3 | Nos. of in Line Bins | 4 |
| 4 | Charging Conveyor | Chevron Belt Conveyor |
| 5 | Cement storage capacity | 300 t |
| 6 | Water Weighing System | Yes |
| 7 | Admixture Weighing System | Available |
| 8 | Mixer | Twin Shaft |
| 9 | Maximum Size of Aggregate | 80 mm |
| 10 | Water Sprinkling & Gravity Discharge System | Yes |
| 11 | Air Compressor | Yes |
| 12 | Screw Conveyor for Cement | Yes |
| 13 | Control System | Automatic |
| 14 | Discharge Height | 4.1 m |
| 15 | Energy Consumption (for 60 m3 concrete production) | 91 kWh (Grid electricity) or 12 L diesel/h (Diesel generator) |
| 16 | Manpower | 9 labor/day |
| 17 | Physical land | 8 hectares |
| 18 | Transportation of raw materials (from source to plant) | |
| 80–120 km 10–20 km 10–20 km 10–20 km 5–10 km | |
| S. No. | Description | Ecological Footprint (gha) | |||||
|---|---|---|---|---|---|---|---|
| Unit EF (gha) | M20 | 5% Cement Replacement | 10% Cement Replacement | 15% Cement Replacement | 20% Cement Replacement | ||
| 1 | Cement | 7.02 × 10⁻⁵ [5] | 0.024 | 0.023 | 0.022 | 0.020 | 0.019 |
| 2 | Stone Dust | 0 | 0 | 0 | 0 | 0 | 0 |
| 3 | Sand | 1.57 × 10⁻⁷ [5] | 1.48 × 10⁻⁴ | 1.48 × 10⁻⁴ | 1.48 × 10⁻⁴ | 1.48 × 10⁻⁴ | 1.48 × 10⁻⁴ |
| 4 | Aggregate 10 mm size | 7.76 × 10⁻⁸ [5] | 3.78 × 10⁻⁵ | 3.78 × 10⁻⁵ | 3.78 × 10⁻⁵ | 3.78 × 10⁻⁵ | 3.78 × 10⁻⁵ |
| 5 | Aggregate 20 mm size | 7.76 × 10⁻⁸ [5] | 3.83 × 10⁻⁵ | 3.83 × 10⁻⁵ | 3.83 × 10⁻⁵ | 3.83 × 10⁻⁵ | 3.83 × 10⁻⁵ |
| 6 | Water for mixing and workability | 2.72 × 10⁻⁷ [20] | 5.36 × 10⁻⁵ | 5.36 × 10⁻⁵ | 5.36 × 10⁻⁵ | 5.36 × 10⁻⁵ | 5.36 × 10⁻⁵ |
| 7 | Labor | 9.6 × 10⁻⁶ | 9.6 × 10⁻⁶ | 9.6 × 10⁻⁶ | 9.6 × 10⁻⁶ | 9.6 × 10⁻⁶ | |
| 8 | Electricity required to produce one m3 concrete (i.e., 1.52 kWh/m3) | 4.53 × 10⁻⁶ | 1.48 × 10⁻⁴ | 1.48 × 10⁻⁴ | 1.48 × 10⁻⁴ | 1.48 × 10⁻⁴ | 1.48 × 10⁻⁴ |
| 9 | Transportation | ||||||
| 7.21 × 10⁻⁶ | 2.45 × 10⁻³ | 2.23 × 10⁻³ | 2.20 × 10⁻³ | 2.08 × 10⁻³ | 1.96 × 10⁻³ | |
| 1.08 × 10⁻⁶ | 1.02 × 10⁻³ | 1.02 × 10⁻³ | 1.02 × 10⁻³ | 1.02 × 10⁻³ | 1.02 × 10⁻³ | |
| 1.08 × 10⁻⁶ | 3.78 × 10⁻⁵ | 3.78 × 10⁻⁵ | 3.78 × 10⁻⁵ | 3.78 × 10⁻⁵ | 3.78 × 10⁻⁵ | |
| 1.08 × 10⁻⁶ | 3.83 × 10⁻⁵ | 3.83 × 10⁻⁵ | 3.83 × 10⁻⁵ | 3.83 × 10⁻⁵ | 3.83 × 10⁻⁵ | |
| 1.08 × 10⁻⁶ | 0.000 | 2.33 × 10⁻⁵ | 4.65 × 10⁻⁵ | 6.97 × 10⁻⁵ | 9.31 × 10⁻⁵ | |
| Total EF of ready-mixed concrete using sun-dried stone dust | 0.0295 | 0.0282 | 0.0269 | 0.0256 | 0.0243 | ||
| EF for Calcination of Stone Dust | 0 | 1.27 × 10⁻³ | 2.5 × 10⁻³ | 3.75 × 10⁻³ | 5.53 × 10⁻³ | ||
| Total EF of concrete | 0.0295 | 0.0295 | 0.0294 | 0.0293 | 0.0298 | ||
| S. No. | Description | Ecological Footprint (gha) | |||||
|---|---|---|---|---|---|---|---|
| Unit EF (gha) | M20 | 5% Cement Replacement | 10% Cement Replacement | 15% Cement Replacement | 20% Cement Replacement | ||
| 1 | Cement | 7.02 × 10⁻⁵ | 0.024 | 0.023 | 0.022 | 0.020 | 0.019 |
| 2 | Stone Dust | 0 | 0 | 0 | 0 | 0 | 0 |
| 3 | Sand | 1.57 × 10⁻⁷ | 1.48 × 10⁻⁴ | 1.48 × 10⁻⁴ | 1.48 × 10⁻⁴ | 1.48 × 10⁻⁴ | 1.48 × 10⁻⁴ |
| 4 | Aggregate 10 mm size | 7.76 × 10⁻⁸ | 3.78 × 10⁻⁵ | 3.78 × 10⁻⁵ | 3.78 × 10⁻⁵ | 3.78 × 10⁻⁵ | 3.78 × 10⁻⁵ |
| 5 | Aggregate 20 mm size | 7.76 × 10⁻⁸ | 3.83 × 10⁻⁵ | 3.83 × 10⁻⁵ | 3.83 × 10⁻⁵ | 3.83 × 10⁻⁵ | 3.83 × 10⁻⁵ |
| 6 | Water for mixing and workability | 2.72 × 10⁻⁷ | 5.36 × 10⁻⁵ | 5.36 × 10⁻⁵ | 5.36 × 10⁻⁵ | 5.36 × 10⁻⁵ | 5.36 × 10⁻⁵ |
| 7 | Labor | - | 9.6 × 10⁻⁶ | 9.6 × 10⁻⁶ | 9.6 × 10⁻⁶ | 9.6 × 10⁻⁶ | 9.6 × 10⁻⁶ |
| 8 | Electricity required to produce one m3 concrete (i.e., 1.52 kWh/m3) | 4.53 × 10⁻⁶ | 1.48 × 10⁻⁴ | 1.48 × 10⁻⁴ | 1.48 × 10⁻⁴ | 1.48 × 10⁻⁴ | 1.48 × 10⁻⁴ |
| 9 | Transportation | ||||||
| 7.21 × 10⁻⁶ | 2.45 × 10⁻³ | 2.23 × 10⁻³ | 2.20 × 10⁻³ | 2.08 × 10⁻³ | 1.96 × 10⁻³ | |
| 1.08 × 10⁻⁶ | 1.02 × 10⁻³ | 1.02 × 10⁻³ | 1.02 × 10⁻³ | 1.02 × 10⁻³ | 1.02 × 10⁻³ | |
| 1.08 × 10⁻⁶ | 3.78 × 10⁻⁵ | 3.78 × 10⁻⁵ | 3.78 × 10⁻⁵ | 3.78 × 10⁻⁵ | 3.78 × 10⁻⁵ | |
| 1.08 × 10⁻⁶ | 3.83 × 10⁻⁵ | 3.83 × 10⁻⁵ | 3.83 × 10⁻⁵ | 3.83 × 10⁻⁵ | 3.83 × 10⁻⁵ | |
| 1.08 × 10⁻⁶ | 0 | 1.63 × 10⁻⁵ | 3.27 × 10⁻⁵ | 4.90 × 10⁻⁵ | 6.54 × 10⁻⁵ | |
| Total EF of Concrete using sun-dried WTS | 0.0295 | 0.0282 | 0.0269 | 0.0255 | 0.0243 | ||
| EF for Calcination of WTS | 0 | 8.79 × 10⁻⁵ | 1.76 × 10⁻³ | 2.64 × 10⁻³ | 3.52 × 10⁻³ | ||
| TOTAL EF of concrete using calcinated WTS | 0.0295 | 0.0290 | 0.0286 | 0.0282 | 0.0278 | ||
| S. No. | Description | Cost (USD) | |||||
|---|---|---|---|---|---|---|---|
| Unit Cost (USD) | M20 | 5% Cement Replacement | 10% Cement Replacement | 15% Cement Replacement | 20% Cement Replacement | ||
| 1 | Cement | 0.085/kg | 28.9 | 27.45 | 26.01 | 24.56 | 23.12 |
| 2 | Stone Dust | 3.02/ton | 0 | 0.068 | 0.136 | 0.205 | 0.273 |
| 3 | Sand | 0.0088/kg | 8.28 | 8.28 | 8.28 | 8.28 | 8.28 |
| 4 | Aggregate 10 mm size | 0.014/kg | 6.82 | 6.82 | 6.82 | 6.82 | 6.82 |
| 5 | Aggregate 20 mm size | 0.014/kg | 6.91 | 6.91 | 6.91 | 6.91 | 6.91 |
| 6 | Water for mixing and workability | 0.088/m3 | 17.33 | 17.33 | 17.33 | 17.33 | 17.33 |
| 7 | Labor | 6.28/day | 0.12 | 0.12 | 0.12 | 0.12 | 0.12 |
| 8 | Electricity required to produce one m3 concrete (i.e., 1.52 kWh/m3) | 0.102/kWh | 0.156 | 0.156 | 0.156 | 0.156 | 0.156 |
| 9 | Transportation | 0.027 $/ton-km | |||||
| 0.92 | 0.87 | 0.82 | 0.78 | 0.73 | ||
| 2.03 | 2.03 | 2.03 | 2.03 | 2.03 | ||
| 0.66 | 0.66 | 0.66 | 0.66 | 0.66 | ||
| 0.66 | 0.66 | 0.66 | 0.66 | 0.66 | ||
| 0.00 | 0.03 | 0.06 | 0.09 | 0.12 | ||
| Total cost of ready-mixed concrete using sun-dried stone dust | 72.78 | 71.316 | 69.856 | 68.60 | 66.936 | ||
| Cost for Calcination of Stone Dust | 0 | 0.29 | 0.58 | 0.87 | 1.16 | ||
| Total cost of concrete using calcinated stone dust | 72.78 | 71.67 | 70.57 | 69.5 | 68.36 | ||
| S. No. | Description | Cost (USD) | |||||
| Unit Cost (USD) | M20 | 5% Cement Replacement | 10% Cement Replacement | 15% Cement Replacement | 20% Cement Replacement | ||
| 1 | Cement | 0.085/kg | 28.9 | 27.45 | 26.01 | 24.56 | 23.12 |
| 2 | WTS | 0 | 0 | 0.068 | 0.136 | 0.205 | 0.273 |
| 3 | Sand (kg) | 0.0088/kg | 8.28 | 8.28 | 8.28 | 8.28 | 8.28 |
| 4 | Aggregate 10 mm size | 0.014/kg | 6.82 | 6.82 | 6.82 | 6.82 | 6.82 |
| 5 | Aggregate 20 mm size | 0.014/kg | 6.91 | 6.91 | 6.91 | 6.91 | 6.91 |
| 6 | Water for mixing and workability | 0.088/m3 | 17.33 | 17.33 | 17.33 | 17.33 | 17.33 |
| 7 | Labor | 6.28/day | 0.12 | 0.12 | 0.12 | 0.12 | 0.12 |
| 8 | Electricity required to produce one m3 concrete (i.e., 1.52 kWh/m3) | 0.102/kWh | 0.156 | 0.156 | 0.156 | 0.156 | 0.156 |
| 9 | Transportation | 0.027 $/ton-km | |||||
| 0.92 | 0.87 | 0.82 | 0.78 | 0.73 | ||
| 2.03 | 2.03 | 2.03 | 2.03 | 2.03 | ||
| 0.66 | 0.66 | 0.66 | 0.66 | 0.66 | ||
| 0.66 | 0.66 | 0.66 | 0.66 | 0.66 | ||
| 0.00 | 0.03 | 0.06 | 0.09 | 0.12 | ||
| Total cost of ready-mixed concrete using sun-dried WTS | 72.786 | 71.316 | 69.856 | 68.396 | 66.936 | ||
| Cost for Calcination of WTS | 0 | 0.203 | 0.407 | 0.61 | 0.812 | ||
| Total cost of concrete using calcinated WTS | 72.78 | 71.50 | 70.24 | 68.97 | 67.70 | ||
Disclaimer/Publisher’s Note: The statements, opinions and data contained in all publications are solely those of the individual author(s) and contributor(s) and not of MDPI and/or the editor(s). MDPI and/or the editor(s) disclaim responsibility for any injury to people or property resulting from any ideas, methods, instructions or products referred to in the content. |
© 2023 by the authors. Licensee MDPI, Basel, Switzerland. This article is an open access article distributed under the terms and conditions of the Creative Commons Attribution (CC BY) license (https://creativecommons.org/licenses/by/4.0/).
Share and Cite
Ansari, Y.; Husain, D.; Das, U.K.; Haloi, J.; Khan, N.A.; Prakash, R.; Husain, M. Ecological Footprint Assessment of Concrete: Partial Replacement of Cement by Water Treatment Sludge and Stone Dust. Sustainability 2023, 15, 7512. https://doi.org/10.3390/su15097512
Ansari Y, Husain D, Das UK, Haloi J, Khan NA, Prakash R, Husain M. Ecological Footprint Assessment of Concrete: Partial Replacement of Cement by Water Treatment Sludge and Stone Dust. Sustainability. 2023; 15(9):7512. https://doi.org/10.3390/su15097512
Chicago/Turabian StyleAnsari, Yakub, Dilawar Husain, Umesh Kumar Das, Jyotirmoy Haloi, Nasar Ahmad Khan, Ravi Prakash, and Mujahid Husain. 2023. "Ecological Footprint Assessment of Concrete: Partial Replacement of Cement by Water Treatment Sludge and Stone Dust" Sustainability 15, no. 9: 7512. https://doi.org/10.3390/su15097512