Article

Performance Analysis of a Hybrid Renewable-Energy System for Green Buildings to Improve Efficiency and Reduce GHG Emissions with Multiple Scenarios

1
Mechanical Engineering Department, Faculty of Engineering, Al-Hussein Bin Talal University, Ma’an 71111, Jordan
2
Environmental Engineering Department, Faculty of Engineering, Al-Hussein Bin Talal University, Ma’an 71111, Jordan
3
Mechanical Engineering Department, Benha Faculty of Engineering, Benha University, Benha 13511, Egypt
4
Department of Electrical Engineering, College of Engineering in Wadi Alddawasir, Prince Sattam Bin Abdulaziz University, Al-Kharj 11942, Saudi Arabia
5
Science Engineer Laboratory for Energy, National School of Applied Sciences, Chouaib Doukkali University of El Jadida, El Jadida 24000, Morocco
*
Authors to whom correspondence should be addressed.
Sustainability 2023, 15(9), 7529; https://doi.org/10.3390/su15097529
Submission received: 19 January 2023 / Revised: 26 April 2023 / Accepted: 26 April 2023 / Published: 4 May 2023

Abstract

:
A hybrid system, such as solar and wind, may be more successful than nonhybrid systems in accelerating the transition from conventional to renewable power sources. However, these new energy sources have several challenges, such as intermittency, storage capacity, and grid stability. This paper presents a complete analysis and study of a hybrid renewable-energy system (HRES) to convert a facility into a green building and reduce its dependence on conventional energy by generating clean energy with near-zero greenhouse-gas (GHG) emissions. The proposed system aims to reduce the energy bill of a hotel in Petra, Jordan, by considering different sustainable energy resource configurations in a grid-connected hybrid renewable energy system (GHRES). The hybrid optimization of multiple energy resources (HOMER) grid software was utilized on the hybrid systems to study ways to improve their overall efficiency and mitigate GHG emissions from an economic perspective. The hybrid system components included in the simulation were a solar photovoltaic (PV) system, a wind turbine (WT) system, a diesel generator (DG), and a converter. Five scenarios (PV–Converter–DG–Grid, PV–Converter–Battery–DG–Grid, WT–DG–Grid, PV–WT–Converter–Battery–DG–Grid, PV–WT–Converter–DG–Grid) were considered. The optimal configuration had a USD 1.16 M total net present cost, USD 0.0415/kWh cost of energy, 15.8% effective internal rate of return, and an approximately 77% reduction in carbon emissions compared to the base case.

1. Introduction

Solar and wind energies are domestic and free energy sources and some of the best local solutions for increasing energy demand. According to the Fraunhofer Institute for Solar Energy Systems photovoltaics report, worldwide installed photovoltaic (PV) capacity increased to more than 515 gigawatts, supplying approximately two percent of global electricity demand [1]. In addition, 60.4 gigawatts of wind energy capacity were installed globally in 2019, a 19 percent increase [2].
Sustainable renewable energy is considered a green energy source. However, it is not a fully green source due to the production of renewable-energy system parts and components that are often manufactured in factories and facilities powered by nongreen energy. In addition, the transportation of these systems’ parts and components usually depends on conventional fuels. Moreover, greenhouse-gas (GHG) emissions are undesirable, causing pollution in the atmosphere. The primary greenhouse gases are water vapor (H2O), carbon dioxide (CO2), methane (CH4), nitrous oxide (N2O), and ozone (O3). Conventional energy sources such as coal and other fossil fuels are significant sources of GHGs [3,4,5]. The burning of these fuels contributes to the well-known global-warming phenomena in which the earth’s atmosphere warms by absorbing solar energy and retaining it in the atmosphere [6].
Renewable energy is the best choice for providing clean, reliable, and sustainable energy. The electricity generated from clean sources improves quality of life and enhances economic growth. In addition, replacing conventional energy sources like fossil fuels with renewable-energy sources helps mitigate world climate change due to greenhouse-gas emissions. While renewable energy is a domestic source, it faces limitations due to high initial cost, intermittency, and geographic boundaries [7].
Annual energy consumption growth is 1% for developed countries and 5% for developing countries [8]. In Jordan, the need for electricity increases each year, with the primary energy sources for 2018 (the most recent data from the Ministry of Energy and Mineral Resources) reported as imported oil and natural gas, with a share of 87% of total energy consumption (9712 kt), followed by renewable energy at 7% [9,10]. The transportation sector consumes 49% of Jordan’s total national energy demands, while the second-highest share is 21.5% from residential consumption, according to the last data report from Jordan’s National Electric Power Company [11]. One of Jordan’s most significant energy challenges is that increasing energy costs contribute to slower economic growth since most of its energy is imported. Buildings in general use approximately 20–40% of the total energy demand in developed countries [12], where conventional energy sources are still the dominant sources. Among active solar solutions, photovoltaic systems are intensely studied thanks to the aesthetical and technical opportunities offered in the last years as well as to the publication of clear design criteria and recommendations [13].
Renewable-energy system electrical grids need to be more flexible and dynamic than conventional grids to increase their contribution to total energy generation and overcome the challenges of intermittency and varying availability at specific locations. Using decentralized power-generation concepts such as microgrids, smart grids, and standalone (off-grid) power systems can increase the share of renewable energy. Green buildings that depend on sustainable sources of energy such as solar and wind can help the environment and the consumer by replacing conventional energy sources with accessible, domestic, and green-energy sources [14].
The design of grid-connected hybrid energy systems, shown in Figure 1, involves and determines factors such as the most suitable components, their sizes, and power management (PM) while considering the location and load demand.
The main goal of this research is to design and simulate a hybrid renewable-energy system (HRES) consisting of a solar photovoltaic (PV) system, a wind turbine (WT) system, and a storage system. The main contribution of this study is to investigate and find applicable configurations for a hybrid system that can achieve the most effective hybrid configuration using a systematic methodology.
This HRES will provide improved total electrical efficiency for a green building and study the impact on the environment from GHG reduction by replacing part of the national electrical grid energy with renewable-energy sources.
The following are the research objectives:
  • Design a hybrid renewable-energy system (solar, wind energy, and grid network) to supply power to a building that decreases dependence on the electrical grid.
  • Analyze the resulting data for power, economic, and environmental output for hybrid systems from HOMER software simulations to investigate overall efficiency and define an optimal configuration.
  • Evaluate the environmental impact of GHG reduction by the optimal hybrid renewable-energy configuration.
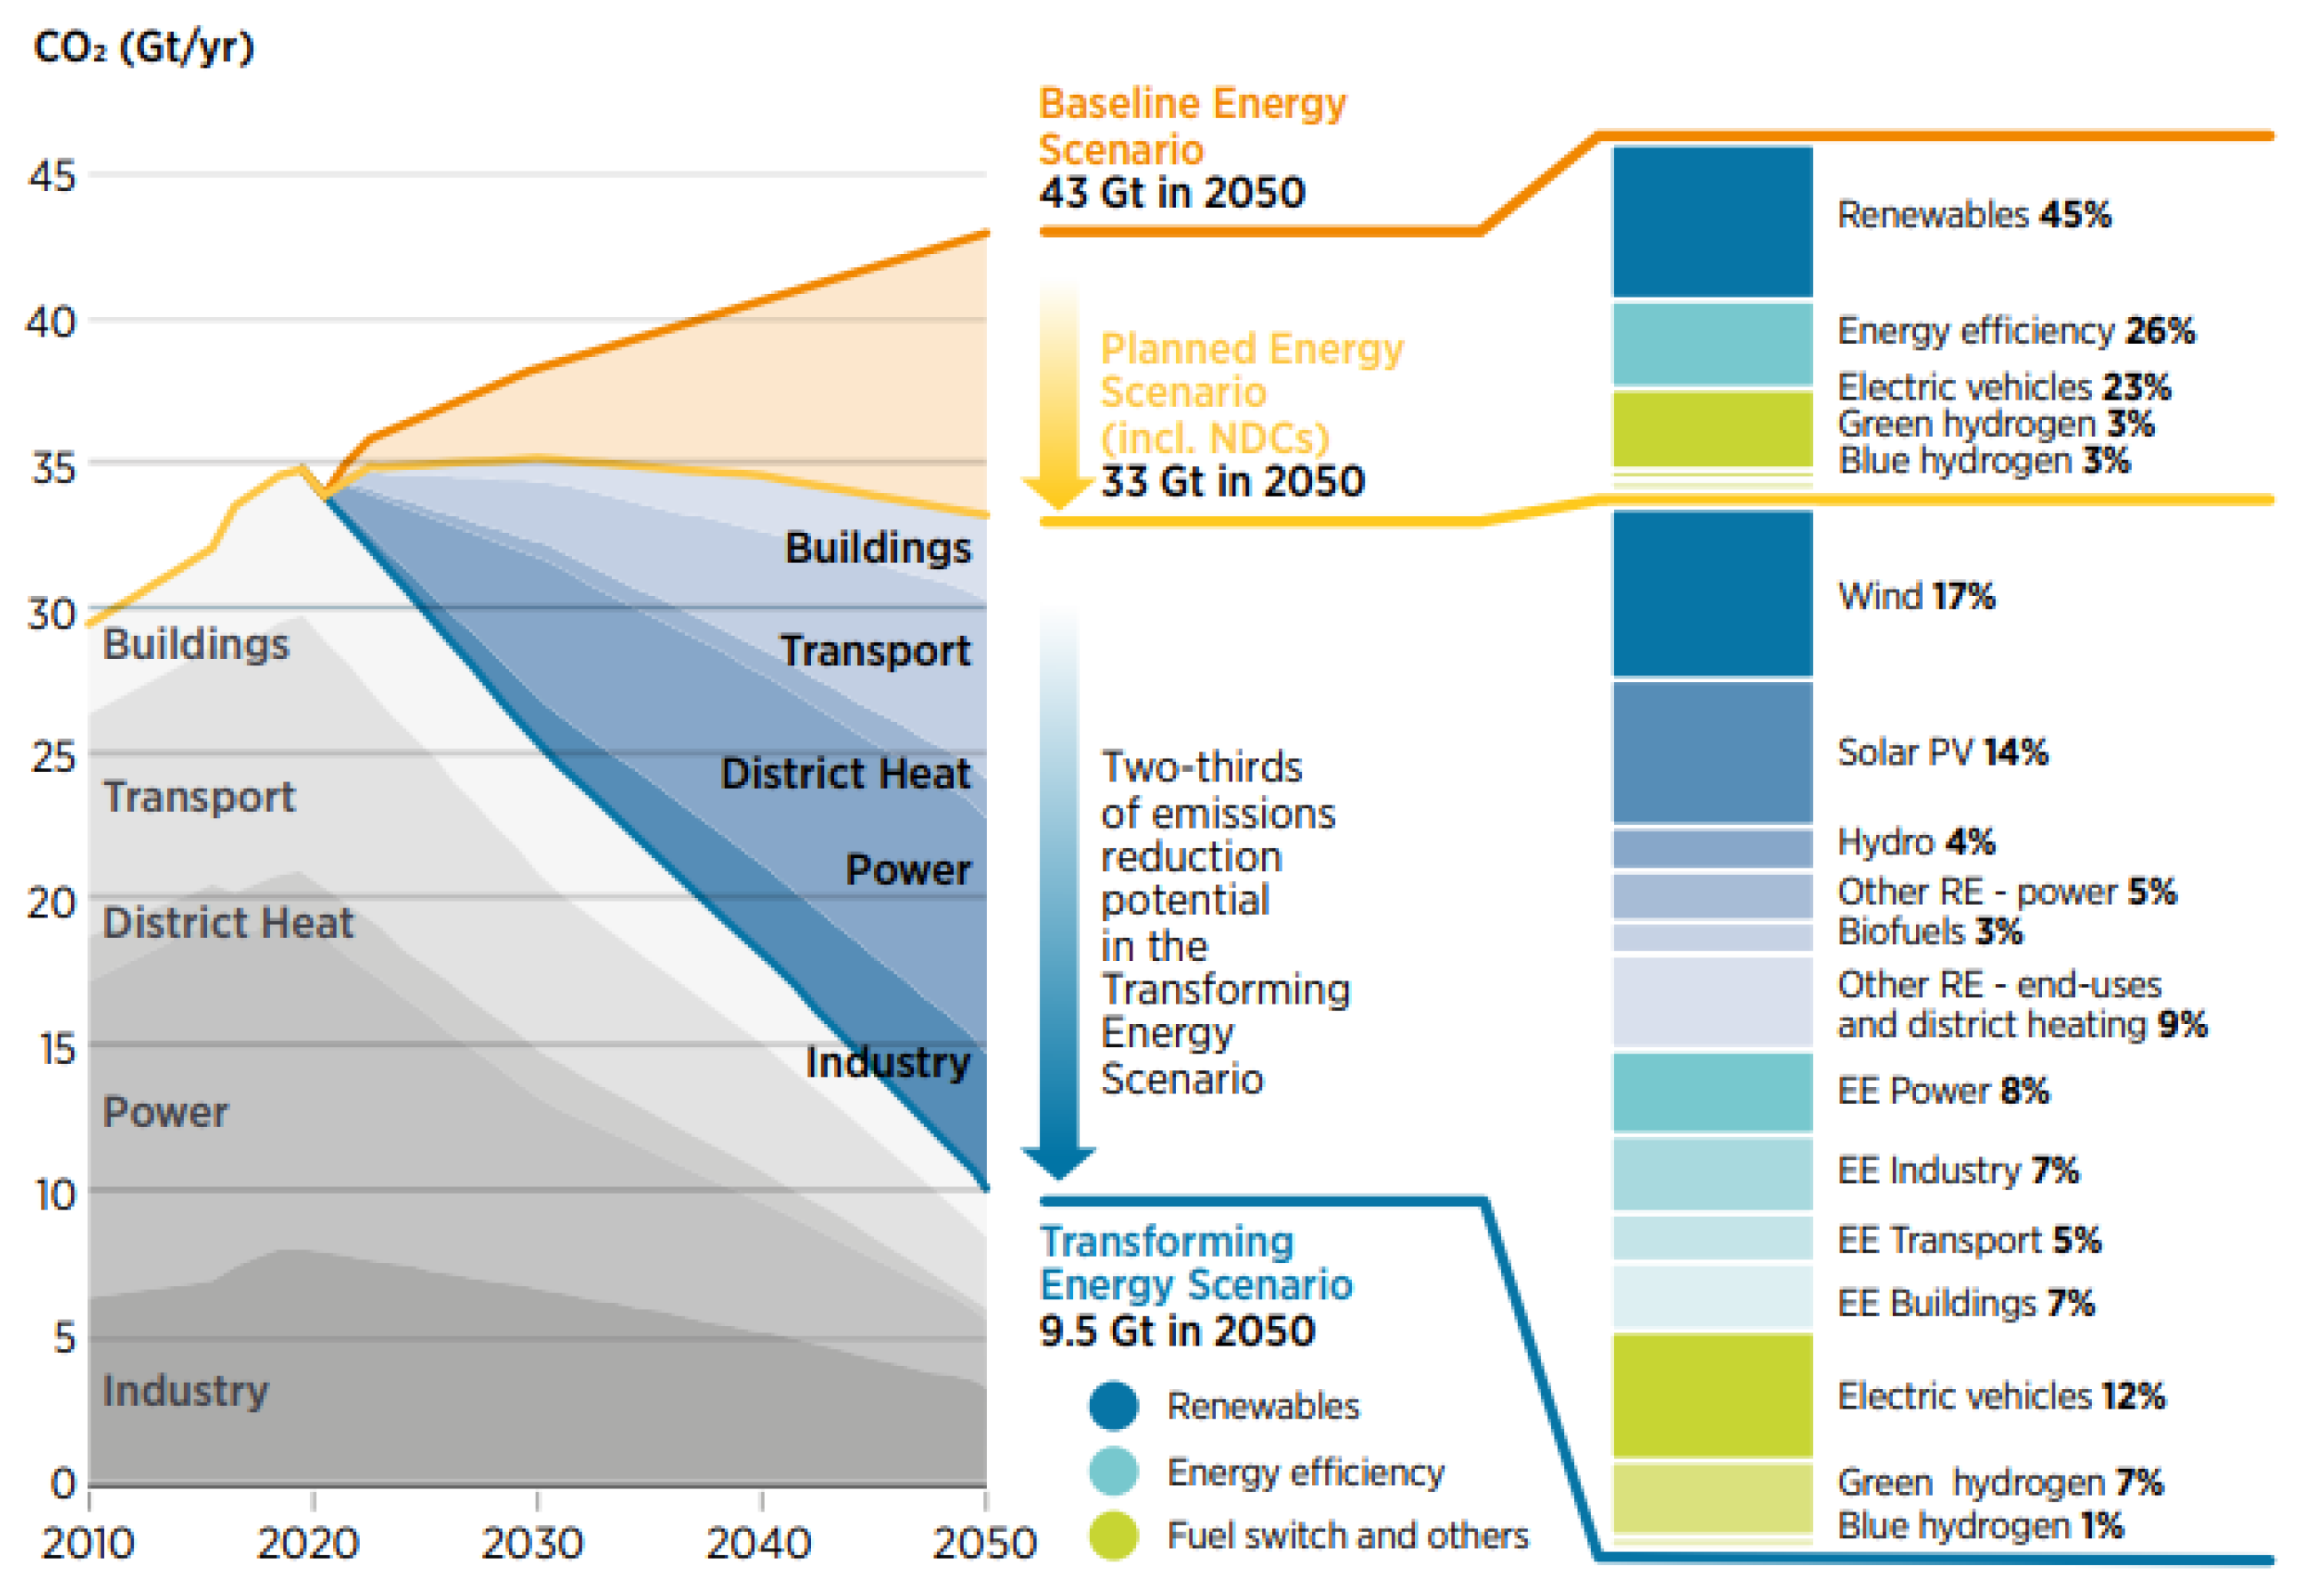
This study contains electrical, environmental, and economic analyses. When investigating the reliability and applicability of a new HRES, the starting point is that 85.1% of grid electricity (GE) is currently generated from conventional power, from sources such as fossil fuels. These conventional sources suffer from losses that can reduce electrical efficiencies, such as transmission losses, heat loss, and the use of lower-quality technologies, which can increase the final electricity costs for the distributor and the consumer [11,15]. Some of the generated electrical power is wasted in the transmission and distribution networks as voltage drops, so the additional power needed to recover these losses will increase the pollution of the climate. Therefore, increasing electrical efficiency is one of the best and most cost-effective ways to mitigate GHG emissions and save money. Figure 2 shows the CO2 emission reduction potential by technology for the planned energy scenario (33 Gt in 2050), with 45% renewable energy, 26% energy efficiency, and the remainder from other technologies [16].

2. Literature Review

This section reviews the primary studies and reports that provide insight and understanding into the use of a hybrid renewable energy system (HRES) consisting of two or more renewable-energy subsystems. The review also reveals the challenges of renewable power research, problems associated with power fluctuations and remote generation, and possible solutions. Furthermore, previous studies introduced the advantages and disadvantages of an HRES, photovoltaics (PVs), wind turbines (WT), and economic cost effectiveness.
Addressing the design and simulation of hybrid renewable-energy systems, Suresh et al. [17] optimized an off-grid hybrid energy system through the control, sizing, and choice of components. They considered a cost-effective power solution for electrifying villages in the Kollegal block of the Chamarajanagar district in India. The aim was to reduce the system’s net present cost (NPC), cost of energy (COE), unmet load scenario, and CO2 emissions, which were computed using a genetic algorithm and also using the HOMER Pro Software. The results of the two methods were compared for four HRES configurations. The simulations suggested that the combination of biogas, solar, wind, and fuel cells with battery was the optimal solution with zero unmet loads and the least energy cost at USD 0.163 per kWh.
Bagheri et al. [18] focused their research on proposing a systematic approach to optimal planning of hybrid renewable energy for neighborhoods. They studied the impact of system economics on the life-cycle cost analysis of the optimal proposed hybrid renewable systems for Vancouver, Canada. Wind energy was found to be an uneconomical choice, while biomass appeared to be the optimal hybrid system. System configurations, capital investment, and operating costs controlled the economic decision. The results showed that the optimized proposed systems’ net present costs (NPCs) were USD 59 M, USD 116 M, and USD 290 M. The study suggests a framework for local governments and planners to integrate neighborhood-scale hybrid renewable-energy systems in their jurisdictions. Therefore, introducing biomass waste as a renewable-energy resource can effectively enhance the techno-economic performance of urban regions’ hybrid renewable-energy systems, limit landfill waste, and create green jobs for the community. The authors also develop a new model of the hybrid energy system using the HOMER algorithm that optimizes techno-economic and environmental performance.
Olatomiwa et al. [19] suggest a solution for healthcare centers or clinics in remote areas using an off-grid hybrid renewable-energy system. They conducted an analysis of wind and solar sources for a selected rural location in Nigeria based on meteorological data with an optimal technical and economical design. Sizing hybrid renewable-energy system components such as wind, PV, battery, and inverter using the HOMER software, they studied each site’s solar and wind data. They showed that the PV–wind–diesel–battery hybrid system configuration was optimal for a health center in the rural Iseyin site, with an NPC of USD 102,949 and a COE of USD 0.311/kWh.
In an economic assessment of hybrid renewable-energy systems, Ali and Jang [20] proposed a model for an off-grid HRES for remote Deokjeok-do Island in South Korea using daily mean-load electricity-consumption data for one year (24,720 kWh). They collected the average annual wind speed and the daily solar radiation values of 3.6 m/s and 4.13 kWh/m2, respectively. A total of 8760 simulations were needed to compute the hourly load demand using the HOMER software. The disadvantages found for this system were the surplus and electricity deficit. To find the most suitable HRES, the authors investigated criteria such as leveled cost of energy (LCOE) and net present cost (NPC). The total estimated cost for a wind-energy system was USD 11.3 M. However, the estimated cost was USD 17.6 M for a solar energy system, and its LCOE was USD 0.1594/kWh. Both systems consisted of one STX 93/2000 wind turbine and 2504 kW PV panels (for system one) and 3157 kW PV panels (for system two). They have also designed a pumped hydro storage (PHS) system to mitigate the surplus and deficit of electricity for the two systems and conducted an economic comparison between the PHS and a battery which indicated that the PHS could be a less expensive choice.
Odou et al. [21] also included a battery as a storage system and analyzed a case study of the village of Fouay in the Republic of Benin from a techno-economic perspective. They suggested a hybrid PV–diesel generator (DG)–battery system as the best choice to electrify the village. Their study showed that it has the lowest net present cost, provides a reliable power supply, and reduces battery storage cost since its battery requirement is only 30% of a standard PV–battery standalone system. The PV–DG–battery system has the shortest payback period of 3.45 years and a 33.3% internal rate of return (IRR). The results suggested that the off-grid hybrid PV–DG–battery system with a COE of USD 0.207/kWh was a suitable technology to sustainably electrify the village as projected in the county’s master rural electrification plan. The research recommends this system for electrification projects in Benin in the future.
The ability to use biomass energy depends on location and the available raw material, as discussed by Kasaeian et al. [22]. They conducted a techno-economic investigation to evaluate the optimal HRES consisting of a hybrid PV, biomass, and DG for Bandar Dayyer, Iran. The simulation results using the HOMER software showed that the total amount of electricity production by these systems was equal to 470,176 kW, with 22,409 kW produced by a PV–generic system and 447,767 kW produced by a PV–diesel–generic system. The economic analysis result implies that the NPC for the PV–wind system is USD 23,148.84, ensuring the benefits of using an HRES over a PV–diesel–generic system [22,23].
Karunathilake et al. [24] presented an optimized HRES at the building level to achieve the net-zero level goals of Canada and British Columbia. The study considers factors to develop an optimized model, such as minimizing energy system cost and life cycle environmental impacts and maximizing operational cost savings. The results indicated that ground sources such as heat pumps and solar sources such as photovoltaics were the optimal energy choices for multiunit residential buildings for the selected site location in British Columbia, Canada. The best energy system combination supplied 44% of the building’s energy demand through the renewable-energy system. However, reduced emissions and operational costs can also be achieved with an HRES. The overall life-cycle impacts could be reduced by 11.4%, and annual carbon emissions could be decreased by 21.70%. For the optimal solution, the levelled cost of energy does not vary more than ±0.05% from the standard grid electricity price, and the system will pay for itself within 22–23 years. The authors state that the proposed system’s per capita annual energy cost saving was USD 7. While renewable-energy systems can promote environmental and energy security, they carry an economic burden, particularly for small communities and neighborhood-level applications.
Another study on large buildings was conducted by Islam, Md Shahinur [25], who presented a techno-economic analysis on a grid-connected HRES for a large office building in France. The data was collected from the study location, and the HOMER simulation software was used to compute the technical, economic, and environmental parameters of the PV–Grid system. The economic evaluation parameters considered in the analysis were the NPC, COE, and energy payback time (EPT). The results show that the PV–Grid system was the most cost-effective system configuration and minimizes more than 90% of emissions compared to the existing emissions at the study site. Furthermore, the system performs reasonably well with the variation in electric load and solar insolation. The HRES will be most competitive during rising electricity prices with a COE of USD 0.087/kWh. Furthermore, the results also indicate the superiority of the HRES if a carbon tax is imposed in the future.
In literature related to mathematical modeling, Mayer et al. [26] studied the optimization of an HRES and indicated that the previous studies do not consider life-cycle environmental impacts other than GHG emissions. For factual life-cycle bases using the environmental footprint corresponding to the NPC as an objective function, the research includes the complete set of commercially available renewable-energy systems handling heating and electricity demand at the household level. Renewable energy was better than fossil fuels even when considering life-cycle impacts. However, renewable-energy systems are not emission-free and have some adverse environmental profiles, and there is no universal solution for reducing their effects. Their study used a genetic algorithm to solve and ecodesign the economic and ecological multisizing problem of a building-sized microgrid. The result of the life-cycle assessment for an HRES design provides a framework for practical applications such as supporting consumer decisions or policymaking.
The choice of an optimal system by cost effectiveness was studied by Wang et al. [27] using a two-stage optimal framework to solve the design problem for an HRES in a seaport area. They focus on finding the best renewable-energy subsystems with a specific installed capacity to ensure the lowest investment cost and minimize operation costs by considering stochastic characteristics of wind-energy production and energy demands. The result confirms the desirability of maintaining constraints such as power balances, capacity limitations, and emission regulations. They found that the choice of the optimal wind–storage–onshore hybrid power system for a container seaport with different emission limitations and wind speeds can be applied to achieve optimal installation capacity and cost effectiveness.
Fulzele and Daigavane [28] researched the design and optimization of an HRES consisting of a solar photovoltaic (PV), wind generator, and battery with a converter. They used an improved hybrid optimization genetic algorithm (IHOGA) simulation developed in the electric department of the University of Zaragoza. The effect of variables such as global solar radiation, wind speed, and PV panel cost was considered. The results showed that economic viability should be prioritized over technical considerations. In developing countries, poor economic conditions are a limitation for high-cost hybrid renewable energy.
Focusing on the environmental effects of a base system and a new system that they proposed, Jeong et al. [29] conducted a technical design and analyzed the use of renewable-energy sources to supply green buildings. They combined three types of buildings in different regions to find the optimal design for minimum cost and reduced carbon dioxide emissions compared with the standard conventional energy sources. The case study found that the most significant power consumption was from diesel generators, and the solar PV system works as a buffer for temporal balance. However, they suggested that if the building has enough area to install a wind turbine, it would be a promising solution for realizing the goal of green buildings. The estimated COE for the HRES was six times more than the electricity price, though the HRES system shows better environmental performance with less CO2 emission than a conventional system. Although the system in this study was not economical, it can still be helpful as a guideline for stakeholders and the government.
Table 1 provides a comprehensive overview of the literature reviewed and a summary of each study configuration, components, location, and simulation software used. A similar framework for the proposed hybrid system can be used from these previous studies since they provide feedback to compare to the final result. At the same time, renewable-resource availability limits the use of certain types of renewable-energy sources. Each location has a different resource potential, as seen in many of the previous studies. In some areas, the optimal configuration was PV–wind–diesel–battery, while in other locations, the optimal configuration was biogas, solar, wind, and fuel cell with batteries.
Previous studies showed an HRES could be more efficient by many measures and in many locations, as the power output is more reliable and the cost of energy is also feasible and comparable to the cost of energy for a nonrenewable system. In addition, grid-connected hybrid renewable-energy systems are promising and can be the best option for advancing renewable technologies.

3. Methodology and Experimentation

3.1. Methods and Instruments

This study includes electrical, environmental, and economic analyses to investigate the proposed system’s reliability and applicability. The research methodology was to develop a framework to increase electrical energy efficiency and reduce greenhouse-gas emissions resulting from fossil fuel-based electricity generation by using a hybrid renewable energy system (HRES). An HRES consists of multiple renewable-energy technologies, including solar and wind energy, in contrast to conventional sources relying on fossil fuels. This change transitions an HRES-powered facility toward becoming a green building. Study data were collected for the load consumption profile, renewable-energy resources, and GHG emissions.
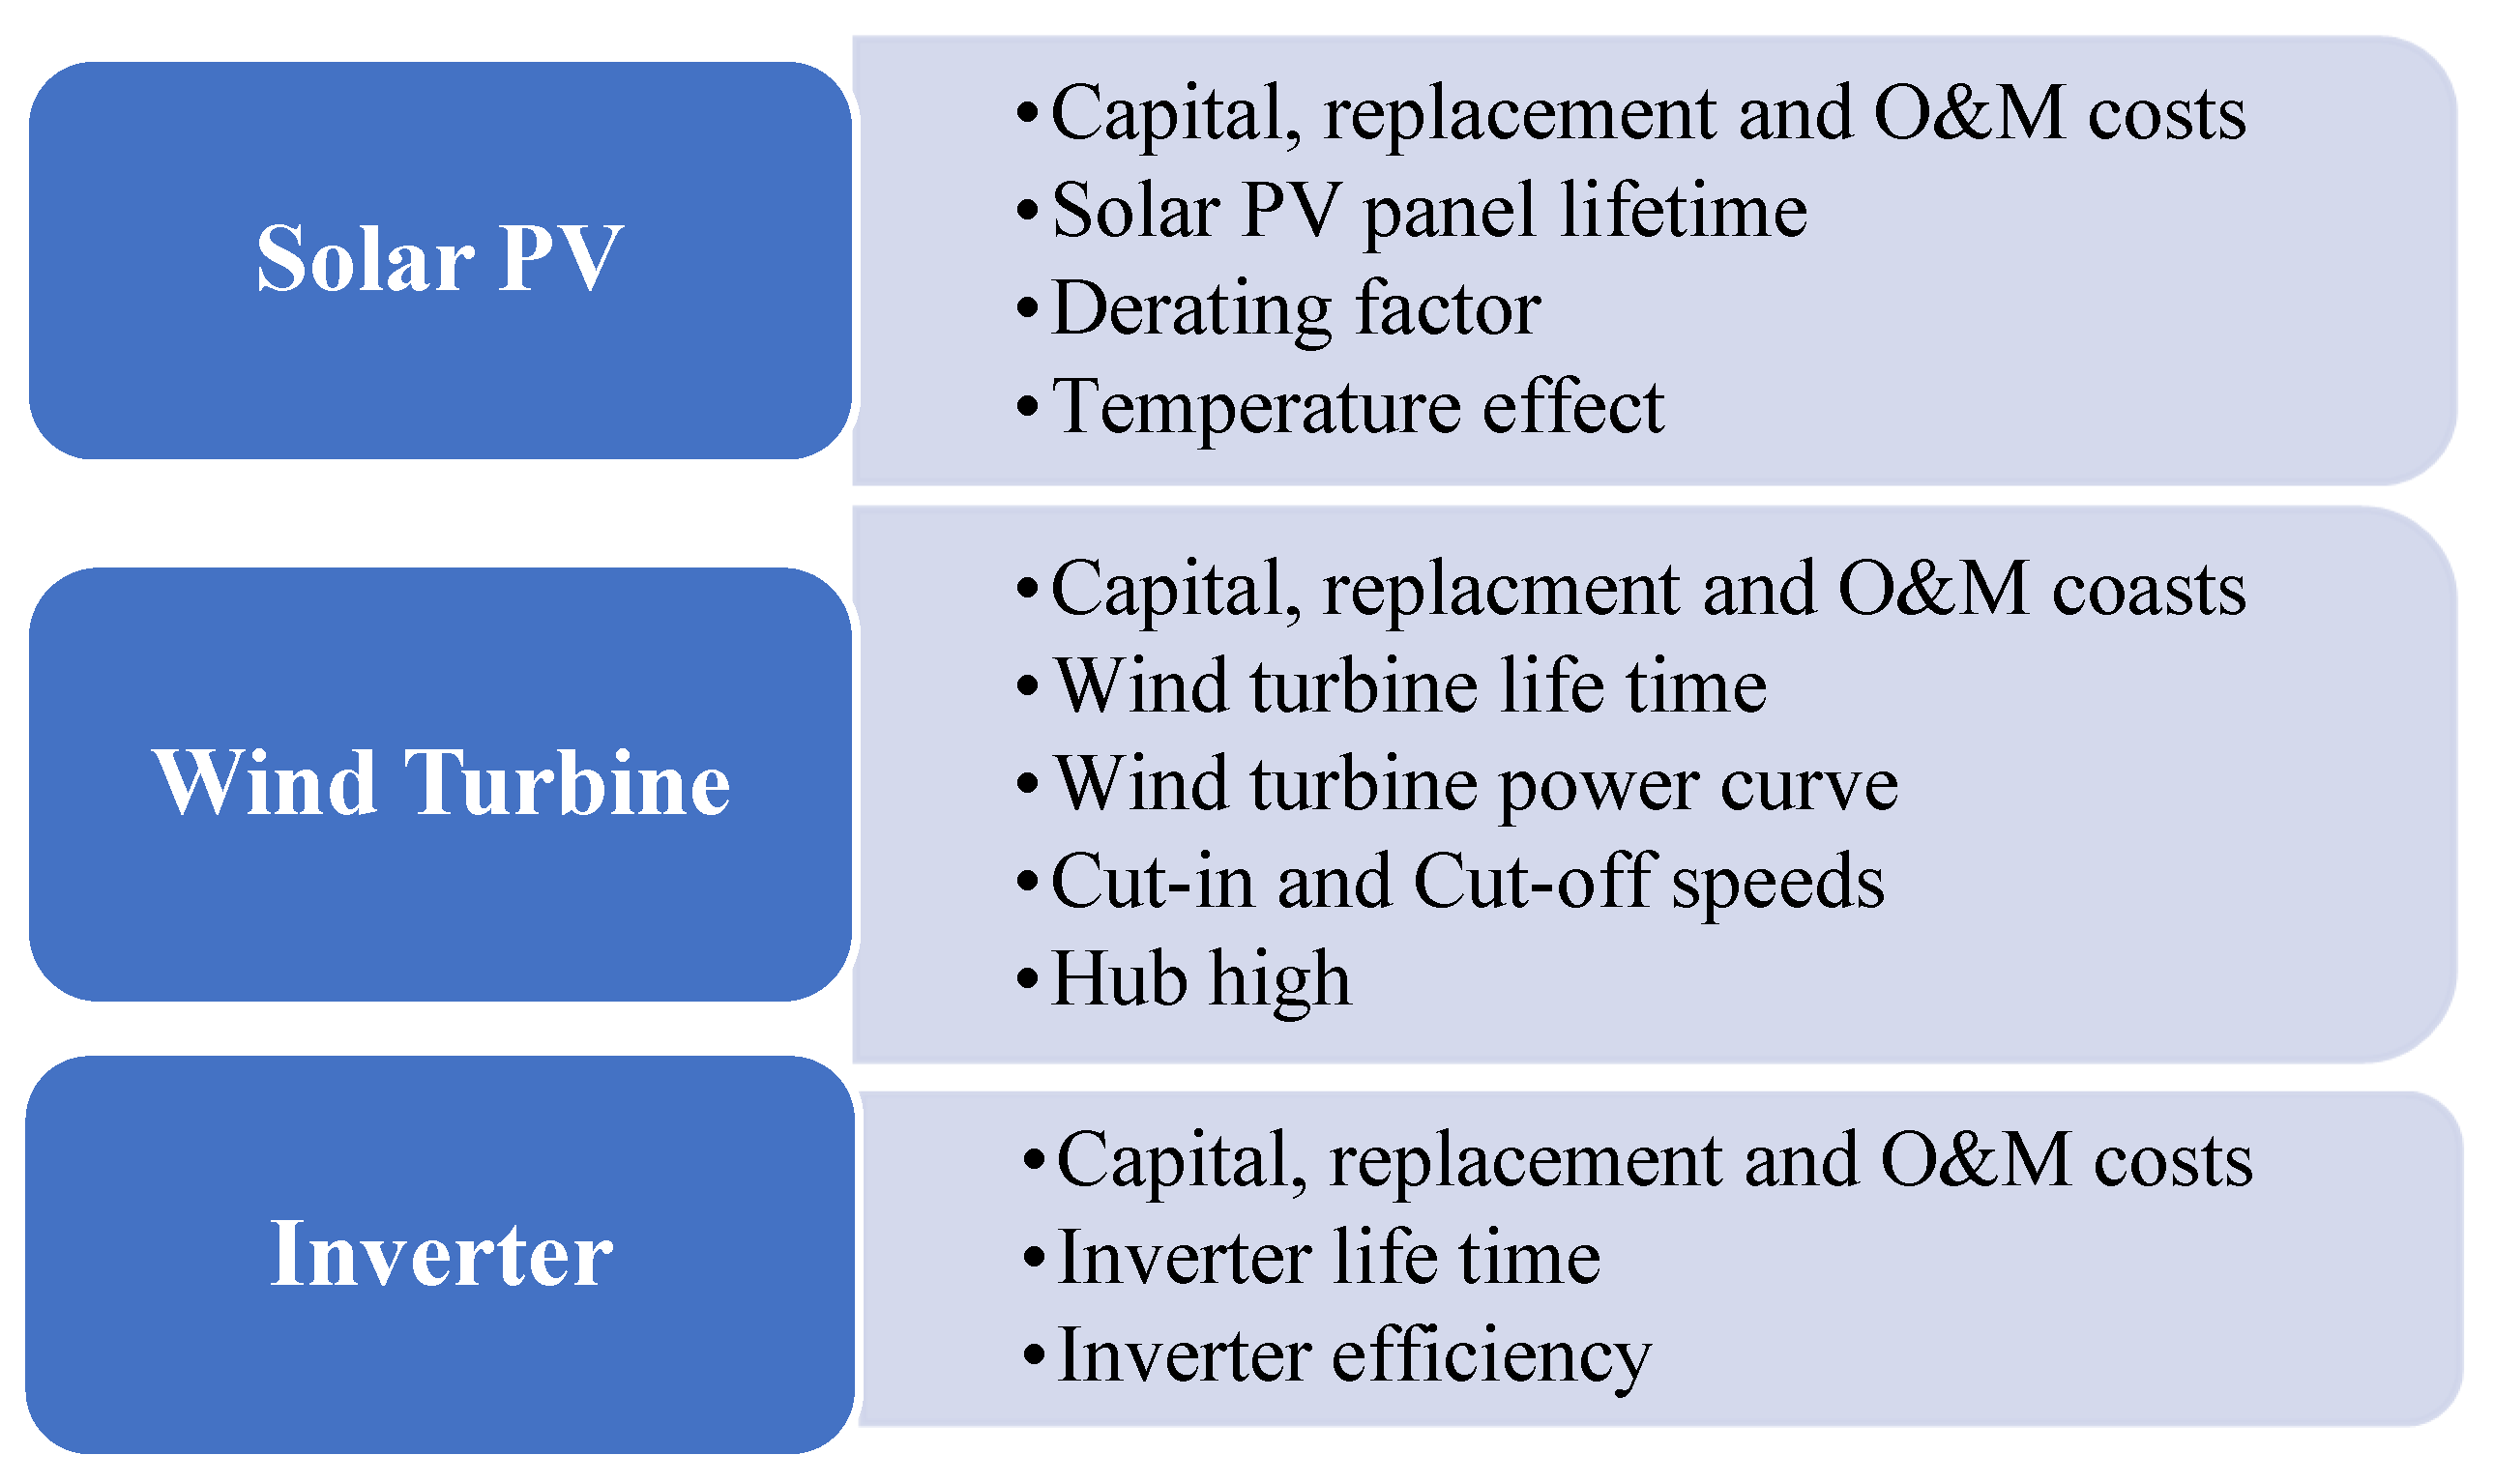
The system components of an HRES are optimized to deliver the needed power output using available renewable resources and to minimize the total NPC to achieve technical, economic, and carbon emissions requirements. In accordance with the design constraints, the design software chooses the most suitable system for various inputs. A systematic framework is proposed in this study to ensure that the optimal compatible HRES system using sustainable and clean energy sources is selected. The framework consists primarily of the five stages presented in Figure 3.
The first stage is the preliminary feasibility analysis, which is necessary to select candidate HRES technologies and create a proper system to meet the load demand. The meteorological data give feedback to the case study in the form of ambient environmental conditions such as temperature, wind speed, and climate. The renewable-energy (RE) resources at the site location are then evaluated to select an HRES based on their availability. Next, the load profile is needed to determine the number of kilowatts required from the proposed system. The load profile also consists of the load type (residential, commercial, or industrial) with daily and seasonal profile data showing the energy needed at what time of day and how the load differs in the summer and winter seasons. The current power supply is the case study system’s energy provided before the new proposed HRES is implemented. The HRES constraints associated with system design can limit the use of some HRES technologies and include geographical restraints (e.g., a limited area available for PV panels or WT structure obstacles).
The HRES components are the subsystems within the proposed system, potentially consisting of solar, wind, diesel generator, and electrical grid systems. Energy generation is the electrical energy delivered to the loads by the various subsystems comprising the HRES.
The simulation and optimization analysis stage consists of HRES-developed parameters, electrical efficiency, and economic and environmental studies. The simulation process collects the HRES parameters so that the optimization accurately represents the case study. The system’s efficiency is optimized to account for the type of energy generation and the distance from the load. An economical and environmental optimization performed in the simulation stage indicated an improvement to the overall output data.
The final stage in the systematic framework is the result stage. The proposed winning system HRES parameters and advantages are tabulated, and a comparison is made with the base-system configuration, as shown in Figure 4.
The device used to collect field measurement data for this study was the METREL MI 2892 Power Master power quality analyzer shown in Figure 5. This device was connected to the main distribution panel for the case-study hotel and measured the load consumption profile and the electrical load every 10 min for thirty days to obtain an accurate load profile from the electrical distribution company (EDCO). The hotel smart meter also gives the load profile for an entire year with daily measurements. The full load profile data was created by combining the field data and the meter log profile.
The advantages of the used methodology are:
  • Consists of real and field measurements data collection;
  • Using specialist software for this field of study;
  • Several comparisons were done on the research results;
  • The decision making was done by ordering the best results based on economic and environmental value.

3.2. Petra Marriott Hotel Case Study

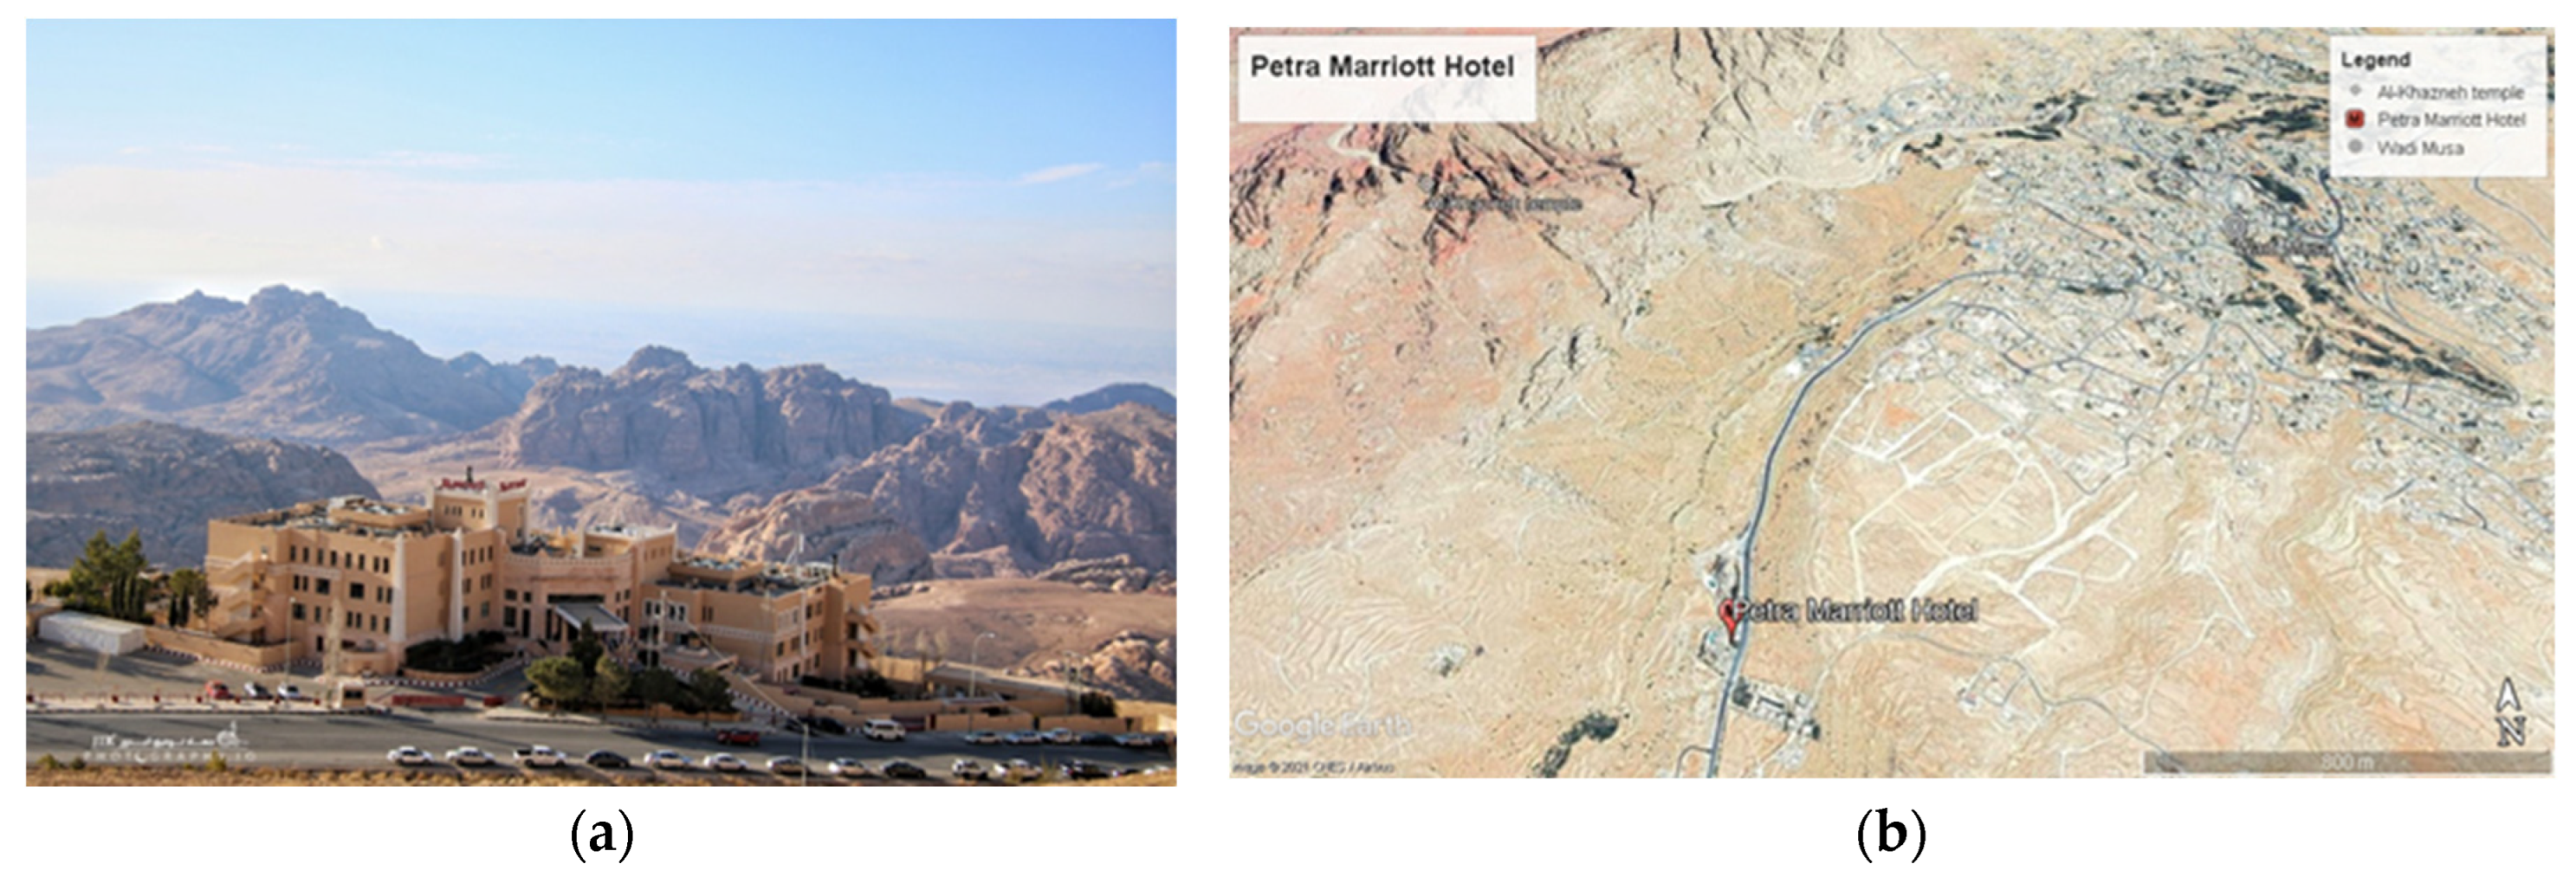
The case study was designed to demonstrate the suggested improved framework for a five-star hotel in Petra, Jordan. The objective was to design and study a hybrid renewable-energy system to improve electrical efficiency by utilizing sustainable energy resources while limiting outages and power fluctuations. The proposed system improves economic performance and limits emissions by replacing electrical fossil fuel base production with an electrical green energy-based renewable output. The Petra Marriott Hotel, shown in Figure 6a, is located in southern Jordan, 230 km from Amman in the Ma’an district, as shown in Figure 6b [43]. Petra is a “Seven New Wonders of the World” city and is surrounded by the magnificent rose mountains of Petra near Wadi Musa. The hotel is 6 km from the carved rock Al-Khazneh temple, and the hotel is considered one of the central hotels in the area due to its unique location.

3.2.1. Renewable Resources Assessment for the Case Study

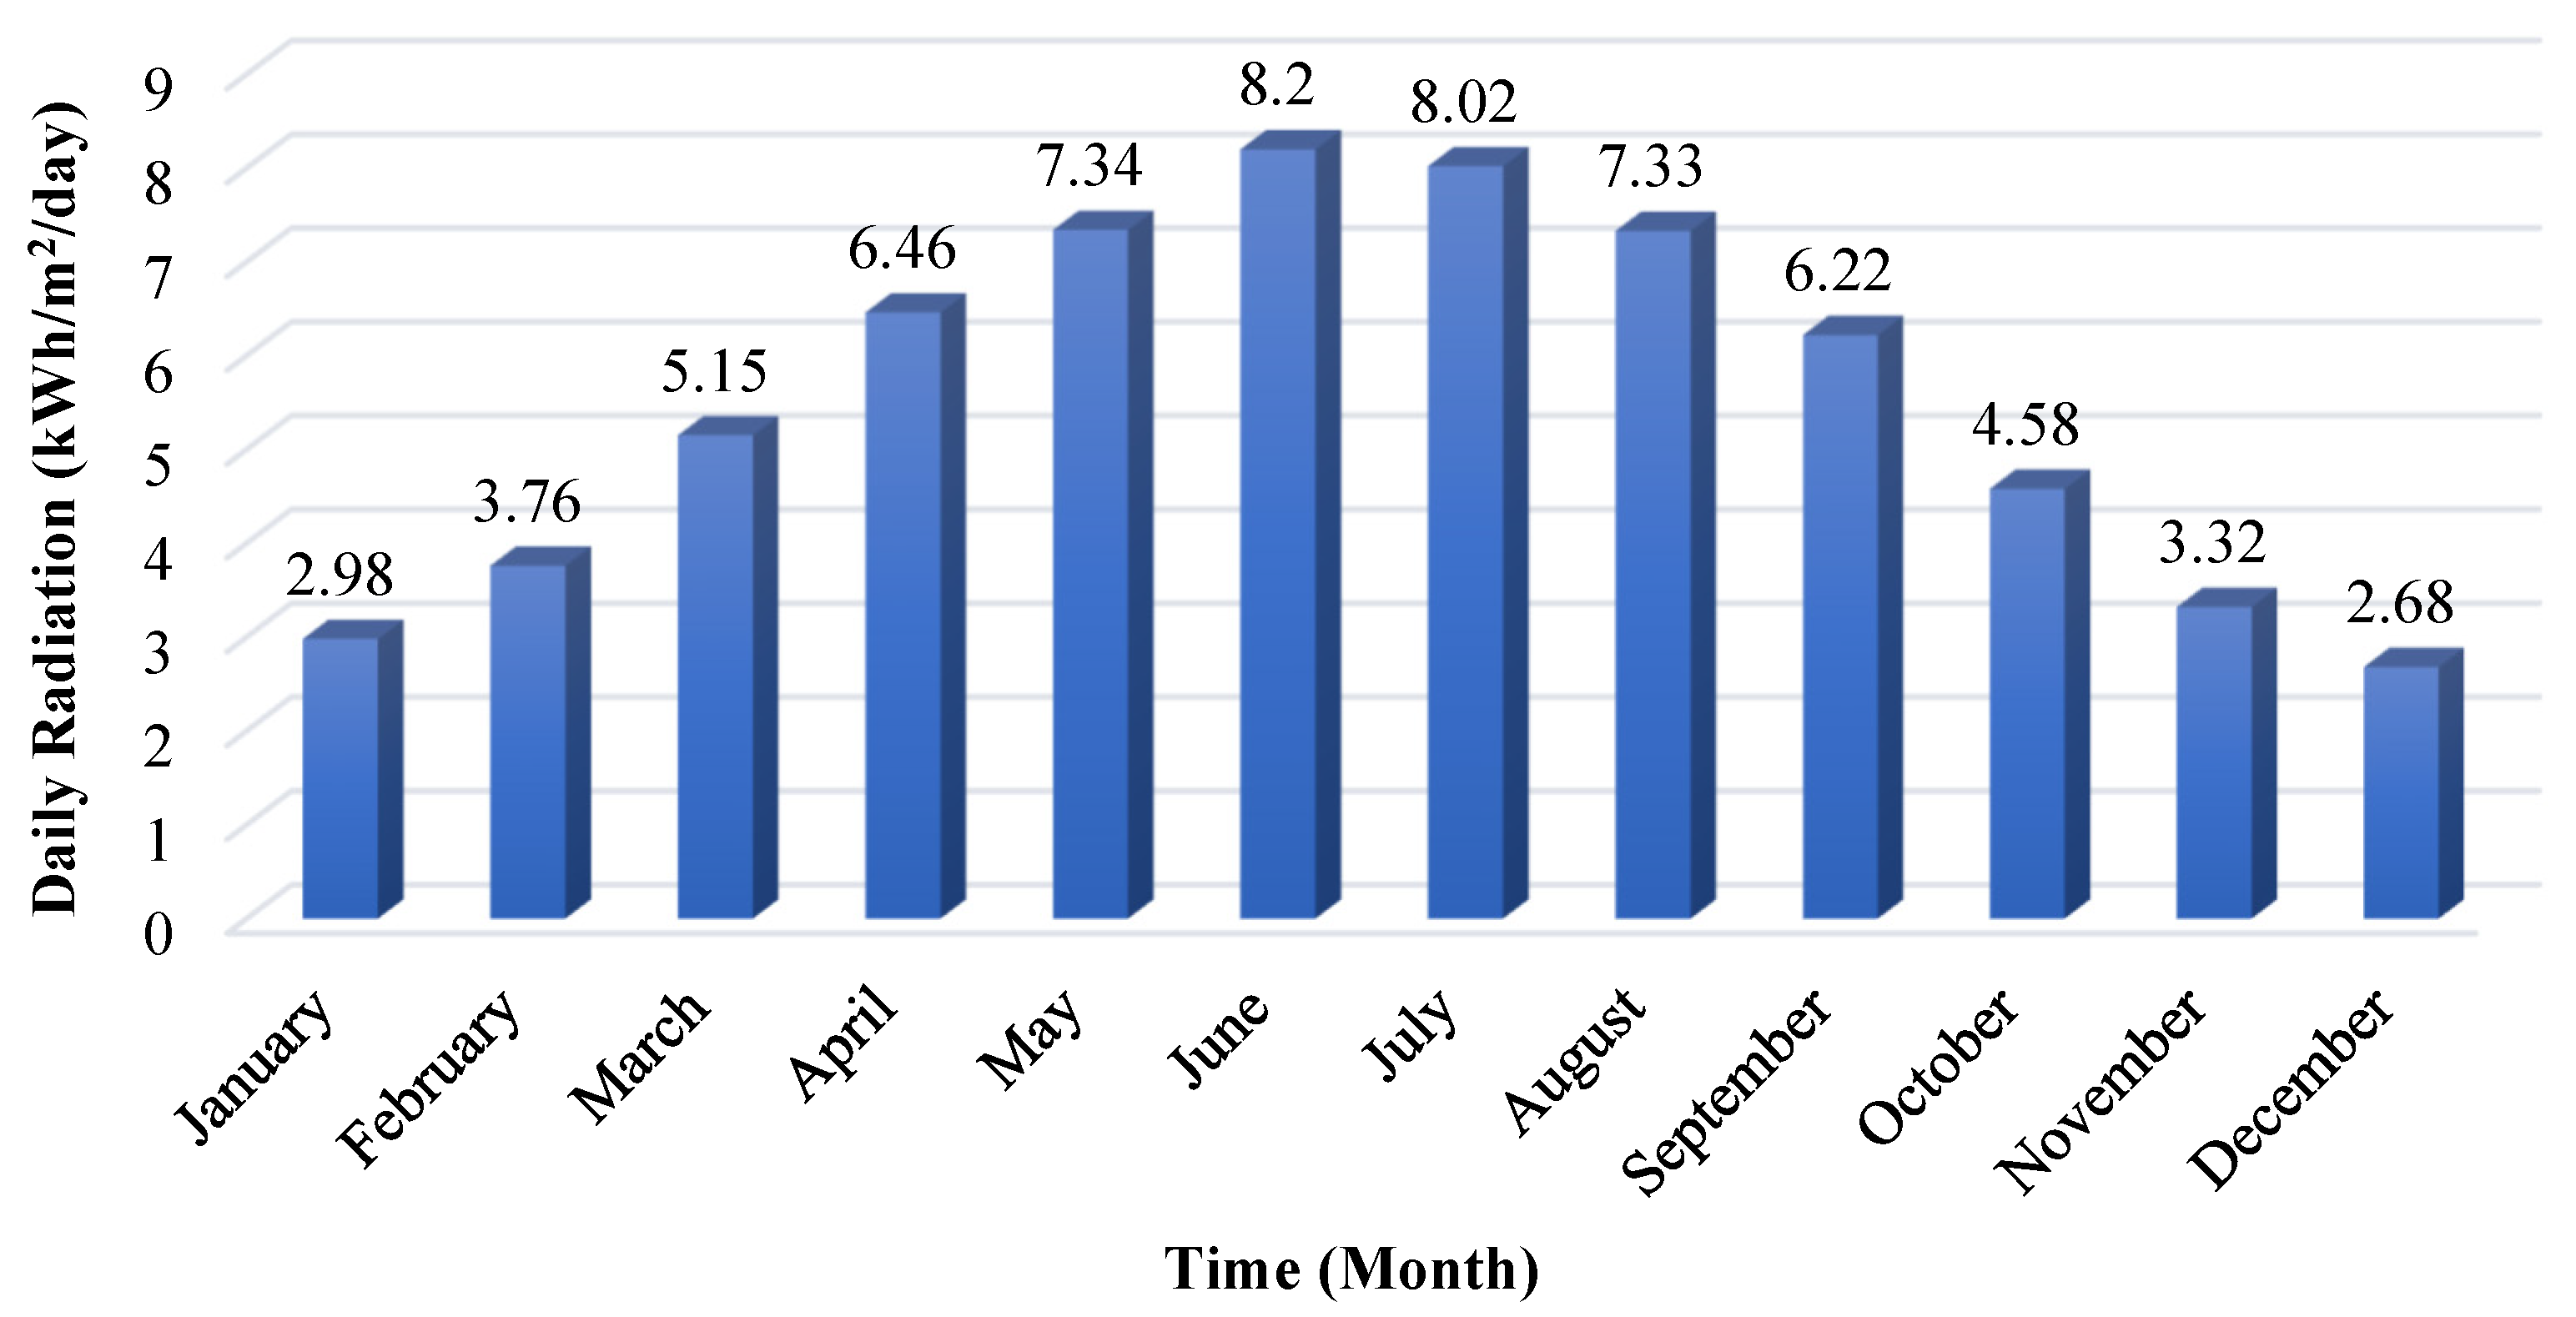
The case study location has ample solar irradiation of 5.5 kWh/m2/day per year [44] and average daily solar irradiation, as shown in Figure 7. The annual mean air temperature for the area is 17.7 °C, and the site elevation is 1303 m above sea level.
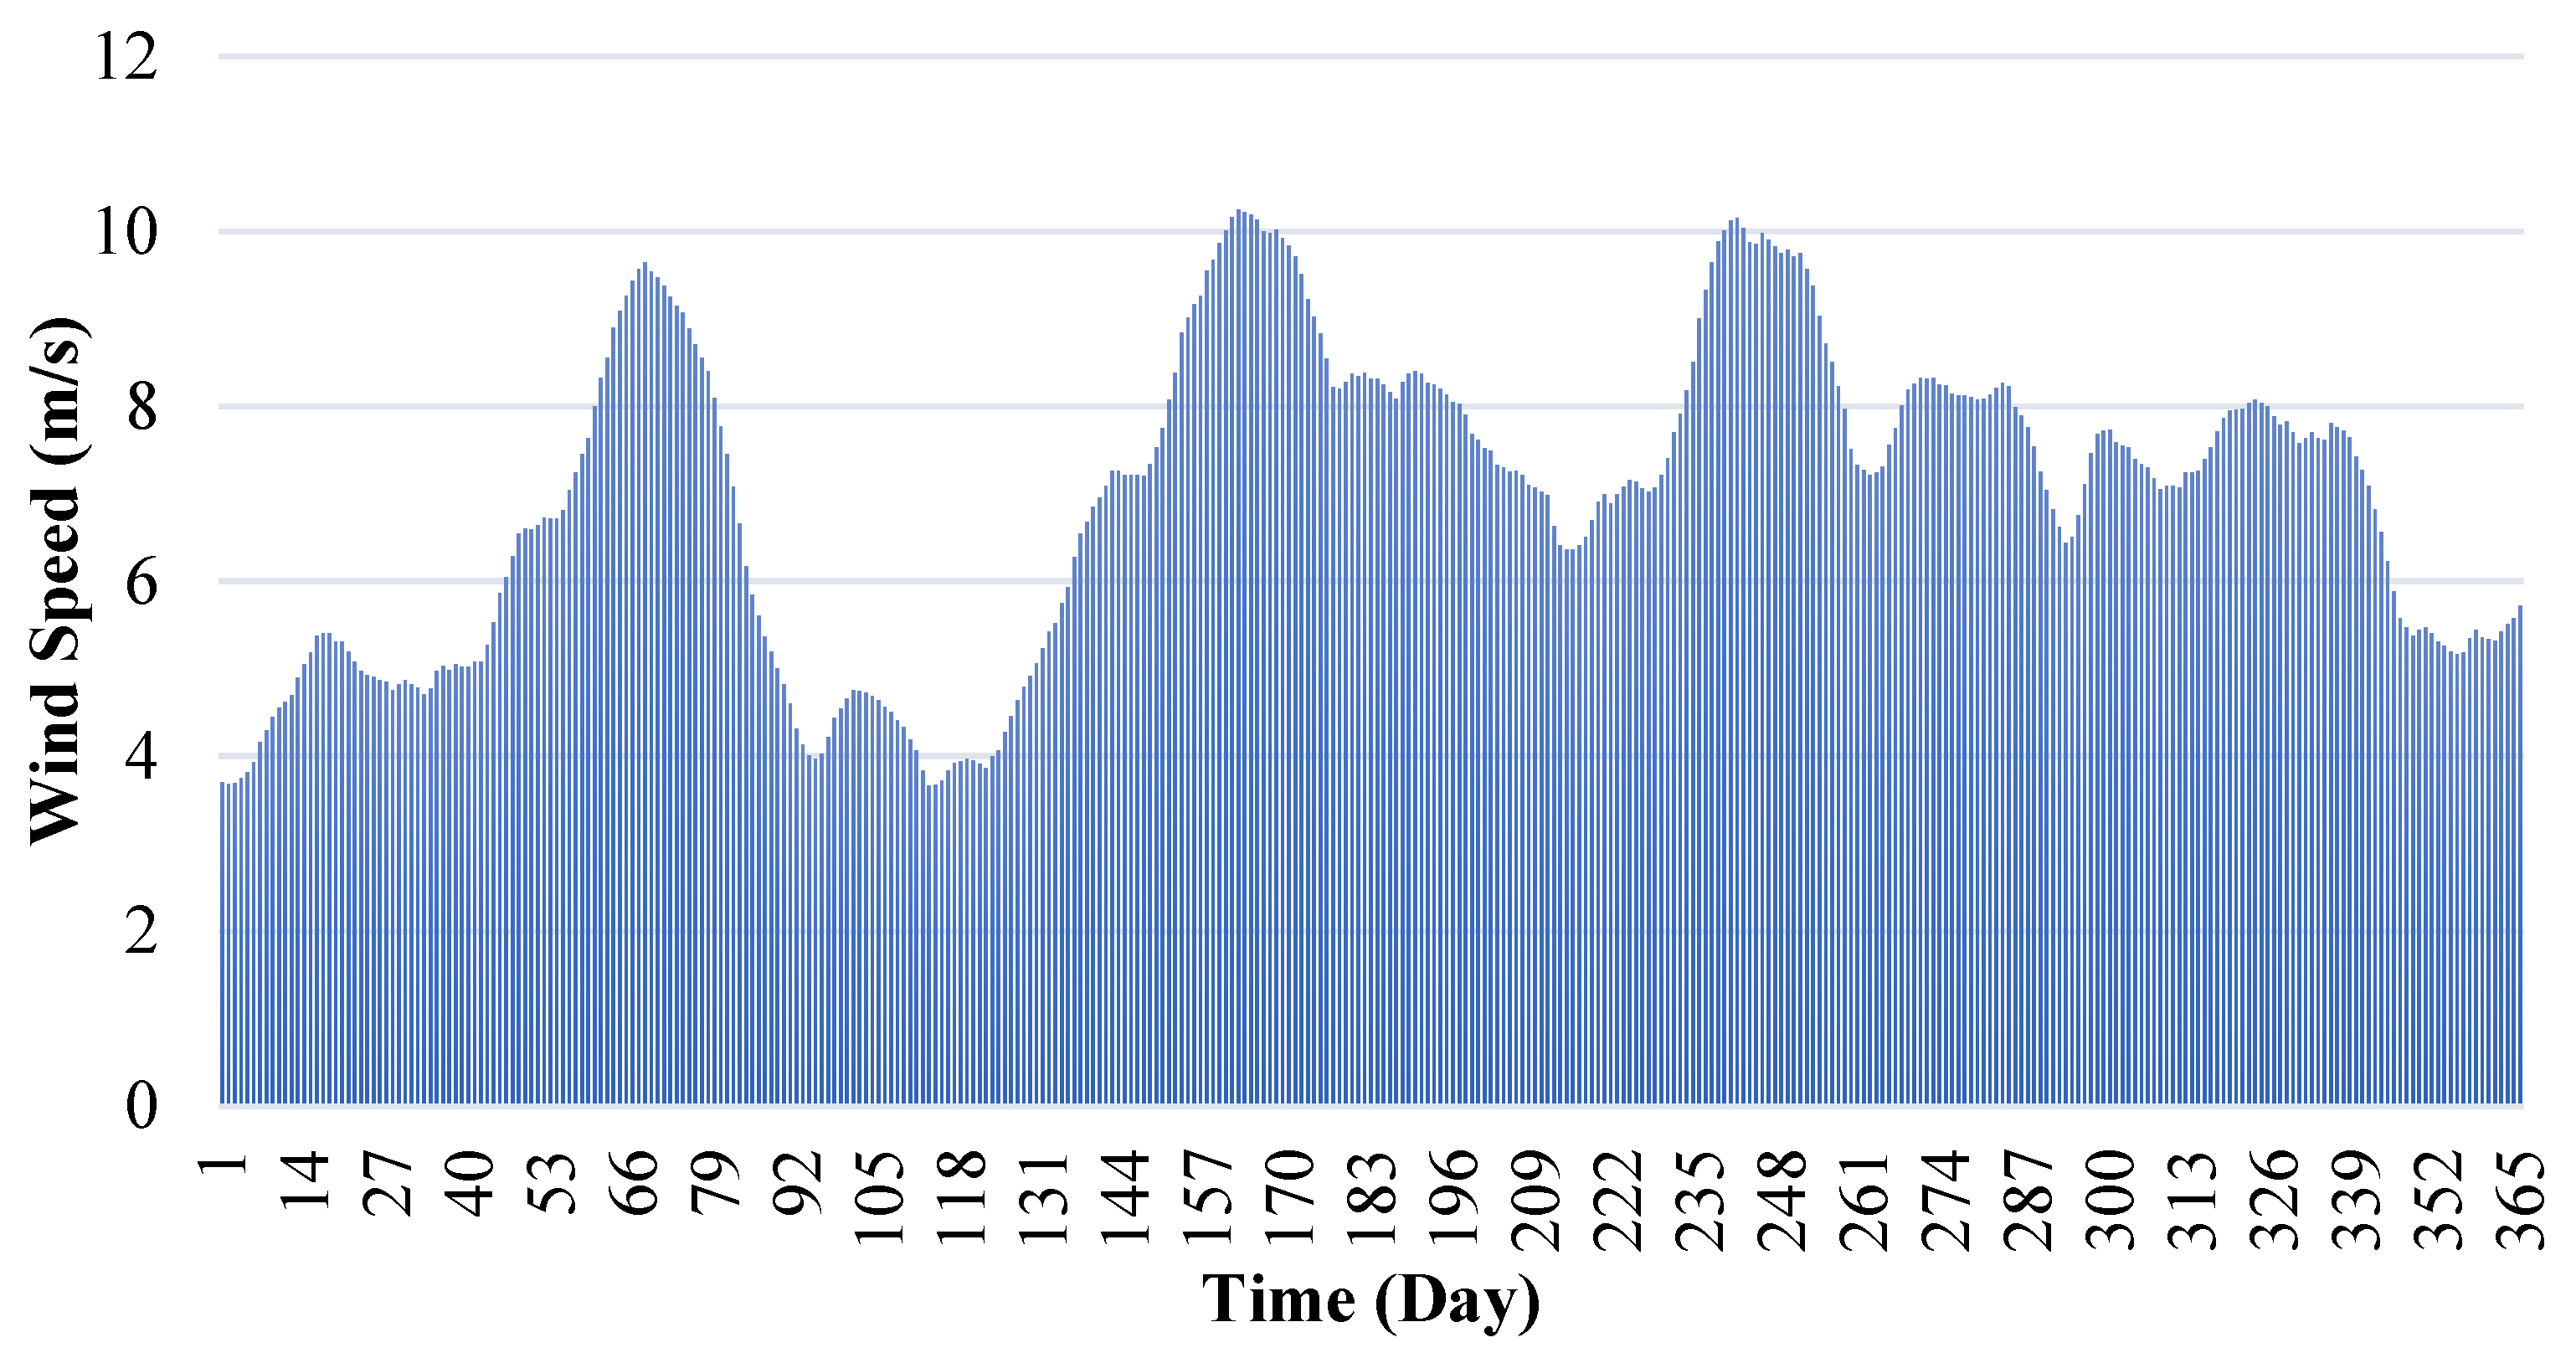
The hotel site also had a good wind resource potential as the mean power density is 574 W/m² from the global wind atlas, while the mean wind speed is 7.22 m/s [45]. The mean wind speed at 10 m elevation is 6.23 m/s, and the monthly average Petra Marriott Hotel location wind speeds are shown in Figure 8. The solar and wind resource data were used to conduct the HOMER software simulations.
The hotel consumes electricity through a local private transformer with a rated power of 630 kVA connected to the 33 kV distribution grid. The average electricity bill for this hotel is about USD 15,888, with an average consumption of 123 MWh per month, as shown in Figure 9, and 4126 kWh/day. Detailed consumption data for the selected month of April is shown in Figure 10. This data was used to choose a suitable hybrid system for the hotel to meet the load demand in every period.

3.2.2. Greenhouse-Gas Emission from Grid Electricity Production

Currently, 85.1% of grid electricity generation in Jordan is from the burning of conventional fuels, and about 15.1% is from renewable-energy resources [11]. A meeting was held with the head of the environmental assessment department of the Royal Scientific Society (RSS) to collect data, shown in Table 2, for greenhouse-gas emissions resulting from electricity generation in Jordan. The number of mitigated emissions using the new system compared to the existing system using output data for the proposed HRES. Fuel consumption for electricity generation is shown in Table 3 [11].
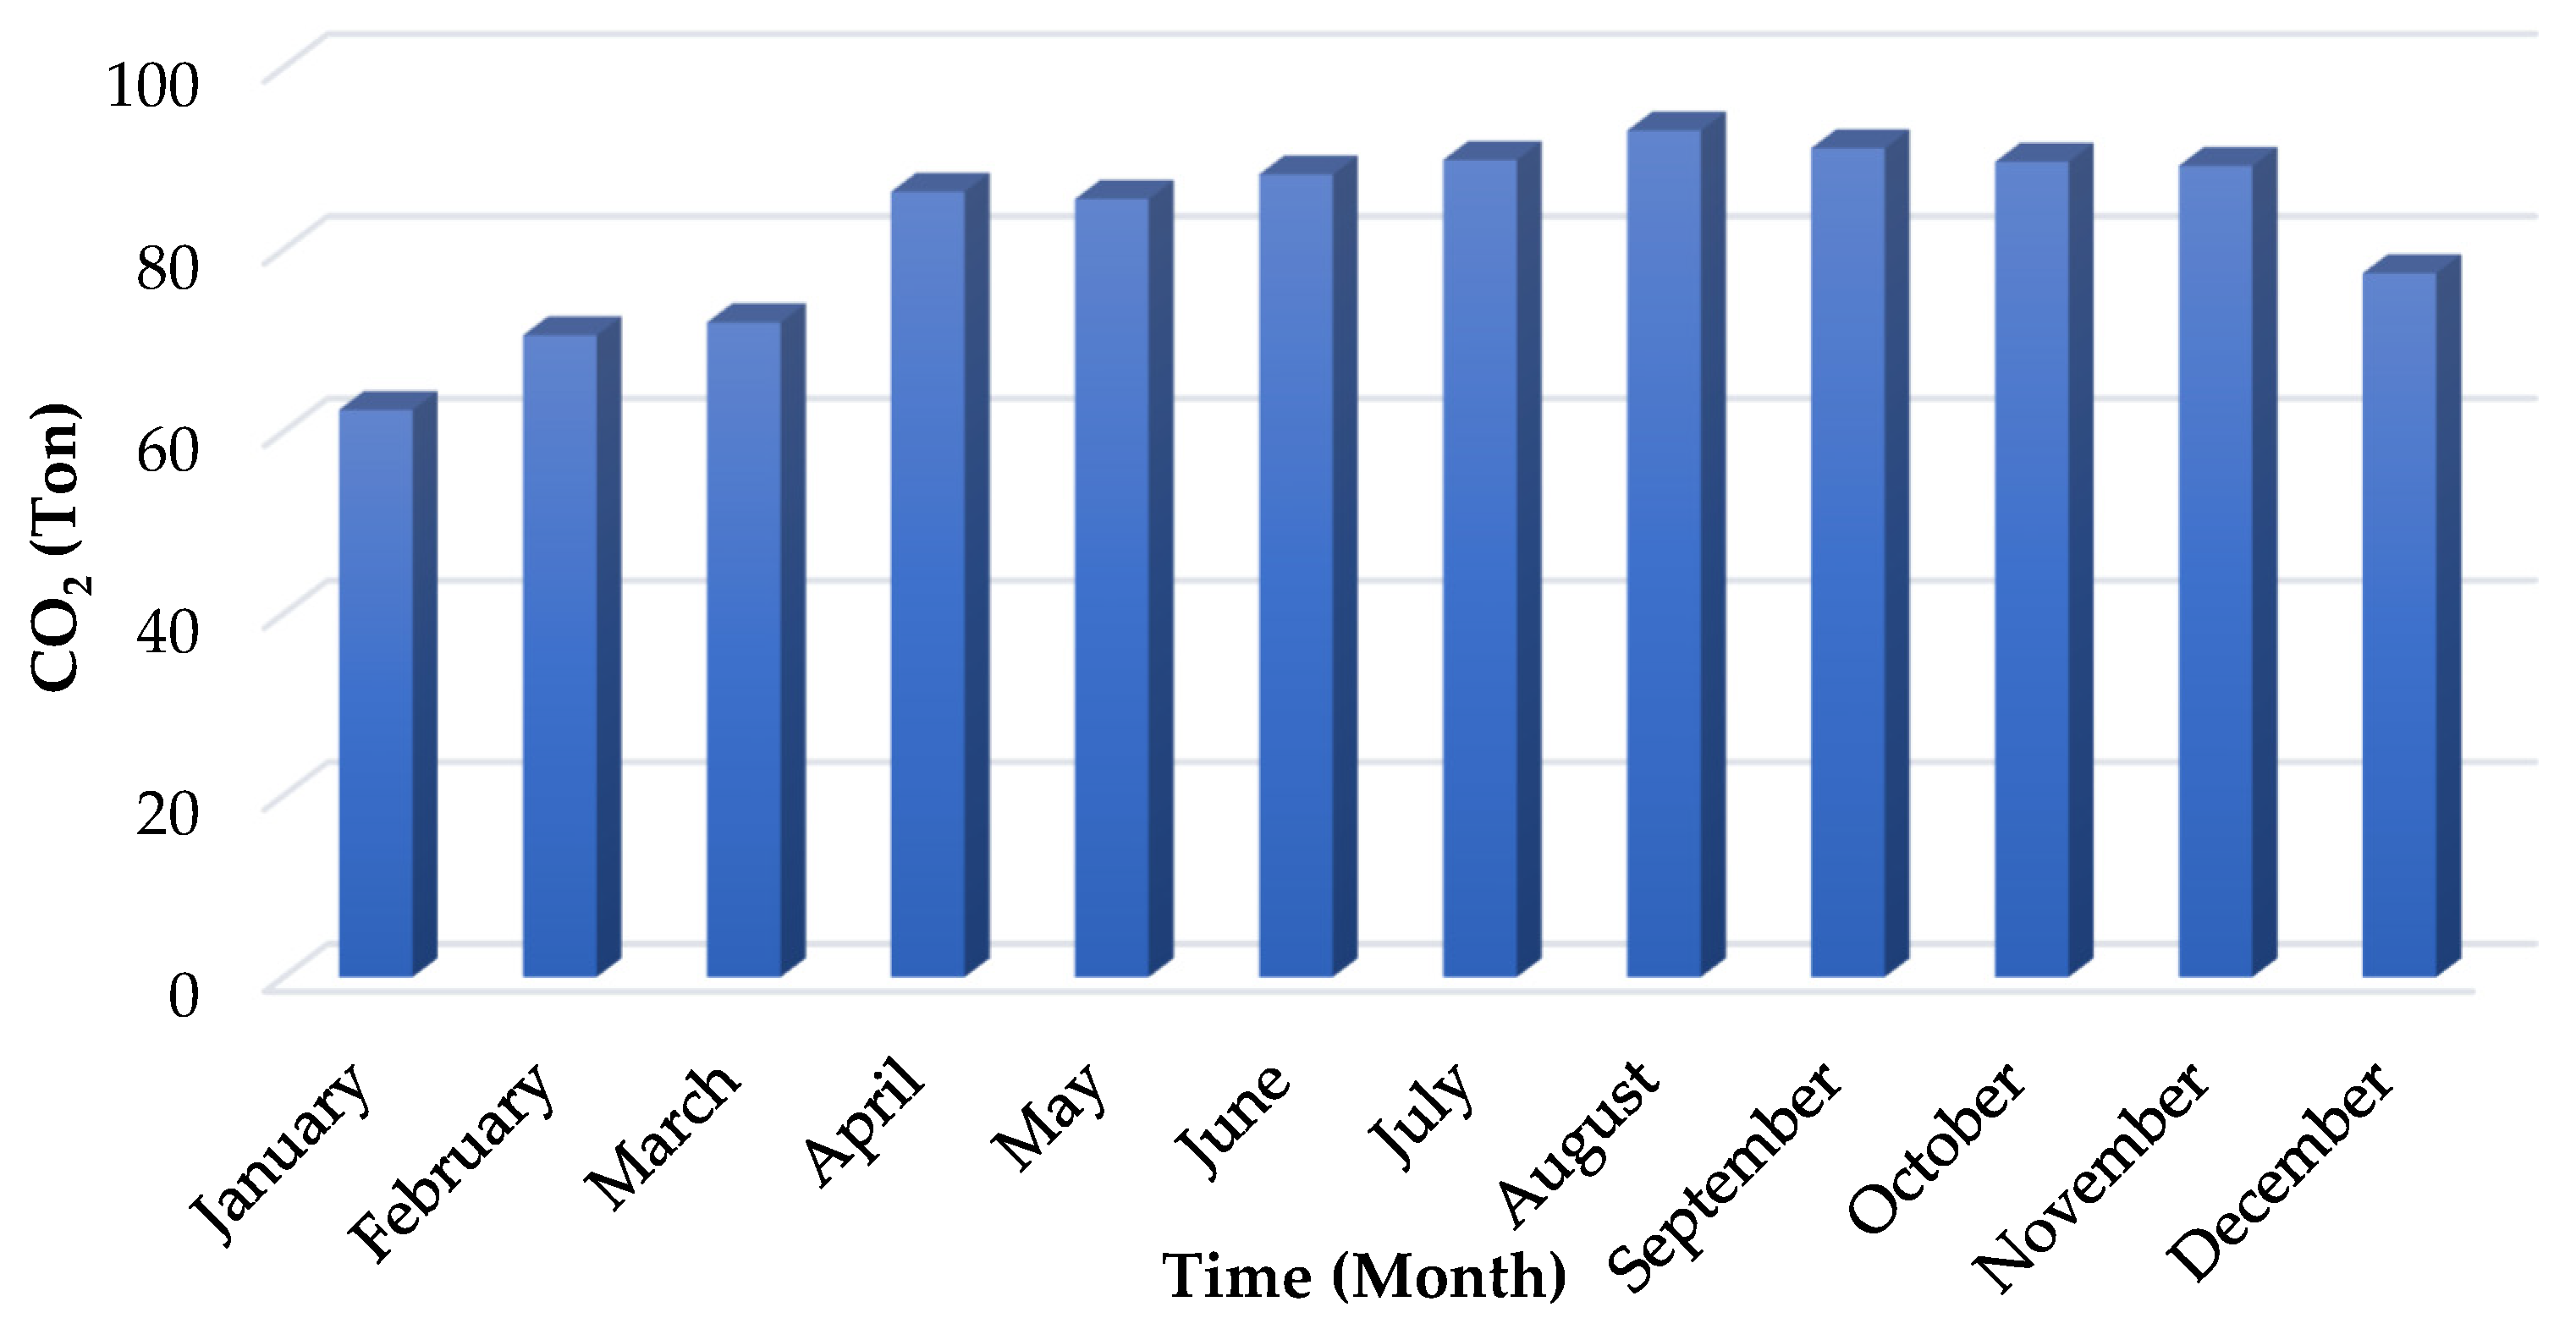
For every megawatt hour of electricity generated, 0.67 tons of CO2 are produced. Therefore, if this emission factor is applied to the Petra Marriott Hotel with 1485.52 MWh yearly, then 995.29 tons of CO2 are produced over one year (see Figure 11).
Economic data was collected from the local renewable-energy market, and a comparison was conducted at the simulation stage to show how the hybrid system can meet the desired applicability and cost-effectiveness requirements. The net present cost (NPC) can be calculated as follows [46]:
N P C = C T o t a l C R F i . t
where t is the project lifetime (years), CTotal is the total annualized cost of the system (USD/year), i is the annual real interest rate (%), and CRF is the capital recovery factor. The following equation calculates the annual real interest rate:
i = i f 1 + f
where i′ is the nominal interest rate (%), equal to 1.77% in Jordan according to the Department of Statistics [47], and f is the annual inflation rate (%).
The capital-recovery factor can be estimated as follows:
C R F i , n = i ( 1 + n ) n ( 1 + n ) n 1
and the COE can be computed using the following equation:
C O E = C a n n , T o t a l E T o t a l
where C a n n , T o t a l is the total annualized cost of the system (USD) and E T o t a l is the total electricity consumption per year (kWh/year). The annualized cost of a component is equal to its annual operating cost plus its capital and replacement costs annualized over the project lifetime.
The internal rate of return (IRR) is the discount rate for which the base case and current system have the same net present cost. The IRR is computed by determining the discount rate that makes the present value of the difference between the two cash-flow sequences equal to zero. The IRR can be calculated from the following equation [48]:
N P V = n = 0 N C n 1 + I R R n
where NPV is the net present value of the system (USD), n is the period (years), N is the total number of periods, and Cn is the cash flow (USD).
Simple payback is the number of years for which the cumulative cash flow of the difference between the current and base case systems switches from negative to positive. The payback indicates how long it would take to recover the difference in investment costs between the current system and the base case system and may be calculated using the following equation:
Payback   Period = I n i t i a l   i n v e s t m e n t Cash   flow   per   year

3.3. Design Specifications and Technical Model

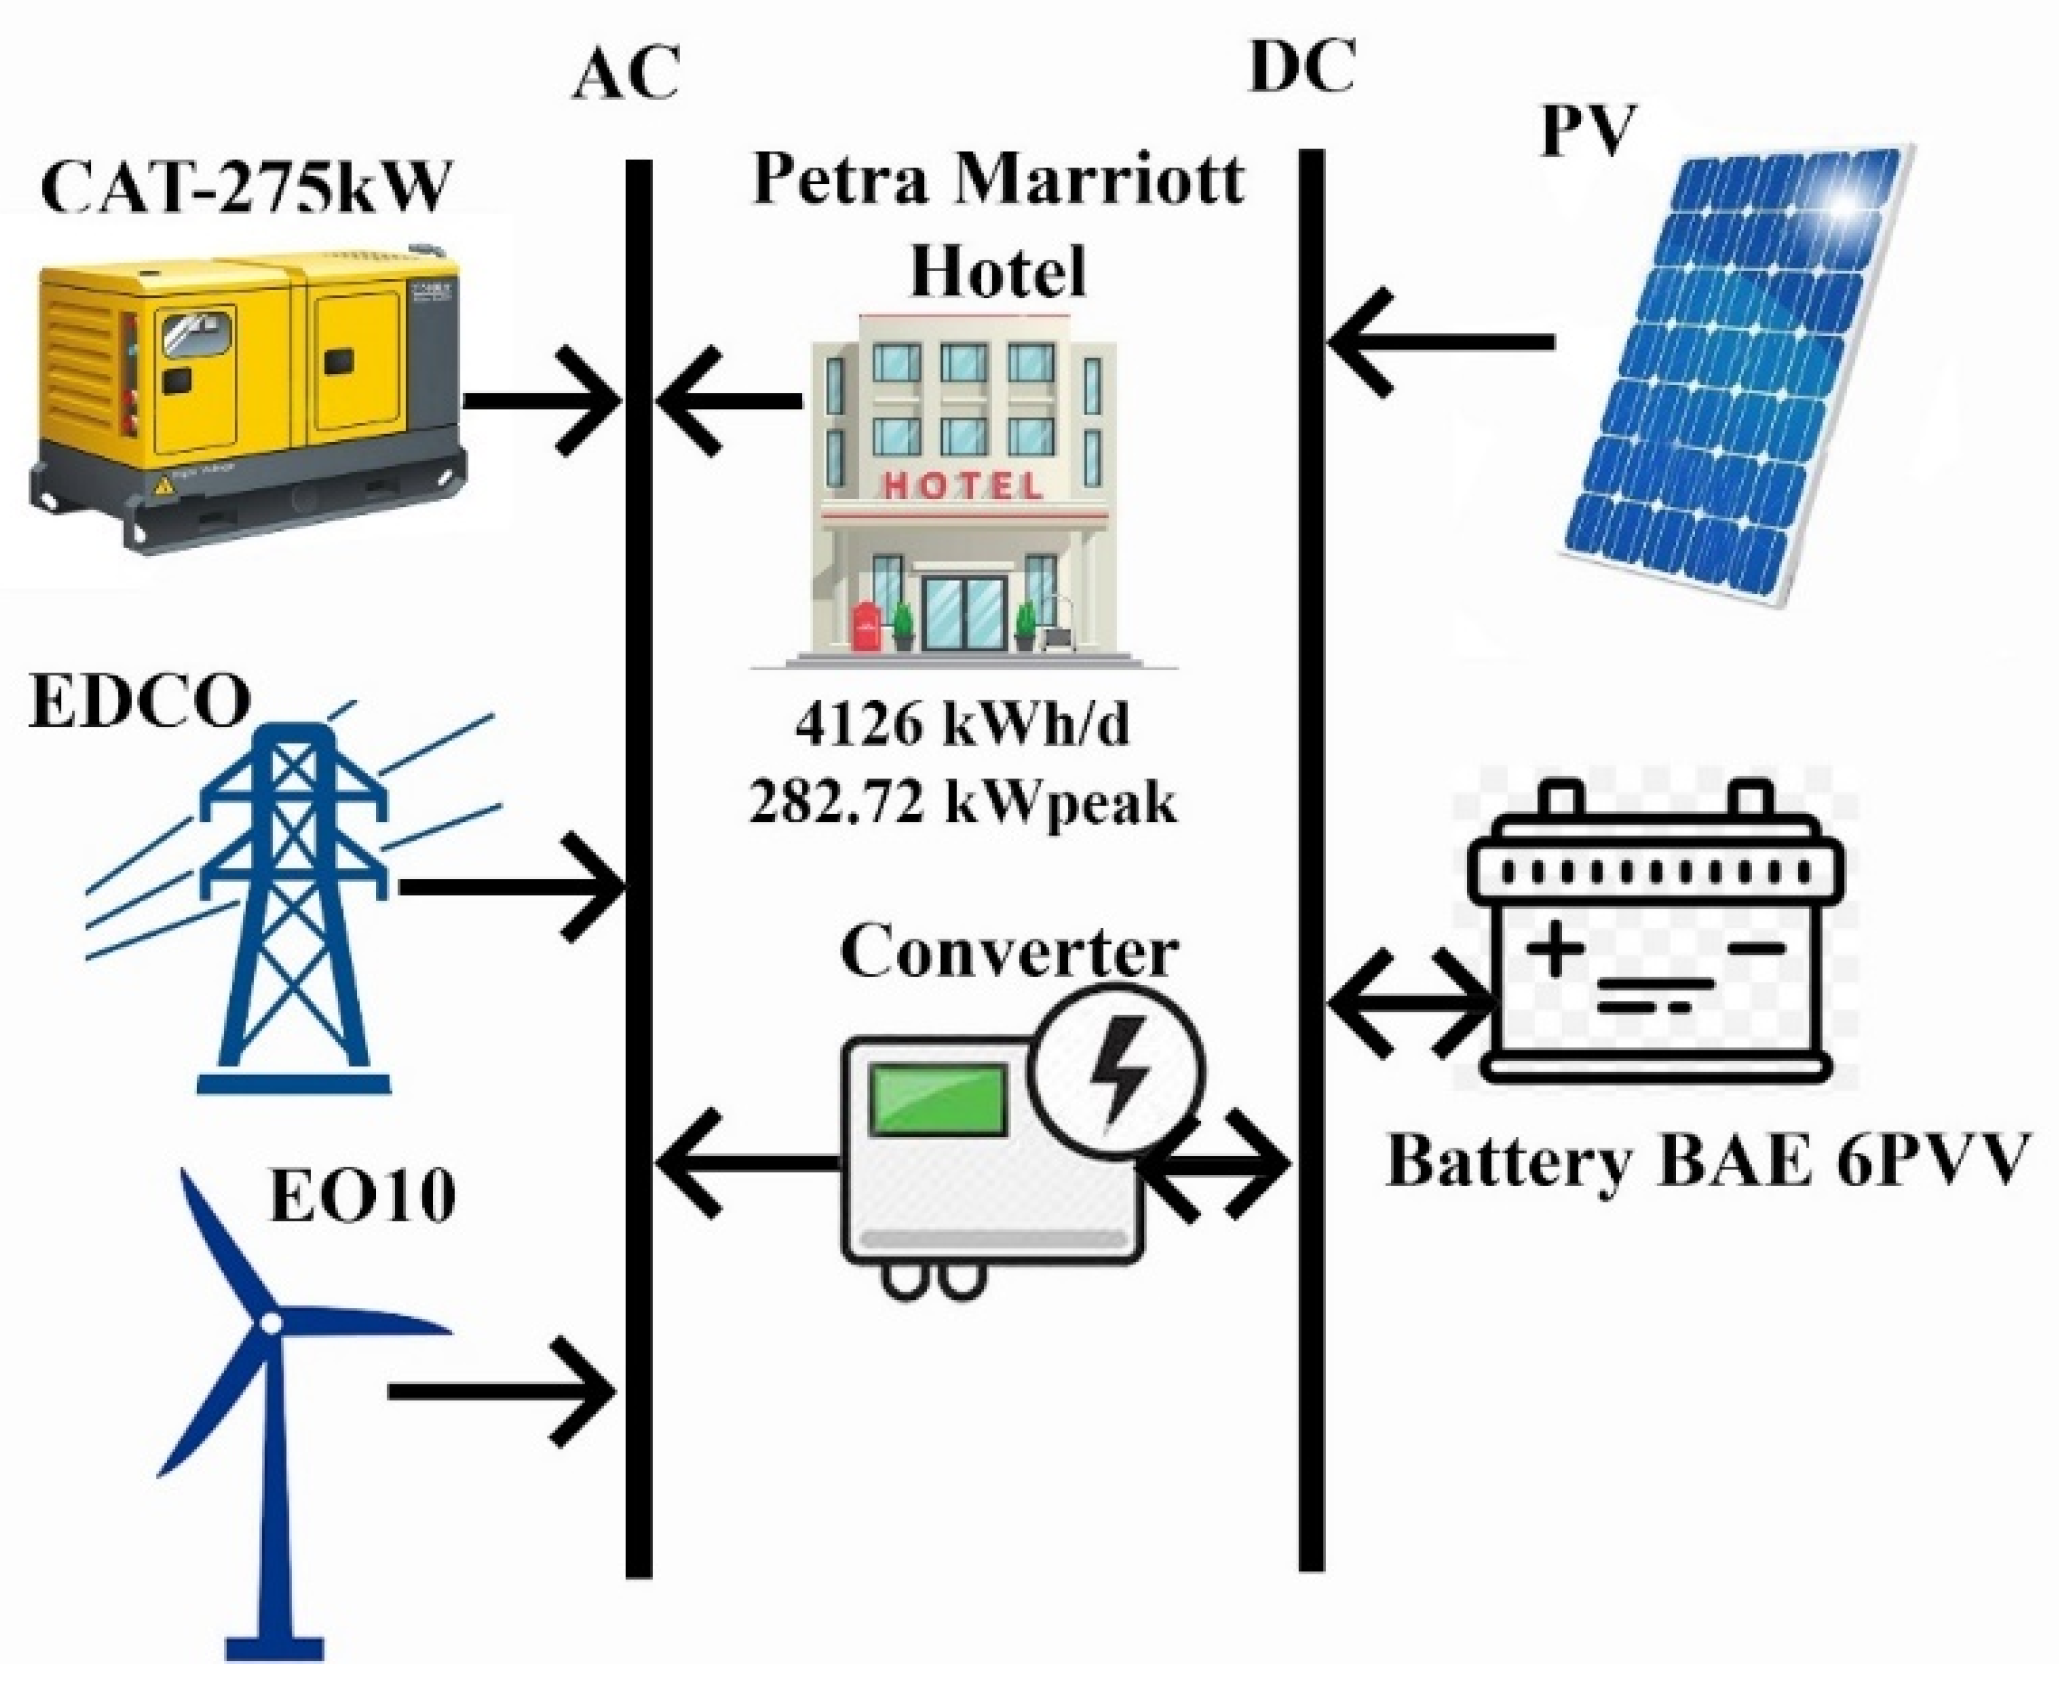
The general structure of the proposed HRES consists of solar PV, wind turbines, an electrical grid, and a power converter, as shown in Figure 12. The HRES components were selected as feasible preliminary technologies. The study location has a high solar irradiance (5.5 kWh/m2/day per year) and a good wind resource (mean wind speed of 6.23 m/s). Therefore, the solar PV system and wind turbine were determined to be the most efficient RE technology options for installation at the Petra Marriott Hotel. Furthermore, the electrical grid was included in the study to maintain the power balance between generation and consumption by exporting excess energy from the HRES as needed. A power converter (inverter) was added to the system to convert the direct current (DC) to alternating current (AC).

3.3.1. Solar Photovoltaic System

Photovoltaic panels collect solar irradiance and convert it into DC electrical power, which is then transformed into AC electrical power by the converter/inverter. Three types of solar PV panels were used in the simulation to determine the optimal configuration.
The first PV type used was the CanadianSolar HiKu5 Mono PERC CS3Y-475PV flat plate module with a 0.475 kW rated capacity, 21.2% efficiency, and a 25 year specified lifetime. The derating factor (DF) for these PV panels is 90%. The derating factor represents the difference due to losses and manufacturing deficiencies between power from field measurements and the rated power specified by the manufacturer. The nominal operating cell temperature (NOCT) is 45 °C. The PV panel is horizontally fixed at a slope of 20° and operates without a maximum power point tracking system. The capital and replacement costs were considered to be the same at USD 410/kW, and the operating and maintenance (O&M) cost is USD 12/kW/year [49], while the cost of the panels was obtained from the local market of various local solar companies. The capacity of the proposed PV system was determined through the HOMER software optimization. Some limitations were created by the electrical grid transformer and the hotel area and topographical terrain, whereas around 2000 m2 of the total case-study area.
The second type of PV panel used in the simulations was the LONGiSolar lr4-72hph-440m flat plate module with a 0.440 kW rated capacity, 21.1% efficiency, and 25 year specified lifetime. The DF for these PV panels is 90%, and the NOCT is 45 °C. The PV panel is horizontally fixed at a slope of 20° and operates without a maximum power point tracking system. The capital and replacement costs were considered the same at USD 380/kW, and the O&M cost is USD 12/kW/year [50].
The SunPower SPR-E20-327 flat plate module with a 0.370 kW rated capacity, 20.4% efficiency, and a 25 year specified lifetime was the third type of PV panel used in the simulations. The DF for these panels was 90%, with a NOCT of 45 °C. The PV panel is horizontally fixed at a slope of 20° and operates without a maximum power point tracking system. The capital and replacement costs were considered the same at USD 320/kW, and the O&M cost is USD 12/kW/year [51].
The power supplied to the load by the PV panels, considering the effect of temperature, was calculated as follows [52]:
P P V = f P V × Y P V × G T G s × 1 + α T c T c , r e f
where PPV is daily energy produced by one PV module (kWh), fPV is the PV derating factor (DF), YPV is the peak power output of the PV module, GT is the global solar irradiance incident on the surface of the PV array (kWh/m2), Gs is the incident radiation at standard test conditions (STC), α is the temperature coefficient of power, Tc is the PV module temperature (°C), and T(c,ref) is the PV module temperature at STC (°C).

3.3.2. Wind Turbine

The wind turbine can deliver sufficient power to the load from wind motion both in the daytime and at night. The Eocycle EO10 wind turbine model with a 10 kW rated capacity, a 16 m hub height, and a 20 year lifetime was used in the simulations. The Eocycle EO10 has cut-in and cut-off speeds of 2.7 m/s and 20 m/s, respectively. Capital and replacement costs were USD 56,000, while the O&M costs were assumed to be USD 200/year [53]. The output power from the wind turbine was calculated by determining the wind velocity at the hub height of the turbine using the following equation [54]:
P W T = 1 2 × ρ a × A × υ 3 × η
where ρ a is the air density (kg/m3), A is the swept area of the wind-turbine blades (m2), υ is the wind speed (m/s), and η is the wind-turbine total efficiency.

3.3.3. Power Inverter

DC electrical power generation from PV cells must be converted to AC electricity due to mainly AC power being used to drive electrical loads. A power converter (or inverter) was used to convert DC to AC electrical power and is a vital component in the system. This study used an ABB MGS100 converter with capital and replacement costs estimated to be USD 170/kW, a 15 year lifetime, and a 95% efficiency [55].

3.3.4. Electrical Network Grid

The system proposed is an on grid HRES, and the electrical distribution grid was included in the simulations and optimization. The operator of the distribution grid is the Electricity Distribution Company (EDCO). The case-study building (Petra Marriott Hotel) is connected to this grid through a transformer rated at 630 kVA at 33 kV rated grid voltage. Therefore, the grid power cost and sale price were the same at USD 0.13/kW and collected from EDCO (EDCO, 2021) as the grid is a net metering system.
Outages in the grid were defined within the simulation software using two parameters: resilience and reliability. Resilience is the ability of a system to respond to and recover quickly from an extended, multiday utility outage such as a natural disaster (e.g., hurricanes or wildfires). In such circumstances, only critical electrical loads should be serviced. The current study considered the resilience for outages of 0.02 days from grid data collected from the electrical distribution company. Reliability specifies grid outages as the failure frequency (outages per year) and their duration as the inputs. The HOMER grid simulation software generates the outage time series, displaying the outages and the mean repair time in a grid outages map (see Figure 13).

3.3.5. Diesel Generator

The diesel generator (DG) used in the simulations in this study was the existing diesel generator. This diesel generator has a 275 kW rated capacity, USD 44,000 capital and replacement costs, and O&M costs assumed to be USD 0.010/h. The minimum load ratio of the generator was 30%, the specified lifetime was 90,000 h, and the diesel fuel price was USD 0.7/L.
Hourly fuel consumption by the diesel generator is calculated as [56]:
F C D g e n t = α   P R + β   P t
where F C D g e n t is the diesel generator fuel consumption (L/h), P R is the rated power of diesel generator (kW), P t is the diesel generator power (kW), and α and β are constants.

3.3.6. Electrical Energy Efficiency

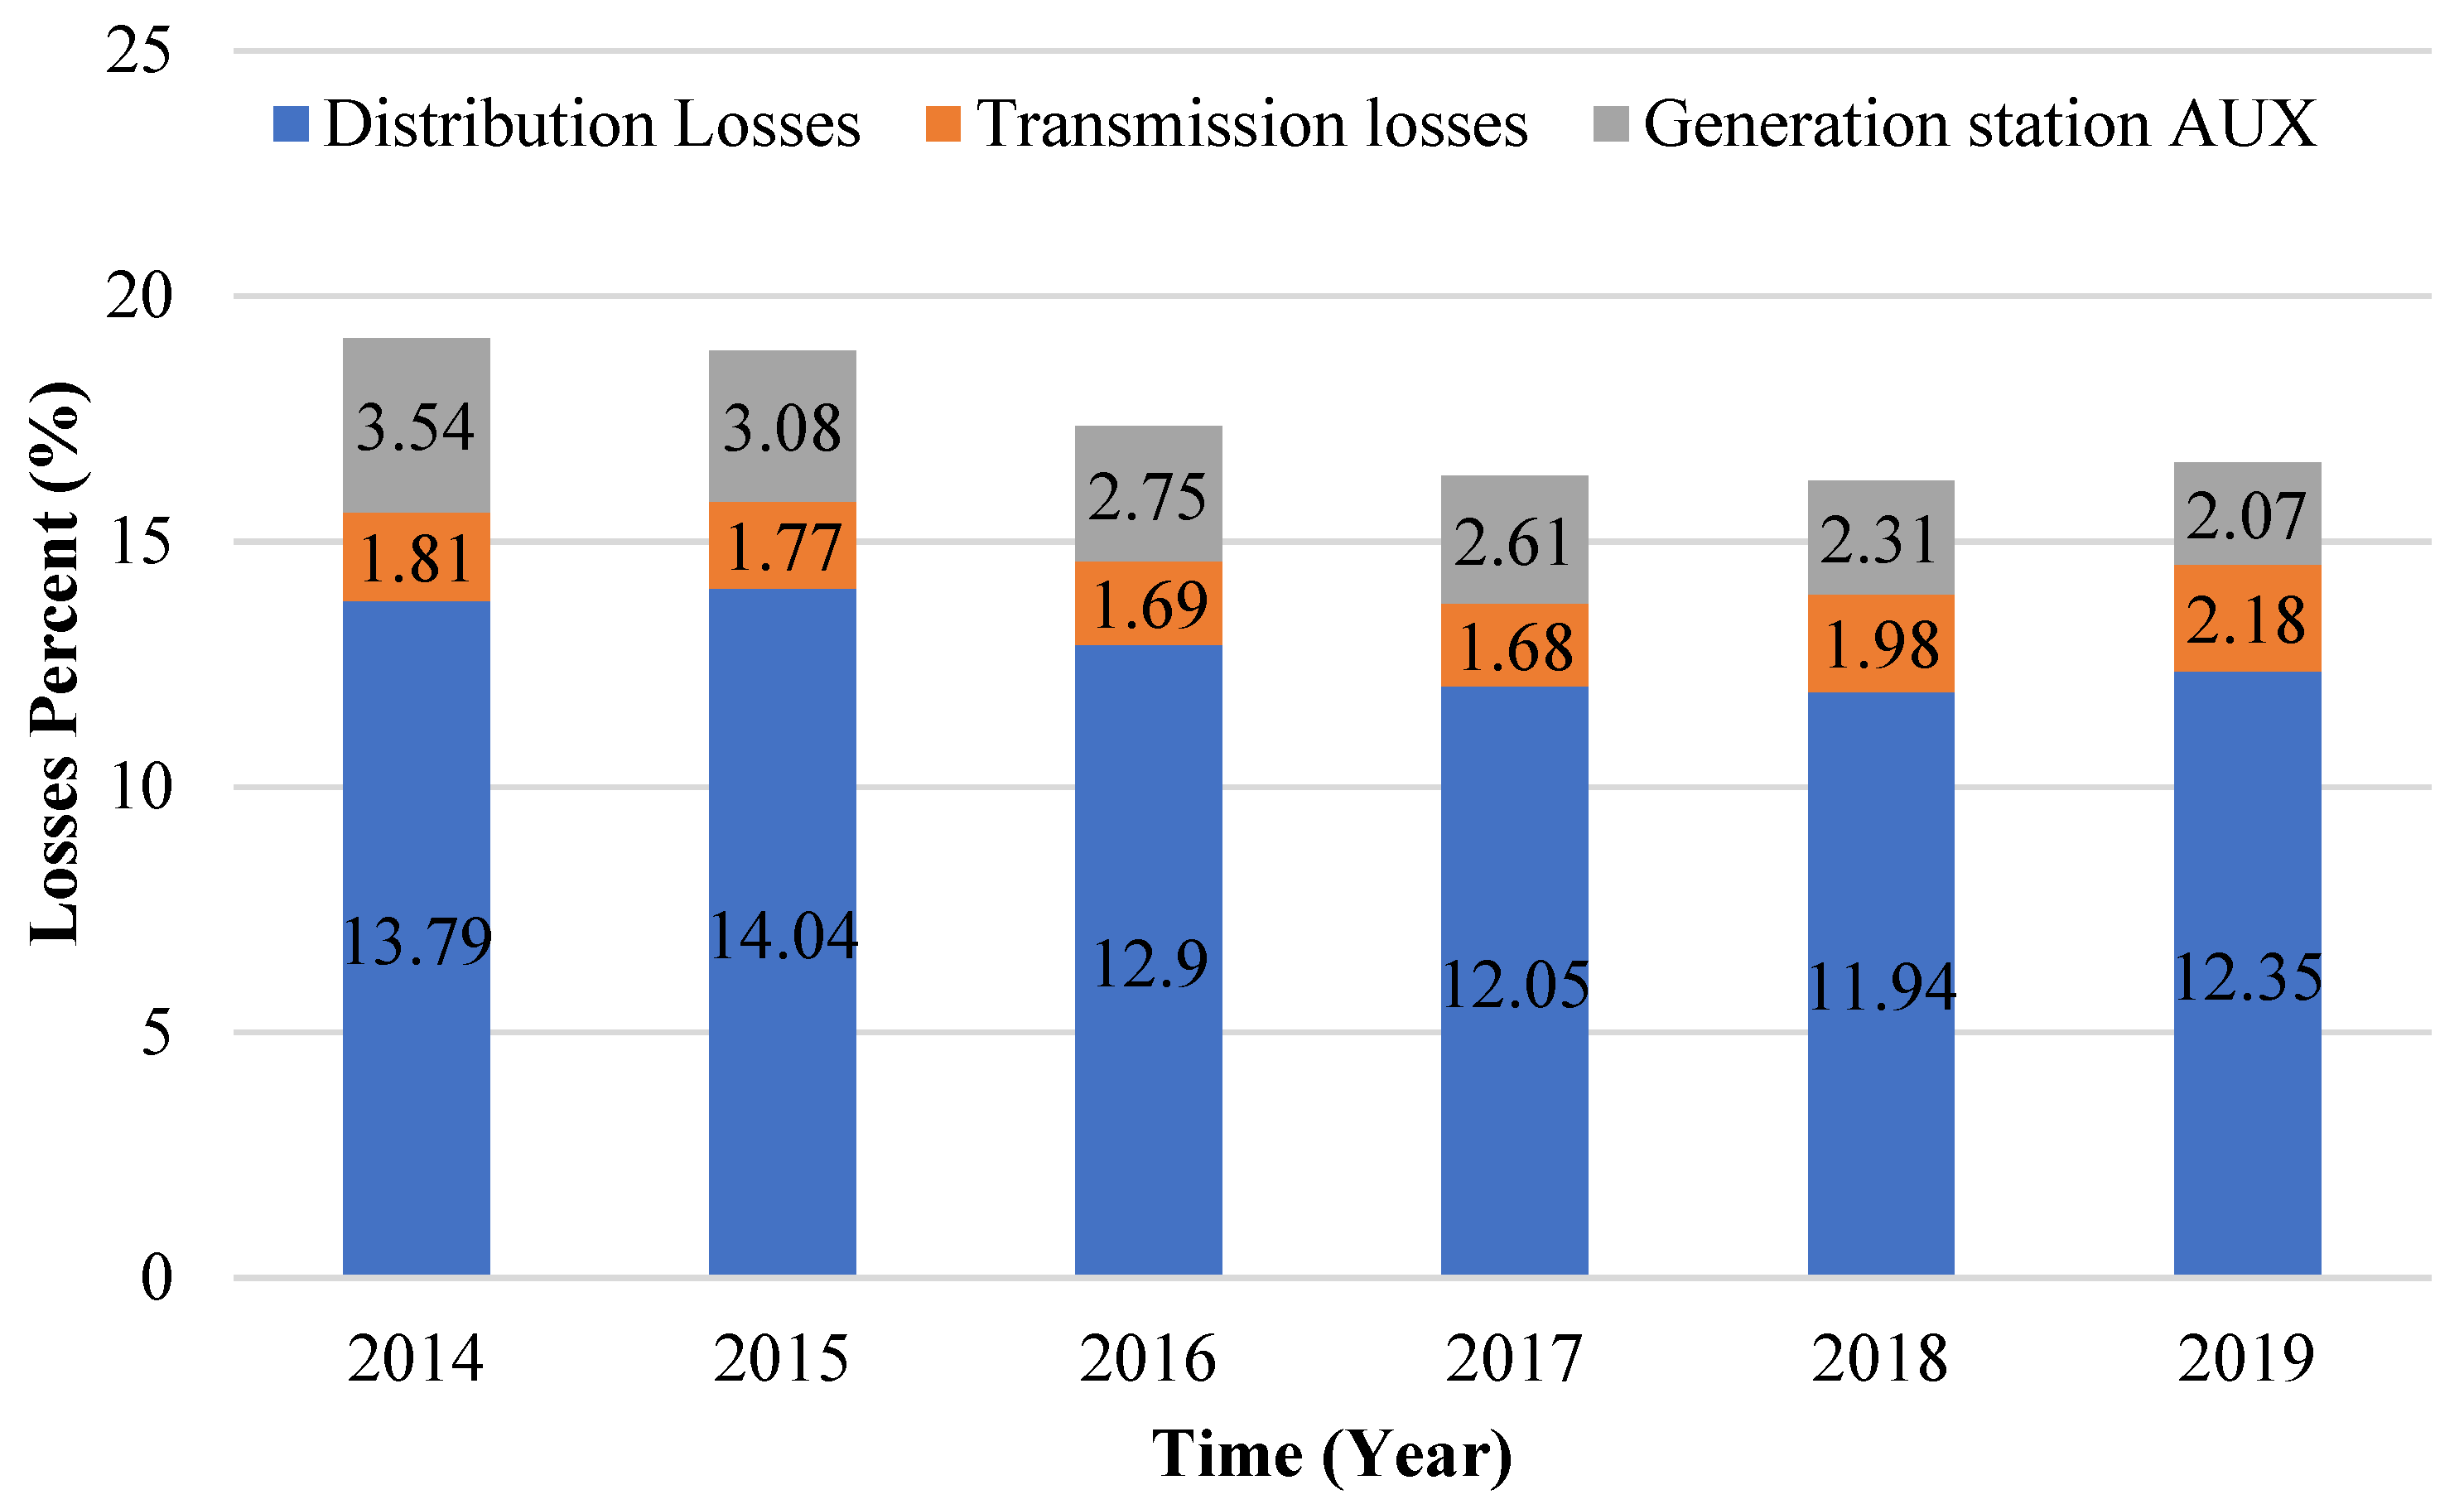
Due to the mitigation of electrical energy losses within the transmission, distribution, and generation station auxiliary systems, energy efficiency will improve when transitioning from a traditional electrical energy source to a hybrid renewable and sustainable energy source. In 2019, transmission, distribution, and generating station auxiliary losses were 2.18%, 12.35%, and 2.07%, respectively, as shown in Figure 14 [11]. The proposed HRES has no transmission or distribution network due to the generation of renewable-energy resources near the load using domestic resources. In contrast, the national electric grid uses long transmission lines since the generating station’s location is far from the loads. The conventional generation process needs to be close to fossil-fuel storage, typically in a remote area. Therefore, an HRES will improve electrical energy efficiency by about 16% compared to conventional production.

3.3.7. Battery System

The storage system used in the simulations in this study was a battery bank. The battery type was BAE SECURA SOLAR 6 PVV 900 with a 1.89 kWh rated capacity, USD 795 capital and replacement costs, and assumed O&M costs of USD 0.010/year. The maximum capacity is 947 Ah, and the string size is one. Using a storage system in the on grid hybrid system can be inefficient due to the surplus electrical energy production from the renewable-energy systems that can be stored in the grid as net metering power. In addition, the diesel generator can limit the dependence on the storage system even in emergencies since the operation and maintenance cost of a DG is less than for a battery.

4. Results

This section presents the results of various scenarios considered in the current study. Table 4 summarizes different simulation input parameters used to generate the results for the HRES scenarios. The data illustrate the economic and environmental values, including net percent cost (NPC), cost of energy (COE), and return of interest (ROI). Table 4 also illustrates the total system GHG emission values, mainly the carbon dioxide gas emissions, for each case. In Table 4, RF indicates the percentage of renewable-energy introduced into the design. The simulation software also gives the selected optimal capacities for each component in each configuration and the cost summary of items. Figure 15 shows an optimization plot of the total NPC against CO2 emissions. In the simulation process, 5950 solutions, or system configurations, were simulated. One case has been selected from these configurations, the dot with the lowest CO2 emissions in Figure 15, as the optimal solution (the winning scenario).
Table 5 illustrates the money that an HRES can save. The annualized utility grid bill savings for the last-ranked system (Case 3) was USD 151,427/year and USD 237,389/year for the optimal winning system (case 5). The internal rate of return (IRR), the expected compound annual rate of return earned on a project, varies from 11.6% for the third configuration to 33.7% for the second configuration. This difference is because the IRR depends on the grid bill savings mainly through operating costs. There was some fuel consumption even for the optimal scenario (375 L/year) since, for some operating conditions and emergencies, the DG must be used to maintain the delivery of electricity to the load. The highest fuel consumption for any case was at 745 L/year.
In Table 4, the different designs were ranked by their net percent cost (NPC) value, with the lowest NPC as the first and winning configuration. In contrast, the highest NPC value was the least desirable configuration. The system components for each case are shown and compared to the base-case components (DG and grid). The highest NPC was USD 2.54 M due to the dependence on grid power and the DG during emergencies. The grid bill for the base case was highest at USD 1.5 M since the primary source of electrical power was from the national electrical grid (EDCO), so the cost of energy was the grid purchase cost (USD 0.13/kWh). The second and third configurations were ranked last due to their high energy cost compared to the winning configuration.
The last-ranked (fifth-ranked) case was the third configuration consisting of a wind turbine, DG, converter, and batteries. The NPC was USD 2.09 M, and the COE and renewable-energy fraction were USD 0.096 and 69.6%, respectively. Also, the replacement cost was considered high at USD 493 K due to the use of batteries and wind turbines. This configuration’s batteries and wind turbines also raised the capital cost to USD 1.19 M, salvage cost to around USD 201 K, and operating cost to USD 615,529. The grid consumption drops to a suitable value of about USD 507 K with 321,993 kg/year GHG emissions due to the use of the WT. The discounted payback was 10.1 years, and the simple payback was 7.60 years. From the optimization results, the proposed fifth winning scenario, HRES sizing configuration excluded PV arrays, 490 kW inverter, and included Eocycle EO10 wind turbines. In addition, the diesel generator was the 160 kW DG2 (CAT-200kva), with a storage battery of 89 strings (BAE SECURA SOLAR 6 PVV 900).
The second configuration of PV, DG, converter, and batteries was ranked fourth, with an NPC of USD 1.257 M and COE and RF values of USD 0.049 and 56%, respectively. The replacement cost was considered low at USD 43 K since wind turbines were not included. The capital cost was also low at USD 431 K, the salvage cost was around USD 16 K, and the operating cost was USD 828,517. The grid consumption drops to a value of around USD 865 K which is considered to be high. GHG emissions were reduced to 549,777 kg/year, though this is unremarkable and is due to the grid share of the system energy. The discounted payback was 3.35 years, and the simple payback was 2.95 years. From the optimization results, the fourth winning HRES configuration was proposed with 982 kW (SUNPOWER SPR-E20-327) PV arrays, 403 kW inverter, and excludes wind turbines. The generator was DG1 (275 kW CAT-C9 Prime DG), and a six-string storage battery (BAE SECURA SOLAR 6 PVV 900) was used.
The first configuration, including PVs, DG, and a converter, was the third-ranked choice, having an NPC of USD 1.275 M and COE and RF of USD 0.049 and 56%, respectively. Since this configuration is the same as the previous one, though without batteries, the replacement cost was the lowest at USD 29 K since wind turbines and batteries were excluded. The capital cost was also the lowest at USD 420 K, and the salvage cost was around USD 9 K, while the operating cost was USD 804,476. Grid consumption dropped to about USD 861 K, which is still considered high. GHG emissions showed a substantial reduction at 218,170 kg/year, while the discounted payback was 3.46 years, and the simple payback was 3.05 years. Therefore, this design was proposed with 1050 kW (SUNPOWER SPR-E20-327) PV arrays, 413 kW inverter, and a DG1 (275 kW CAT-C9 Prime) diesel generator, excluding wind turbines and batteries.
Ranked second was the fourth configuration consisting of PVs, WTs, DG, converter, and batteries. The NPC had a high cost of USD 1.17 M, and the COE and RF were USD 0.0419 and 84.1%, respectively. However, the replacement cost was considered high at USD 385 K due to the use of wind turbines and batteries. The capital cost was also high at USD 1.40 M, the salvage cost was around USD 215 K, and the operating cost was USD 396,753 due to the energy sold to the grid from excess production. The grid consumption dropped to around USD 343 K and is considered a low grid bill. GHG emissions showed an unremarkable reduction of 218,170 kg/year due to the grid energy share. The discounted payback was 7.60 years, and the simple payback was 5.99 years. This HRES configuration included 562 kW (SUNPOWER SPR-E20-327) PV arrays, a 304 kW inverter, 20 Eocycle EO10 wind turbines, a DG1 (275 kW CAT-C9 Prime) diesel generator, and a two-string storage battery (BAE SECURA SOLAR 6 PVV 900).
The winning design was the fifth configuration, including PVs, WTs, DG, and a converter, with a high NPC cost of USD 1.17 M. The COE and RF were USD 0.0415 and 84.1%, respectively. The replacement cost was considered high at USD 379 K due to the use of wind turbines. The capital cost was also high at USD 1.40 M, the salvage cost was around USD 216 K, and the operating cost was USD 403,238 due to the energy sold to the grid from excess production. Grid consumption drops to a low value of around USD 344 K. GHG emissions were reduced unremarkably to 218,497 kg/year due to the share of energy from the grid. The discounted payback of 7.59 years and the simple payback of 5.98 years were the lowest values of any case.
The cost summary for this winning configuration is provided in Figure 16a, and the overall cost is less than the base case. Figure 16b shows the cash flow for the optimal configuration by component over the project lifetime. The wind turbines dominate the cash flow due to their enormous capital cost and O&M, though by the end of the project life, the WTs save money.
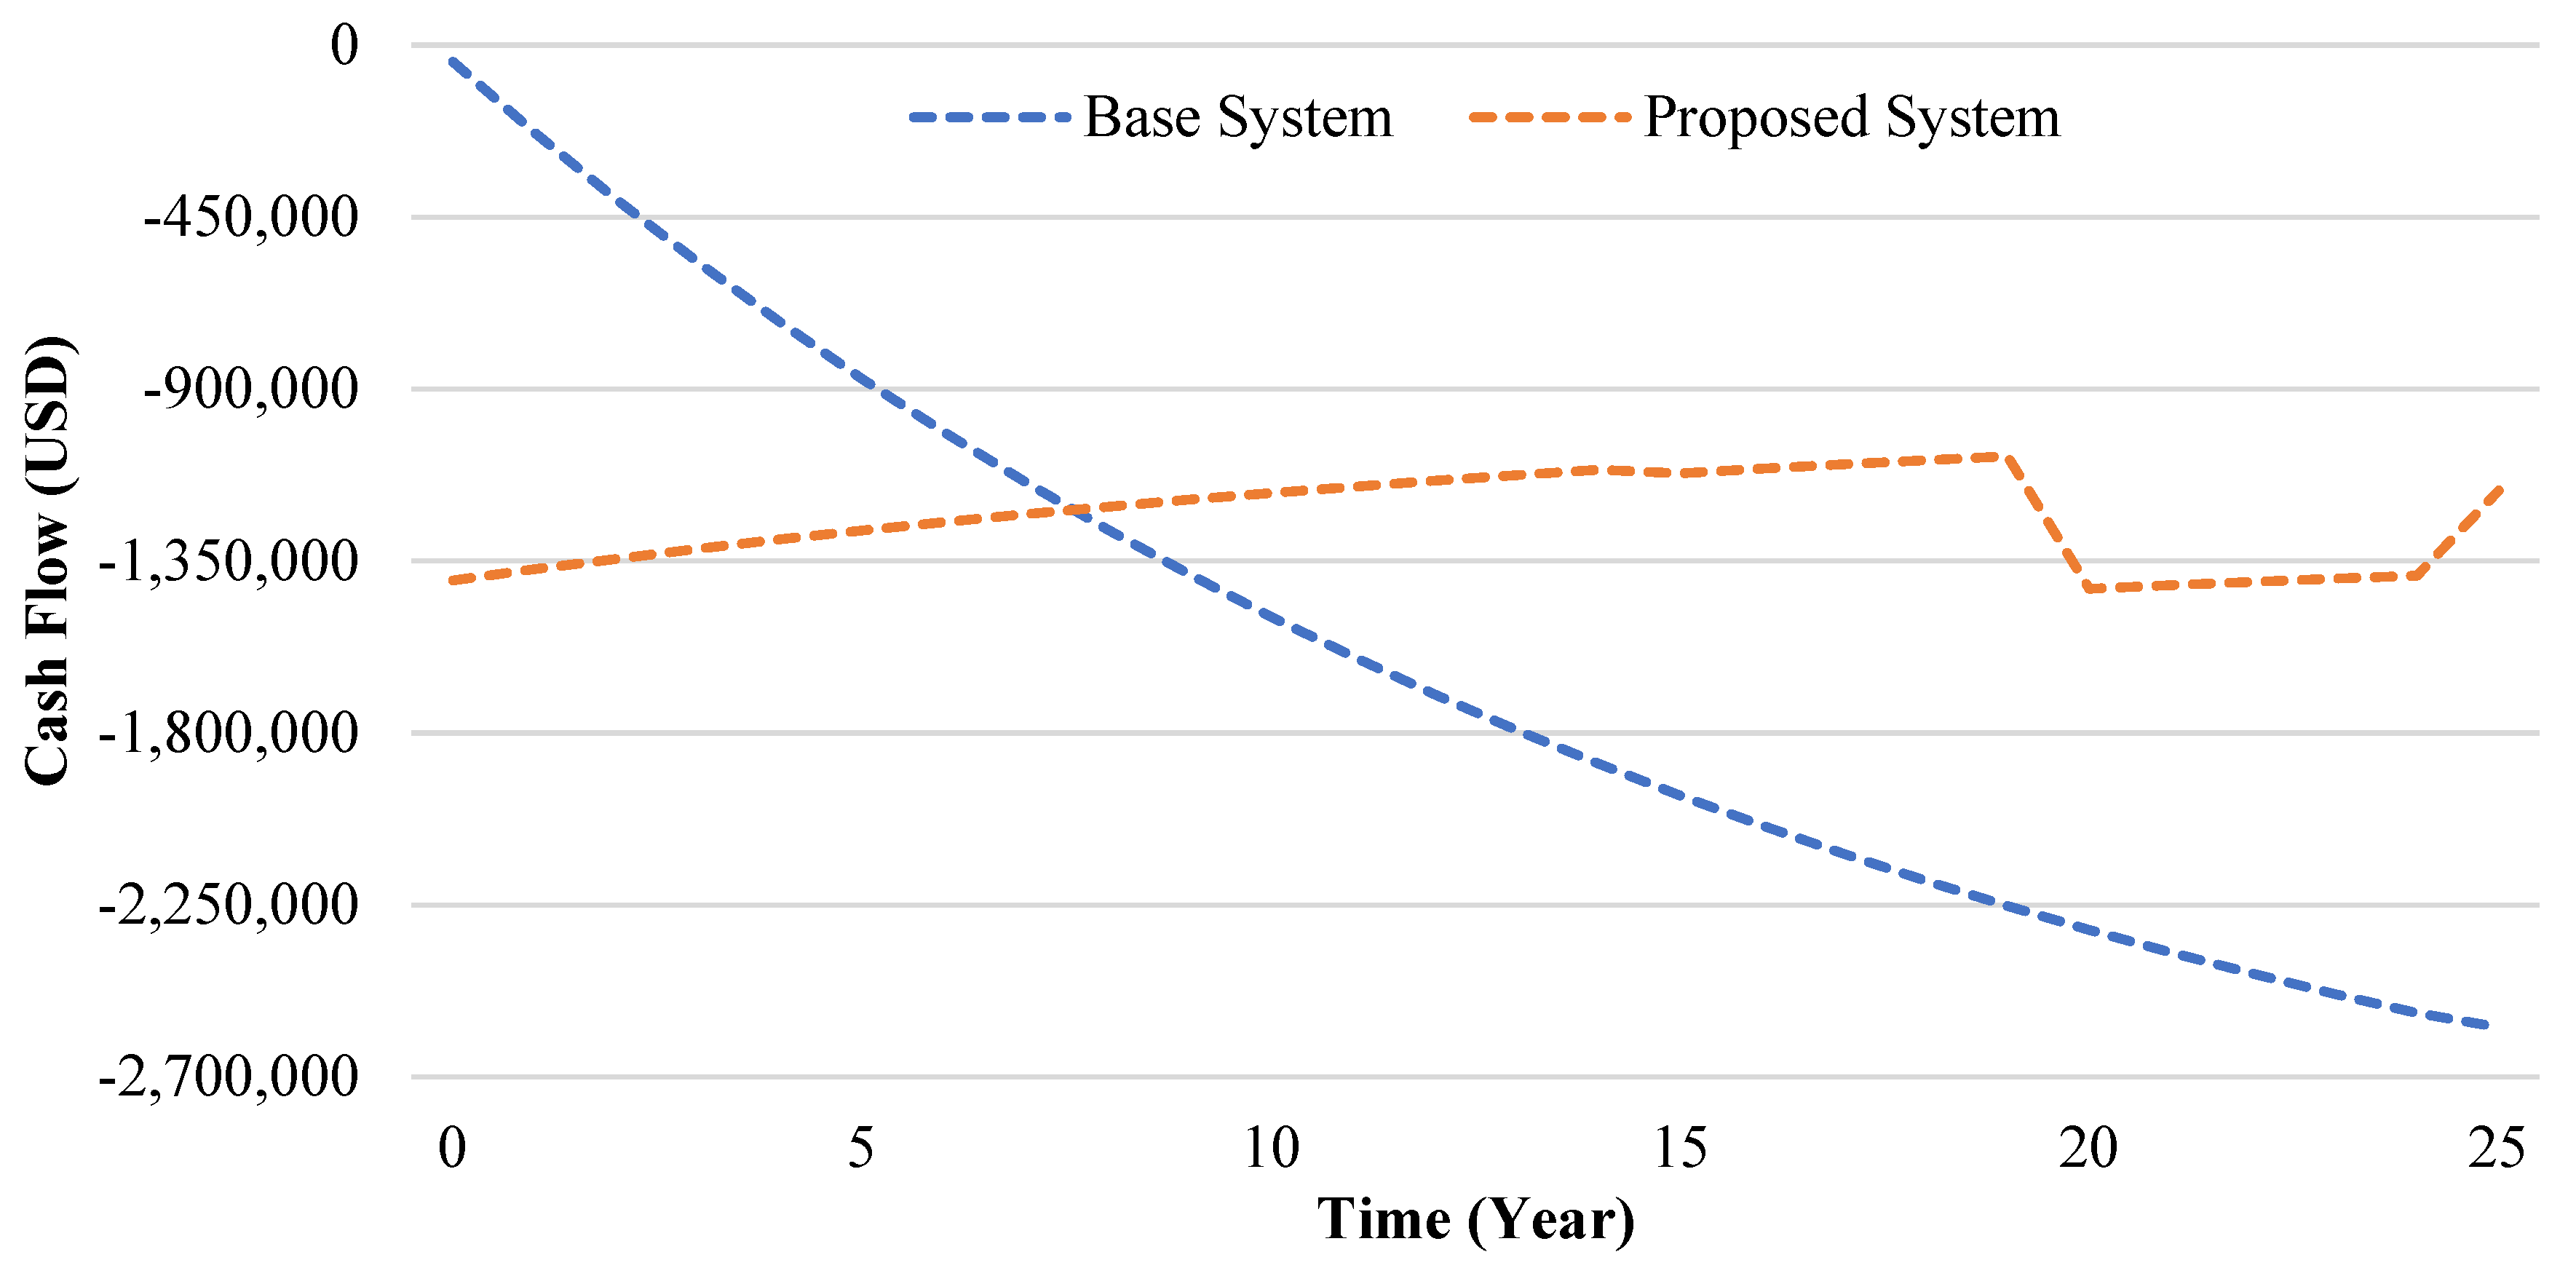
Figure 17 shows the cumulative nominal cash flow for the base and winning (optimal) systems. While the base system cash flow becomes more negative over the project lifetime, the winning system cash flow gradually increases over time. The drop in cumulative nominal cash flow for the optimal system at around 20 years is due to the high replacement cost of the WTs.
The winning HRES configuration was proposed with 573 kW SUNPOWER SPR-E20-327 PV arrays from the optimization result. PV energy production in the summer was higher than in winter due to the higher solar irradiance and longer days. The average power was around 400 kW from the PVs, 317 kW inverter, and 20 Eocycle EO10 wind turbines. The energy production from the wind turbines was reasonably constant due to wind availability over most of the year. The generator used was a DG1 (275 kW CAT-C9 Prime) diesel generator, which already exists in the base case.
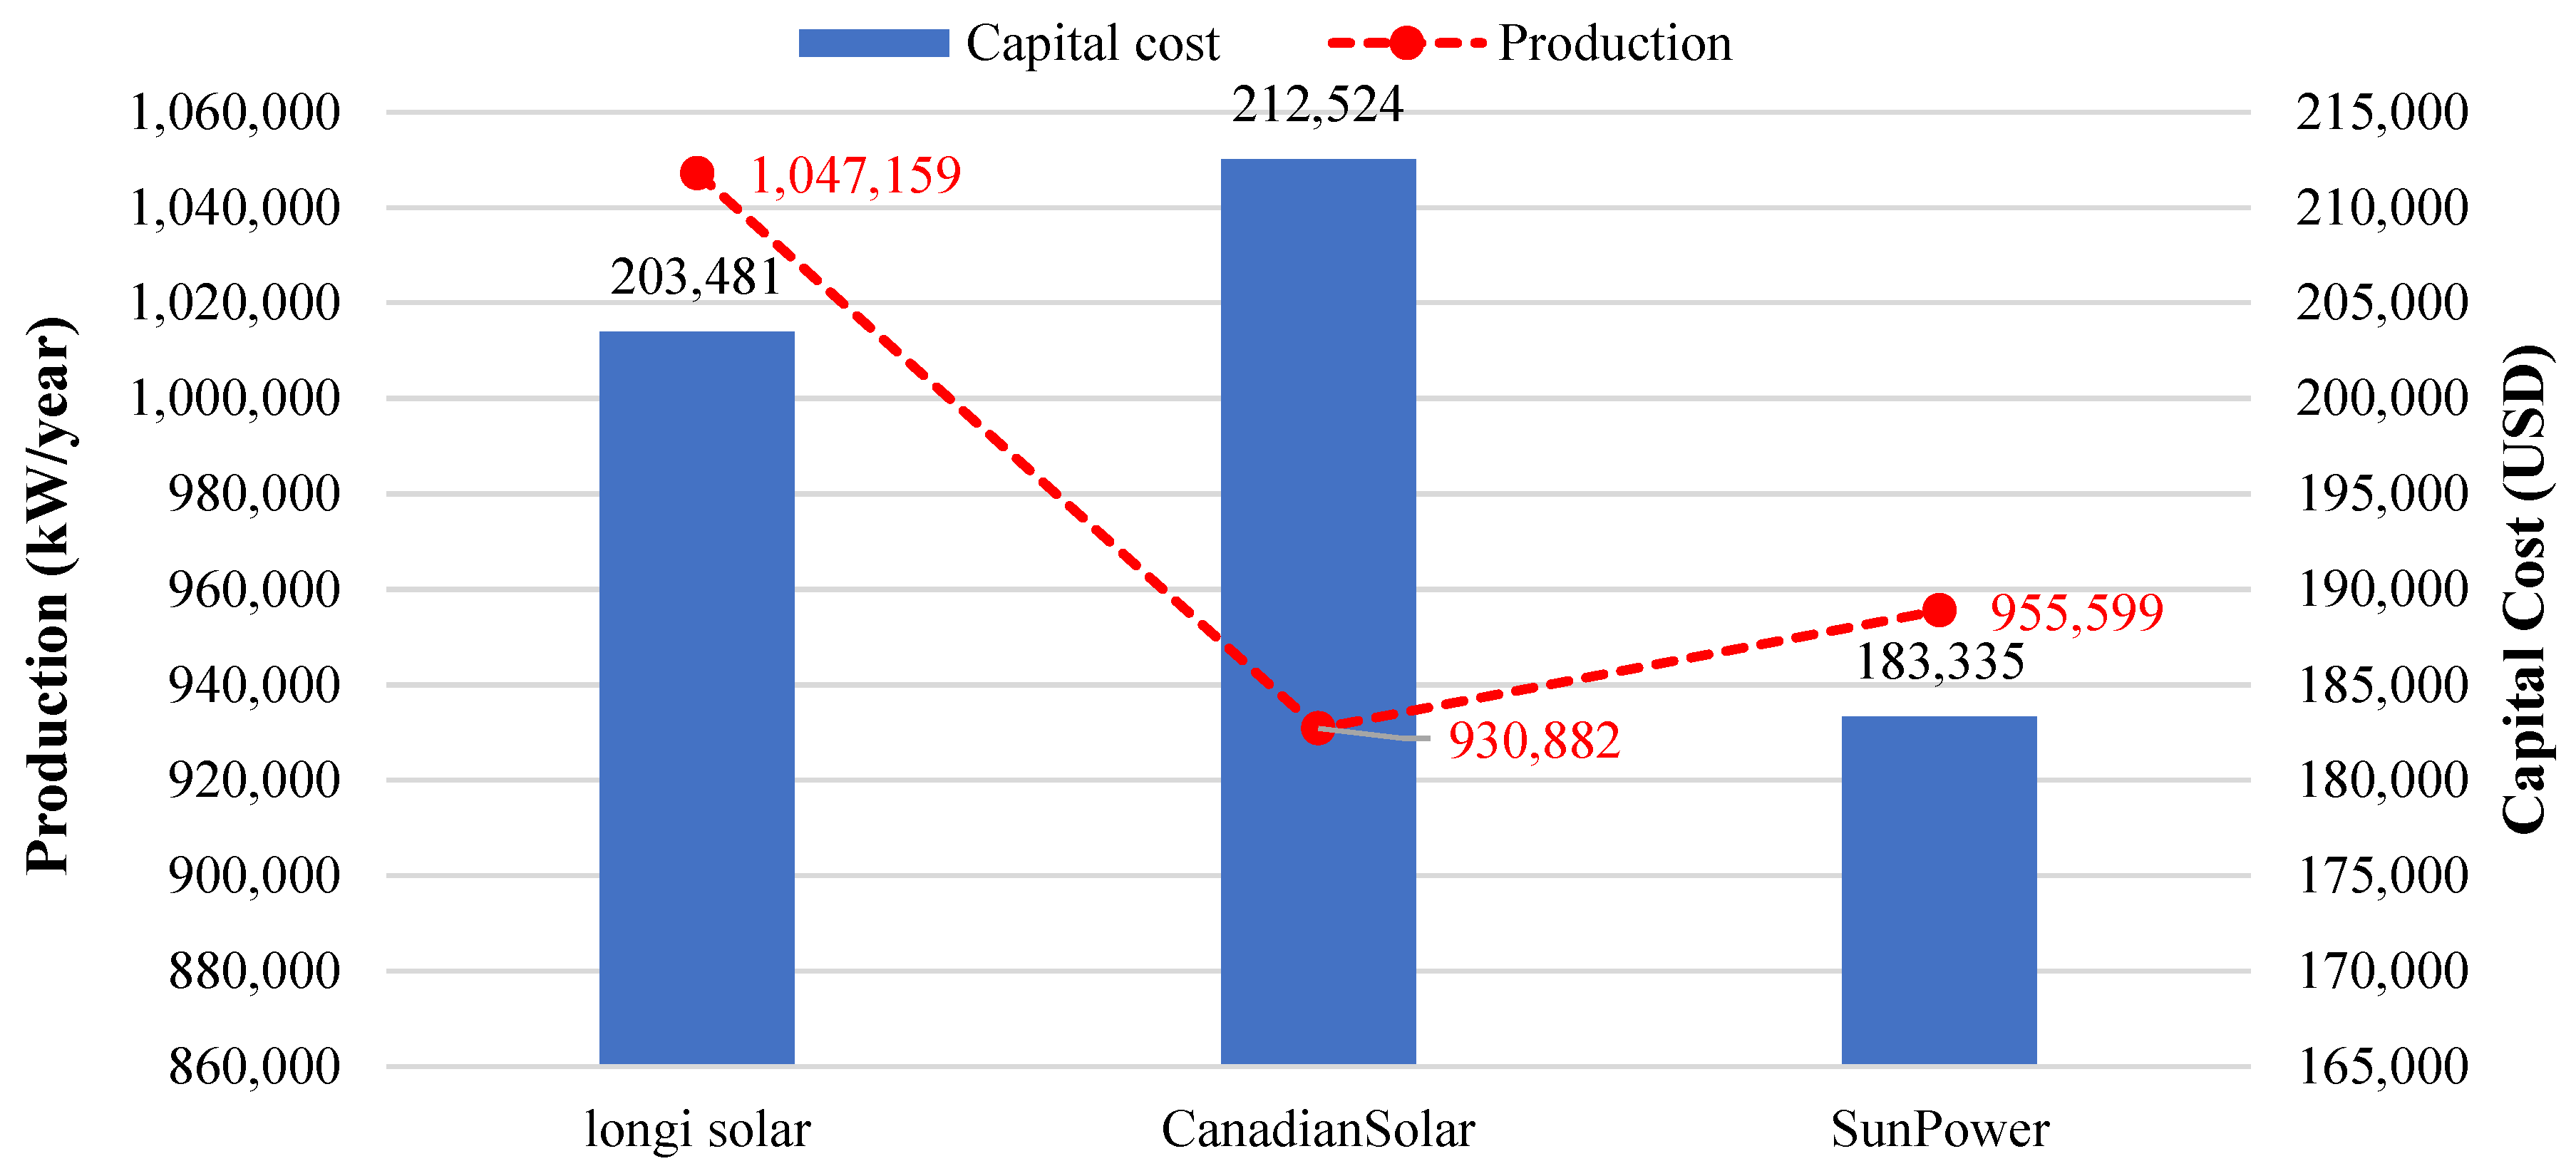
Three PV systems have been used in this study: CanadianSolar, SunPower, and LONGi Solar Technology. The optimal PV type was SunPower due to its low capital cost of USD 183,335, followed by LONGi Solar with USD 203,481, and CanadianSolar with USD 212,524, as shown in Figure 18. The electrical energy production for the SunPower PV was 955,599 kW/year, while for LONGi Solar and CanadianSolar, it was 1,047,159 kW/year and 930,882 kW/year, respectively.
In Table 6, the different PV types are compared by their rated power, size, capital cost, O&M, efficiency, and energy production. Although some PVs had high-rated power, their cost was not as economical, so these factors combined to decide the optimal PV type to be used in the system.
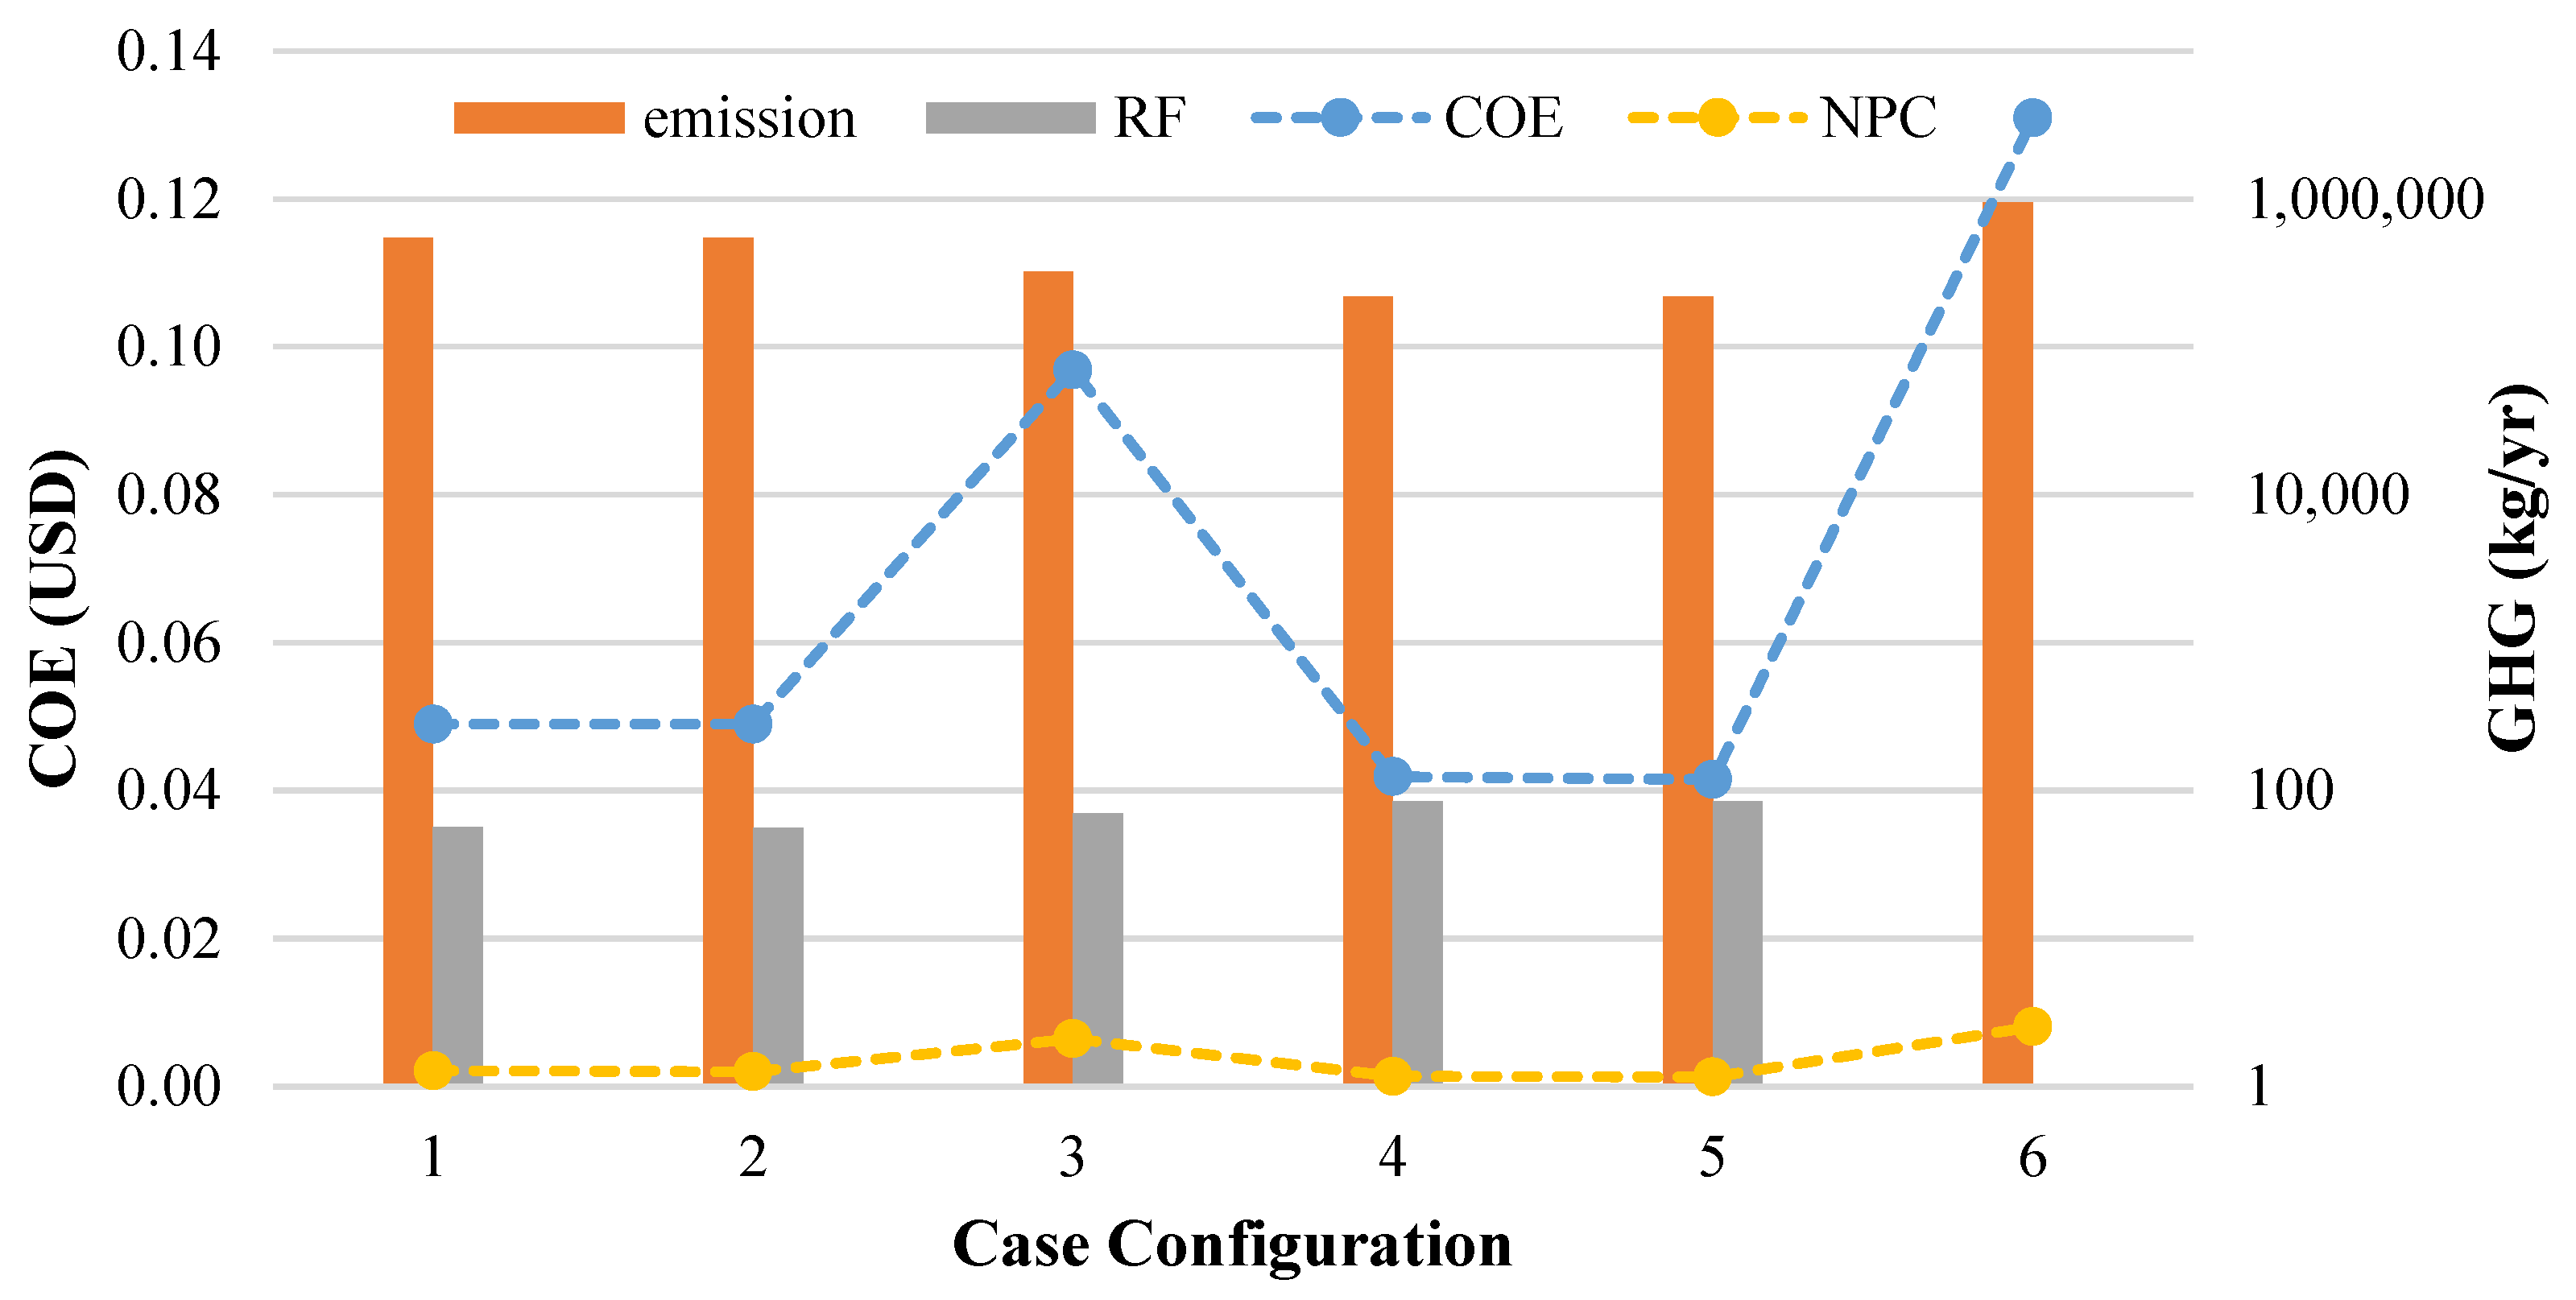
In Table 7, a comparison is provided between each case and the base case in the last column. These data include the reduction in GHG emissions and the NPC, COE, and O&M costs for each case compared to the base case. The reduction percentages show how the different proposed configurations interacted and changed the cross-bonding value. The winning scenario had the largest reduction in NPC (54%), and the smallest reduction for any case was 18%. In addition, the O&M cost, which depends mainly on the grid consumption bill, was reduced by 116% for the winning case due to the excess energy sold to the grid. For comparison, the variations in economic and environmental emissions for the different scenarios are presented graphically in Figure 19.
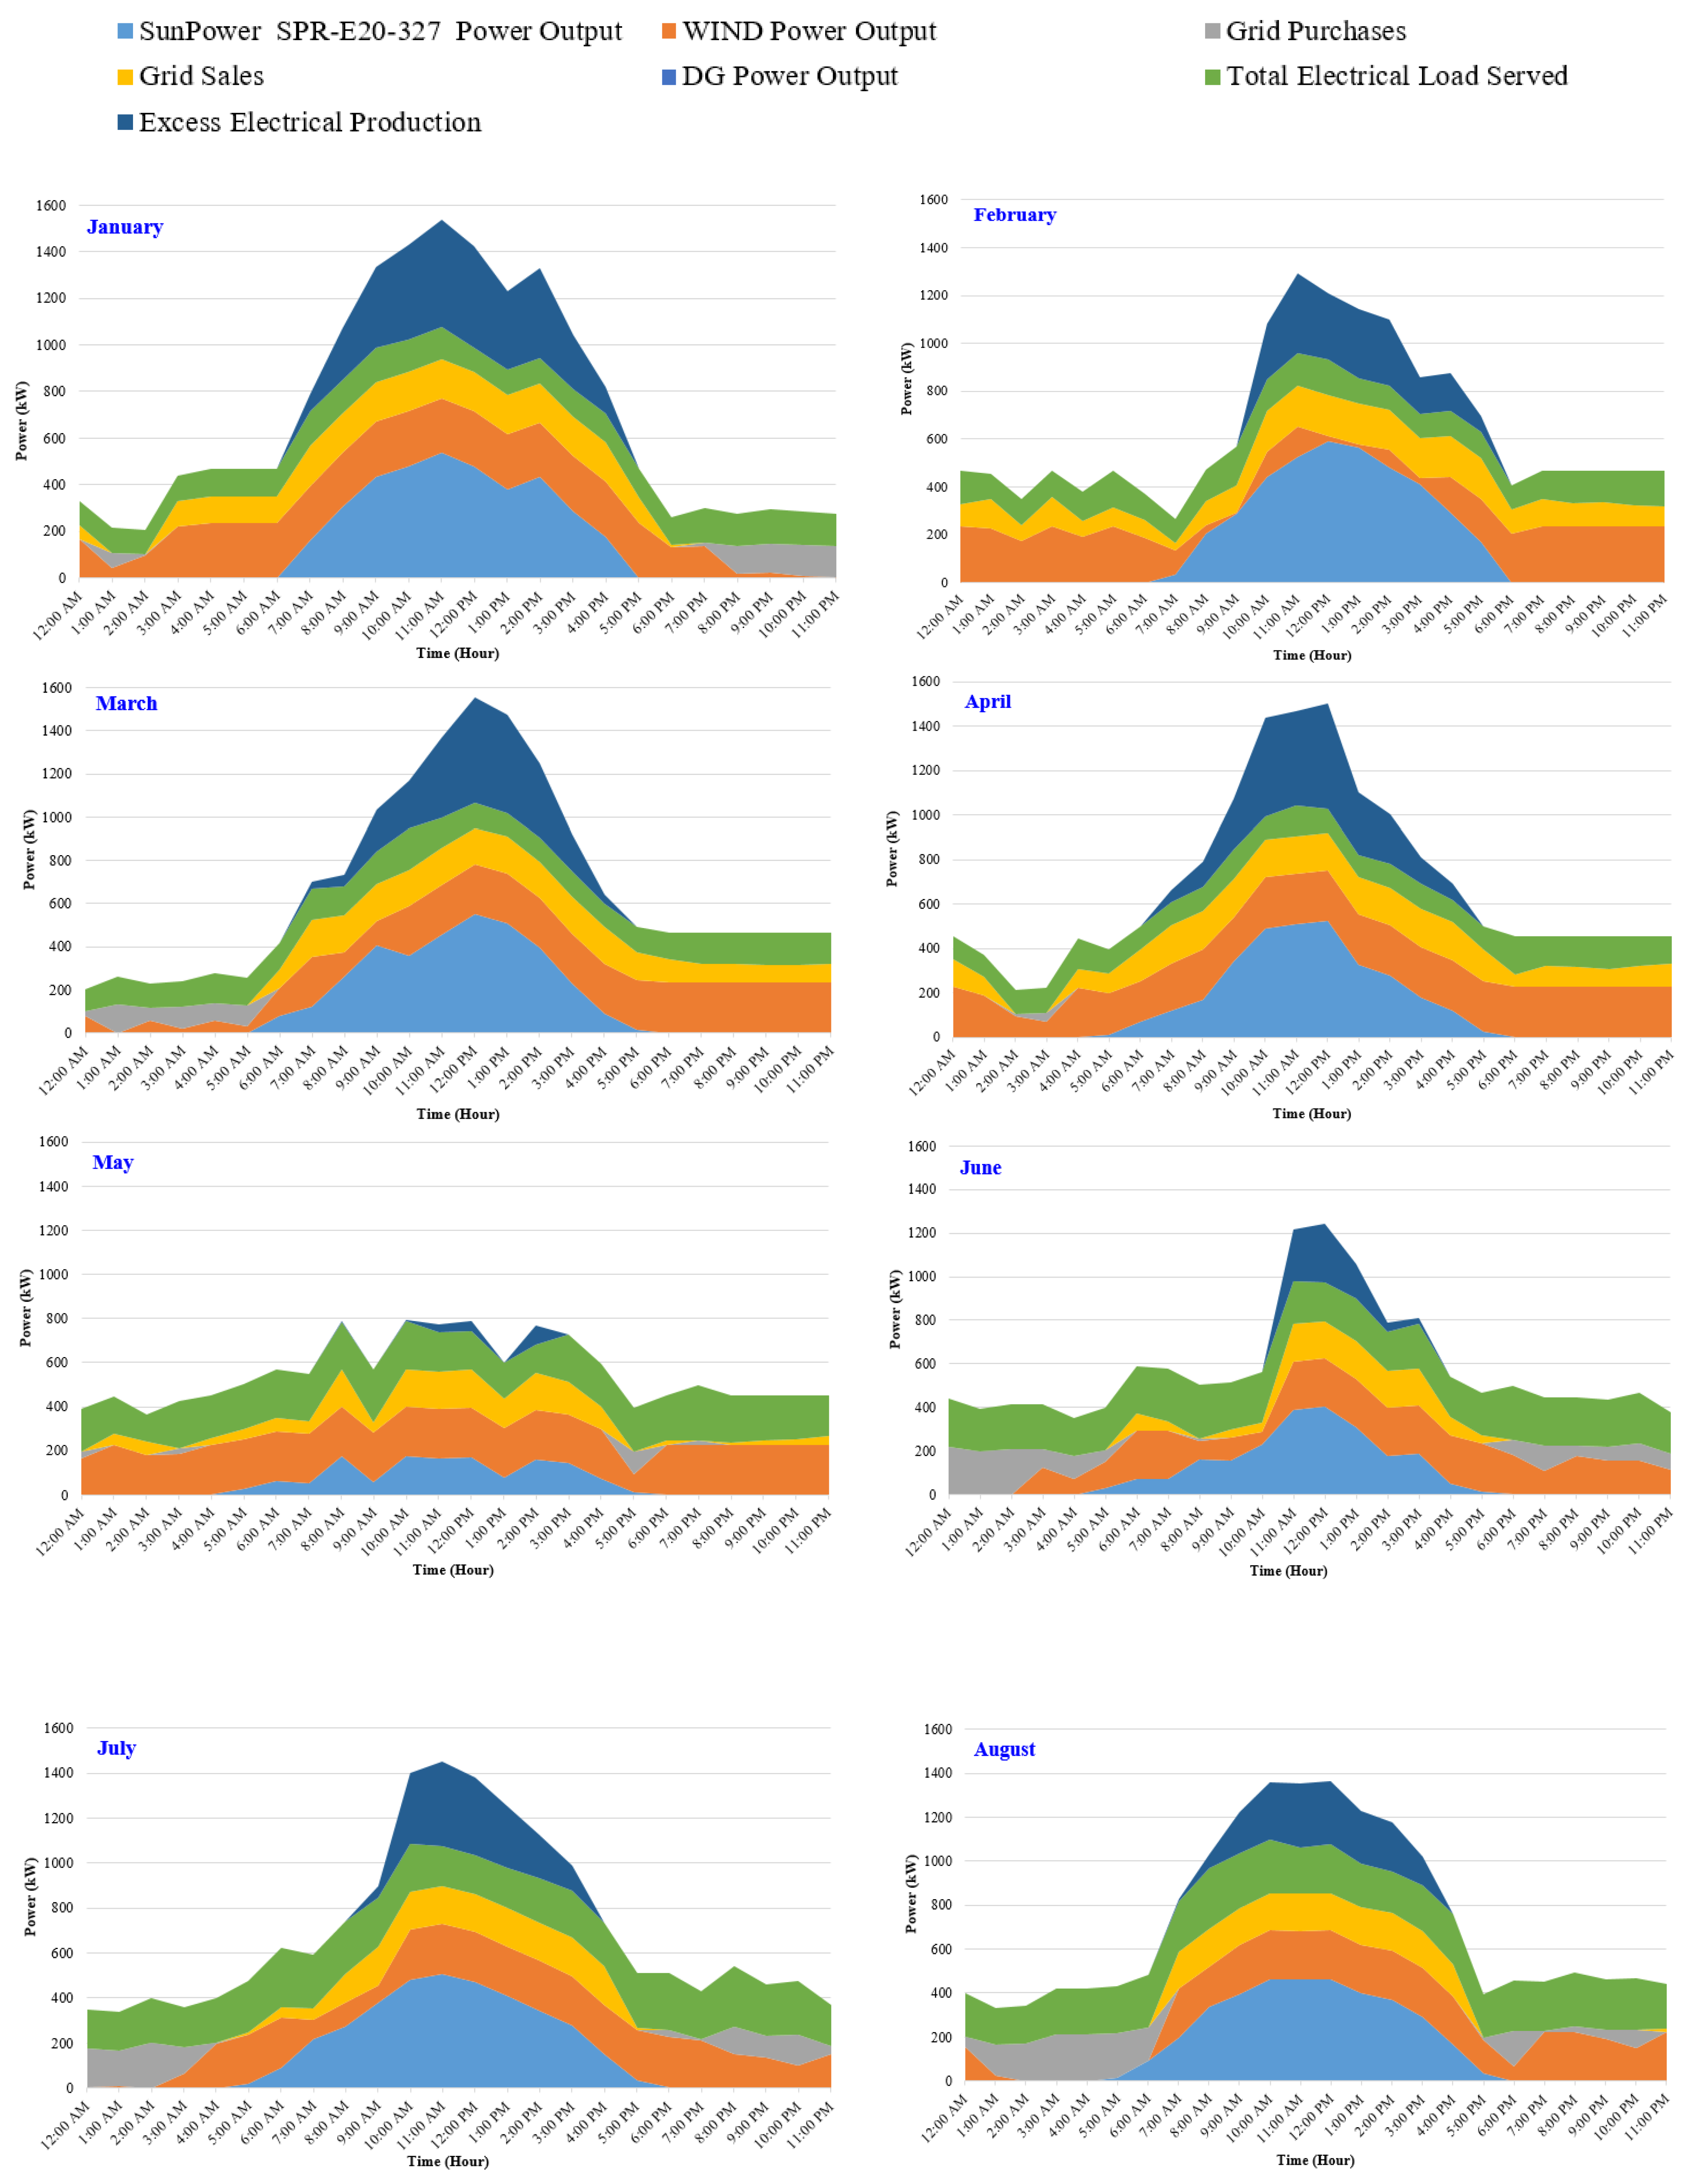
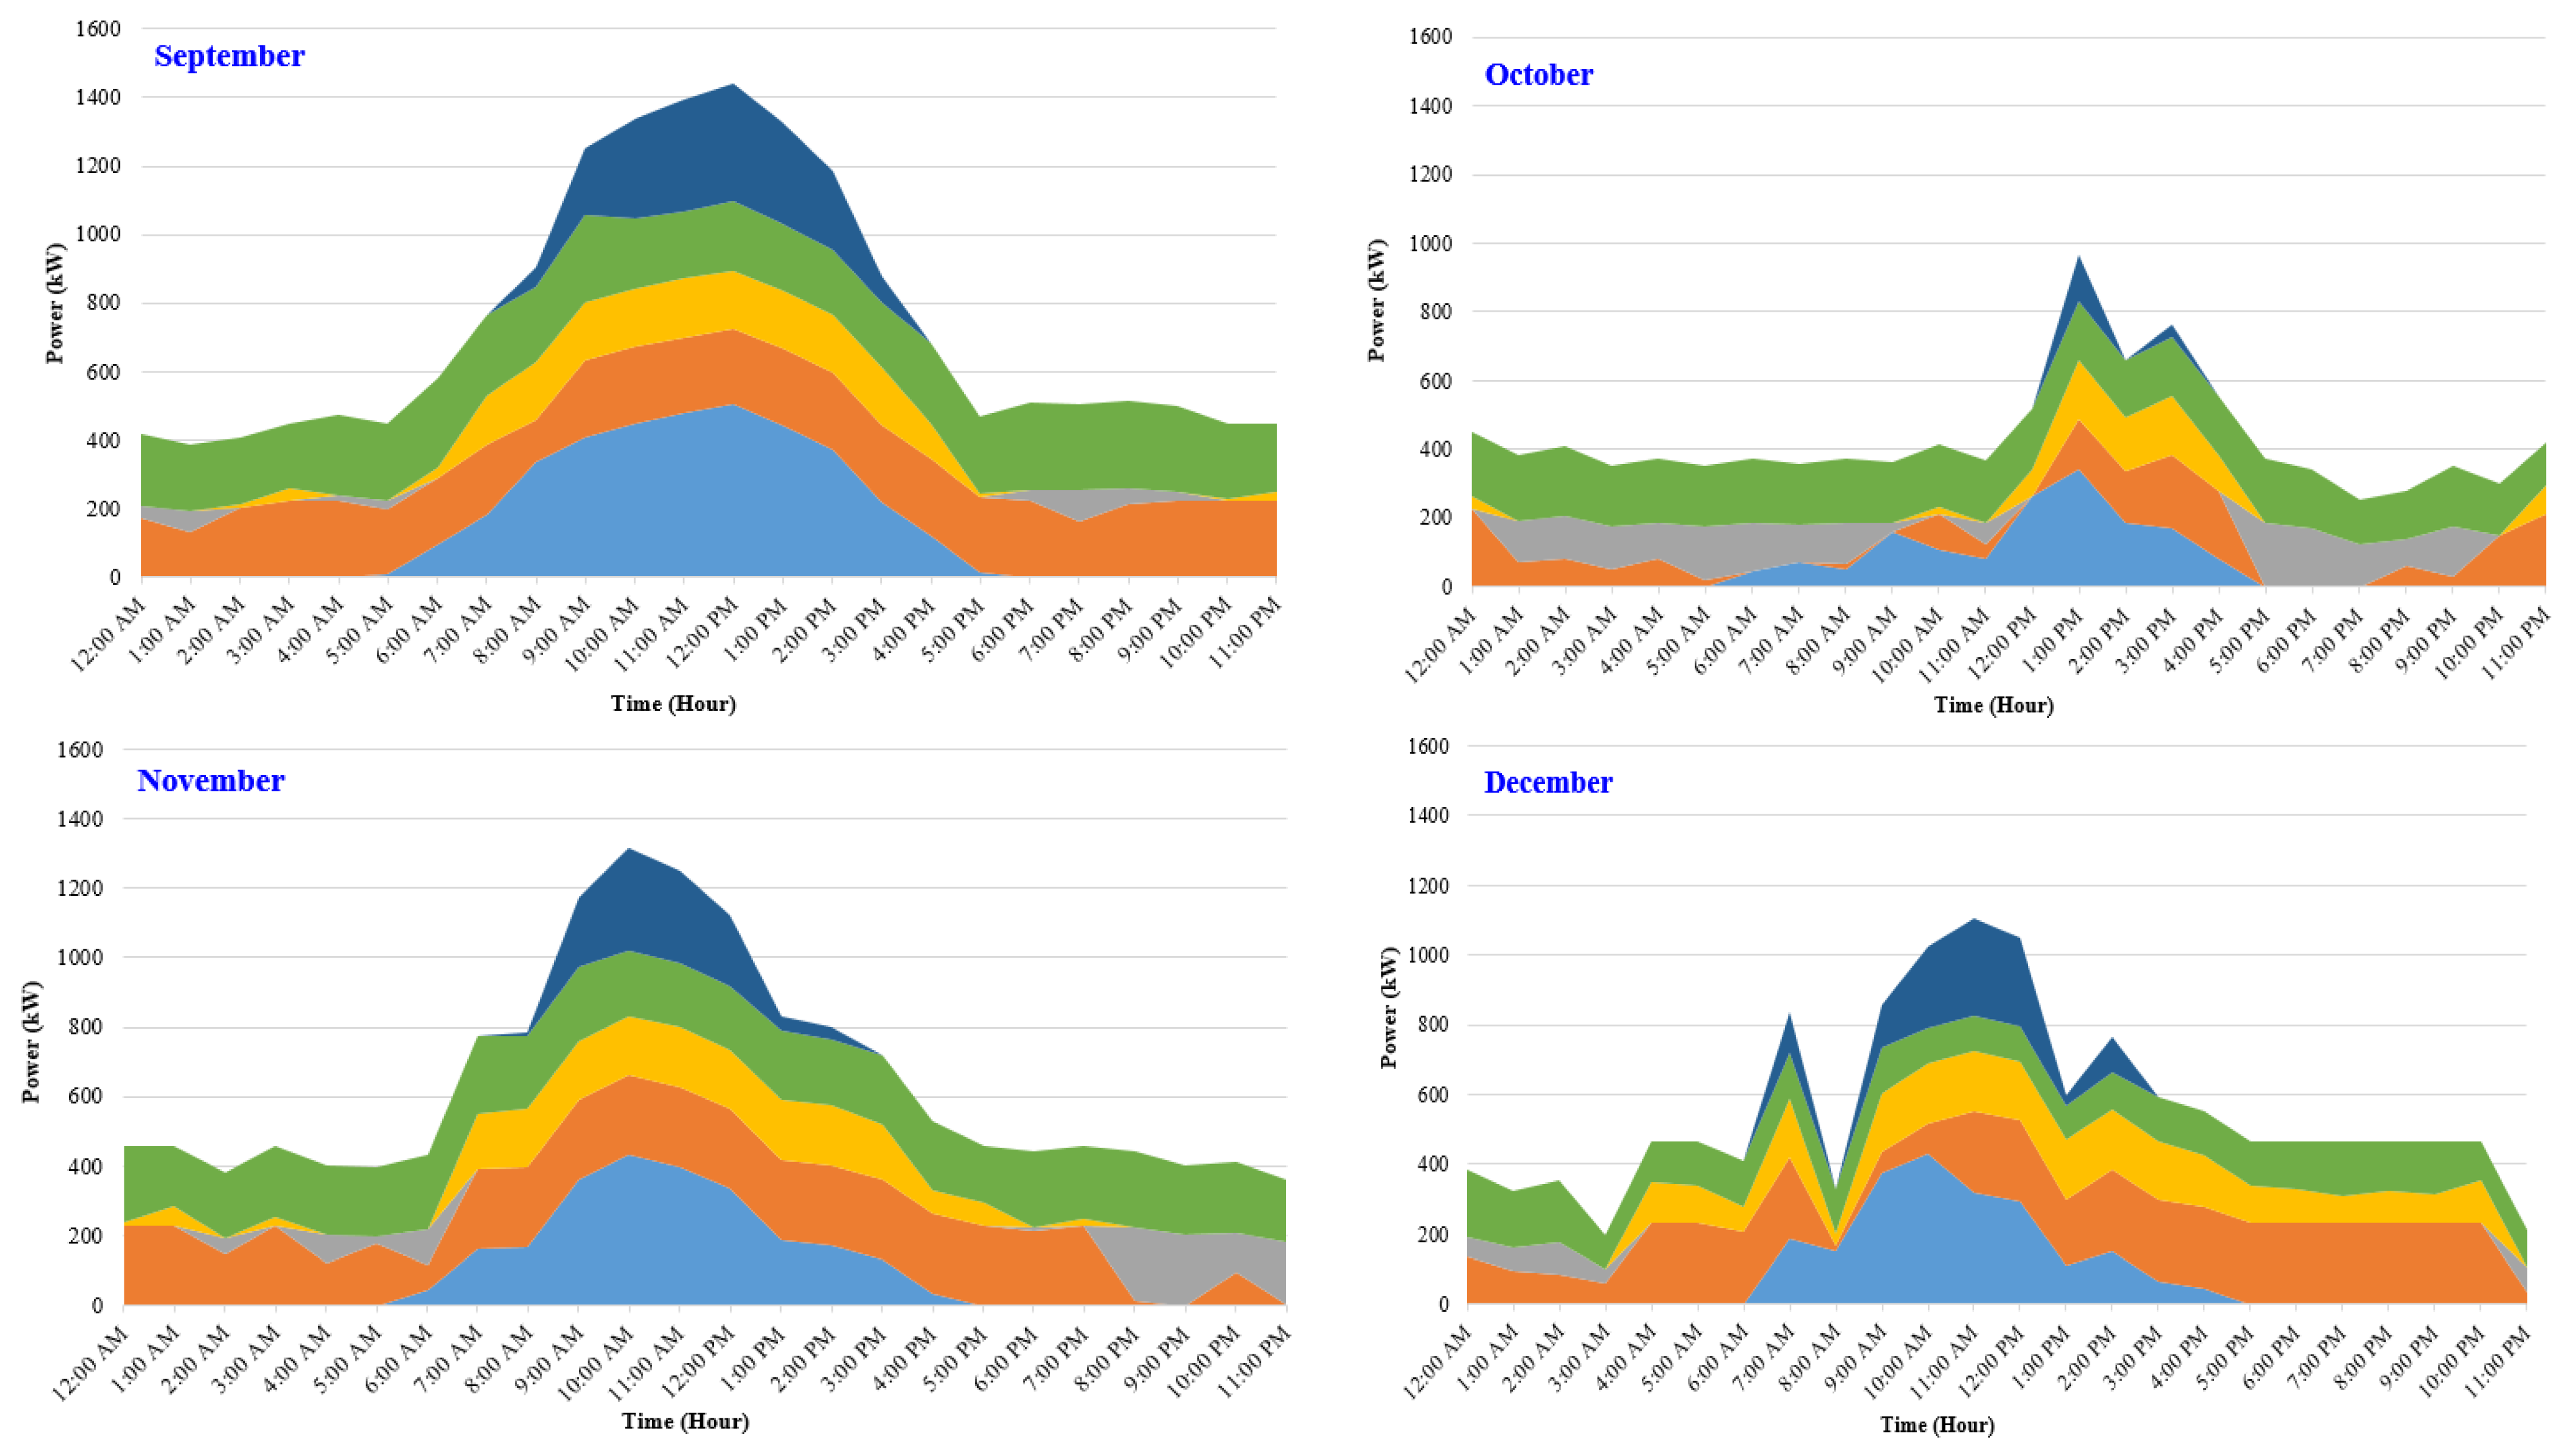
As a summary of the optimal configuration, Figure 20 shows the power output profile for the PV, wind, DG, and grid purchase, grid sale, excess electrical production, and total load for a selected day in each month of the year. From the data provided in Figure 20, the PV output power was highest during the summer season at around 400 kW due to the length of the day and the solar irradiance level. In July, the PV power output was the most significant, while in December and May, the PV output had a lower value, around 230 kW, due to weather conditions and seasonal solar irradiance. However, wind power maintains its output for all months due to relatively constant wind availability. The maximum wind power was around 800 kW in January. The DG output power was limited since it was used only during emergencies and outages.
Sales were made to the grid network from excess electrical production every month, and the most significant months for grid sales were January and April. In contrast, grid purchases were limited in all months and concentrated in the morning and night due to the lower wind and solar resource availability. For example, in December, the grid purchase power was limited to the first few hours of the day. Despite the lack of solar power after sunset, wind availability at night essentially eliminates the need for grid power. The excess electrical energy after the primary load is served correlates with both solar and wind-energy availability. The maximum excess energy was in January and March, and wind power is the largest contributor to the excess electrical energy.
In Table 8, the storage system proposed in this study is summarized and compared for each case. This table shows that storage-system usage was limited to cases two and four with 0.15% and 0.05% battery percentage throughputs, respectively. The lack of need for a storage system is due to the use of a net metering grid system, as the surplus electrical energy can be sold back to the grid and credited. Hence, the grid works as a storage system with no capital or O&M costs.
The production summary for the optimal winning configuration is shown in Table 9. The wind share was the largest at 1300 MW/year (48.3% share), followed by the PV at 1047 MW/year (38.9% share). The grid-purchased power was reduced to 344 MW/year (12.8% share) due to the system’s dependence on renewable resources.
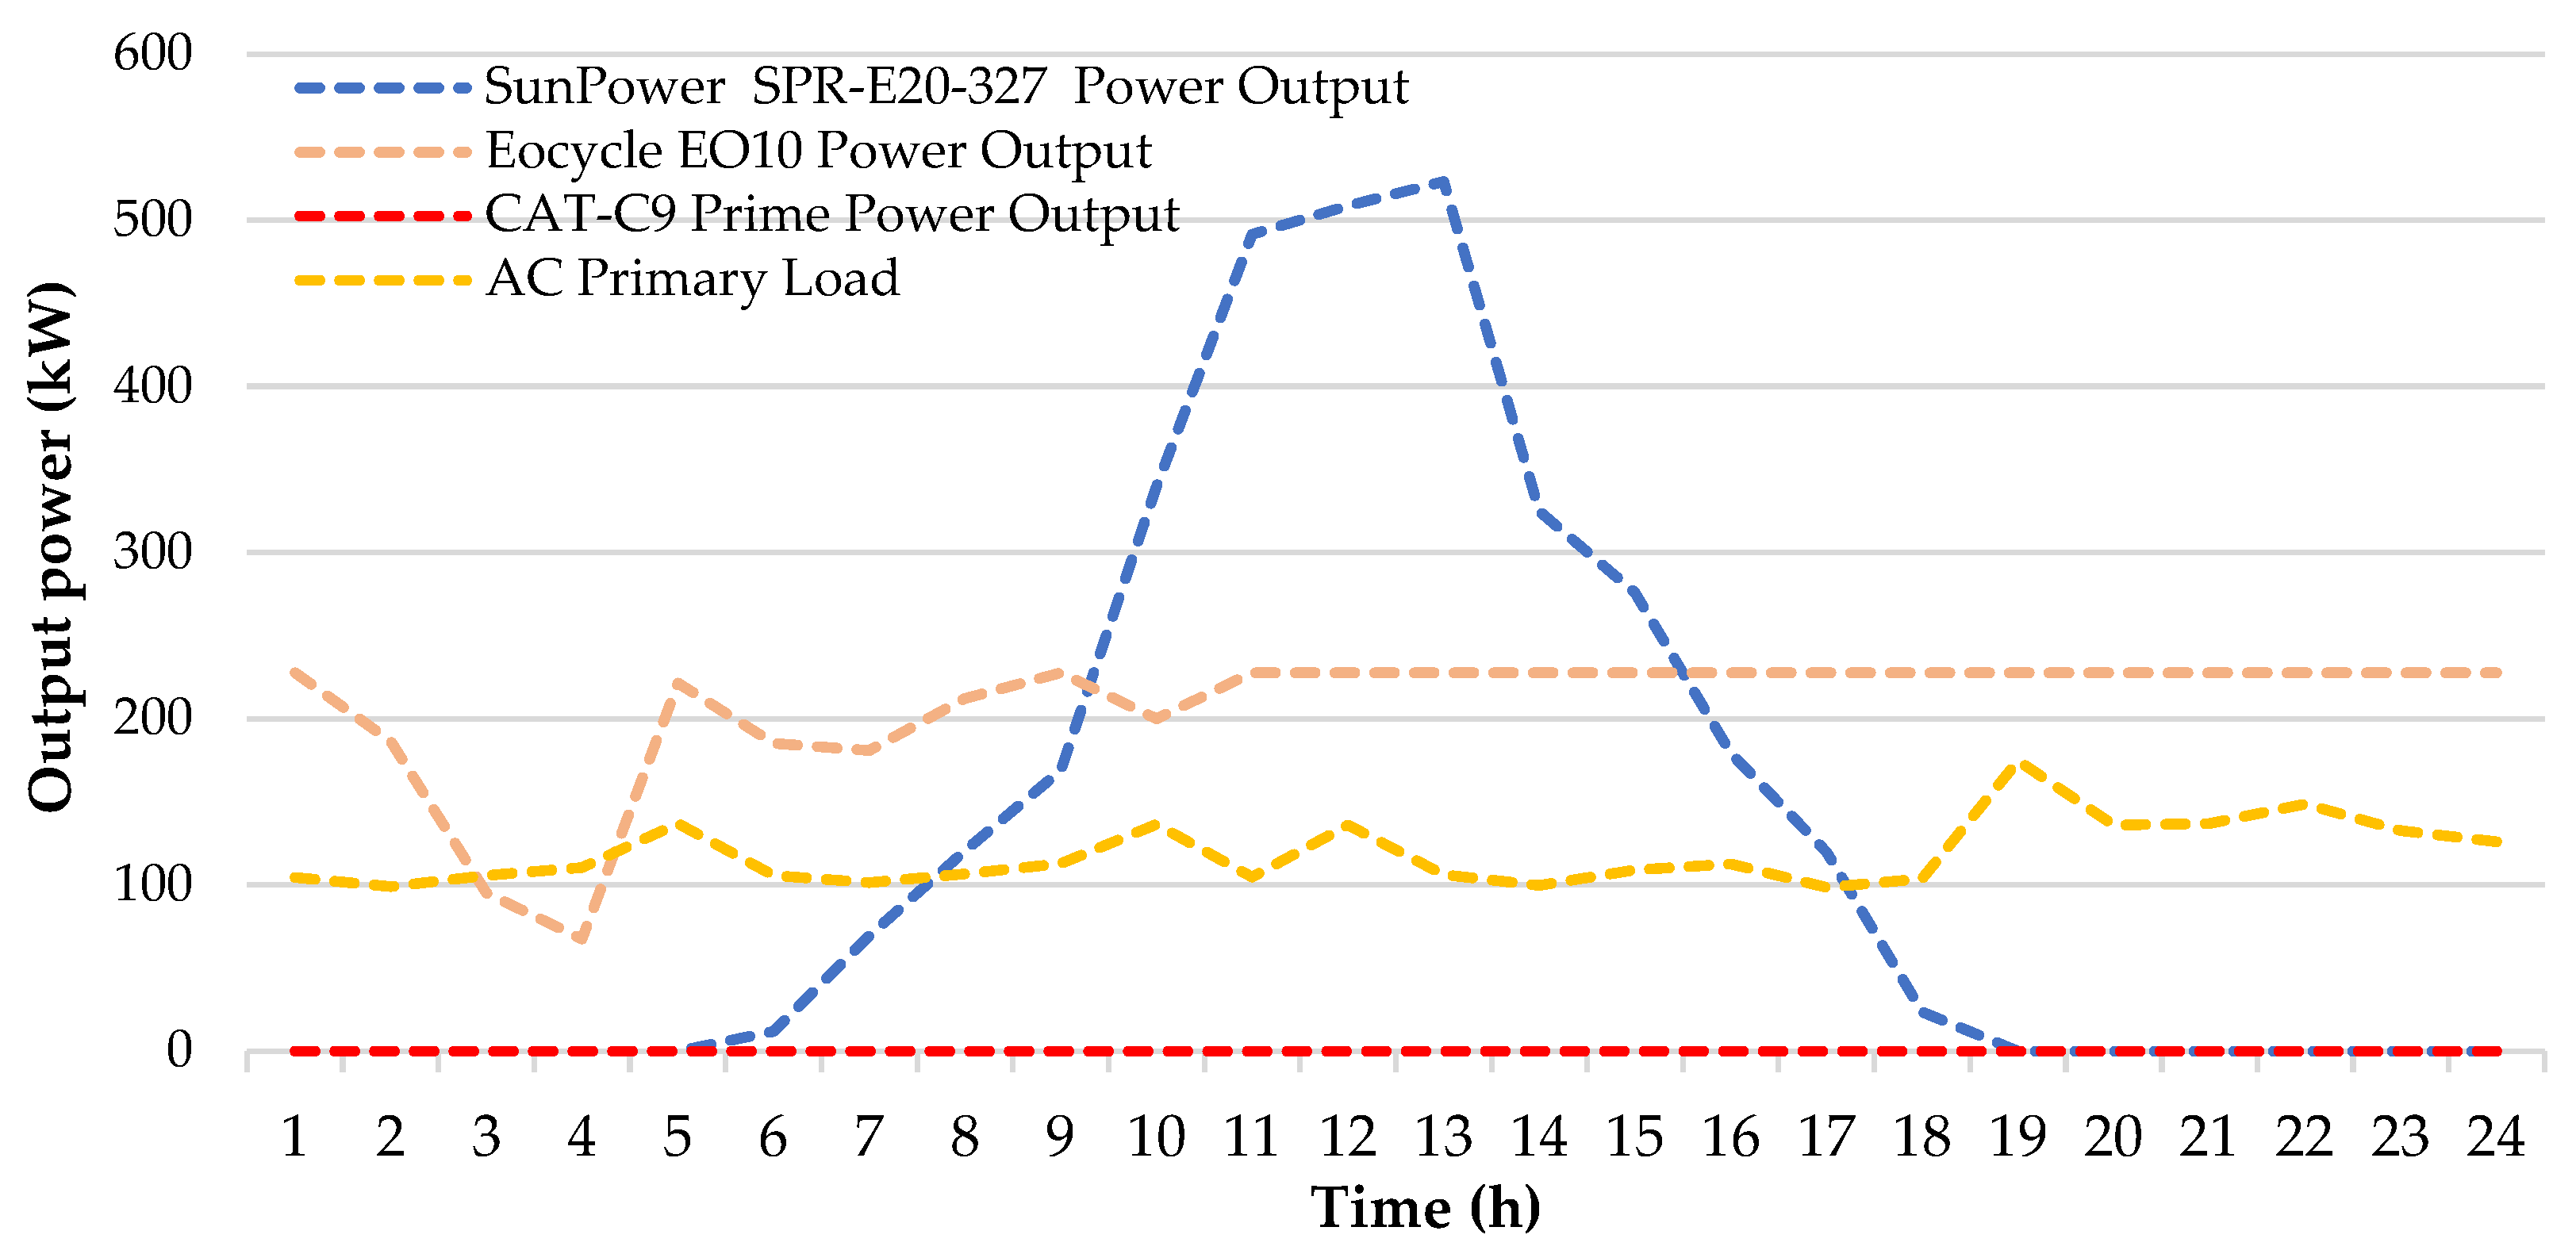
Excess electrical production for the optimal design is shown in Figure 21 with the primary load and the total renewable-energy output for a selected day of the year (17 April) to illustrate the change in power over an entire day. This figure shows that a large amount of excess energy was available during peak solar irradiance in the middle of the day. The PVs contribute a large portion of the excess energy, followed by the wind turbines. Protocols that limit grid sales to peak load consumption restrict the excess energy supplied to the grid for on-grid renewable-energy systems.
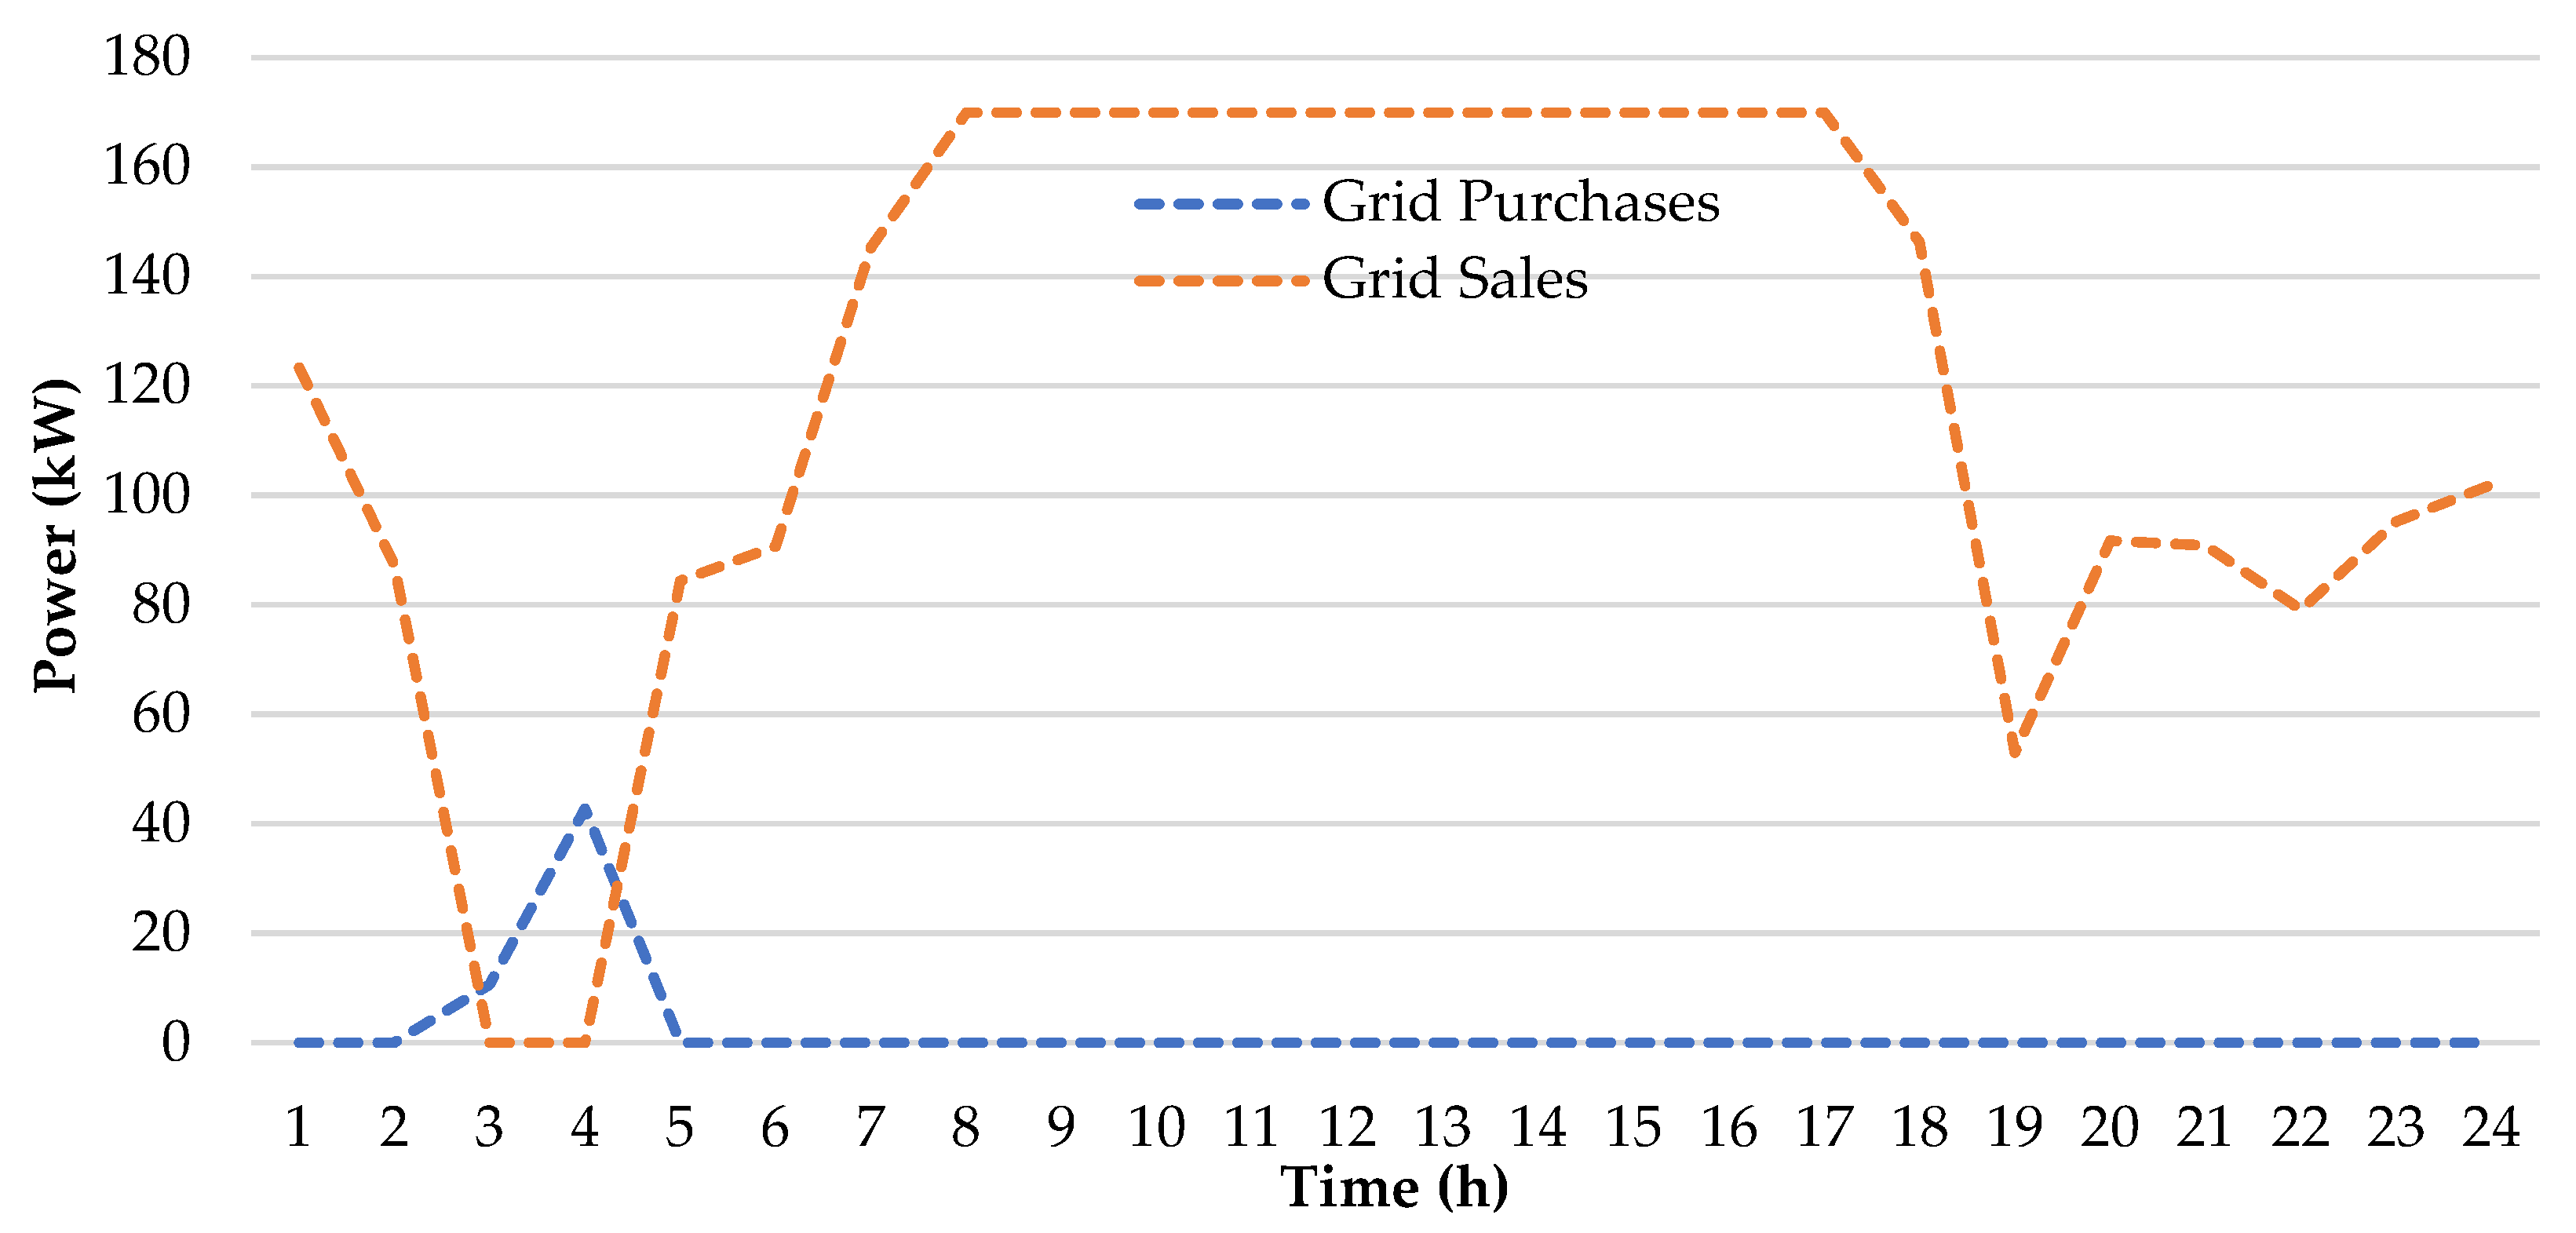
A summary of the power output from each optimal configuration component is shown in Figure 22 over a selected day to illustrate the variation between components. The solar PV contributed considerable power during the peak solar irradiance hours (near solar noon), while the wind-turbine output was relatively large and constant due to semicontinuous wind availability. The DG power output was zero due to the availability of PV, WT, and grid power and since there were no emergencies or outages on that day. For comparison, the energy purchased and sold to the grid for the same sampled day is shown in Figure 23.
The HRES reliability is the probability that the system will perform and meet its intended function adequately for a specified period. Table 10 shows that the system’s reliability resulted from limited diesel generator operation, with 8.73 h/day running time. The operation and maintenance costs were USD 0.0873/day, and the fuel consumption was 409 L/day, costing USD 286/day. However, the main benefit of the proposed HRES was the elimination of shortage hours in the system.

4.1. Operational Performance of the Optimal System

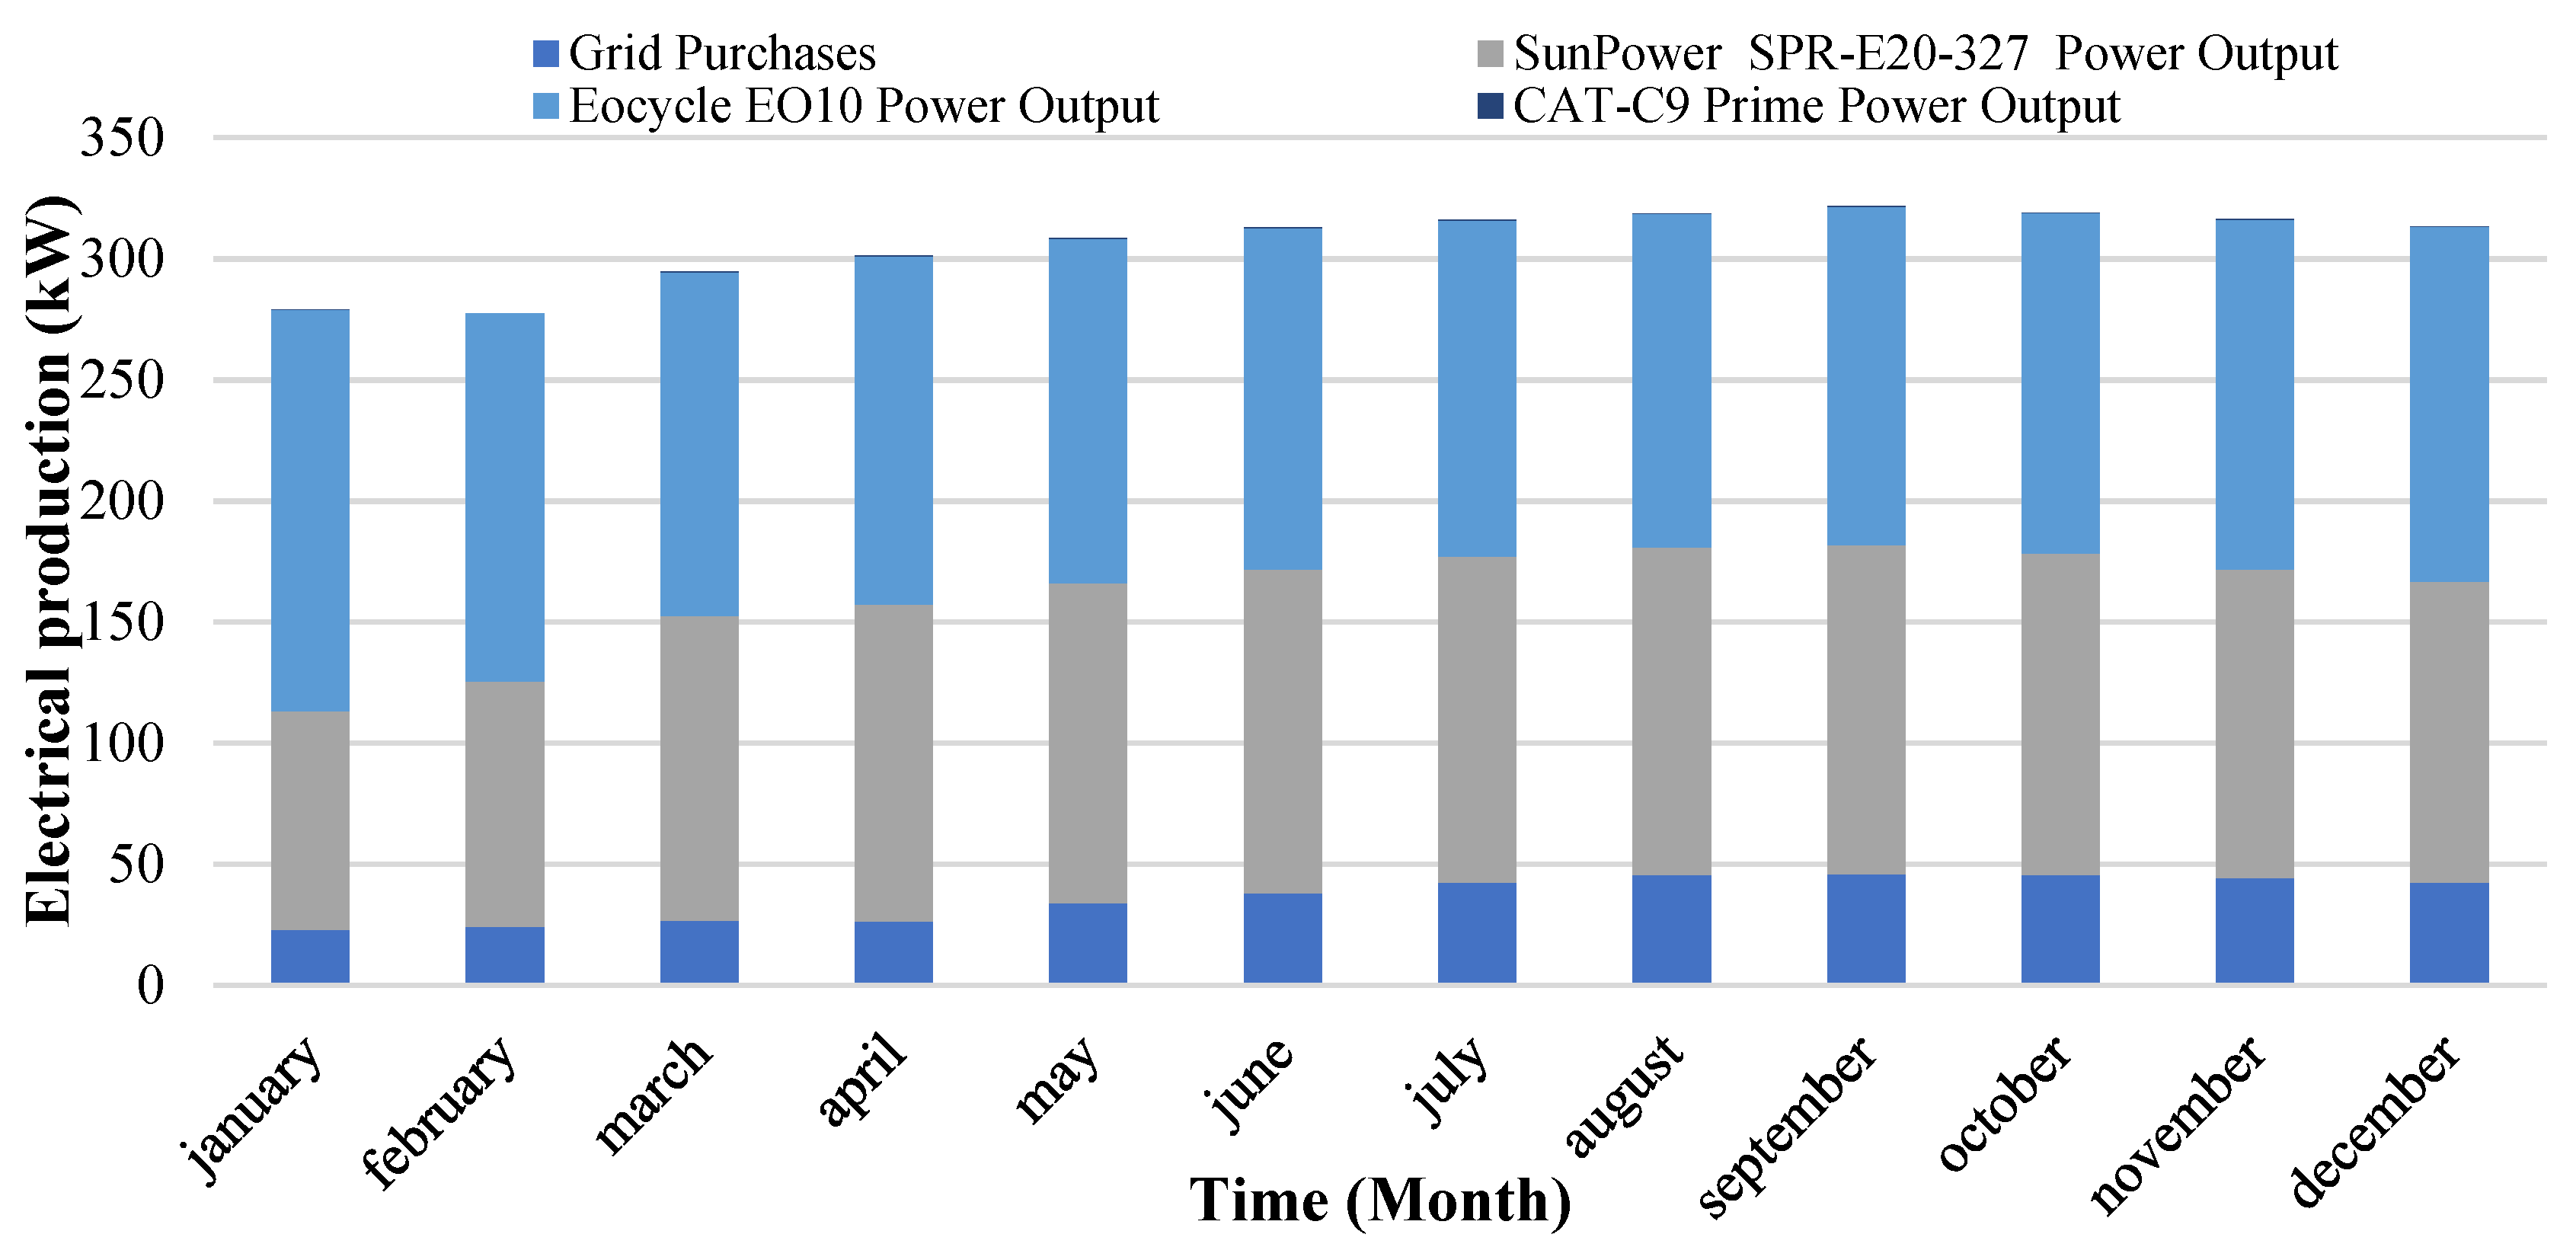
The HOMER grid simulation results showed that the winning scenario was the case five configuration of PV–WT–Converter–DG–Grid, based on the lowest NPC and COE of USD 1.16 M and USD 0.0415/kWh, respectively. The monthly average electric power production from each system component of the optimal configuration is shown in Figure 24.
Solar and wind energy were considered as the primary sources to supply the proposed system with electrical demand. Due to adequate solar and wind availability, the DG can be regarded as a backup power source in most months and is only needed when the output power from the PVs and WTs is affected by weather conditions or when outages occur. Table 11 demonstrates the total annual electrical energy production and consumption for HRES case five from the various power sources. From this table, the WTs have contributed the highest energy generation of 1,300,815 kWh/year (48.4% share), the PVs contributed 1,047,159 kWh/year (38.9% share), and grid purchases contributed 344,156 kWh/yr. Figure 24 shows the monthly average electric production for the optimal configuration and that the WT and PV productions were the dominant energy sources.

4.2. Economical Performance of the Optimal System

The optimal and winning HRES case costs, including the capital, replacement, O&M, fuel, and salvage costs for the system components and the overall system, are summarized in Table 12. The resulting data indicate that the capital cost of the WTs (USD 1.12 M) is the highest of any system component and is approximately 80% of the entire system’s capital cost. However, worldwide capital costs for wind turbines are expected to fall soon due to increasing mass production.
The solar panel cost is considerable at USD 183,335, and the diesel generator also contributes to the total system cost of USD 44,000, while the system’s converter is USD 53,861. Compared to all other system components, the PVs were the most affordable technology in the proposed HRES. As a result of their nearly zero O&M cost and low capital and installation costs, PV technology costs become lower each year.

4.3. Environmental Performance of the Optimal System

The environmental impact of the optimal HRES design showed that the resulting GHG emissions were reduced significantly from 952,763 kg/year for the base case (zero renewable energy) to 218,497 kg/year with the high fraction (84.1%) of renewable energy in the system. This 77% reduction in emissions justifies the elimination of diesel generators, which decreases the dependence on fossil fuels, as demonstrated in Table 6. The total number of operating hours for the DG was reduced significantly from 23 h/year to 8 h/year. Therefore, the total amount of diesel fuel consumed decreased to around 37 L for the optimal case compared to 1210 L for the base case. As a result, this increases the dependence of the proposed optimal HRES on clean and renewable energy. A breakdown of the major gas emissions by the optimal design is provided in Table 13 and Figure 25.

4.4. Comparison with Other Studies Results

This study has defined a new HRES configuration that differs from other studies in component sizes, load requirements, and renewable resources. Therefore, an exact comparison cannot be made with those systems. However, a comparison using the systems’ economic configuration is an acceptable and appropriate way to compare them. Table 14 shows a comparison between the NPC and COE of this study of the Petra Marriott Hotel in Jordan and the other listed studies. In Table 14, the COE values are considered the primary comparison parameter due to the use of renewable energy. In addition, Figure 26 illustrates the NPC and COE values for the optimal HRES configuration in different regions worldwide.

5. Regulation Rule of Energy Storage

The main regulation rule of energy storage that limits the expands of the hybrid system size and refunds can be mentioned below [57]:
  • Electrical loss rates of 6% are applied to the user as a result of using the transmission or distribution system or both electrical losses and USD 0.1/kWh;
  • The generating capacity of the system of renewable-energy sources to be connected to the system licensed for transmission or licensed for distribution and retail supply shall be determined, so that the annual amount of energy generated from this system does not exceed the actual consumption for the last 12 months from the date of submitting the application for the beneficiary subscription, in addition to the amount of energy calculated to cover the losses. Electricity results from the transmission of electrical energy through the transmission system and distribution system. Regarding new subscriptions that have had no actual consumption for the last 12 months, the applicant estimates the generating capacity in the application;
  • The user is not compensated for the annual surplus quantities if the amount of excess energy exceeds 10% of the energy consumed by the subscriber benefiting from the transit transportation process.

6. Conclusions

This research conducted a comprehensive analysis of a hybrid renewable energy system (HRES) to transform a facility into a green building with clean energy at near-zero greenhouse-gas (GHG) emissions. The HRES aims to reduce the energy bill by considering different sustainable energy resource configurations using a grid-connected hybrid renewable energy system (GHRES) for the case study of a hotel in Petra, Jordan.
The HOMER grid software was applied to hybrid systems to study ways to improve overall efficiency and mitigate greenhouse-gas emissions while maintaining an economic perspective. Data were collected using metrological data, field measurements using a power quality logging device, and power distribution company recorded data. The hybrid system components included in the simulation were a solar photovoltaic (PV) system, wind-turbine system, battery storage system, diesel generator (DG), and converter. With multiple configurations analyzed in the software simulations, a complete comparison was conducted to find the most suitable design using feasible component parameters. Three PV panel types and two DGs were compared within the simulation process.
The renewable-energy fraction (RF) was one of the more important selection parameters, while the economic parameters were also crucial in making the proposed new configuration feasible. The resulting values for the optimal winning configuration, out of five main scenarios, had a USD 1.16 M total net-present cost, a USD 0.0415 USD/kWh cost of energy, a 15.8% effective internal rate of return, and an approximately 77% reduction in carbon emissions compared to the base case. Since the proposed system was grid connected, a storage system for the excess electrical energy generated from the HRES was not used since the grid acts as an enormous storage system (though somewhat limited by policies based on grid stability and electricity prices).
The results from this study can give a comprehensive understanding of a hybrid system connected to a grid and some suggestions in the future and recommendations as follows:
-
Using a hybrid renewable-energy system was more effective than using a single type of renewable-energy system, as it was more sustainable and cost effective;
-
Policymakers should ease the rules and limitations on using renewable-energy and their share of the grid;
-
Proposed a local fabricated system for parts production due to the energy cost still being high as the cost of imported RE systems is high;
-
Using solar water heaters can improve the overall system’s cost effectivity by reducing energy to heat water by electricity heaters.

Author Contributions

All authors contributed to the study’s conception and design. All authors are equal in material preparation, data collection, and analysis. The first draft of the manuscript was written by (J.T.A.B.). All authors have read and agreed to the published version of the manuscript.

Funding

This research received no external funding.

Institutional Review Board Statement

Ethics approval was not required for this study.

Informed Consent Statement

Consent to participate was not required for this study; consent to publish was not required for this study.

Data Availability Statement

All data are available in the manuscript.

Conflicts of Interest

The authors have no relevant financial or nonfinancial interest to disclose.

References

  1. Fraunhofer Institute for Solar Energy Systems, ISE with Support of PSE Projects GmbH. Fraunhofer ISE: Photovoltaics Report. I: PHOTOVOLTAICS REPORT (nov. 2016). 2019. Available online: https://www.ise.fraunhofer.de/content/dam/ise/de/documents/publications/studies/Photovoltaics-Report.pdf (accessed on 15 March 2021).
  2. Lee, J.; Zhao, F.; Dutton, A.; Backwell, B.; Fiestas, R.; Qiao, L.; Balachandran, N. Global Wind Report 2019; Global Wind Energy Council (GWEC): Brussels, Belgium, 2020; Available online: https://gwec.net/wp-content/uploads/2020/08/Annual-Wind-Report_2019_digital_final_2r.pdf (accessed on 21 March 2021).
  3. Hasan, A.O.; Osman, A.I.; Ala’a, H.; Al-Rawashdeh, H.; Abu-jrai, A.; Ahmad, R.; Gomaa, M.R.; Deka, T.J.; Rooney, D.W. An experimental study of engine characteristics and tailpipe emissions from modern DI diesel engine fuelled with methanol/diesel blends. Fuel Process. Technol. 2021, 220, 106901. [Google Scholar] [CrossRef]
  4. Gomaa, M.R.; Al-Dmour, N.; AL-Rawashdeh, H.A.; Shalby, M. Theoretical model of a fluidized bed solar reactor design with the aid of MCRT method and synthesis gas production. Renew. Energy 2020, 148, 91–102. [Google Scholar] [CrossRef]
  5. Gomaa, M.R.; Mustafa, R.J.; Al-Dmour, N. Solar Thermochemical Conversion of Carbonaceous Materials into Syngas by Co-Gasification. J. Clean. Prod. 2020, 248, 119185. [Google Scholar] [CrossRef]
  6. Gomaa, M.R.; Mustafa, R.J.; Al-Dhaifallah, M.; Rezk, H. A Low-Grade Heat Organic Rankine Cycle Driven by Hybrid Solar Collectors and a Waste Heat Recovery System. Energy Rep. 2020, 6, 3425–3445. [Google Scholar] [CrossRef]
  7. Gomaa, M.R.; Hammad, W.; Al-Dhaifallah, M.; Rezk, H. Performance enhancement of grid-tied PV system through new design cooling techniques under dry desert condition: An experimental study and comparative analysis. Sol. Energy 2020, 211, 1110–1127. [Google Scholar] [CrossRef]
  8. Muneer, T.; Asif, M.; Munawwar, S. Sustainable production of solar electricity with particular reference to the Indian economy. Renew. Sustain. Energy Rev. 2005, 9, 444–473. [Google Scholar] [CrossRef]
  9. Ministry of Energy and Mineral Resources (MEMR). Annual Reports, Amman, Jordan, Page 30. 2018. Available online: https://www.memr.gov.jo/echobusv3.0/SystemAssets/56dcb683-2146-4dfd-8a15-b0ce6904f501.pdf (accessed on 17 October 2019).
  10. Gomaa, M.R.; Rezk, H. Passive Cooling System for Enhancement the Energy Conversion Efficiency of Thermo-Electric Generator. Energy Rep. 2020, 6, 87–692. [Google Scholar] [CrossRef]
  11. National Electric Power Company, NEPCO Annual Report, 2019. Available online: http://www.nepco.com.jo/store/docs/web/2019_en.pdf (accessed on 4 February 2021).
  12. Van der Geest, K.; Warner, K. Loss and damage in the IPCC Fifth Assessment Report (Working Group II): A text-mining analysis. Clim. Policy 2020, 20, 729–742. [Google Scholar] [CrossRef]
  13. Lucchi, E. Renewable Energies and Architectural Heritage: Advanced Solutions and Future Perspectives. Buildings 2023, 13, 631. [Google Scholar] [CrossRef]
  14. Gomaa, M.R.; Rezk, H.; Mustafa, R.J.; Al-Dhaifallah, M. Evaluating the Environmental Impacts and Energy Performance of a Wind Farm System Utilizing the Life-Cycle Assessment Method: A Practical Case Study. Energies 2019, 12, 3263. [Google Scholar] [CrossRef]
  15. National Electric Power Company (NEPCO). Annual Reports, Amman, Jordan. Available online: http://www.nepco.com.jo/store/docs/web/2018_en.pdf (accessed on 21 October 2019).
  16. Global Renewables Outlook: Energy Transformation 2050; IRENA: Abu Dhabi, United Arab Emirates, 2020.
  17. Suresh, V.; Muralidhar, M.; Kiranmayi, R. Modelling and optimization of an off-grid hybrid renewable energy system for electrification in a rural area. Energy Rep. 2020, 6, 594–604. [Google Scholar] [CrossRef]
  18. Bagheri, M.; Shirzadi, N.; Bazdar, E.; Kennedy, C.A. Optimal planning of hybrid renewable energy infrastructure for urban sustainability: Green Vancouver. Renew. Sustain. Energy Rev. 2018, 95, 254–264. [Google Scholar] [CrossRef]
  19. Olatomiwa, L.; Blanchard, R.; Mekhilef, S.; Akinyele, D. Hybrid renewable energy supply for rural healthcare facilities: An approach to quality healthcare delivery. Sustain. Energy Technol. Assess. 2018, 30, 121–138. [Google Scholar] [CrossRef]
  20. Ali, S.; Jang, C.M. Optimum Design of Hybrid Renewable Energy System for Sustainable Energy Supply to a Remote Island. Sustainability 2020, 12, 1280. [Google Scholar] [CrossRef]
  21. Odou, O.D.T.; Bhandari, R.; Adamou, R. Hybrid off-grid renewable power system for sustainable rural electrification in Benin. Renew. Energy 2020, 145, 1266–1279. [Google Scholar] [CrossRef]
  22. Kasaeian, A.; Rahdan, P.; Rad, M.A.V.; Yan, W.M. Optimal design and technical analysis of a grid-connected hybrid photovoltaic/diesel/biogas under different economic conditions: A case study. Energy Convers. Manag. 2019, 198, 111810. [Google Scholar] [CrossRef]
  23. Gomaa, M.R.; Ala’a, K.; Al-Dhaifallah, M.; Rezk, H.; Ahmed, M. Optimal design and economic analysis of a hybrid renewable energy system for powering and desalinating seawater. Energy Rep. 2023, 9, 2473–2493. [Google Scholar] [CrossRef]
  24. Karunathilake, H.; Hewage, K.; Brinkerhoff, J.; Sadiq, R. Optimal renewable energy supply choices for net-zero ready buildings: A life cycle thinking approach under uncertainty. Energy Build. 2019, 201, 70–89. [Google Scholar] [CrossRef]
  25. Islam, M.S. A techno-economic feasibility analysis of hybrid renewable energy supply options for a grid-connected large office building in southeastern part of France. Sustain. Cities Soc. 2018, 38, 492–508. [Google Scholar] [CrossRef]
  26. Mayer, M.J.; Szilágyi, A.; Gróf, G. Environmental and economic multi-objective optimization of a household level hybrid renewable energy system by genetic algorithm. Appl. Energy 2020, 269, 115058. [Google Scholar] [CrossRef]
  27. Wang, W.; Peng, Y.; Li, X.; Qi, Q.; Feng, P.; Zhang, Y. A two-stage framework for the optimal design of a hybrid renewable energy system for port application. Ocean Eng. 2019, 191, 106555. [Google Scholar] [CrossRef]
  28. Fulzele, J.B.; Daigavane, M.B. Design and optimization of hybrid PV-wind renewable energy system. Mater. Today Proc. 2018, 5, 810–818. [Google Scholar] [CrossRef]
  29. Jeong, Y.; Lee, M.; Kim, J. Scenario-Based Design and Assessment of renewable energy supply systems for green building applications. Energy Procedia 2017, 136, 27–33. [Google Scholar] [CrossRef]
  30. Chen, P.J.; Wang, F.C. Design optimization for the hybrid power system of a green building. Int. J. Hydrogen Energy 2018, 43, 2381–2393. [Google Scholar] [CrossRef]
  31. Jung, J.; Villaran, M. Optimal planning and design of hybrid renewable energy systems for microgrids. Renew. Sustain. Energy Rev. 2017, 75, 180–191. [Google Scholar] [CrossRef]
  32. Mavroyeoryos, K.; Engonopoulos, I.; Tyralis, H.; Dimitriadis, P.; Koutsoyiannis, D. Simulation of electricity demand in a remote island for optimal planning of a hybrid renewable energy system. Energy Procedia 2017, 125, 435–442. [Google Scholar] [CrossRef]
  33. Pérez-Navarro, A.; Alfonso, D.; Ariza, H.E.; Cárcel, J.; Correcher, A.; Escrivá-Escrivá, G.; Hurtado, E.; Ibáñez, F.; Peñalvo, E.; Roig, R.; et al. Experimental verification of hybrid renewable systems as feasible energy sources. Renew. Energy 2016, 86, 384–391. [Google Scholar] [CrossRef]
  34. Nurunnabi, M.; Roy, N.K. Grid connected hybrid power system design using HOMER. In Proceedings of the 2015 International Conference on Advances in Electrical Engineering (ICAEE), Dhaka, Bangladesh, 17–19 December 2015; IEEE: Manhattan, NY, USA, 2015; pp. 18–21. [Google Scholar]
  35. Peerapong, P.; Limmeechokchai, B. Investment incentive of grid connected solar photovoltaic power plant under proposed feed-in tariffs framework in Thailand. Energy Procedia 2014, 52, 179–189. [Google Scholar] [CrossRef]
  36. Phurailatpam, C.; Rajpurohit, B.S.; Wang, L. Planning and optimization of autonomous DC microgrids for rural and urban applications in India. Renew. Sustain. Energy Rev. 2018, 82, 194–204. [Google Scholar] [CrossRef]
  37. Dhundhara, S.; Verma, Y.P.; Williams, A. Techno-economic analysis of the lithium-ion and lead-acid battery in microgrid systems. Energy Convers. Manag. 2018, 177, 122–142. [Google Scholar] [CrossRef]
  38. Usman, M.; Khan, M.T.; Rana, A.S.; Ali, S. Techno-economic analysis of hybrid solar-diesel-grid connected power generation system. J. Electr. Syst. Inf. Technol. 2018, 5, 653–662. [Google Scholar] [CrossRef]
  39. Shafiullah, G.M. Hybrid renewable energy integration (HREI) system for subtropical climate in Central Queensland, Australia. Renew. Energy 2016, 96, 1034–1053. [Google Scholar] [CrossRef]
  40. El Khashab, H.; Al Ghamedi, M. Comparison between hybrid renewable energy systems in Saudi Arabia. J. Electr. Syst. Inf. Technol. 2015, 2, 111–119. [Google Scholar] [CrossRef]
  41. Adaramola, M.S.; Agelin-Chaab, M.; Paul, S.S. Analysis of hybrid energy systems for application in southern Ghana. Energy Convers. Manag. 2014, 88, 284–295. [Google Scholar] [CrossRef]
  42. Ranaboldo, M.; Lega, B.D.; Ferrenbach, D.V.; Ferrer-Martí, L.; Moreno, R.P.; García-Villoria, A. Renewable energy projects to electrify rural communities in Cape Verde. Appl. Energy 2014, 118, 280–291. [Google Scholar] [CrossRef]
  43. Google Earth pro 7.3 2020, Petra Marriott Hotel, Jordan, 30°18′16.44″ N, 35°27′49.77″ E, Elevation 1303M. 2D Map. Available online: http://www.google.com/earth/index.html (accessed on 5 February 2021).
  44. NASA POWER|Prediction of Worldwide Energy Resources. 2021. Available online: https://power.larc.nasa.gov/ (accessed on 12 July 2021).
  45. Global Wind Atlas. 2021. Available online: https://globalwindatlas.info/ (accessed on 28 July 2021).
  46. Hiendro, A.; Kurnianto, R.; Rajagukguk, M.; Simanjuntak, Y.M. Techno-economic analysis of photovoltaic/wind hybrid system for onshore/remote area in Indonesia. Energy 2013, 59, 652–657. [Google Scholar] [CrossRef]
  47. Department of Statistics. 2021. Available online: http://dosweb.dos.gov.jo/ (accessed on 15 May 2021).
  48. Phalippou, L. An Inconvenient Fact: Private Equity Returns and the Billionaire Factory. J. Invest. 2020, 30, 11–39. [Google Scholar] [CrossRef]
  49. Canadiansolar, 2021. Available online: https://www.canadiansolar.com/ (accessed on 13 February 2021).
  50. LONGi Solar. 2021. Available online: https://en.longi-solar.com (accessed on 13 February 2021).
  51. SunPower-United States. Home Solar Panels, Commercial & Utility-Scale Solar Solutions|SunPower. 2021. Available online: https://us.sunpower.com/ (accessed on 12 March 2020).
  52. Chowdhury, S.; Chowdhury, S.P.; Crossley, P. Microgrids and Active Distribution Networks; The Institution of Engineering and Technology: London, UK, 2009. [Google Scholar]
  53. Profitable Wind Energy Sources|Eocycle. 2021. Available online: https://eocycle.com/ (accessed on 17 April 2021).
  54. Shiroudi, A.; Taklimi, S.R.H.; Mousavifar, S.A.; Taghipour, P. Stand-alone PV-hydrogen energy system in Taleghan-Iran using HOMER software: Optimization and techno-economic analysis. Environ. Dev. Sustain. 2013, 15, 1389–1402. [Google Scholar] [CrossRef]
  55. Power Converters and Inverters. 2021. Available online: https://new.abb.com/power-converters-inverters (accessed on 11 June 2021).
  56. Sinha, S.; Chandel, S.S. Review of software tools for hybrid renewable energy systems. Renew. Sustain. Energy Rev. 2014, 32, 192–205. [Google Scholar] [CrossRef]
  57. Legislation and Regulation. Legislation and regulation—Energy & Minerals Regulatory Commission. (n.d.). Available online: https://emrc.gov.jo/Pages/viewpage?pageID=256&CategoryID=8 (accessed on 14 March 2022).
Figure 1. Grid-connected hybrid renewable-energy systems.
Sustainability 15 07529 g001
Figure 2. CO2 Emission Reduction Potential by Technology.
Sustainability 15 07529 g002
Figure 3. Proposed systematic framework for optimal planning and design.
Sustainability 15 07529 g003
Figure 4. Simulation input parameters.
Sustainability 15 07529 g004
Figure 5. Power quality analyzer METREL MI 2892 and the installation.
Sustainability 15 07529 g005
Figure 6. Petra Marriott Hotel (a) photograph and (b) map showing the location of the city.
Sustainability 15 07529 g006
Figure 7. Petra Marriott Hotel location average daily global solar irradiance (GSI) monthly averages.
Sustainability 15 07529 g007
Figure 8. Monthly average wind speed at Petra Marriott Hotel location.
Sustainability 15 07529 g008
Figure 9. Average monthly electricity consumption by the Petra Marriott Hotel.
Sustainability 15 07529 g009
Figure 10. Petra Marriott Hotel energy consumption during April.
Sustainability 15 07529 g010
Figure 11. Monthly carbon dioxide emission due to grid electricity production, in tons of CO2.
Sustainability 15 07529 g011
Figure 12. Overall schematic diagram of the proposed hybrid system.
Sustainability 15 07529 g012
Figure 13. Case study Petra Marriot Hotel grid outages map: outages in black; regular grid operations in green.
Sustainability 15 07529 g013
Figure 14. Electrical energy losses from generation, transmission, and distribution in Jordan’s electrical grid.
Sustainability 15 07529 g014
Figure 15. Optimization plot of NPC against CO2 emissions.
Sustainability 15 07529 g015
Figure 16. Cost summary (a) and cash flow by component over the project lifetime (b) for the optimal configuration.
Sustainability 15 07529 g016
Figure 17. Cumulative nominal cash flow shows that the optimal configuration saves money over the project lifetime.
Sustainability 15 07529 g017
Figure 18. PV systems comparison by capital cost and production of energy.
Sustainability 15 07529 g018
Figure 19. Economic and environmental performance of the different HRES configurations.
Sustainability 15 07529 g019
Figure 20. Performance summary of the optimal configuration.
Sustainability 15 07529 g020aSustainability 15 07529 g020b
Figure 21. Excess electrical production for the optimal configuration on the selected sampling day of 17 April.
Sustainability 15 07529 g021
Figure 22. System component power output for optimal configuration on the selected sampling day of 17 April.
Sustainability 15 07529 g022
Figure 23. Energy purchased from grid (kW) energy and sold to the grid (kW) for the optimal configuration on the selected sampling day of 17 April.
Sustainability 15 07529 g023
Figure 24. Monthly average electric production for the optimal configuration.
Sustainability 15 07529 g024
Figure 25. Major gas emissions for the optimum case.
Sustainability 15 07529 g025
Figure 26. NPC and COE of the optimal HRES in different regions worldwide.
Sustainability 15 07529 g026
Table 1. Literature review summary for hybrid renewable-energy systems.
Ref.ConfigurationComponentLocationSoftwareResult Summary
Suresh et al. [17]Off-grid HybridBiogas–PV–WT–Fuel Cell as BatteryIndiaGenetic Algorithm (GA) and HOMERCOE was at 0.163 USD/kWh illustrating the use of multisystems.
Bagheri et al. [18]Off-grid HybridBiomass–PVCanadaHOMERNPCs were 59, 116, and USD 290 M and illustrate three different places
Olatomiwa et al. [19]Off-grid HybridPV–WT–DG–BatteryNigeriaHOMERNPC USD 102,949 and the COE 0.311 USD/kWh illustrate high cost.
Ali and Jang [20]Off-grid HybridPV–WT–Pumped Hydro Storage–BatterySouth KoreaHOMERCOE at 0.159 USD/kWh and NPC USD 11.3 M, illustrate an economic comparison between the PHS and a battery and indicate that PHS can be a cheaper choice
Odou et al. [21]Off-grid HybridPV–DG–BatteryBenin RepublicHOMERShows that an off-grid hybrid system was a suitable technology to sustainably electrify the village of Fouay with a COE of 0.207 USD/kWh.
Kasaeian et al. [22]Off-grid HybridPV–DG–BiomassIranHOMERThe NPC USD 23,148.84 illustrates the benefits of using an HRE system with Biomass over a PV/DG system.
Kasaeian et al. [22]On-grid hybrid systemPV–Biomass–DGIranHOMERResulted in a comparative cost for the gid purchase with COE 0.13 USD/kWh and NPC USD 0.97 M
Karunathilake et al. [24]Off-grid HybridPV–Heat PumpsCanadaENERGY-PLUSPaid back within (22–23) years. And the per capita annual energy cost saving with the proposed system was USD 7. RE energy systems feasible environmental and energy security.
Islam, Md Shahinur [25]On-grid HybridPV–GridFranceHOMERThe result shows that the PV/Grid system was the most cost-effective system configuration and minimizes above 90% emission compared to the existing emission in the study site, with COE of 0.087 USD/kWh.
Chen and Wang [30]Off-grid HybridPV–WT–DGChina(MATLAB) (SimPowerSystem)Improve the system reliability from Loss of Power Supply Probability (LPSP) 5.08% to 0%.
Jung and Villaran, [31]Microgrid Hybrid SystemsPV–DG–BatteryUSDER-CAMIllustrate the efficiency improvement to a proposed hybrid system
Mavroyeoryos et al. [32]Electrical Energy DemandPV–WTGreekExploratory data analysisIllustrate a considerable correlation between energy consumption and temperature
Pérez-Navarro et al. [33]On-grid Hybrid SystemPV–WT–Biomass–BatterySpainLABDER laboratory Illustrated the best feasibility by standard demand curve of the residential segment
Nurunnabi et al. [34]On-grid off-grid Hybrid SystemPV–WT–GridBangladeshHOMERIllustrate cost-effective value with NPC USD 0.535 M and COE 0.099 USD/kW
Peerapong and Limmeechokchai [35]On gridPV–GridThailandRETscreenFor the residential rooftop and the integrated ground-mounted and rooftop with 0.48 USD/kW and 0.31 USD/kW
Phurailatpam et al. [36]On-grid hybrid systemPV–WT–Biodiesel GeneratorIndiaHOMERIllustrate acceptable COE 0.269 USD/kWh and NPC of 0.613 MUSD
Dhundhara et al. [37]On-grid hybrid systemPV–WT–Battery–GridIndiaHOMERWith COE of 0.225 USD/kWh and NPC of 1.12 MUSD and illustrate the high cost of using a storage system
Usman et al. [38]On-grid hybrid systemPV–DG–GridIndiaHOMER ProNPC of USD 3.12 M and CEO of USD 0.120 illustrate solar energy penetration of 18% of the total load
Shafiullah, G.M. [39]On-grid HybridPV–WT–Battery–GridAustraliaHOMERUsing the wind-solar hybrid system was more economical than using a PV grid-connected with a payback of 7.8 years for the hybrid system for a PV–Battery–Grid-connected system, NPC, COE, and RF are 16,347 USD/year, 0.240 USD/kWh and 0.77, respectively.
El Khashab and Al Ghamedi [40]Off-grid HybridPV, wind turbine, and fuel cellSaudi ArabiaHOMERThe researchers imply that the energy cost for the three investigated systems was still high due to the high cost of imported RE systems without locally fabricated system parts with each system found to be 0.36 0.49 and 7.3 USD/kWh, respectively.
Adaramola et al. [41]Off-grid Hybridsolar panels, wind turbines, and diesel generatorsGhanaHOMERThe results show that the electricity costs for this hybrid system were 0.281 USD/kW h. and the result will be a guide to the government policy and investment in Ghana.
Ranaboldo et al. [42]Off-grid Hybridwind and solar photovoltaic systemCape VerdeHOMERThe results show that when using the hybrid renewable system of energy in demand points with microgrids it can save more than 30% of the initial investment comparing with individual generation configurations.
Table 2. GHG emissions factors.
ParameterGHG Emission Factors (CO2/MWh)Conversion Factors
Electricity0.670-
LPG0.22713.1 MWh/ton
Diesel0.26710 kWh/l
Table 3. Fuel consumption for electricity generation (T.T.O.E).
Fuel2016201720182019Percent
Heavy Fuel344.6454.2120.015.187.4%
Natural Gas3377.13340.93402.23337.91.9%
Diesel13.69.44.21.857.1%
Total3735.33804.43526.43354.84.9%
Table 4. Summary of different optimized grid-connected HRES configurations ranked by NPC.
RankConfigurationSystem ComponentOptimum SizeNPC (MUSD)COE (USD//kWh)RF (%)Capital Cost (USD)Replacement Cost (USD)O&M (USD)Salvage (USD)Grid Consumption (USD)GHG (kg/Year)
1FifthPV
WT
Converter
DG
573 KW
20 Qty.
317 KW
275 KW
1.160.041584.11.40 M379,916−403,238−216,047344,156218,497
2FourthPV
WT
Converter
Battery
DG
562 KW
20 Qty.
303 KW
2 strings
275 KW
1.170.041984.11.40 M385,637−396,753−215,872343,639218,170
3FirstPV
Converter
DG
1050 KW
413 KW
275 KW
1.2750.04956.5420,79029,792804,476−9066861,570546,481
4SecondPV
Converter
Battery
DG
982 KW
403 KW
6 strings
275 KW
1.2570.04956431,52643,322828,517−16,501865,027549,777
5ThirdWT
DG
Converter
Battery
18 Qty.
160 KW
490 KW
89 strings
2.0970.096969.61.19 M493,292615,529−201,586507,666321,993
6Base caseDG Grid275 KW2.540.1310002.53 M−34511,502,474952,763
Table 5. Savings summary of different optimized grid-connected HRES winning configurations.
ComponentCase 1Case 2Case 3Case 4Case 5Unit
Annualized Utility Bill Saving145,696143,017151,427236,760237,389USD/year
Internal Rate of Return (IRR)32.733.711.615.815.8%
Payback Period3.052.957.605.995.98Year
Fuel Consumption 745742434374375(L/year)
Table 6. PV systems comparison.
ParameterSunPowerCanadianSolarLongiSolarUnit
Rated power0.3270.4750.44kW
Size573518535kW
Capital cost183,335212,524203,481USD
O&M88,87780,41283,068USD/year
Efficiency20.42121.1%
Production1,047,159930,882955,599kWh/year
Table 7. Optimized equipment sizes and cost results associated with each case studied.
RankConfigurationNPC Reduction
(%)
COE
Reduction
(%)
O&M
Reduction
(%)
Grid Consumption
Reduction
(%)
GHG Reduction
(%)
1Fifth546811676.9277.1
2Fourth536811577.1277.22
3First50626842.6241.45
4Second50626742.4142.32
5Third18267566.2365.93
Table 8. Storage system comparison.
ParameterCase 1Case 2Case 3Case 4Case 5Unit
Using storageNoYesNoYesNoYes–No
Battery size06020String
COE0.04880.05080.09690.04190.0415USD/kWh
NPC1,252,7331,293,5782,097,2641,173,6151,165,217USD
Battery annual throughput02807012890kWh/year
Hybrid system production1,921,6551,797,0141,172,2002,329,6362,348,993kWh/year
Battery percentage throughput00.1500.050%
Table 9. Production summary for the optimal configuration.
ComponentProduction (kWh/Year)Percent
SunPower SPR-E20-3271,047,15938.9
CAT-C9 Prime10190.0378
Eocycle EO101,300,81548.3
Grid Purchases344,15612.8
Total2,693,150100
Table 10. Reliability summary for the optimal configuration.
QuantityDuring OutageUnit
Diesel Generator DG run time8.73Hours/day
Diesel Generator DG O&M cost0.0873USD/day
Diesel Generator DG fuel consumption409L/day
Diesel Generator DG fuel cost286USD/day
Capacity-shortage hours0Hour
Table 11. Summary of electrical-energy production and consumption results for the optimal configuration.
ComponentProduction (kWh/Year)PercentLoadkWh/YearPercent
SunPower SPR-E20-327 1,047,15938.9Electrical load2,173,742100%
CAT-C9 Prime10190.0378Electrical excess491,57618.3
Eocycle EO101,300,81548.3Unmeted load00
Grid Purchases344,15612.8Capacity shortage00
Total2,693,150100
Table 12. Cost summary of the optimal configuration scenario.
NameCapitalOperatingReplacementSalvageResourceTotal
CAT-C9 PrimeUSD 44,000USD 1.03USD 0.00−USD 10,517USD 3,389USD 36,873
EDCOUSD 0.00−USD 543,826USD 0.00USD 0.00USD 0.00−USD 543,826
Eocycle EO10USD 1.12 MUSD 51,710USD 357,064−USD 201,229USD 0.00USD 1.33 M
SunPower SPR-E20-327 USD 183,335USD 88,877USD 0.00USD 0.00USD 0.00USD 272,212
System ConverterUSD 53,861USD 0.00USD 22,852−USD 4,301USD 0.00USD 72,412
SystemUSD 1.40 M−USD 403,238USD 379,916−USD 216,047USD 3,389USD 1.17 M
Table 13. Major gas emission for the optimum case.
QuantityValueUnit
Carbon Dioxide218,497kg/year
Carbon Monoxide0.604kg/year
Unburned Hydrocarbons0.0173kg/year
Particulate Matter0.0570kg/year
Sulfur Dioxide945kg/year
Nitrogen Oxides471kg/year
Table 14. NPC and COE of the optimal HRES in different regions worldwide.
RegionHRES StructureNPC (MUSD)COE (USD/kWh)SimulationGrid TypeReference
IranPV–DG–BIO DG–Converter–Grid0.9700.130HOMER ProOn gridKasaeian et al. [22]
BangladeshPV–WT–Converter–Grid0.5350.099HOMER ProOn gridNurunnabi et al. [34]
ThailandPV–Converter–GridN/A0.280RETscreenOn gridPeerapong and Limmeechokchai, [35]
IndiaPV–WT–Converter–Grid0.6130.269HOMER ProOn gridPhurailatpam et al. [36]
IndiaPV–WT–Converter–Battery–Grid1.120.225HOMER ProOn gridDhundhara et al. [37]
IndiaPV–Converter–Grid3.120.120HOMER ProOn gridUsman et al. [38]
JordanPV–WT–Converter–DG–Grid1.160.0415HOMER GridOn gridCurrent study 2021
Disclaimer/Publisher’s Note: The statements, opinions and data contained in all publications are solely those of the individual author(s) and contributor(s) and not of MDPI and/or the editor(s). MDPI and/or the editor(s) disclaim responsibility for any injury to people or property resulting from any ideas, methods, instructions or products referred to in the content.