Abstract
This article constructed a four-level fresh agricultural product (FAP) supply chain with a two-stage pricing strategy under a “community group purchase (CGP) platform + direct procurement from the FAP supplier” sales model. We investigate the influence of the CGP agency’s participation in the control strategy of FAP freshness preservation efforts on the profits of supply chain stakeholders. This article discusses the effects of the FAP supplier profit-sharing ratio, the CGP agency profit-sharing ratio, and consumers’ sensitivity to FAP freshness on the supply chain stakeholders’ freshness preservation efforts. Moreover, based on the fairness preference theory, this article designed a profit-sharing contract that involves the Nash bargaining game between the FAP supplier and the CGP agency as the supply chain coordination mechanism. Modeling results revealed that: (1) The CGP agency’s freshness preservation efforts increased total supply chain profits. (2) The FAP supplier profit-sharing ratio, CGP agency profit-sharing ratio, and consumers’ sensitivity to FAP freshness have a positive correlation to the profits of the FAP supply chain and promote the coordination of the supply chain. (3) Considering fairness preferences, with the increase in FAP suppliers’ business negotiating ability, their freshness preservation efforts and fairness utility both increased gradually, while the fairness utility of the CGP agency gradually decreased.
1. Introduction
The production and consumption of fresh agricultural products (FAP) play a significant role in the development of agricultural economics [1,2]. With the rapid development of information technology and emerging retail modes, consumption patterns have also evolved, where the online purchase of FAPs turns out to be a significant supplement to accommodate residents’ fast-paced life [3,4]. Compared with the traditional sales model, the online sales model of FAPs has the advantages of lower customer attraction costs, higher circulation efficiency, and more affordable prices. The outbreak of COVID-19 further stimulates the expansion of online purchases of FAPs since its contactless delivery method minimizes health concerns during the COVID-19 pandemic and provides many conveniences for residents who are quarantined [5,6,7,8]. Moreover, the pandemic expedites new paths for FAP online sales, such as the community group purchase (CGP) via various e-commerce platforms. CGP is a group purchase mode of “online booking + offline self-pickup” initiated by the CGP agency.
The CGP mode originated in Changsha, Hunan Province, in 2016. It relies on offline physical communities and online group purchase platforms, which provides strong advantages for e-commerce companies as it solves the problem of high logistics costs and spoilage in groceries, eventually enabling consumers to have a prohibitive price in smaller quantities [9,10]. Initially, companies such as the “Furong Xingsheng” e-commerce platform utilized their supply chain advantages to begin exploring online group purchases and delivery to community pickup stations [11]. At the beginning of 2020, the outbreak of the COVID-19 pandemic changed people’s consumption patterns, leading to renewed interest in the CGP mode based on mutual trust between neighbors, which attracted investment from various enterprises, including Chinese internet giants “Meituan”, “Pinduoduo”, and “Alibaba”. Currently, the three major CGP platforms, “MeituanYouxuan” [12], “DuoduoMaicai” [13], and “TaocaiCai” [14] are popular among Chinese consumers. Compared to traditional e-commerce, CGP can deliver goods directly from the origin (factory or large transfer warehouse) to the community, with the last mile delivery handled by the CGP agency or by consumers themselves, which reduces the cost of each transaction. In the CGP supply chain, the CGP agency is an important bridge connecting consumers and the platform and plays a dual role in product delivery and community operation. According to statistics from the China ZhongYanPuHua Industry Research Institute in 2021, the number of CGP users in China reached 646 million (including 2 million CGP agencies), with a transaction scale of 120.5 billion yuan [15].
However, unlike industrial products, FAPs are usually labor-intensive products that generally have a low gross unit profit, and their heavy shipping weights and the requirements for freshness preservation effects call for higher logistics costs in comparison with other merchandise [16,17,18,19]. Moreover, without an interactive coordination between the supplier(s) and the point-of-sale terminal(s), in other words, the information asymmetry within the various stakeholders of the FAP supply chain could mislead the operations of the supply chain and result in unnecessary logistics spatio-temporal costs [20,21,22,23]. These features limit the establishment of a stable and long-term strategic partnership between the supplier and consumers.
Currently, the CGP mode is still in the development stage in China. The operational efficiency of the FAP supply chain under this mode needs to be further improved. The low willingness of CGP agencies to invest in preservation and the high terminal loss rates of FAPs in the supply chain are still problems that need to be urgently solved in the future. In recent years, how to distribute profits among stakeholders in the FAP supply chain has become a popular research topic. Previous research efforts have proven that the supply chain profit-sharing contract has the potential to improving supply chain operations efficiency by coordinating various stakeholders in the supply chain, eventually reducing the logistics costs of FAPs [24,25,26,27,28]. Nevertheless, a key concern in the operation of the CGP model is the optimization of the FAP supply chain, such as cost control, risk sharing, profit allocation, etc. A CGP platform-based FAP supply chain is a relatively complex system that mainly consists of suppliers, logistics service providers, CGP platforms, CGP agencies, and consumers. Since the CGP platform is an emerging sales model, in current practice, there is a lack of sufficient research on the profit-sharing between the supply chain stakeholders and the operational improvement of the FAP supply chain. Therefore, to improve the operational efficiency of the CGP platform-based FAP supply chain, there is an urgent need to investigate the profit-sharing as well as the collaborative decision-making mechanisms between various stakeholders in the supply chain. In this regard, this article takes the CGP agency’s “last mile preservation” problem as the starting point and constructs a theoretical model of the profit-sharing contract for the FAP supply chain under the CGP mode. Findings from this research provide theoretical guidance for the reasonable distribution of profits among stakeholders of the CGP-based FAP supply chain (supplier-platform-CGP agency), which is of great significance for the sustainable development of Chinese community group purchase platform enterprises.
2. Literature Review
2.1. FAP Supply Chain Management
For the management of FAP supply chain systems, Grimsdell [29] pointed out that the coordination of communication between stakeholders of the fresh vegetable supply chain is critical for the operations of the supply chain because, with a better understanding of each other’s needs, stakeholders in the supply chain can make more effective investment decisions to reduce operational costs and increase profits.
Widodo et al. [30] indicated that an effective supply chain management model is required to reduce the loss rate of FAPs. The research developed a mathematical model to deal with the periodical harvests in the flowering market, and an optimal harvesting pattern was derived to maximize the satisfied level of demand. Zhao et al. [31] pointed out that a manufacturer-retailer supply chain commonly adopts a wholesale price mechanism, which often leads to conflicts of interest between manufacturers and retailers. With this concern, the research employed a cooperative game approach to solve the coordination issue in a manufacturer-retailer supply chain using option contracts. Results show that compared with the benchmark based on the wholesale price mechanism, option contracts can coordinate the supply chain and achieve Pareto-improvement. Azad et al. [32] analyzed the joint decision-making and decentralized decision-making of a two-stage supply chain for three strategies: subcontractors in stocks, out-of-stock orders, and subcontracting strategies. Research results showed that the joint decision-making strategy provided a higher total profit than the decentralized decision-making strategy at each stage of the production and sales circle. Cai et al. [33] considered a three-tier fresh product supply chain that is composed of a supplier, a third-party logistics provider, and a distant market. The research assumed the market demand is random and sensitive to the sales price and the freshness of the product and proposed an incentive scheme that involves a wholesale-market clearance contract between the producer and the distributor and a wholesale-price-discount sharing contract between the producer and the logistics provider to coordinate the supply chain. Dellino et al. [34] proposed a model that enables sales forecasting according to outdating, shortage, freshness of products, and residual stock for providing order plans for packaged fresh and highly perishable products with associated satisfactory performances. Jabarzare and Rasti-Barzoki [35] developed a dual-channel supply chain that contains a manufacturer and a packing company under price- and quality-dependent demand. The research aimed at investigating the effects of various game structures on optimal pricing and quality decisions and the profits of the supply chain. Modeling results suggested that the competitive game between manufacturer and packaging company is highly beneficial for price-seeking customers, especially under a profit-sharing contract and when the customers’ demand is highly sensitive to the product’s quality. Dolat-Abadi [36] constructed a model for the daily and bourse markets under a farmer-retailer Stackelberg game. A mathematical coordination model using a novel two-part tariff contract was developed between the farmer and retailer in the market. Results demonstrated that the profit of both farmers and retailers under the bourse market was greater than the daily market. Moreover, the coordinated strategy increased the retailer’s profit as well as its order quantity, the farmer’s freshness-keeping investment as well as its profit, and the entire FAPSC’s profit compared to the decentralized strategy. The quantity of wasted products and the retail price under the coordinated strategy was lower than that under the decentralized strategy. Yu and Xiao [37] developed game-theoretic models for a FAP supply chain that consists of a supplier, a retailer, and a third-party logistics provider. The research compared two service outsourcing modes: supplier outsourcing and retailer outsourcing. Results show that under a traditional quantity discount scheme, retailer outsourcing is preferred under a low market size condition. Otherwise, supplier outsourcing is better under low service costs and high market size scenarios.
2.2. Profit-Sharing Contract
In terms of the design and implementation of profit-sharing contracts, Gan et al. [38] took into account the risk-averse agents for the coordination of supply chains. The research designed the contract to achieve the Pareto-optimal solution, and it was found that the Nash Bargaining solution could be reached when the supplier and the retailer each maximize their own expected utility.
Leng and Parlar [24] employed game theory to model the delivery cycle in a two-level supply chain with a manufacturer and a retailer. The three components of a delivery cycle are preparation, production, and shipment time. A profit-sharing contract was designed to coordinate the supply chain. It was found that the profit-sharing contract could maximize the system-wide profit if the manufacturer is responsible for the preparation time and production time at their normal durations. Sheu [25] explored the equilibrium of a supplier-retailer distribution channel under two scenarios: with and without revenue-sharing contracts. Based on analytical modeling, the research revealed that both the supplier and retailer can earn higher profits through revenue-sharing contracts under appropriate promotional pricing strategies. Mohammadi et al. [39] developed a novel coordination mechanism based on preservation-technology investment, proposed, and analyzed three decision-making approaches: a decentralized approach, a centralized approach, and a coordinated approach. They designed a new coordination contract named revenue-and-preservation-technology-investment-sharing (RPTIS). Results demonstrated that the proposed RPTIS mechanism was able to achieve a fresh-product supply chain (FSC) coordination and convince members to make globally optimal decisions. Moreover, the proposed mechanism not only increased the whole FSC profit along with the individual members’ profit, but also significantly increased the freshness and surviving quantities of fresh products, thereby reducing the level of product waste. Yang and Tang [40] developed a supplier-retailer fresh product supply chain under three sales modes to identify optimal pricing and freshness-keeping efforts. Results show that in a decentralized system, the dual-channel mode could outperform the online-to-offline mode for the supplier. Nevertheless, when the system was coordinated, the online-to-offline mode resulted in the highest profit for the supply chain. Ghazanfari et al. [41] investigated the effect of government incentives on a fresh-product supply chain with stochastic demands. The research compared the traditional selling cycles in the open market without government incentives to a modern selling cycle in an organized market with government incentives through a real-world case study. Research findings indicated that government incentives increased the profit of all the stakeholders in the fresh-product supply chain. Song and He [26] developed a three-level FAP supply chain that consists of an e-commerce platform, a third-party logistics provider, and a community convenience store. Various contract coordination mechanisms were employed to improve supply chain operations. Results show that a decentralized supply chain can be coordinated by a freshness preservation cost-sharing and revenue-sharing contract to maximize the total profit, which also satisfies consumer requirements. Moon et al. [27] investigated the investment decision procedure in a FAP supply chain under three scenarios: a decentralized scenario, revenue-sharing coupled with investment cost-sharing, and incremental quantity discount contracts. The research revealed that an incremental quantity discount contract could encourage the manufacturer to charge a wholesale price that is higher than the marginal cost, which could maximize the utility of the supply chain. Sarkar and Bhala [42] showed that a constant wholesale price contract can coordinate a decentralized channel in a manufacturer-led closed-loop supply chain. The research recommended that when supply chain coordination is achieved by a constant wholesale price contract, it would be more efficient to have the manufacturer collect the end-of-use products, particularly when the cost of increasing the collection rate is high.
3. Model Specifications
A FAP supply chain under CGP mode consists of a FAP supplier, a CGP platform, a CGP agency, and consumers. The CGP agency provides last-mile delivery services for the platform and charges a certain percentage of commission to the CGP platform. The FAP supply chain under the traditional model and the CGP model are shown in Figure 1a,b, respectively.

Figure 1.
FAP supply chain under (a) traditional mode and (b) community group purchase (CGP) mode.
This article considers a four-level FAP supply chain system composed of a FAP supplier, a CGP platform, a CGP agency, and consumers under the model of “CGP platform + direct procurement from the FAP supplier”. In this supply chain, the CGP platform first purchases FAPs from the supplier and arranges logistics service providers to distribute them to shared warehouses located in different regions; then, the platform determines the price of each FAP for consumers to place orders through the CGP agency. For each group order, the platform will deliver the FAPs to the self-pickup point near the community, and the CGP agency will sort the FAPs and notify consumers to pick up their orders. After each sale, the platform pays a certain percentage of commission to the CGP agency based on the total profit of the FAPs. Note that during the FAP procurement and sales processes, the FAP supplier, the CGP platform, and the CGP agency will make a certain degree of freshness preservation efforts to reduce the loss of FAPs.
The primary research problem to be investigated by this article is, based on the four-level FAP supply chain, to figure out the influence mechanism of various factors on the freshness preservation efforts and the profit-sharing of the supply chain stakeholders under a two-stage pricing strategy. The influence factors mainly include consumers’ sensitivity to FAP freshness, the profit-sharing ratios of supply chain stakeholders, and business negotiation abilities. The key methodology of this research is to construct a two-stage discount pricing model under two scenarios: (1) with complete rationality, and (2) with fairness preference. It is expected that the proposed analytical model will compare the correlation between supply chain stakeholders’ freshness preservation efforts and profit-sharing mechanisms under the two scenarios.
4. Methodology
4.1. Assumptions
To facilitate the modeling process, the following reasonable assumptions were made based on the actual conditions of the FAP supply chains in China:
Assumption 1.
Assuming that the life cycle of a FAP is , regardless of the maturity period, during time period , the FAP supplier’s freshness preservation effort is , and the freshness preservation cost is , where () represents the coefficient of freshness preservation effort on freshness preservation cost; a larger freshness preservation effort is associated with a higher freshness preservation cost.
Assumption 2.
The FAP supplier sells the product to the CGP platform at a wholesale price, , at time , and CGP platform sells the product during time interval . During this period, to reduce the loss of the CGP platform’s freshness preservation effort is , and the freshness preservation cost is .
Assumption 3.
To reduce the loss of FAP at the point-of-sale terminal, the CGP agency needs to make certain freshness preservation efforts before distributing FAPs to consumers. Its freshness preservation effort is , and the freshness preservation cost is . If the CGP agency did not take freshness preservation measures, which reduce consumers’ degree of satisfaction, the CGP agency needs to make a compensation to the CGP platform at a ratio of φ.
Assumption 4.
The price and freshness of FAPs on the CGP platform will affect consumers’ demand for FAPs. Referring to the existing literature, this research assumed that consumers’ demand for FAPs from the CGP platform is: , where refers to FAP market size, ; is the sensitivity of CGP platform consumers to the freshness of FAPs, , and is the sensitivity coefficient of consumers to the price of the FAP. Since the freshness of FAPs decays with time, the CGP platform sells the FAPs at the market price, , during time interval , and sells at a discount rate, , during time interval (i.e., the discounted sell price is ).
Assumption 5.
Both the FAP supplier and the CGP platform invest in freshness preservation efforts. In time interval , the FAP supplier invests in a freshness preservation effort of . Then, the FAP freshness when the supplier delivers the product to the CGP platform is . The freshness of the product is after the CGP platform invests in freshness preservation efforts. In the FAP point-of-sale terminal, if the CGP agency invests in freshness preservation efforts, the freshness of the FAP is , where is the initial freshness of FAPs, and , , and are the effects of the freshness preservation efforts invested by the FAP suppler, the CGP platform, and the CGP agency, respectively.
Assumption 6.
Since the freshness of FAPs decays with time, this research assumes that a consumer’s demand varies with time. Based on a previous research effort conducted by Chen and Dan [43], the FAP demand function was depicted as: , where .
Assumption 7.
Assuming that a CGP platform makes only one bulk order from the FAP supplier, no replenishments apply. The pre-sale allows the FAP supplier to have sufficient time to prepare the FAP without considering the situation of being out of stock. The FAP stock of the CGP platform’s shared warehouse is ; when , the product is sold out on the CGP platform, and .
Assumption 8.
Compared with CGP platforms, FAP suppliers and CGP agencies are in a disadvantaged position in the supply chain, and their business negotiating abilities are relatively weak. Assuming that both the FAP suppliers and the CGP agency have fairness preferences, the selection of a fairness reference point depends on the Nash equilibrium of negotiating ability. The negotiating ability of the supplier is , the negotiating ability of the CGP agency is , where .
Other parameters involved in this research are described as follows:
- : FAP supplier’s production and harvesting costs;: Cost of FAP suppliers due to loss;: Loss ratio of FAP suppliers;: Cost of the CGP platform due to loss;: Loss ratio of the CGP platform;: Unit inventory cost of the CGP platform;: FAG supplier logistics cost;: Logistics cost of the CGP platform;: FAG freshness with freshness preservation efforts;: FAP freshness decay rate;: Natural depletion rate of shared warehouse inventory;: Profit sharing ratio of the CGP agency (i.e., agency fee);φ: Compensation ratio of the CGP agency;: Profit sharing ratio of FAP suppliers;Sales discount of the CGP platform;The first stage of the FAP sales cycle;The second stage of the FAP sales cycle.
4.2. Optimal Decisions of the FAP Supplier and CGP Agency under Complete Rationality
This section discusses the profit-sharing mechanism of the FAP supply chain based on a two-stage discount pricing strategy considering the CGP agency’s freshness preservation efforts, including (1) that the CGP agency does not make full freshness preservation efforts and (2) that the CGP agency makes full freshness preservation efforts.
4.2.1. CGP Agency Does Not Make Full Freshness Preservation Efforts
A CGP agency that does not make full freshness preservation efforts means that the CGP agency has not invested in the freshness preservation efforts, or the freshness preservation efforts have been insufficiently invested. Under such conditions, the CGP agency will not receive profit from the CGP platform and will be charged for compensation for the losses incurred.
Based on Assumption 1, time period is the first stage of the FAP sales cycle. In this stage, the CGP platform sells fresh FAPs at the unit price, . Under this condition, even if the FAP supplier and CGP platform have invested in freshness preservation efforts; however, since the CGP agency does not make sufficient freshness preservation efforts at the point-of-sale terminal, there is a possibility that consumers submit return requests to the CGP platform. The CGP platform requires the CGP agency to compensate for the returned orders with a compensation ratio of . At this stage, the decision-making processes of the supplier, the CGP platform, and the CGP agency are described as follows:
- (1)
From to , when the CGP agency does not make freshness preservation efforts, the profit function of the supplier and the CGP platform is:
where the first item is the average profit of the FAP supplier; the second item is the transportation cost of the logistics service provider; the third item is the freshness preservation cost of the FAP supplier; and the last item is the profit of the FAP supplier during time period to .
where the first item is the average profit of the CGP platform during time period to ; the second item is the average inventory cost during this period; the third item is the logistics cost of the CGP platform; and the last item is the freshness preservation cost invested by the CGP platform.
In the case that the CGP agency does not invest in freshness preservation efforts, the CGP agency will receive no competition and may need to pay a certain compensation; therefore, its profit is .
where is the compensation cost of the CGP agency, which is opposite to its profit.
The demand function for a FAP is:
During the warehouse inventory stage, considering the perishable characteristics of FAPs, this research developed a FAP inventory model as follows:
When , the FAP inventory model (Equation (5)) could be transformed by deriving its general solution from the ordinary differential equation:
Under the circumstance that the CGP agency does not make full freshness preservation efforts, when , , the optimal freshness preservation efforts of FAP suppliers and CGP platforms are described by Equations (7) and (8), respectively:
- (2)
The second stage of the FAP sales cycle is from time to . During this period, even though the supplier and the CGP platform have invested in freshness preservation efforts, the freshness of the FAP has significantly deteriorated in comparison with the first sales stage. Therefore, the CGP platform starts to sell the remaining FAPs stored in the shared warehouse at a discounted price from time . Assuming the discount rate is , and the discounted price is .
Similar to the t1~tn stage, when , , the optimal freshness preservation efforts of the supplier and the CGP platform are presented in Equations (9) and (10), respectively:
4.2.2. CGP Agency Makes Full Freshness Preservation Efforts
The CGP agency’s full commitment to freshness preservation efforts means that in a CGP-based FAP supply chain, the CGP agency needs to maintain the freshness of the ordered FAPs by refrigerating or other methods before consumers pick up their orders. When the CGP agency makes full freshness preservation efforts, the profit-sharing model of the FAP supply chain based on two-stage discount pricing is described as follows:
- (1)
The time period is the first stage of the FAP sales cycle. At this stage, the CGP platform sells FAPs at the unit price . Under the circumstance that the CGP agency makes full freshness preservation efforts, the FAP supplier, the CGP platform, and the CGP agency will share the profits. Based on the above assumptions, the profit function of the FAP supplier is:
In Equation (11), the first item is the average profit of the FAP supplier; the second item is the logistics cost; the third item is the FAP supplier’s freshness preservation cost; and the fourth item is the community group purchase. The platform shares the revenue with suppliers for the period . The profit function of the group leader is:
In Equation (12), the first item is the profit-sharing that the CGP platform offers the CGP agency during period (i.e., compensation), and the second item is the CGP agency’s freshness preservation cost. Then, the profit function of the CGP platform is specified as:
In Equation (13), the first term is the average profit of the CGP platform in sales period ; the second term is the average inventory cost during this period; the third term is the logistics cost of the CGP platform; and the fourth term is the CGP platform’s freshness preservation cost. Based on the previous assumptions, the time-varying demand function of FAPs in period is:
Similarly, the shared warehouse inventory model of the CGP platform at this stage is described as follows:
Under a completely rational situation, the FAP supplier determines its optimal freshness preservation effort that can maximize its profits. When , this research derived the first-order partial derivative of the supplier’s profit function, , with respect to and , and set its first-order partial derivative equal to 0. When , the FAP supplier’s optimal freshness preservation effort and optimal sales price could be obtained, as shown in Equations (17) and (18), respectively:
When the decision-making goal of the FAP supplier is to maximize its profit, its freshness preservation effort is mainly related to the profit-sharing ratio, the discount sales period, the FAP freshness decay rate, and consumers’ sensitivity to price. In the first stage of the sales cycle, the relationship between the supplier’s freshness preservation effort and the discount rate at time period is depicted in Equation (19). Similarly, Equation (20) illustrates the correlation between the supplier’s freshness preservation effort and consumers‘ sensitivity to freshness, , as follows:
After the supplier sells the FAPs to the CGP platform, the CGP platform will continue to make freshness preservation efforts to maintain the freshness of the FAPs in pursuit of a relatively high sales price. When , by deriving the first-order partial derivative of the profit function of the CGP platform, , with respect to , and making its first-order derivative equal to 0, the optimal freshness preservation effort of the CGP platform could be obtained when , as shown in Equation (21).
The freshness preservation efforts of the CGP platform are jointly determined by the decay rate of FAPs, the profit-sharing ratios of the supplier and the CGP agency, unit inventory cost, and discounted sales time. To analyze the influence of discounted sales time on the CGP agency’s freshness preservation efforts, it is necessary to derive the first-order partial derivative for the discount sales time, .
Let:
When , a shorter discounted sales time corresponds to a higher freshness preservation effort from the CGP platform.
The CGP platform entrusts a logistics service provider to deliver FAPs to the CGP agency. As the point-of-sale terminal for FAPs, the CGP agency needs to continue to keep the FAPs fresh. When , derive the first-order partial derivative of the CGP platform’s profit function with respect to , and set its derivative equal to 0 to obtain the CGP agency’s optimal freshness preservation effort:
Under the condition that the CGP agency makes freshness preservation efforts, the level of investment in freshness preservation efforts is mainly affected by the profit-sharing ratio, discounted sales period, and FAP freshness decay rate. The relationship between CGP agency’s freshness preservation effort and discounted sales time, , is:
- (2)
The time period is the second stage of the FAP sales cycle. Different from sales stage , a discounted price will be applied, which will affect the freshness preservation efforts from the supplier, the CGP platform, and the CGP agency. Similar to time period , when , , the optimal freshness preservation efforts of the supplier, the CGP platform, and the CGP agency are presented in Equations (25) to (27), respectively:
4.3. Optimal Decisions of the FAP Supplier and CGP Agency under Fairness Preference
In reality, people usually have fairness preferences, such as whether the distribution of profits is fair, or whether the motivation of an activity is fair [44,45,46]. In current practice, the models describing fairness preference mainly include two types: fairness focusing on behavioral motivation [47] and fairness focusing on distributional outcomes [48].
In the CGP platform-based FAP supply chain, the FAP supplier and CGP agency are typically in a relatively weak position with disadvantaged business negotiating abilities. Based on the F-S theoretical model proposed by Fehr and Schmidt [48], this research defined the utility function of the FAP supplier and the CGP agency as the following:
Then, this research employed the Nash equilibrium negotiation model, which considers the negotiating ability of each stakeholder as a fair reference point for discussing the fairness of profit distribution between the FAP supplier and the CGP agency. At this step, the fairness of the CGP platform is ignored, and the utility function of the CGP platform is expressed as: . Then, the fairness utility function of the FAP supplier () and the CGP agency () are as described follows:
where is the fairness reference point for the FAP supplier and the CGP agency, that is, the Nash equilibrium negotiation solution between the FAP supplier, the CGP agency, and the CGP platform. Among them, is the unfairness avoidance coefficient of the FAP supplier of the CGP agency, . Based on Assumption 8, the Nash negotiation objective function of the FAP supplier, the CGP agency, and the CGP platform is the following:
Bringing , , and into the objective function, we have:
Taking the first-order partial derivative of Equation (29), we obtain the following:
Let its first-order partial derivative be 0 and the Nash equilibrium negotiation solution can be obtained by the following:
Different from the first two scenarios, the FAP supplier and the CGP agency make optimal freshness preservation efforts to maximize fairness and utility instead of maximizing their profits. While the goal of the CGP platform is still to maximize its profit via freshness preservation efforts. Based on these considerations, this research further studies the two-stage discounted pricing problem that takes into account the FAP supplier’s and the CGP agency’s fairness preferences.
- (1)
When , the optimal freshness preservation effort of the FAP supplier is the following:
When the FAP supplier considers fairness preference, its freshness preservation effort is mainly related to its profit-sharing ratio, the discount sales period, the FAP freshness decay rate, and the CGP agency’s fairness preference. In the first stage of the sales cycle, the relationship between the FAP supplier’s level of freshness preservation effort, , and the discount sales time, , is exhibited in Equation (33):
When , the shorter the discount sales period, the higher the level of freshness preservation effort that will be invested by the FAP supplier.
When , the optimal freshness preservation effort of the CGP agency is the following:
When the CGP agency considers fairness preference, its freshness preservation effort is mainly related to its profit-sharing ratio, the discount sales period, the freshness decay rate, and the FAP supplier’s fairness preference. The relationship between the CGP agency’s freshness preservation effort and the discount sale time, , is depicted as follows:
When , the CGP agency’s freshness preservation effort increases as the discount sales period shortens.
- (2)
Similarly, when the FAP supplier’s freshness preservation effort satisfies , its optimal freshness preservation effort is the following:
In the second sales stage, the FAP supplier’s freshness preservation effort is also affected by the discount rate. The relationship between its freshness preservation effort, , and the discount sales time, , is shown below:
When , the FAP supplier’s freshness preservation effort increases with the shortening of the discount sales period.
When the CGP agency’s freshness preservation effort satisfies , its optimal freshness preservation effort is the following:
In the second sales stage, the CGP agency’s freshness preservation effort is also affected by the discount rate. The relationship between the CGP agency’s freshness preservation effort and the discount sales time, , is shown in Equation (39):
When , the level of the CGP agency’s long-term preservation effort increases with the shortening of the discount period.
5. Numerical Example and Simulation Modeling
To validate the proposed analytical model, this research employed numerical simulation via the MATLAB R2021a for conducting numerical experiments. The experiments focus on analyzing the changes in supply chain profit before and after the CGP agency’s freshness preservation efforts and the impacts of fairness preference on the total profit of the supply chain.
Assuming the life cycle () of a FAP is 7 days, the unit production and harvesting cost of the FAP is 17 Chinese Yuan (CNY), the unit loss cost is CNY 3, the loss ratio is 20%, and the initial market size of the FAP is 100. The FAP supplier signed a profit-sharing contract with a CGP platform and the CGP agency and sold the FAP to the CGP platform at a wholesale price of CNY 20. FAPs are distributed to a shared warehouse operated by the CGP platform. From days to , the CGP platform sells FAPs at a unit price of CNY 50; the unit loss cost of the CGP platform is 4, and the loss ratio is 30%. Since the freshness of FAPs decays with inventory time, from day to day , the platform will sell all the remaining FAPs in the warehouse at a 20% discount. The values of the other parameters are shown in Table 1.

Table 1.
Parameters used in this research.
5.1. Effects of the CGP Agency’s Freshness Preservation Efforts on Supply Chain Profits
Based on the values of the aforementioned parameters, comparisons of the supply chain profits without and with the CGP agency’s freshness preservation efforts are presented in Table 2. It was found that when the CGP agency does not make freshness preservation efforts, due to the perishable nature of FAPs, the freshness of FAPs will deteriorate with inventory time, which tends to reduce consumers’ satisfaction and potentially increase the number of return requests. Under this condition, the CGP agency needs to pay a contracted compensation to the CGP platform. If the CGP agency makes full freshness preservation efforts, the CGP platform will provide the CGP agency with a contracted percentage of profit sharing. Therefore, in terms of profits, when the CGP agency makes full freshness preservation efforts, the total profit of the supply chain will be higher than under the condition that the freshness preservation efforts are not fully invested.
Table 2.
Profit of the supply chain without and with the CGP agency’s freshness preservation efforts.
During sales stage , the CGP platform stands in a stronger position in the supply chain, and its profit-sharing ratio is higher than that of the FAP supplier and the CGP agency. During sales stage , the profit of the CGP platform decreases due to warehouse inventory losses and discounted sales prices. At this stage, since the FAP supplier obtains the profit-sharing from the CGP platform, its profit is higher than that of the CGP platform.
5.2. Effects of Consumers’ Sensitivity to Freshness on Supply Chain Coordination
Under the condition that the CGP agency is fully invested in freshness preservation efforts, the relationships between consumers’ sensitivity to the freshness of FAPs and the profits of the FAP supplier, the CPG platform, the CGP agency, and the total profit of the supply chain are illustrated in Figure 2 and Figure 3. It can be seen from Figure 2 and Figure 3 that there is a positive correlation between consumers’ sensitivity to freshness and profits. The increase in consumers’ sensitivity to freshness is beneficial to the profits of the FAP supplier, the CGP platform, the CGP agency, and the total profit of the supply chain.

Figure 2.
Profits of supply chain stakeholders, .

Figure 3.
Profits of supply chain stakeholders, .
Specifically, when the profit-sharing ratio of the FAP supplier and the CGP agency increases simultaneously, the total profit of the supply chain remains unchanged. Affected by the discounted sales price in the period, the profit of each stakeholder in the supply chain in sales period is significantly higher than that in sales period . By comparing the profit changes of each stakeholder in the two stages, it was found that when consumers are sensitive to freshness to a certain extent, with the increase of the profit-sharing ratios of the FAP supplier and the CGP agency, the profits of the FAP supplier and the CGP agency both increase to a certain extent. The profit of the CGP platform displays a decreasing trend, along with a weakening trend of its dominating position in the supply chain, eventually reaching a balanced profit-sharing between the stakeholders of the supply chain.
5.3. Effects of Profit-Sharing Ratios on Freshness Preservation Efforts
To reduce the loss of FAPs in all aspects of circulation, the CGP platform signs a profit-sharing contract with the FAP supplier and the CGP agency. A supplier is responsible for the harvesting and delivery of FAPs. The supplier’s efforts in freshness preservation are crucial to maintaining the freshness of FAPs. The CGP agency is responsible for the FAP point-of-sale terminal delivery. In practice, the profit-sharing ratio is the commission rate of the CGP agency, which is generally around 10%. Therefore, to be closer to reality, this research assumes the maximum profit-sharing ratio of the CGP agency is 0.1.
Figure 4 and Figure 5 present the impact of the FAP supplier’s and the CGP agency’s profit-sharing ratios on their fresh-keeping efforts, respectively. Figure 6 and Figure 7 show the impact of consumers’ sensitivity to the freshness of FAPs on the freshness preservation effects of the FAP supplier and CGP agency, respectively.

Figure 4.
Effects of the FAP supplier’s profit-sharing ratio on freshness preservation efforts.
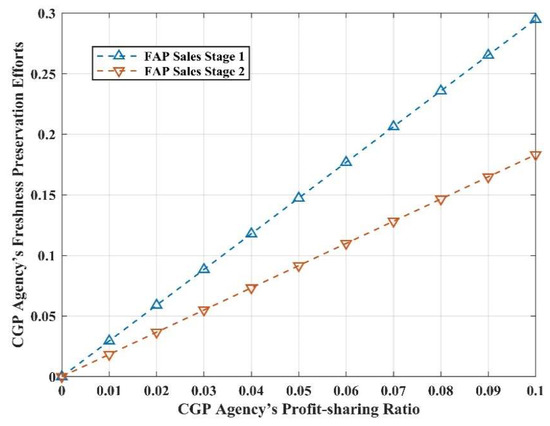
Figure 5.
Effects of the CGP agency’s profit-sharing ratio on freshness preservation efforts.
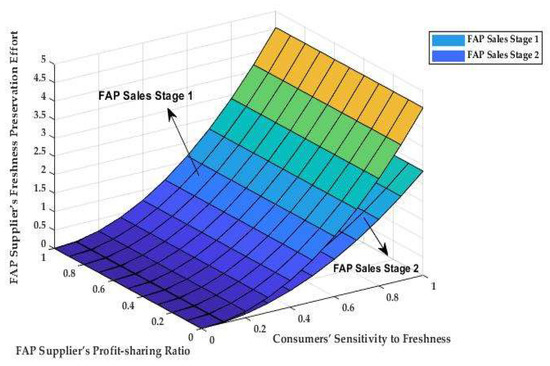
Figure 6.
Effects of other factors on the FAP supplier’s freshness preservation efforts.
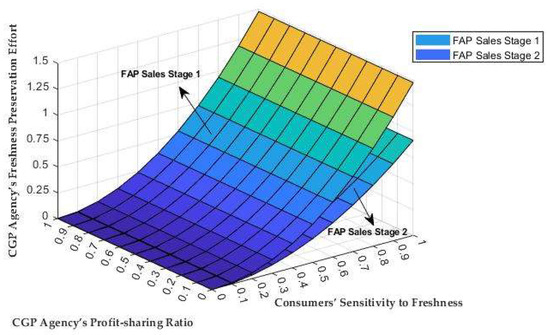
Figure 7.
Effects of other factors on the CGP agency’s freshness preservation efforts.
From Figure 4 and Figure 5, it can be seen that in the first stage of sales and the second stage of sales, the freshness preservation efforts of the FAP supplier and the CGP agency are positively related to their profit-sharing ratios. The freshness preservation efforts of the FAP supplier and the CGP agency increase with the increase in their profit-sharing ratios. In addition, consumers’ sensitivity to freshness also affects their freshness preservation efforts. Under the condition that the FAP supplier and the CGP agency share a certain proportion of the profit, the more sensitive consumers are to the freshness of FAPs, the more freshness preservation efforts will be invested by the FAP supplier and the CGP agency.
5.4. Effects of Fairness Preference and Negotiating Ability on Freshness Preservation Efforts
Under the condition that the FAP supplier and the CGP agency pursue the maximization of fairness utility, the FAP supplier has stronger negotiating ability. Then, the utility fairness of the FAP supplier increases gradually; meanwhile, the CGP agency’s utility fairness will be weakened. Since the CGP agency is only responsible for the point-of-sale terminal delivery of FAPs, even if under the condition of pursuing the maximum fairness utility, the CGP agency is still in a relatively weak position in the supply chain. Therefore, under rational conditions, to maximize its fairness utility, the CGP agency will reduce its freshness preservation efforts. In this regard, this section further analyzes the influence mechanism of the FAP supplier’s and CGP agency’s negotiation abilities on the FAP supplier’s freshness preservation efforts.
Table 3 presents the impact of m on the profits of the FAP supplier, the CGP platform, and the CGP agency under the conditions of full investment in freshness preservation efforts and consideration of fairness preferences. Figure 8 further illustrates the influence of the FAP suppliers’ negotiating ability (a), the CGP agency’s negotiating ability (b), and the unfair avoidance coefficient (λ) between the FAP supplier and the CGP agency on the FAP suppliers’ freshness preservation efforts.
Table 3.
Profit and fairness utility of the supply chain stakeholders under fairness preference.


Figure 8.
Effects of business negotiating ability on freshness preservation efforts. (a) ; (b) ; (c) ; (d) .
As shown in Figure 8, when the negotiating ability of the CGP agency and the FAP supplier’s profit-sharing ratio are fixed, with the increase in the FAP supplier’s negotiating ability and the unfairness avoidance coefficient, the FAP supplier’s freshness preservation efforts will increase. Under the condition that the FAP supplier’s negotiation ability and unfairness avoidance coefficient are fixed, with the increase in the CGP agency’s negotiating ability, the FAP supplier will reduce its freshness preservation efforts to maximize the fairness utility. If other contributing factors remain unchanged, when the unfairness avoidance coefficient increases, the FAP supplier’s freshness preservation effort increases with the increase in the negotiating ability of the CGP agency.
In the second stage of the sales cycle, the freshness of FAPs is lower than in the first stage. Being affected by sales discounts, the fairness utility of the FAP supplier is reduced, which leads to a significant reduction in its freshness preservation efforts in comparison with those made in the first stage.
6. Concluding Remarks
This article developed a mathematical model that takes the four-level FAP supply chain under the model of “CGP platform + direct procurement from the supplier” as the research object to investigate the effects of consumers’ sensitivity to the freshness of FAPs, the profit-sharing ratios, and supply chain stakeholders’ business negotiating abilities on their profits and freshness preservation efforts. Based on a numerical example and through simulation modeling, major findings from this research are presented as follows:
- Total profit of the supply chain increased after the CGP agency made freshness preservation efforts.
Under the circumstance that the CGP agency does not invest in freshness preservation efforts, there will be larger losses of FAP freshness at the point-of-sale terminal, which tends to result in decreases in consumer satisfaction. Besides, with the increase in the CGP agency’s compensation ratio, the overall profit of the supply chain decreases. In comparison, when the CGP agency is fully invested in freshness preservation efforts, with increases in the CGP agency’s profit-sharing ratio and freshness preservation efforts, the loss of FAP freshness decreases. Eventually, consumers’ satisfaction improves, and the total profit of the FAP supply chain increases.
- Increases in the supplier’s profit-sharing ratio, the CGP agency’s profit-sharing ratio, and consumers’ sensitivity to FAP freshness can improve the total profit of the FAP supply chain as well as the profit of each stakeholder.
If no profit-sharing contract is employed by the CGP platform, the suppliers and the CGP agency are not likely to make freshness preservation efforts or invest in a relatively low-level freshness preservation effort. To reduce the losses of FAPs during inventory and circulation processes, the cost of freshness preservation efforts is mainly paid by the CGP platform, which reduces the CGP platform’s profit.
With the adoption of profit-sharing contracts, the CGP platform is able to dynamically adjust its freshness preservation effort according to the profit-sharing ratios of suppliers and CGP agencies, as it allows the CGP platform to weigh the tradeoffs between its profits and costs. When the profit-sharing ratio between the CGP agency and the supplier is constant, the profits of the supply chain stakeholders are positively correlated to consumers’ sensitivity to FAP freshness. If the profit-sharing ratio between suppliers and CGP agencies increases, the profit of the CGP platform will decrease gradually, while the profits of suppliers and CGP agencies will increase gradually.
- When considering fairness preference, with the improvement of suppliers’ business negotiating ability, their freshness preservation efforts and fairness utility increase gradually, while the fairness utility of the CGP agency decreases gradually.
When both the supplier and the CGP agency have a fairness preference, the supplier has a stronger negotiating ability. As consumers become more sensitive to the freshness of FAPs, the supplier’s fairness utility increases gradually, while the CGP agency’s equity utility will be impaired. This indicates that under such conditions, the CGP agency stands in a weak position in the supply chain. Therefore, to maximize its fairness and utility, the CGP agency will reduce its freshness preservation efforts.
It is worth pointing out that this research is based on a four-level FAP supply chain composed of a FAP supplier, a logistics service provider, a CGP platform, CGP agencies, and consumers. Future work may investigate more complex supply chain systems with multiple FAP suppliers, multi-level logistics service providers, and multiple CGP platforms. Besides, this research assumes that exogenous factors, such as government policies, weather conditions, unforeseen events, etc., that may affect fresh produce suppliers and market demands follow a normal distribution, while these factors are more complicated in a real-world setting. Moreover, future work may include in-depth investigations regarding the effects of a shared freshness preservation cost strategy on the operational performance of the supply chain.
Author Contributions
Conceptualization, M.L.; methodology, M.L. and Z.L.; validation, M.L. and Z.L.; formal analysis, M.L. and Z.L.; writing—original draft preparation, M.L., Z.L., G.Y. and L.L.; writing—review and editing, G.Y. and M.L.; project administration, M.L.; funding acquisition, M.L. All authors have read and agreed to the published version of the manuscript.
Funding
This research was financially supported by “Shaanxi Provincial Department of Education Research Program Project”, grant number 20JZ013, and “The Humanities and Social Sciences Research Project of the Ministry of Education”, grant number 22YJCZH151.
Institutional Review Board Statement
Not applicable.
Informed Consent Statement
Not applicable.
Data Availability Statement
Not applicable.
Conflicts of Interest
The authors declare no conflict of interest.
References
- Yadav, V.S.; Singh, A.R.; Gunasekaran, A.; Raut, R.D.; Narkhede, B.E. A systematic literature review of the agro-food supply chain: Challenges, network design, and performance measurement perspectives. Sustain. Prod. Consum. 2022, 29, 685–704. [Google Scholar] [CrossRef]
- Desiderio, E.; Garcia-Herrero, L.; Hall, D.; Segrè, A.; Vittuari, M. Social sustainability tools and indicators for the food supply chain: A systematic literature review. Sustain. Prod. Consum. 2022, 30, 527–540. [Google Scholar] [CrossRef]
- Aryal, A.; Liao, Y.; Nattuthurai, P.; Li, B. The emerging big data analytics and IoT in supply chain management: A systematic review. Supply Chain. Manag. Int. J. 2020, 25, 141–156. [Google Scholar] [CrossRef]
- Liu, M.; Dan, B.; Zhang, S.; Ma, S. Information sharing in an E-tailing supply chain for fresh produce with freshness-keeping effort and value-added service. Eur. J. Oper. Res. 2021, 290, 572–584. [Google Scholar] [CrossRef]
- Chang, H.H.; Meyerhoefer, C.D. COVID-19 and the Demand for Online Food Shopping Services: Empirical Evidence from Taiwan. Am. J. Agric. Econ. 2021, 103, 448–465. [Google Scholar] [CrossRef]
- Charlebois, S.; Juhasz, M.; Music, J. Supply Chain Responsiveness to a (Post)-Pandemic Grocery and Food Service E-Commerce Economy: An Exploratory Canadian Case Study. Businesses 2021, 1, 72–90. [Google Scholar] [CrossRef]
- Mishra, R.; Singh, R.K.; Subramanian, N. Impact of disruptions in agri-food supply chain due to COVID-19 pandemic: Contextualised resilience framework to achieve operational excellence. Int. J. Logist. Manag. 2022, 33, 926–954. [Google Scholar] [CrossRef]
- Sharma, M.; Alkatheeri, H.; Jabeen, F.; Sehrawat, R. Impact of COVID-19 pandemic on perishable food supply chain management: A contingent Resource-Based View (RBV) perspective. Int. J. Logist. Manag. 2022, 33, 796–817. [Google Scholar] [CrossRef]
- Born, C. Community Group Buying: The Hottest Trend in China’s E-Commerce. Franklin Templeton: Investment Adventures in Emerging Markets. 2021. Available online: https://emergingmarkets.blog.franklintempleton.com/2021/06/22/community-group-buying-the-hottest-trend-in-chinas-e-commerce/ (accessed on 15 March 2023).
- Puram, P.; Gurumurthy, A.; Narmetta, M.; Mor, R.S. Last-mile challenges in on-demand food delivery during COVID-19: Understanding the riders’ perspective using a grounded theory approach. Int. J. Logist. Manag. 2022, 33, 901–925. [Google Scholar] [CrossRef]
- Furong Xingsheng. Available online: http://www.frxs.com/ (accessed on 27 April 2023). (In Chinese).
- MeituanYouxuan. Available online: https://www.meituanyx.com/ (accessed on 27 April 2023). (In Chinese).
- Pinduoduo. Available online: https://www.pinduoduo.com/home/vegetables/ (accessed on 27 April 2023). (In Chinese).
- Taocaicai. Available online: https://www.alibabagroup.com/about-alibaba-businesses-1496649600440729600 (accessed on 27 April 2023). (In Chinese).
- CIRN. ChinaIRN.COM. Available online: https://www.chinairn.com/scfx/20220531/124849466.shtml (accessed on 27 April 2023). (In Chinese).
- Fearne, A.; Hughes, D. Success factors in the fresh produce supply chain: Insights from the UK. Supply Chain. Manag. 1999, 4, 120–131. [Google Scholar] [CrossRef]
- Shukla, M.; Jharkharia, S. Agri-fresh produce supply chain management: A state-of-the-art literature review. Int. J. Oper. Prod. Manag. 2013, 33, 114–158. [Google Scholar] [CrossRef]
- Wang, J.; Fu, Z.; Zhang, B.; Yang, F.; Zhang, L.; Shi, B. Decomposition of influencing factors and its spatial-temporal characteristics of vegetable production: A case study of China. Inf. Process. Agric. 2018, 5, 477–489. [Google Scholar] [CrossRef]
- Magalhaes, V.S.M.; Ferreira, L.M.; Silva, C. Prioritising food loss and waste mitigation strategies in the fruit and vegetable supply chain: A multi-criteria approach. Sustain. Prod. Consum. 2022, 31, 569–581. [Google Scholar] [CrossRef]
- Ward, R.W. Asymmetry in Retail, Wholesale, and Shipping Point Pricing for Fresh Vegetables. Am. J. Agric. Econ. 1982, 64, 205–212. [Google Scholar] [CrossRef]
- Hennessy, D.A. Information Asymmetry as a Reason for Food Industry Vertical Integration. Am. J. Agric. Econ. 1996, 78, 1034–1043. [Google Scholar] [CrossRef]
- Giannakas, K. Information Asymmetries and Consumption Decisions in Organic Food Product Markets. Can. J. Agric. Econ. 2002, 50, 35–50. [Google Scholar] [CrossRef]
- Pietrzak, M.; Chlebicka, A.; Kracinski, P.; Malak-Rawlikowska, A. Information Asymmetry as a Barrier in Upgrading the Position of Local Producers in the Global Value Chain—Evidence from the Apple Sector in Poland. Sustainability 2020, 12, 7857. [Google Scholar] [CrossRef]
- Leng, M.; Parlar, M. Lead-time reduction in a two-level supply chain: Non-cooperative equilibria vs. coordination with a profit-sharing contract. Int. J. Prod. Econ. 2009, 118, 521–544. [Google Scholar] [CrossRef]
- Sheu, J.B. Marketing-driven channel coordination with revenue-sharing contracts under price promotion to end-customers. Eur. J. Oper. Res. 2011, 214, 246–255. [Google Scholar] [CrossRef]
- Song, Z.; He, S. Contract coordination of new fresh produce three-layer supply chain. Ind. Manag. Data Syst. 2019, 119, 148–169. [Google Scholar] [CrossRef]
- Moon, I.; Jeong, Y.J.; Saha, S. Investment and coordination decisions in a supply chain of fresh agricultural products. Oper. Res. 2020, 20, 2307–2331. [Google Scholar] [CrossRef]
- Li, M.; He, L.; Yang, G.; Lian, Z. Profit-Sharing Contracts for Fresh Agricultural Products Supply Chain Considering Spatio-Temporal Costs. Sustainability 2022, 14, 2315. [Google Scholar] [CrossRef]
- Grimsdell, K. The supply chain for fresh vegetables: What it takes to make it work. Supply Chain. Manag. 1996, 1, 11–14. [Google Scholar] [CrossRef]
- Widodo, K.; Nagasawa, H.; Morizawa, K.; Ota, M. A periodical flowering–harvesting model for delivering agricultural fresh products. Eur. J. Oper. Res. 2006, 170, 24–43. [Google Scholar] [CrossRef]
- Zhao, Y.; Wang, S.; Cheng, T.; Yang, X.; Huang, Z. Coordination of supply chains by option contracts: A cooperative game theory approach. Eur. J. Oper. Res. 2010, 207, 668–675. [Google Scholar] [CrossRef]
- Azad, N.; Saharidis, G.K.D.; Davoudpour, H.; Malekly, H.; Yektamaram, S.A. Strategies for protecting supply chain networks against facility and transportation disruptions: An improved Benders decomposition approach. Ann. Oper. Res. 2013, 210, 125–163. [Google Scholar] [CrossRef]
- Cai, X.; Chen, J.; Xiao, Y.; Xu, X.; Yu, G. Fresh-product supply chain management with logistics outsourcing. Omega Int. J. Manag. Sci. 2013, 41, 752–765. [Google Scholar] [CrossRef]
- Dellino, G.; Laudadio, T.; Mari, R.; Mastronardi, N.; Meloni, C. A reliable decision support system for fresh food supply chain management. Int. J. Prod. Res. 2018, 56, 1458–1485. [Google Scholar] [CrossRef]
- Jabarzare, N.; Rasti-Barzoki, M. A game theoretic approach for pricing and determining quality level through coordination contracts in a dual-channel supply chain including manufacturer and packaging company. Int. J. Prod. Econ. 2020, 221, 107480. [Google Scholar] [CrossRef]
- Dolat-Abadi, H.M. Optimizing decisions of fresh-product members in daily and bourse markets considering the quantity and quality deterioration: A waste-reduction approach. J. Clean. Prod. 2021, 283, 124647. [Google Scholar] [CrossRef]
- Yu, Y.; Xiao, T. Analysis of cold-chain service outsourcing modes in a fresh agri-product supply chain. Transp. Res. Part E 2021, 148, 102264. [Google Scholar] [CrossRef]
- Gan, X.; Sethi, S.P.; Yan, H. Coordination of Supply Chains with Risk-Averse Agents. Prod. Oper. Manag. 2004, 13, 135–149. [Google Scholar] [CrossRef]
- Mohammadi, H.; Ghazanfari, M.; Pishvaee, M.S.; Teimoury, E. Fresh-product supply chain coordination and waste reduction using a revenue-and-preservation-technology-investment-sharing contract: A real-life case study. J. Clean. Prod. 2019, 213, 262–282. [Google Scholar] [CrossRef]
- Yang, L.; Tang, H. Comparisons of sales modes for a fresh product supply chain with freshness-keeping effort. Transp. Res. Part E 2019, 125, 425–448. [Google Scholar] [CrossRef]
- Ghazanfari, M.; Mohammadi, H.; Pishvaee, M.S.; Teimoury, E. Fresh-Product Trade Management Under Government-Backed Incentives: A Case Study of Fresh Flower Market. IEEE Trans. Eng. Manag. 2019, 66, 774–787. [Google Scholar] [CrossRef]
- Sarkar, S.; Bhala, S. Coordinating a closed loop supply chain with fairness concern by a constant wholesale price contract. Eur. J. Oper. Res. 2021, 295, 140–156. [Google Scholar] [CrossRef]
- Chen, J.; Dan, B. Fresh agricultural product supply chain coordination under the physical loss-controlling. Syst. Eng. Theory Pract. 2009, 29, 54–62. (In Chinese) [Google Scholar]
- Forsythe, R.; Horowitz, J.L.; Savin, N.E. Fairness in simple bargaining games. Games Econ. Behav. 1994, 6, 347–369. [Google Scholar] [CrossRef]
- Agell, J.; Lundborg, P. Theories of pay and unemployment: Survey evidence from Swedish manufacturing firms. Scand. J. Econ. 1995, 97, 295–307. [Google Scholar] [CrossRef]
- Fahr, R.; Bernd, I. Fairness as a constraint on trust in reciprocity: Earned property rights in a reciprocal exchange experiment. Econ. Lett. 2000, 66, 275–282. [Google Scholar] [CrossRef]
- Rabin, M. Incorporating fairness into game theory and economics. Am. Econ. Rev. 1993, 83, 1281–1302. [Google Scholar]
- Fehr, E.; Schmidt, K.M. A theory of fairness, competition and cooperation. Q. J. Econ. 1999, 114, 817–868. [Google Scholar] [CrossRef]


Disclaimer/Publisher’s Note: The statements, opinions and data contained in all publications are solely those of the individual author(s) and contributor(s) and not of MDPI and/or the editor(s). MDPI and/or the editor(s) disclaim responsibility for any injury to people or property resulting from any ideas, methods, instructions or products referred to in the content. |
© 2023 by the authors. Licensee MDPI, Basel, Switzerland. This article is an open access article distributed under the terms and conditions of the Creative Commons Attribution (CC BY) license (https://creativecommons.org/licenses/by/4.0/).