Abstract
Energy consumption worldwide has undergone a recent shift, with hydrocarbons, coal, and new energy sources taking center stage. However, fossil fuels face criticism due to their negative impacts on the environment through air pollution. Geothermal energy is a clean, renewable, and eco-friendly alternative that can be harnessed for power generation. The Lunayyir volcanic field is located in the western part of Saudi Arabia and has been identified as a potential geothermal resource. In this study, a comprehensive analysis of the gravity, magnetic, and land surface temperature data collected over the study area is conducted to investigate the geothermal potential. The gravity data are processed using standard techniques to correct for instrument drift, diurnal variations, and topographic effects and to filter out high-frequency noise. The magnetic data are processed using standard procedures. Analysis of the gravity data shows that the Lunayyir volcanic field is characterized by a series of gravity anomalies, which can be interpreted as indicative of the presence of subsurface geologic structures that are similar in geothermal areas, such as faults, fractures, and intrusions. The magnetic data, on the other hand, show that the volcanic field has a relatively low magnetic susceptibility, which is consistent with the presence of volcanic rocks implying shallow heat sources. Landsat satellite data are utilized to calculate the land surface temperature through the use of GIS software. Additionally, the normalized difference vegetation index (NDVI) is calculated using the near-infrared and red bands of the Landsat satellite. The land surface temperature of the year 2007 shows the relatively high temperature at the surface as compared to 2000 and 2021, which is an indication of volcanic activities in the subsurface. It is suggested that these structures may provide conduits for hot fluids, which could potentially be exploited for geothermal energy production. The obtained results emphasize the importance of combining different geophysical datasets to obtain a better understanding of underground geology and geothermal systems. In general, this study improves the assessment of the Lunayyir volcanic field in the western part of Saudi Arabia for geothermal energy.
1. Introduction
As economic development leads to the depletion of traditional fossil fuel resources and environmental degradation, there is a growing demand for clean energy. Geothermal energy has emerged as a significant clean energy alternative owing to its vast reserves and environmentally friendly properties compared to fossil fuels. Increasing its global use could reduce harmful emissions from fossil fuels [1]. Geothermal resources provide essential information on renewable energy obtained from the Earth’s interior heat. These resources can be utilized in various ways from large power stations to small pumping systems.
Utilizing geothermal energy can reduce carbon dioxide (CO2) emissions and local air pollutants, and also offer protection against energy price volatility, contributing to energy security [2]. Researchers and local governments are concerned about the socio-economic impacts of geothermal resource utilization. The evaluation of potential geothermal locations and their socio-economic implications requires a large amount of quantitative data and processing techniques. Spatial assessment studies have been conducted worldwide to expand management policy [3].
One disadvantage of geothermal energy is that it cannot be easily transported over long distances, unlike coal, natural gas, and petroleum, which can be easily transported from their source to the intended user, regardless of the distance [4]. The use of geothermal energy can be limited by factors, such as the limited availability of suitable geothermal sources, the distance between the source and intended use, and the suitability of certain areas for geothermal extraction.
Extracting geothermal energy can also have negative impacts on the surrounding environment, and transportation of the energy can be challenging. Moreover, there is always a risk of volcanic eruptions triggering earthquakes, and geothermal sources may contain hazardous materials. The installation cost of a steam power plant for geothermal energy is typically quite expensive. Furthermore, during construction, there is a potential for the release of harmful and poisonous gases through the drilled holes [5,6].
Saudi Arabia plans to move economically from hydrocarbons to renewable and low-carbon energy sources to free up hydrocarbons for export and boost the economy. Renewable energy has unique characteristics when compared to oil-based alternatives [7]. In the Kingdom of Saudi Arabia, major geothermal resources are influenced by volcanic fields.
Geothermal energy is basically heat that exists beneath the earth and causes global-scale geological events as heat is a type of energy. Geothermal energy is frequently utilized, but only specific portions of the earth have subsurface heat [8]. This research focuses on geothermal energy, which is one type of renewable energy source, along with tidal, hydro, wind, ocean currents, waves, and solar energy. Since it is not impacted by climatic changes (such as droughts and floods), seasonal variations (such as rainy and dry seasons), night and day, or weather conditions, the geothermal resource provides some of the largest capabilities.
The availability of geothermal energy throughout the year makes it an attractive alternative source of energy [9,10]. Saudi Arabia has a wide range of renewable energy sources, including solar energy, marine energy along the Red Sea coast, and geothermal energy in volcanic fields and hot spots. To utilize these resources, the Saudi government launched the “National Renewable Energy Program (NREP)” as a long-term project supported by the National Transformation Program (NTP) and 2030 vision [11].
Harrat Lunayyir (Figure 1) is relatively young and smaller compared to other basaltic fields in the Arabian Peninsula. The recent basalts in it cover an area of more than 3500 km². However, there is still strong thermal activity in the area, as demonstrated by elevated groundwater temperatures [12]. An earthquake swarm occurred at the Harrat Lunayyir in 2009, causing concerns of a volcanic eruption or major earthquake. The earthquake swarm caused a great deal of interest due to reports of surface rupturing and dike intrusion. The Saudi government evacuated 30,000 residents, and geological investigations were conducted. However, the area is poorly geologically mapped, so remote sensing data analysis was used to study the Lunayyir volcanic field (LVF).
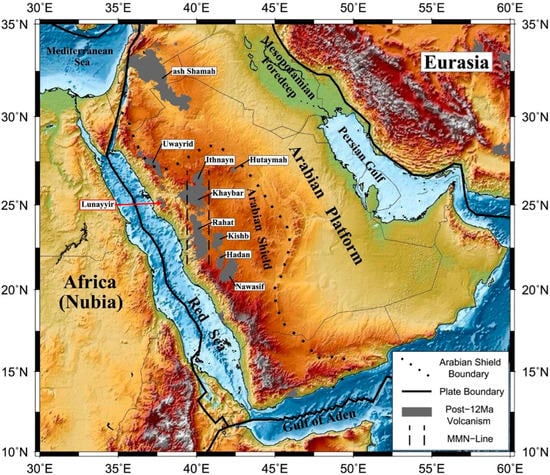
Figure 1.
The topographic map of the Arabian Plate and its surrounding regions shows major tectonic features and Cenozoic volcanic fields (adopted from [13]). The current study area is the LVF, highlighted with the red rectangle and arrow.
Satellite images and remote sensing interpretations were used to locate sites for magma migration and entrapment and to distinguish between older and younger lavas. The study presents evidence on the volcanic episodes and their respective spatial coverage and examines volcanic hazard estimates based on the interpretation of remote sensing images. Remote sensing data are advantageous for studying volcanic hazards due to the repeated image coverage and multispectral characteristics [14,15].
Geophysical methods are commonly used for exploring geothermal resources, providing information about the temperature, fluid content, aquifer locations, structural settings, and general properties of the system [3,16,17]. Researchers have utilized various methods, such as geophysics and geochemistry, to investigate the potential reserves and exploitation of geothermal resources.
These methods have yielded promising results, such as identifying deep-buried faults and predicting geothermal potential [1]. Direct methods, such as well logs and thermal methods, are considered to be the most successful, while indirect methods, such as susceptibility, density, and seismic reflection, are used to explore the structural setting and physical characteristics of the host rock [3]. The geographic information systems (GIS) technique is a useful tool for assessing natural resources, and several studies have used GIS to evaluate geothermal potential using different models [11,18,19].
Saudi Arabia has significant potential for geothermal energy, as demonstrated by the Harrat fields along the Red Sea coast. These fields contain abundant heat sources and hot springs [20]. The LVF is a large volcanic province located in the western part of Saudi Arabia. It is composed of a series of basaltic lava flows, scoria cones, and volcanic domes, which erupted during the Quaternary period.
The volcanic field is characterized by a number of prominent volcanic features [21]. It is characterized by a complex system of volcanic structures, and it has been identified as having potential for geothermal energy production. The use of gravity, magnetic and temperature data can aid in understanding the geology of the area and identifying potential geothermal resources. The LVF is one of Saudi Arabia’s newest volcanic fields [14,21].
This study aims to demonstrate the effectiveness of thermal infrared satellite technology in identifying geothermal anomalies through the use of land surface temperature (LST) in combination with gravity and magnetic data to identify and characterize potential geothermal resources. We utilized a combination of geospatial and geophysical data to investigate the potential for geothermal energy production in the LVF, which is located in the Saudi Arabia.
The analysis of gravity and magnetic data revealed evidence of subsurface geologic structures, such as faults, fractures, and intrusions. Additionally, GIS analysis of the LST data suggested the occurrence of volcanic activity in the subsurface, which could serve as conduits for hot fluids. The manuscript provides a comprehensive discussion of the various datasets and their interpretation, highlighting the importance of combining different geophysical methods to obtain a better understanding of underground geology and geothermal systems.
2. Geological Setting and Study Area Description
The Western Arabian Peninsula in Saudi Arabia is covered by Cenozoic basaltic fields. Some of these regions are still active, and they pose a risk of explosion to the local communities. Camp et al. (1987) [22] documented a historical volcanic activity in Saudi Arabia. An earthquake, M = 4.7, occurred in the LVF, located close to the west side of the Arabian Plate, and it was considered that this occurrence is linked to the Red Sea rifting [23].
It is uncertain, nevertheless, how much the northern Red Sea’s opening contributed to the formation of these volcanic fields. Apart from these, the north portion of the south Red Sea seems to involve the more intricate phenomena of continental crust stretching, which is currently taking place at a rate of 10 mm/year [24]. The LVF is one such region that was identified as having the potential for geothermal energy production [25].
The Cenozoic lava of the East African Rift system provides a well-known example of tholeiitic-to-alkalic volcanism associated with the early development of a rifted continental margin. In contrast, the adjacent and contemporaneous lava plains of the western Arabian Plate, the Arabian Harrats, are not related to continental drift [14]. Over a 3000 km stretch from the northern side to the southern side, Arabian Harrats can be found all over the west side of the Arabian Peninsula [26].
The tectonic margin of the western Arabian Plate connected to the Cenozoic development of Red Sea greatly influences the volcano-tectonic history of the LVF and other Harrats in this region. These findings have been corroborated by thorough examinations for the Red Sea [27], the Gulf of Aden [28], and the Dead Sea Rift. According to [29], there were two episodes of sea-floor spreading during which the west Arabian Plate occurred. The beginning of the early stage began 30 million years ago in the late Oligocene and continued until 15 Ma at the end of the initial Miocene. The later stage began around 5 Ma ago in the Pliocene and has persisted ever since [30].
Cenozoic basaltic lava fields (Harrats) are distributed through the west side of the Arabian Peninsula from Yemen in the southern side, through Saudi Arabia and Jordan, and to Syria in the northern side. Unfortunately, due to the absence of detailed investigation, the volcanic and tectonic evolution of the Arabian Harrats still is not well understood [31]. The topographic map of the Arabian Plate and its surrounding regions shows major tectonic features, and Cenozoic volcanic fields are shown in Figure 1 [13]. The Arabian Harrats are notable for their diverse geological features and long history of volcanic activity. Each Harrat has its unique characteristics and provides a valuable window into the region’s geologic past.
They are characterized by extensive lava flows, volcanic cones, and craters, and they provide a valuable window into the region’s geologic past. The region is home to many Harrats, each with its unique geological features and history as shown in Table 1.

Table 1.
A details comparison between several Harrats in Saudi Arabia (adopted from [32]).
In two seasons of sea floor spreading prior to the early Miocene rifts epoch, the Arabian Shield separated from the Nubian Shield along rifts in the Red Sea and the Gulf of Aden [27,30,33]. The colliding of the Eurasian Plate with the Arabian Plate along the Bitlits and Zagros Thrust systems, as well as rifting and seafloor spreading in the Red Sea and Gulf of Aden, comprise the region’s active tectonics. Along the Dead Sea Transform and Gulf of Aqaba fault systems, strike-slip faulting takes place. Sediments that thicken near the Arabian Gulf cover the eastern region of the Arabian Plate [34].
3. Materials and Methods
Gravity and magnetic data were available over the LVF using both ground-based and airborne surveys from different sources [35,36]. The gravity data were processed using standard techniques, including corrections for instrument drift, diurnal variations, and topographic effects. The data were also filtered to remove high-frequency noise and to enhance the signals of interest. On the other side, the magnetic data were processed using the slandered procedures [37].
The current study utilized Shuttle Radar Topography Mission (SRTM) data (30 m spatial resolution) obtained from NASA to analyze the Harrat Lunayyir region. Additionally, Landsat satellite data were used to calculate the land surface temperature during the summer season for the years 2000, 2007, and 2021. The Landsat 5 TM satellite data were used to gather information about the Earth’s surface for the years 2000 and 2007. For the year 2021, data from the Landsat 8 OLI satellite were utilized instead.
3.1. Gravity Data
The data were acquired between the months of April and May in the year 1980. The USGS (United States Geological Survey) collected the gravity data within an area spanning from latitude 24° to 26° N and extending from the coast of the Red Sea to the LVF using two LaCoste–Romberg gravimeters. The survey covered a gravity station with a station interval of 2 km. The entire survey was tied to Flanigan and Akhras’ absolute gravity station (KGN-6). The locations of the stations were determined through the use of semi-controlled photomosaic at a scale of 1:50,000, and their elevations were determined with a vertical precision of ±2 m through the use of Paulin M2 altimeters and helicopter altimeter surveys. Corrections were applied to account for tidal, latitude, terrain, and Bouguer effects [36].
Gravity data of the LVF can be used to identify and evaluate potential geothermal resources in the area. Geothermal systems are characterized by the presence of hot rocks or fluids in the subsurface, which can cause local variations in the gravity field. By analyzing these variations, scientists can identify potential geothermal reservoirs and assess their size and productivity. Gravity data can also be used to evaluate the depth and shape of potential geothermal reservoirs. Figure 2 shows the trend of the Bouguer anomaly on the regional scale. By modeling the gravity data, scientists can estimate the depth and shape of potential reservoirs and assess their viability for geothermal development [38]. The heat flow (HF) of the LVF was calculated by utilizing Equation (1) [39].
where the HF is measured in mW/m², the geothermal gradient value is 34 °C/km, and k is the thermal conductivity with the unit W/m. k [40].
HF = −k × Geothermal Gradient
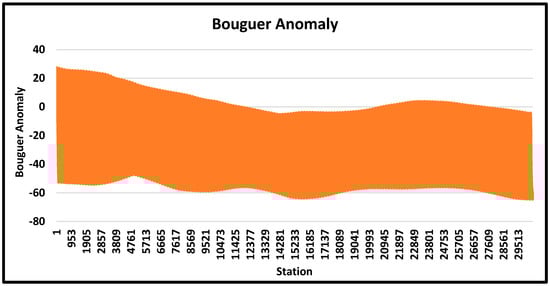
Figure 2.
The generalized trend of Bouguer anomaly data of the LVF.
3.2. Magnetic Data
Regional aeromagnetic surveys were flown in 1962 over areas of mineral prospecting in the Precambrian rocks of the Arabian shield. A comprehensive survey of the remaining parts of the shield followed in 1965–1966. These surveys used terrain clearances of 150 and 300 m, a line spacing of approximately 800 m (although the spacing varied between 500 and 2000 m), and analog recording methods. Small areas of the shield and coastal plain, including volcanic areas (Harrats), were filled in by separate surveys flown at various times between 1976 and early 1983, with a line spacing of 2500 m and terrain clearance of 300 m. In 1976, a survey commissioned by the Saudi–Sudanese Commission covered the central Red Sea. The area over the Phanerozoic rocks was flown in 1982 and 1983, at a terrain clearance of 120 m and a line spacing of 2000 m, using digital data recording methods [37].
In the Harrat Lunayyir area, magnetic data can be used to map the subsurface geology, which can help to identify areas with the potential for geothermal activity. The volcanic rocks and magma chambers in the area can generate heat that can be used for geothermal energy, and researchers can investigate the minimum and maximum values of Curie depth, magnetic intensity, and SRTM 30 Topography. Surface magnetic data were analyzed using spectral analysis to estimate the Curie point depth (CPD) in the study area [41].
3.3. Land Surface Temperature and Normalized Difference Vegetation Index Data
GIS has a wide range of applications in spatial information-related fields. It is an economical tool for identifying areas of interest for geothermal exploration through resource evaluation [42]. The land surface temperature (LST) is crucial evidence that can be utilized to identify sample zones that meet the criteria of hot springs sites. The Landsat satellite images can be used to estimate surface temperatures across the study area as stated by [3]. LST data can provide valuable information about the distribution and characteristics of geothermal reservoirs, which are areas of the subsurface that contain hot rocks or fluids that can be used for geothermal energy production.
The LST and normalized difference vegetation index (NDVI) data were obtained by 50 different sample location in the LVF. The sample points where the LST and NDVI samples were collected are shown in red, and purple represents the boundary of the LVF as shown in Figure 3. The NDVI was calculated using near-infrared and red bands of the Landsat satellite as described in Equation (2) [43]. First, we chose 50 sample locations randomly in the study area. Then, we extracted the value of NDVI and LST on observed years i.e., 2000, 2007, and 2021. The LST-NDVI relationship was determined using the Pearson correlation coefficient approach.
where NIR is the near-infrared and RED is the red reflectance.
NDVI = NIR−RED/NIR + RED
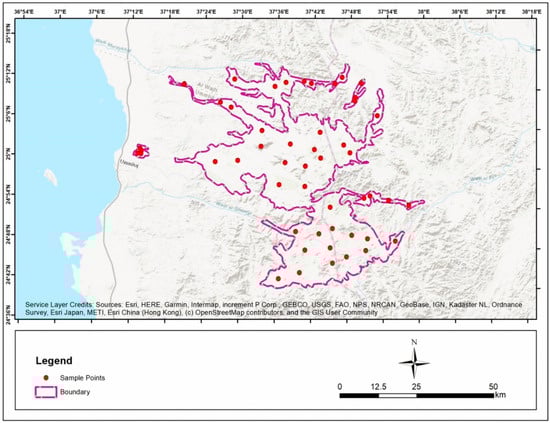
Figure 3.
The study area map of the LVF along with LST and NDVI data sample points shown in red.
4. Results and Discussions
Previous studies based on various geophysical, GIS, remote sensing, and chemical methods have suggested that the Harrats in Saudi Arabia hold potential for future geothermal resources based on subsurface heat, groundwater, and possible permeability. The proximity to metropolitan areas is advantageous for power production, as it reduces construction and power line costs. The Harrats (e.g., Rahat, Lunayyir, and Khaybar) are promising, although the distribution of permeability remains uncertain [32,44,45].
Remote sensing data offer many benefits and applications for investigating volcanic hazards, such as frequent image coverage and multispectral properties that allow for the geological mapping of rocks and structures [46]. Satellite images, including band ratioing and SRTM data, along with remote sensing interpretations, were utilized to identify potential sites for magma migration and entrapment within the top crust and to differentiate between older and younger lavas in the LVF. Al-Amri et al. (2012) [47] divided the LVF dominant basaltic lavas into two units: the older Tertiary unit (Jarad basalt) and the younger Quaternary unit (Maqrah basalt) based on erosion characteristics.
However, they were unable to distinguish between these units using natural light. Mogren et al. (2017) [15] applied a ratio remote sensing technique and classified three distinct volcanic stage rocks: the oldest lava flows covering 354 km2, the intermediate lava flows covering 295 km2, and the recent lava flows covering a smaller area of 28 km2, including 6.8 km2 of volcanic cones as shown in Figure 4 adopted from [15]. The oldest lava flows appear as dark volcanic rocks on a brown background in natural light color composite. Active/young volcanoes are clear indications of the presence of an underground heat source that is feasible for geothermal exploration [42].
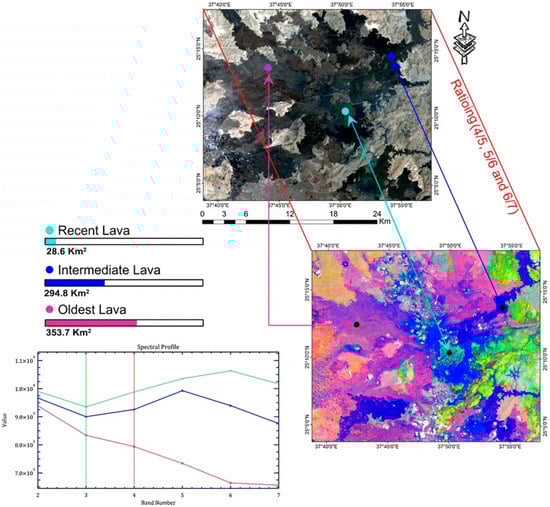
Figure 4.
The LVF has three types of volcanic components, and a location map is needed to show their respective locations. Additionally, the spectral signature of each component needs to be identified (adopted from [15]).
4.1. Gravity Data Interpretation
Gravity surveys are useful in exploring conventional hydrothermal systems because they can detect subsurface anomalies associated with deep granitic, including zones of alteration and fault structures that indicate geothermal activity. Gravity analysis has been effectively used to explore geothermal systems, particularly where these structures are covered by newer sedimentary layers [48,49]. Previous studies that have employed gravity techniques in geothermal exploration have demonstrated that gravity data interpretation can be useful in identifying faults, fractures, basement rocks, and even magma chambers and intrusive bodies related to the heat source of a geothermal system [49,50]. Harrat Lunayyir proximity to the normal faults bordering the Red Sea Rift.
The seismic activity and its location indicate that Harrat Lunayyir could potentially have areas with high permeability that could be exploited for geothermal energy [44]. The study area has a potential area for geothermal resources due to its location in a tectonically active region with associated volcanic activity. The Bouguer anomaly considers the effects of topography and density variations in the Earth’s crust. The Bouguer anomaly in the LVF indicates the presence of volcanic and sedimentary rocks with different densities in the subsurface. The LVF is known to contain volcanic rocks, and the Bouguer anomaly can help map the distribution and extent of these rocks. Areas of higher or lower density may also indicate the presence of geothermal reservoirs. Areas of low density can indicate the presence of hot rocks or fluids, which are characteristic of geothermal systems.
Figure 5 demonstrates the Bouguer anomaly of the LVF ranges from 11.4 to −60 mGal. The white boundary demonstrates the research area. The legend represents the negative and positive Bouguer anomaly values. The negative Bouguer anomalies (−60 to −1.0 mGal) are usually associated with low-density areas, which is an indication of geothermal systems. The area that is highlighted with white (the LVF) indicates that the low Bouguer anomaly has a potential subsurface geothermal reservoir.
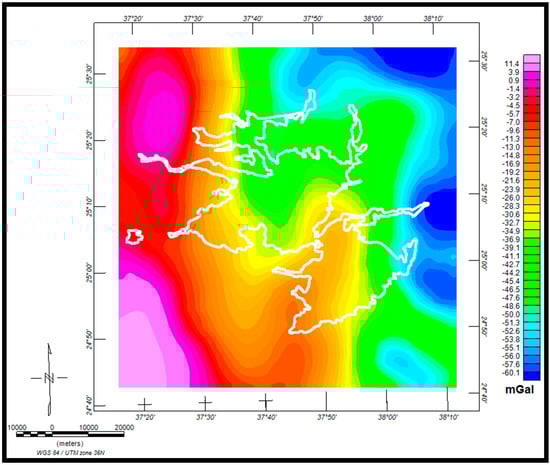
Figure 5.
Bouguer anomaly map of the study area. White polygon lines show the boundary of the Lunayyir volcanic field.
Heat flow is a critical parameter in geothermal analysis as it provides information about the amount of heat generated within the Earth’s crust and how it is transported to the surface. It is determined by measuring the temperature gradient and thermal conductivity of the rock or soil at a particular location [51]. Heat flow measurements are used in geothermal analysis to determine the thermal energy available in a geothermal reservoir, which can be used to generate electricity or provide direct heat. Heat flow is also used to estimate the temperature of the geothermal reservoir, as well as the depth and thickness of the reservoir [52]. Figure 6 shows the heat flow in the LVF. The area of interest lies at the approximate range of the heat flow raise between 24 to 60 mW/m2.
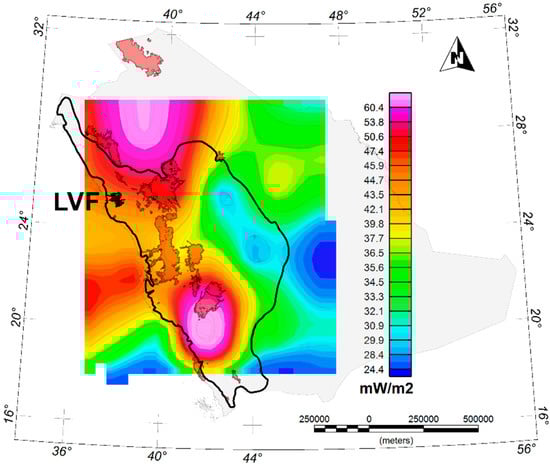
Figure 6.
Heat flow map of Saudi Arabia with the LVF indicated (modified after [11]).
4.2. Magnetic Data Interpretation
Peshawar Magnetic data can aid in the identification and characterization of geothermal resources by integrating information from CDP, SRTM 30, and magnetic intensity. CDP is particularly useful in providing information on the depth of magnetic sources related to hydrothermal systems, which are often associated with high heat flow and the thermal demagnetization of subsurface magnetic minerals.
Thus, the depth of the Curie isotherm can be used to estimate the depth of hydrothermal systems and their associated heat sources [53,54]. SRTM 30 data can also provide valuable information about the topography of the area, which can affect the distribution of geothermal resources. Geothermal systems are often associated with fault zones and fractures, which can create pathways for fluid circulation. The topography can also affect the depth of the hydrothermal systems, as the elevation can affect the geothermal gradient.
The low magnetic susceptibility basalt corresponds to the negative anomalies. The magnetic field value and weathering effectiveness in the area are influenced by the type of basaltic rocks, their mineralogy, and chemical composition [55]. A low magnetic anomaly associated with the presence of heated sedimentary rocks, which is the target zone for the geothermal reservoir [56]. The geochemical data analysis results indicate the presence of alkali basalt in the study area, which is considered to be a continental volcanic field [21]. The magnetic intensity of the LVF exhibits both positive and negative anomalies, ranging from −481.5 to +326.6 nT in magnitude.
Positive anomalies of about +320 nT are observed in the southeast and northwest regions of the LVF, while significant negative anomalies with magnitudes of −100 to −480 nT are present in its central parts. Therefore, high-magnetic-intensity (0 to +326.6 nT) anomalies in areas with known geothermal activity can indicate the presence of hydrothermal fluids and associated mineralization. Low-magnetic-intensity anomalies in certain areas can indicate the presence of basalt, which is believed to be the target zone for the geothermal reservoir as shown in Figure 7. The focus is on identifying areas with low anomaly zones, particularly those located in the north-northwest part of the study area.
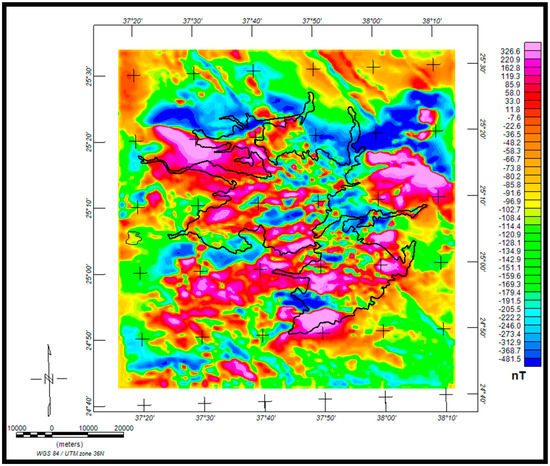
Figure 7.
Magnetic intensity map of the study area.
Spectral analysis of magnetic data provides reliable geological information, indicating that further research into geothermal exploration in the region is warranted. Short-wavelength anomalies are removed to enhance the long-wavelength anomalies associated with deep sources. The spectral analysis method indicates an average CDP beneath the region [57]. The interpretation of magnetic data has led to a better understanding of the geothermal regime, allowing for estimation of the depth to the CDP and heat flow [58]. Regions characterized by plateaus and trenches tend to have deeper CDP values exceeding 25 km [53].
The estimated depth of the Curie points ranges from 31.07 to 32.79 km, with an average depth of 31.84 km based on the available data. The CDP can be used to estimate the depth of magnetic sources associated with potential hydrothermal systems in the LVF. High heat flow associated with volcanic activity can cause thermal demagnetization of magnetic minerals in the subsurface, which can affect the depth of the Curie isotherm (Figure 8). Therefore, areas with shallow CDP may indicate the presence of potential geothermal energy, and deep CDP values (>25 km) may be present with deep geothermal resources.
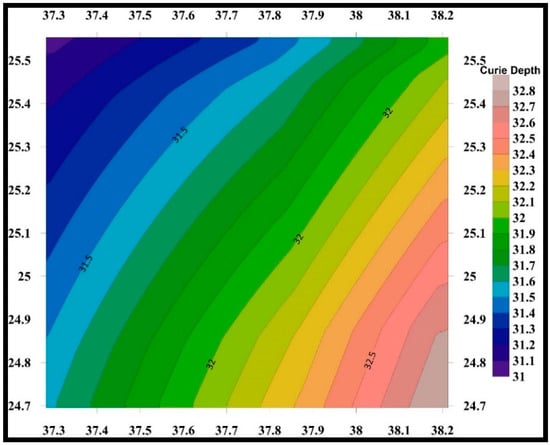
Figure 8.
Curie depth map of the study area [41].
The LVF is characterized by complex topography, including volcanic edifices, fault zones, and fractures. Areas of high elevation can indicate the presence of volcanic edifices and associated hydrothermal systems, while areas of low elevation may indicate the presence of sedimentary basins and potential geothermal reservoirs (Figure 9).
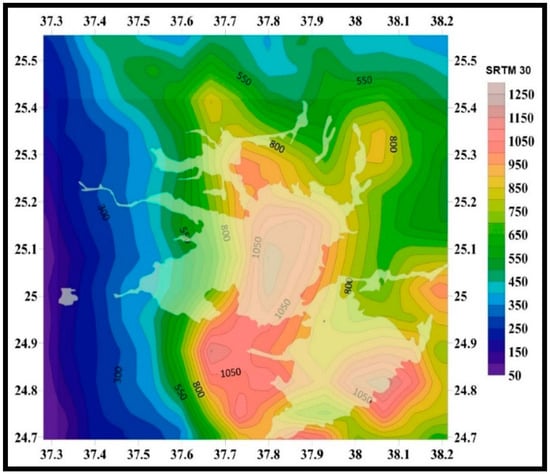
Figure 9.
SRTM map of the study area.
By combining data from CDP, SRTM 30, and the magnetic intensity, we can identify and analyze potential geothermal resources in the LVF. Specifically, regions with shallow CDPs, elevated magnetic intensity anomalies, and situated on topographical highs may suggest the existence of hydrothermal systems that have the potential for energy generation. The CDP, SRTM 30, and magnetic intensity data can provide valuable information for identifying and characterizing potential geothermal resources in the LVF and can contribute to the development of sustainable energy sources in this region (Figure 10). Based on previous study findings, it is inferred that this region is a volcanic or thermally active area, which suggests that it has good potential for the exploitation of geothermal energy.
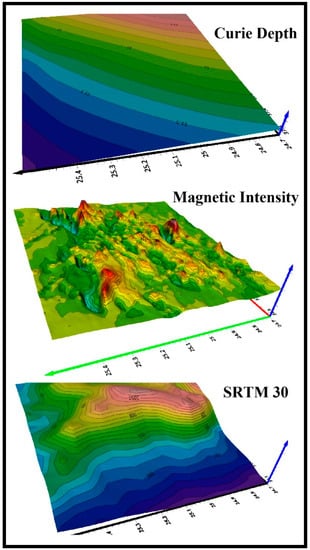
Figure 10.
3D layer model of the LVF shows the CDP, magnetic intensity, and SRTM 30 topography.
4.3. LST and NDVI Interpretation
Geothermal energy potential is typically determined by analyzing geological and geophysical dataset, which can be costly and difficult to gather and processes. GIS can simplify the process by combining multiple datasets from broader regions and identifying areas with significant geothermal potential [42]. The utilization of thermal infrared remote sensors is crucial for studying geothermal resources over large geographic areas, as they offer a cost-effective and efficient means of exploration. Thermal satellite images obtained from Landsat data can be combined with existing geological and geophysical data to identify potential sites for hydrothermal exploration [43].
Thermal infrared remote sensing (RS) provides spatially representative results over a larger area compared with traditional geothermal exploration methods. To discover and monitor geothermal resources effectively in the future, we need to improve our understanding of geothermal anomalies and geological structures. The effectiveness of geothermal exploration and monitoring can be improved by combining the analysis of geothermal anomalies with the geological structures of the study area [59]. The use of thermal RS has proven to be a highly effective method for exploring geothermal resources, resulting in significant savings of both time and cost. This has been demonstrated in numerous geothermal exploration efforts, including those conducted in active volcanoes and other geothermal regions [60].
The parameter of LST is crucial for conducting geothermal exploration [59]. After atmospheric correction of the red and near-infrared bands, the surface emissivity values were calculated. The method employed in this study follows the approach proposed by [61], which involves determining the emissivity for each pixel based on the proportion of calculated vegetation (NDVI) values. Qualitative classification was performed on LST using [43] classification with minor modification as shown in Table 2.
Table 2.
The use of satellite LST indices involved defining five qualitative classifications based on the maximum temperature ranges (modified after [43]).
The temperature anomaly patterns in the LVF most likely reflect the emplacement of a very shallow dyke intrusion [44]. Geothermal exploration requires the identification of areas with high subsurface temperatures. LST is an important parameter that can be used to identify such areas. In this research, we will discuss the role of LST in geothermal resources exploration in the study area. This could be indicative of volcanic activity, such as the presence of lava flows or hot gases, which would increase the LST. In 2000, the LVF was considered in the category of no active eruption or significant volcanic activity occurring.
Therefore, any increase in the surface temperature data during this year would likely be due to environmental factors, rather than volcanic activity. In 2007, there was a brief eruption at the LVF, which lasted for a few weeks in January and February. This eruption was characterized by the release of lava flows and ash plumes, which would have increased the surface temperature of the area. Therefore, any LST data from 2007 would likely show a significant increase compared to 2000. In 2021, there were no reports of significant volcanic activity at the LVF.
Based on the qualitative classifications of the LST, it was concluded that the maximum temperature range in the study area is in the high to very high geothermal anomaly zones (Figure 11). Figure 12a–c show a pie chart of the qualitative classifications of the LST for the years 2000, 2007, and 2021. Table 3 shows the details of the statistical analysis of the qualitative classifications of the LST for the years 2000, 2007, and 2021.
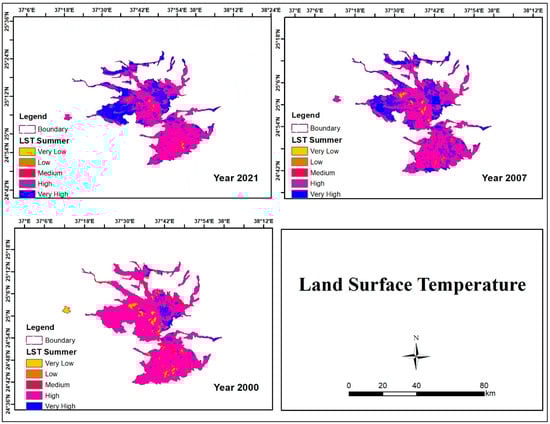
Figure 11.
Land surface temperature variation of the LVF for the years 2000, 2007, and 2021.
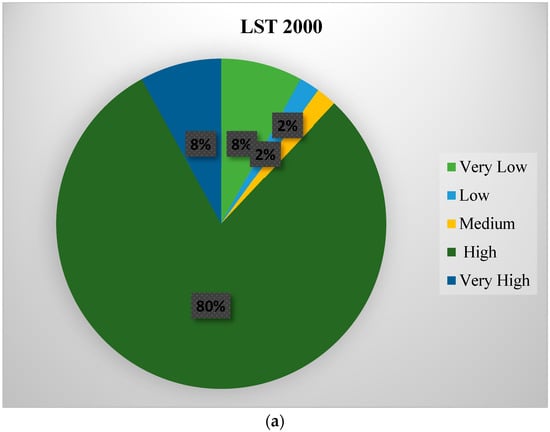
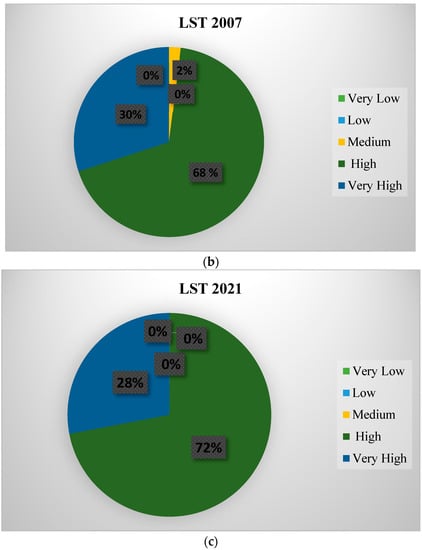
Figure 12.
(a) Land surface temperature qualitative classifications of the LVF for the year 2000. (b) Land surface temperature qualitative classifications of the LVF for the year 2007. (c) Land surface temperature qualitative classifications of the LVF for the year 2021.
Table 3.
Details of statistical analysis of qualitative classifications of the LST for the years 2000, 2007, and 2021.
The high LST values in the central and eastern parts of the region suggest the presence of geothermal resources in these areas. Further exploration is needed to assess the potential of these resources and their feasibility for development. The details statistical analysis of the LST that were calculated at different locations in the LVF for three different years (2000, 2007, and 2021) is shown in Table 4. Table 5 represents the statistics of the subsurface temperature obtained in the surrounding area of the LVF in 2007. Figure 13 shows the NDVI variation of the LVF for the years 2000, 2007, and 2021. It was observed that 100% of the area was classified as bare soil for all three years.
Table 4.
Details of the statistical analysis of land surface temperature of the LVF considering 50 sample points.
Table 5.
Statistical analysis of the subsurface temperature data from the surrounding area outside the LVF at the well location (Source of data: [44]).
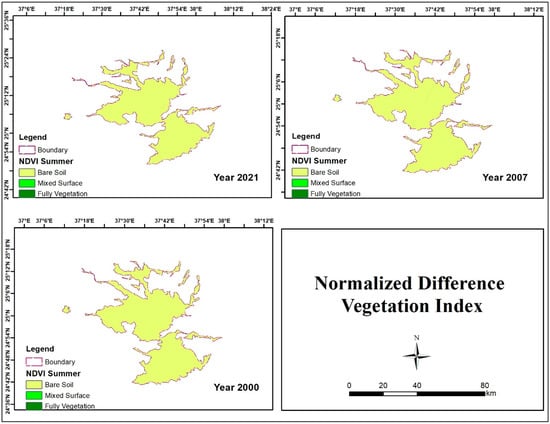
Figure 13.
NDVI variation of the LVF for the years 2000, 2007, and 2021.
5. Conclusions
Geothermal energy is a reliable baseload technology that enhances grid stability and offers energy resilience without the need for expensive storage solutions. In the future, geothermal energy could be highly beneficial as it could provide a reliable source of power for densely populated urban areas in Saudi Arabia. A study for the detection of geothermal anomalies using different geophysical approaches in the Lunayyir volcanic field, Saudi Arabia was performed in this research. Gravity and magnetic data integrated with other datasets can identify potential areas for further exploration and the development of geothermal resources in the region. The gravity and magnetic data provided evidence for the presence of geothermal potential.
It is possible to use thermal infrared remote sensing to reverse the LST and to identify the areas with high geothermal anomalies for geothermal exploration. It was inferred that the maximum cluster of data for LST (>43 °C) that occurred in zones of high to very high geothermal anomalies may be an indication of shallow dyke intrusion. The NDVI results indicated that 100% of the study area lies in bare soil. We concluded that integrating these datasets can help to identify potential geothermal resource areas in the LVF for exploration and development. The study concludes by emphasizing the potential benefits of geothermal energy as a reliable baseload technology in Saudi Arabia.
Author Contributions
M.A., conceptualization; F.A., methodology; M.E., E.A. and Z.N., data analysis as well as mapping; N.E.-M. and M.F.A. reviewing and texting. All authors have read and agreed to the published version of the manuscript.
Funding
This research work was funded by Institutional Fund Projects under grant no IFPNC-001-145-2020.
Institutional Review Board Statement
Not applicable.
Informed Consent Statement
Not applicable.
Data Availability Statement
The data presented in this study are available upon request from the corresponding author.
Acknowledgments
This research work was funded by Institutional Fund Projects under grant no IFPNC-001-145-2020. Therefore, the authors gratefully acknowledge the technical and financial support from the Ministry of Education and King Abdulaziz University, Jeddah, Saudi Arabia.
Conflicts of Interest
The authors declare no conflict of interest.
References
- Peng, C.; Pan, B.; Xue, L.; Liu, H. Geophysical survey of geothermal energy potential in the Liaoji Belt, northeastern China. Geotherm. Energy 2019, 7, 14. [Google Scholar] [CrossRef]
- Abdel Zaher, M.; Saibi, H.; Mansour, K.; Khalil, A.; Soliman, M. Geothermal exploration using airborne gravity and magnetic data at Siwa Oasis, Western Desert, Egypt. Renew. Sustain. Energy Rev. 2018, 82, 3824–3832. [Google Scholar] [CrossRef]
- Abuzied, S.M.; Kaiser, M.F.; Shendi, E.-A.H.; Abdel-Fattah, M.I. Multi-criteria decision support for geothermal resources exploration based on remote sensing, GIS and geophysical techniques along the Gulf of Suez coastal area, Egypt. Geothermics 2020, 88, 101893. [Google Scholar] [CrossRef]
- Bagher, A.M.; Vahid, M.; Mohsen, M. Geothermal energy. J. Eng. Technol. Res. 2014, 6, 146–150. [Google Scholar]
- Demirbas, A.; Alidrisi, H.; Ahmad, W.; Sheikh, M.H. Potential of geothermal energy in the Kingdom of Saudi Arabia. Energy Sources Part A Recover. Util. Environ. Eff. 2016, 38, 2238–2243. [Google Scholar] [CrossRef]
- Kulasekara, H.; Seynulabdeen, V. A Review of Geothermal Energy for Future Power Generation. In Proceedings of the 2019 5th International Conference on Advances in Electrical Engineering (ICAEE), Dhaka, Bangladesh, 26–28 September 2019; pp. 223–228. [Google Scholar]
- Lashin, A.; Bassam, A.; Arifi, A.; Rehman, N.; Faifi, A. A Review of the Geothermal Resources of Saudi Arabia: 2015–2020. In Proceedings of the World Geothermal Congress 2020, Reykjavik, Iceland, 27 April–1 May 2020; Enterprise Press: Reykjavik, Iceland, 2020; pp. 1–12. [Google Scholar]
- Fridleifsson, I.B.; Bertani, R.; Huenges, E.; Lund, J.W.; Ragnarsson, A.; Rybach, L. The Possible Role and Contribution of Geothermal Energy to the Mitigation of Climate Change; Citeseer: Princeton, NJ, USA, 2008; pp. 59–80. [Google Scholar]
- Gürbüz, E.Y.; Güler, O.V.; Keçebaş, A. Environmental impact assessment of a real geothermal driven power plant with two-stage ORC using enhanced exergo-environmental analysis. Renew. Energy 2022, 185, 1110–1123. [Google Scholar] [CrossRef]
- DiPippo, R. Geothermal power plants: Evolution and performance assessments. Geothermics 2015, 53, 291–307. [Google Scholar] [CrossRef]
- Aboud, E.; Qaddah, A.; Harbi, H.; Alqahtani, F. Geothermal Resources Database in Saudi Arabia (GRDiSA): GIS model and geothermal favorability map. Arab. J. Geosci. 2021, 14, 112. [Google Scholar] [CrossRef]
- Koulakov, I.; El Khrepy, S.; Al-Arifi, N.; Sychev, I.; Kuznetsov, P. Evidence of magma activation beneath the Harrat Lunayyir basaltic field (Saudi Arabia) from attenuation tomography. Solid Earth 2014, 5, 873–882. [Google Scholar] [CrossRef]
- Tang, Z.; Mai, P.M.; Julià, J.; Zahran, H. Shear velocity structure beneath Saudi Arabia from the joint inversion of P and S wave receiver functions, and Rayleigh wave group velocity dispersion data. J. Geophys. Res. Solid Earth 2019, 124, 4767–4787. [Google Scholar] [CrossRef]
- Pallister, J.S.; McCausland, W.A.; Jónsson, S.; Lu, Z.; Zahran, H.M.; Hadidy, S.E.; Aburukbah, A.; Stewart, I.C.F.; Lundgren, P.R.; White, R.A. Broad accommodation of rift-related extension recorded by dyke intrusion in Saudi Arabia. Nat. Geosci. 2010, 3, 705–712. [Google Scholar] [CrossRef]
- Mogren, S.; Saibi, H.; Mukhopadhyay, M.; Gottsmann, J.; Ibrahim, E.-K.H. Analyze the spatial distribution of lava flows in Al-Ays Volcanic Area, Saudi Arabia, using remote sensing. Arab. J. Geosci. 2017, 10, 133. [Google Scholar] [CrossRef]
- Abdel Zaher, M.; El Nuby, M.; Ghamry, E.; Mansour, K.; Saadi, N.M.; Atef, H. Geothermal studies in oilfield districts of Eastern Margin of the Gulf of Suez, Egypt. Nriag J. Astron. Geophys. 2014, 3, 62–69. [Google Scholar] [CrossRef]
- Ehsan, M.; Gu, H. An integrated approach for the identification of lithofacies and clay mineralogy through Neuro-Fuzzy, cross plot, and statistical analyses, from well log data. J. Earth Syst. Sci. 2020, 129, 1–13. [Google Scholar] [CrossRef]
- Abuzied, S.M.; Alrefaee, H.A. Mapping of groundwater prospective zones integrating remote sensing, geographic information systems and geophysical techniques in El-Qaà Plain area, Egypt. Hydrogeol. J. 2017, 25, 2067. [Google Scholar] [CrossRef]
- Noorollahi, Y.; Ghasempour, R.; Jalilinasrabady, S. A GIS based integration method for geothermal resources exploration and site selection. Energy Explor. Exploit. 2015, 33, 243–257. [Google Scholar] [CrossRef]
- Aljuhani, S.G. The Potential of Enhanced Geothermal Energy Systems in Saudi Arabia, AAPG Annual Convention and Exhibition, Long Beach, California; AAPG: Long Beach, CA, USA, 2012; pp. 1–25. [Google Scholar]
- Duncan, R.A.; Al-Amri, A.M. Timing and composition of volcanic activity at Harrat Lunayyir, western Saudi Arabia. J. Volcanol. Geotherm. Res. 2013, 260, 103–116. [Google Scholar] [CrossRef]
- Camp, V.E.; Hooper, P.R.; Roobol, M.J.; White, D.L. The Madinah eruption, Saudi Arabia: Magma mixing and simultaneous extrusion of three basaltic chemical types. Bull. Volcanol. 1987, 49, 489–508. [Google Scholar] [CrossRef]
- Martínez, F.; Cochran, J.R. Geothermal measurements in the northern Red Sea: Implications for lithospheric thermal structure and mode of extension during continental rifting. J. Geophys. Res. Solid Earth 1989, 94, 12239–12265. [Google Scholar] [CrossRef]
- Cochran, J.R.; Karner, G.D. Constraints on the deformation and rupturing of continental lithosphere of the Red Sea: The transition from rifting to drifting. Geol. Soc. Lond. Spec. Publ. 2007, 282, 265–289. [Google Scholar] [CrossRef]
- Alqahtani, F.; Abraham, E.M.; Aboud, E.; Rajab, M. Two-Dimensional Gravity Inversion of Basement Relief for Geothermal Energy Potentials at the Harrat Rahat Volcanic Field, Saudi Arabia, Using Particle Swarm Optimization. Energies 2022, 15, 2887. [Google Scholar] [CrossRef]
- Coleman, R.G.; Gregory, R.T.; Brown, G.F. Cenozoic Volcanic Rocks of Saudi Arabia; US Department of the Interior, Geological Survey: Reston, VA, USA, 1983; Volume 83. [Google Scholar]
- Girdler, R.W.; Fairhead, J.D.; Searle, R.C.; Sowerbutts, W.T.C. Evolution of rifting in Africa. Nature 1969, 224, 1178–1182. [Google Scholar] [CrossRef]
- Girdler, R.W.; Styles, P. Seafloor spreading in the western Gulf of Aden. Nature 1978, 271, 615–617. [Google Scholar] [CrossRef]
- Freund, R.; Garfunkel, Z.; Zak, I.; Goldberg, M.; Weissbrod, T.; Derin, B.; Bender, F.; Wellings, F.E.; Girdler, R.W. The shear along the Dead Sea rift. In Philosophical Transactions for the Royal Society of London. Series A, Mathematical and Physical Sciences; Royal Society: London, UK, 1970; pp. 107–130. [Google Scholar]
- Ross, D.A.; Schlee, J. Shallow structure and geologic development of the southern Red Sea. Geol. Soc. Am. Bull. 1973, 84, 3827–3848. [Google Scholar] [CrossRef]
- Milton, D.I. Geology of the Arabian Peninsula; United States Department of the Interior, Geological Survey: Reston, VA, USA, 1967. [Google Scholar]
- Alohali, A.; Bertin, D.; de Silva, S.; Cronin, S.; Duncan, R.; Qaysi, S.; Moufti, M.R. Spatio-temporal forecasting of future volcanism at Harrat Khaybar, Saudi Arabia. J. Appl. Volcanol. 2022, 11, 12. [Google Scholar] [CrossRef]
- Al-Saud, M.M. Seismic characteristics and kinematic models of Makkah and central Red Sea regions. Arab. J. Geosci. 2008, 1, 49–61. [Google Scholar] [CrossRef]
- Robinet, J.; Razin, P.; Leroy, S.; Serra-Kiel, J.; Gallardo-Garcia, A.; Roger, J.; Grelaud, C.; Carayon, B. Cenozoic Tectono-Stratigraphic and Geodynamic Evolution of the Eastern Strike-Slip Margin of the Arabian Plate. In Proceedings of the 80th EAGE Conference and Exhibition, Copenhagen, Denmark, 11–14 June 2018; EAGE Publications BV: Houten, The Netherlands, 2018; pp. 1–5. [Google Scholar]
- Blank, H.R. Aeromagnetic and Geologic Study of Tertiary Dikes and Related Structures on the Arabian Margin of the Red Sea. 1977. Available online: https://pascal-francis.inist.fr/vibad/index.php?action=getRecordDetail&idt=PASCALGEODEBRGM7920047669 (accessed on 20 March 2023).
- Saibi, H.; Mogren, S.; Mukhopadhyay, M.; Ibrahim, E. Subsurface imaging of the Harrat Lunayyir 2007–2009 earthquake swarm zone, western Saudi Arabia, using potential field methods. J. Asian Earth Sci. 2019, 169, 79–92. [Google Scholar] [CrossRef]
- Zahran, H.M.; Stewart, I.C.F.; Johnson, P.R.; Basahel, M.H. Aeromagnetic-anomaly maps of central and western Saudi Arabia. Saudi Geol. Surv. Open-File Rep. SGS-OF-2002-8 2003, 6. [Google Scholar]
- Mogren, S.; Saibi, H.; Mukhopadhyay, M.; Ibrahim, E. Gravity-Magnetic Data Interpretation for the Harrat Lunayyir 2009 Earthquake Swarm Zone, Saudi Arabia–Constraints Exercised from Remote Sensing Data Analysis. In Proceedings of the 35th International Geological Congress, Cape Town, South Africa, 27 August–4 September 2016. [Google Scholar]
- Springer, M. Interpretation of heat-flow density in the Central Andes. Tectonophysics 1999, 306, 377–395. [Google Scholar] [CrossRef]
- Vahrenkamp, V.; Finkbeiner, T.; Patzek, T.; Hoteit, H. Maturing Geothermal Energy for Saudi Arabia. In Proceedings of the 82nd EAGE Annual Conference & Exhibition, Online, 18–21 October 2021; pp. 1–4. [Google Scholar]
- Aboud, E.; Alotaibi, A.M.; Saud, R. Relationship between Curie isotherm surface and Moho discontinuity in the Arabian shield, Saudi Arabia. J. Asian Earth Sci. 2016, 128, 42–53. [Google Scholar] [CrossRef]
- Elbarbary, S.; Abdel Zaher, M.; Saibi, H.; Fowler, A.-R.; Saibi, K. Geothermal renewable energy prospects of the African continent using GIS. Geotherm. Energy 2022, 10, 8. [Google Scholar] [CrossRef]
- Calderón-Chaparro, R.A.; Vargas-Cuervo, G. Determination of Hydrothermal Prospects in the Geothermal Region of Paipa (Boyacá, Colombia), Using Remote Sensing and Field Data. Earth Sci. Res. J. 2019, 23, 265–282. [Google Scholar] [CrossRef]
- Al Shehri, A.; Gudmundsson, A. Unsupervised classification of lava flows in Harrat Lunayyir using remote sensing and GIS. Arab. J. Geosci. 2019, 12, 522. [Google Scholar] [CrossRef]
- Al-Amri, A.M.; Abdelrahman, K.; Mellors, R.; Harris, D. Geothermal potential of Harrat Rahat, Northern Arabian Shield: Geological constraints. Arab. J. Geosci. 2020, 13, 268. [Google Scholar] [CrossRef]
- Saadi, N.M.; Aboud, E.; Saibi, H.; Watanabe, K. Integrating data from remote sensing, geology and gravity for geological investigation in the Tarhunah area, Northwest Libya. Int. J. Digit. Earth 2008, 1, 347–366. [Google Scholar] [CrossRef]
- Al-Amri, A.M.; Fnais, M.S.; Abdel-Rahman, K.; Mogren, S.; Al-Dabbagh, M. Geochronological dating and stratigraphic sequences of Harrat Lunayyir, NW Saudi Arabia. Int. J. Phys. Sci. 2012, 7, 2791–2805. [Google Scholar] [CrossRef]
- Kohrn, S.B.; Bonet, C.; DiFrancesco, D.; Gibson, H. Geothermal exploration using gravity gradiometry—A Salton Sea example. Geotherm. Resour. Counc. Trans. 2011, 35, 1699–1702. [Google Scholar]
- Abraham, E.; Itumoh, O.; Chukwu, C.; Rock, O. Geothermal Energy Reconnaissance of Southeastern Nigeria from Analysis of Aeromagnetic and Gravity Data. Pure Appl. Geophys. 2019, 176, 1615–1638. [Google Scholar] [CrossRef]
- Represas, P.; Monteiro Santos, F.A.; Ribeiro, J.; Ribeiro, J.A.; Almeida, E.P.; Gonçalves, R.; Moreira, M.; Mendes-Victor, L.A. Interpretation of gravity data to delineate structural features connected to low-temperature geothermal resources at Northeastern Portugal. J. Appl. Geophys. 2013, 92, 30–38. [Google Scholar] [CrossRef]
- Ranalli, G.; Rybach, L. Heat flow, heat transfer and lithosphere rheology in geothermal areas: Features and examples. J. Volcanol. Geotherm. Res. 2005, 148, 3–19. [Google Scholar] [CrossRef]
- Pasquale, V.; Verdoya, M.; Chiozzi, P. Geothermics: Heat Flow in the Lithosphere; Springer: London, UK, 2014. [Google Scholar]
- Ole, M.O.; Opara, A.I.; Okereke, C.N.; Onyenegecha, C.P.; Akaolisa, C.Z.; Okoli, A.E.; Umoh, O.J. Estimates of Curie point depth, geothermal gradient and near-surface heat flow of Bida and environs, Nupe Basin, Nigeria, from high-resolution aeromagnetic data. Int. J. Energy Water Resour. 2021, 5, 425–439. [Google Scholar] [CrossRef]
- Adewumi, T.; Salako, K.A.; Usman, A.D.; Udensi, E.E. Heat flow analyses over Bornu Basin and its environs, Northeast Nigeria, using airborne magnetic and radiometric data: Implication for geothermal energy prospecting. Arab. J. Geosci. 2021, 14, 1355. [Google Scholar] [CrossRef]
- Mohamed, H.S.; Senosy, M.M.; Salah, H. Geothermal signature of basaltic flows using aeromagnetic data, west Cairo area, Egypt. Arab. J. Geosci. 2021, 14, 911. [Google Scholar] [CrossRef]
- Sismanto, S.; Yasmita, U.; Jusmi, F. Interpretation of the gravity and magnetic anomalies of the geothermal subsurface structure area in Pamancalan, Lebak, Banten, West Java, Indonesia. Arab. J. Geosci. 2018, 11, 396. [Google Scholar] [CrossRef]
- Njeudjang, K.; Kana, J.D.; Tom, A.; Essi, J.M.A.; Djongyang, N.; Tchinda, R. Curie point depth and heat flow deduced from spectral analysis of magnetic data over Adamawa volcanic region (Northern Cameroon): Geothermal implications. SN Appl. Sci. 2020, 2, 1330. [Google Scholar] [CrossRef]
- Mono, J.A.; Ndougsa-Mbarga, T.; Tarek, Y.; Ngoh, J.D.; Owono Amougou, O.U.I. Estimation of Curie-point depths, geothermal gradients and near-surface heat flow from spectral analysis of aeromagnetic data in the Loum—Minta area (Centre-East Cameroon). Egypt. J. Pet. 2018, 27, 1291–1299. [Google Scholar] [CrossRef]
- Dong, B.; Dong, S.; Wang, Y.; Wen, F.; Yu, C.; Zhou, J.; Song, R. Detecting Geothermal Resources in a Plateau Area: Constraints From Land Surface Temperature Characteristics Using Landsat 8 Data. Front. Earth Sci. 2022, 10, 151. [Google Scholar] [CrossRef]
- Darge, Y.M.; Hailu, B.T.; Muluneh, A.A.; Kidane, T. Detection of geothermal anomalies using Landsat 8 TIRS data in Tulu Moye geothermal prospect, Main Ethiopian Rift. Int. J. Appl. Earth Obs. Geoinf. 2019, 74, 16–26. [Google Scholar] [CrossRef]
- Sobrino, J.A.; Jiménez-Muñoz, J.C.; Paolini, L. Land surface temperature retrieval from LANDSAT TM 5. Remote Sens. Environ. 2004, 90, 434–440. [Google Scholar] [CrossRef]


Disclaimer/Publisher’s Note: The statements, opinions and data contained in all publications are solely those of the individual author(s) and contributor(s) and not of MDPI and/or the editor(s). MDPI and/or the editor(s) disclaim responsibility for any injury to people or property resulting from any ideas, methods, instructions or products referred to in the content. |
© 2023 by the authors. Licensee MDPI, Basel, Switzerland. This article is an open access article distributed under the terms and conditions of the Creative Commons Attribution (CC BY) license (https://creativecommons.org/licenses/by/4.0/).