Abstract
Background: Elderly population is particularly vulnerable to socioeconomic disparities. This study assessed inequalities in health care utilization among the elderly in China and identified contributing factors. Methods: This study used data from the 2018 China Health and Retirement Longitudinal Study survey. A non-linear probit regression model based on the Andersen Health Care Utilization Model was used to identify determinants of health care utilization among the elderly. The concentration index (CI) and the decomposition of the CI were calculated to evaluate inequalities in health care utilization among the elderly and identify related contributors. Results: The CI for actual and standardized outpatient visits was 0.0889 and 0.0945, respectively, and the corresponding values for inpatient service utilization were 0.1134 and 0.1176, respectively. Factors that contributed to greater inequalities in the utilization of outpatient and inpatient service included income (73.68% for outpatient service; 85.20% for inpatient service), Urban Employee Basic Medical Insurance (UEBMI) (40.75% for outpatient service; 32.03% for inpatient service) and non-agricultural Hukou status (12.63% for outpatient service; 18.73% for inpatient service). New Rural Cooperative Medical Scheme (NRCMS) (−34.30% for outpatient service; −33.18% for inpatient service) and poor health status (−7.36% for outpatient service; −8.30% for inpatient service) reduced inequalities in outpatient and inpatient utilization. Conclusions: This study found that a key contributor to these inequalities was income, followed by UEBMI coverage. Meanwhile, health care coverage through NRCMS was associated with fewer disparities in health care utilization.
1. Introduction
Population aging is a major medical and sociodemographic concern worldwide [1]. The United Nations highlighted that approximately 9.0% of persons were ≥65 years of age in 2019 and this is projected to reach 12.0% and 16.0% in 2030 and 2050, respectively [2]. China has the largest elderly population, and the degree of population aging has rapidly intensified with the increase in average life expectancy, resulting in greater pressures on health care systems and society [3,4]. The number of people ≥60 years of age was about 264 million (18.7% of the total population) in 2020, and is estimated to exceed 34.0% in 2050 [3,5].
As a prominent risk factor for multiple morbidities, disability, and death, aging itself is sometimes characterized as a disease [6,7,8,9]. As people age, they are more likely to suffer from chronic disease(s) than younger individuals [10]. In 2021, about 190 million elderly people in China suffered from chronic illnesses such as diabetes, hypertension, and chronic respiratory diseases [3]. About 75.0% of individuals ≥60 years of age had one or more chronic diseases, and 43.0% had multimorbidities [11]. As a result, elderly patients often require more frequent and long-term connections to health care than younger patients [12]. The 2020 China Health Statistics Yearbook indicated that individuals ≥60 years of age accounted for 39.9% of patients discharged from hospitals in 2019 [13]. The diagnosis and treatment of age-related diseases place a significant financial burden on the elderly, their families, and the health care system [14]. According to a 2018 study that measured health care expenditures among the elderly in China, total medical costs and out-of-pocket payments were approximately 1860 USD and 1145 USD, respectively [15]. There is a clear demand for elderly care and a high health burden among this patient population [3].
Elderly adults are particularly vulnerable to variability in health care utilization, including both over- and under-utilization of services [16,17]. The Colombian Health, Well-being and Aging study of patients ≥60 years of age revealed a 1.5-fold gap in outpatient visits and a 3.5-fold gap in preventive service utilization between the poorest and wealthiest income quintiles [18]. This finding implied that the health needs of socioeconomically disadvantaged elderly adults may be unmet due to economic disparities. Thus, it is especially important to reduce income gradients and remove inequities in health care utilization in this vulnerable population.
Inequalities in health care utilization are a core priority of global health initiatives, including China’s [19]. Several reports have assessed the association between income and health care utilization among middle-aged and elderly populations [20,21]. One study of Chinese patients ≥45 years of age identified significant differences in inpatient service utilization based on per capita household expenditures [22]. Low income and poor health status were negatively associated with the equitable and rational utilization of health care among the middle-aged and elderly patients. However, this study only focused on middle-aged and elderly patients with the chronic non-communicable diseases and analyzed inequality in inpatient services utilization. Therefore, inequalities in outpatient and inpatients services utilization among the elderly and associated factors in China remain unclear.
Few studies have focused exclusively on individuals ≥60 years of age, however, and there is little evidence on how income and need factors impact health care utilization by this population. Elderly individuals often require more frequent visits to health facilities and are more likely to avoid health care if financial difficulties arise. Thus, there is a critical need for a more complete picture of the inequalities in health care utilization in China. This study sought to assess the distribution of health care utilization by elderly adults and establish the nexus between income and inequalities in health care utilization. The findings will enhance the current knowledge base and provide further evidence about the impact of income and other risk factors on the unequal distribution of health care utilization by older populations.
2. Materials and Methods
2.1. Study Design and Data Source
The data for this cross-sectional study were derived from the 2018 China Health and Retirement Longitudinal Study (CHARLS), a nationally representative longitudinal survey of individuals ≥45 years of age in China that included assessments of social, economic, and health circumstances. CHARLS was conducted by the Institute of Social Science Survey at Peking University using a multiple-stage stratified random sampling method to ensure a nationally representative sample. The survey included 150 districts and 450 rural/urban communities in 28 provinces. Trained investigators conducted household surveys through one-to-one questionnaire interviews. A total of 19,507 interviewees ≥45 years of age were sampled using a multistage probability-proportional-to-size sampling procedure. Patients were considered eligible for inclusion if they were ≥60 years of age and had no missing health, household expenditure, and health care utilization data. After excluding patients with missing information, 9780 individuals were included in the final dataset (Figure 1).
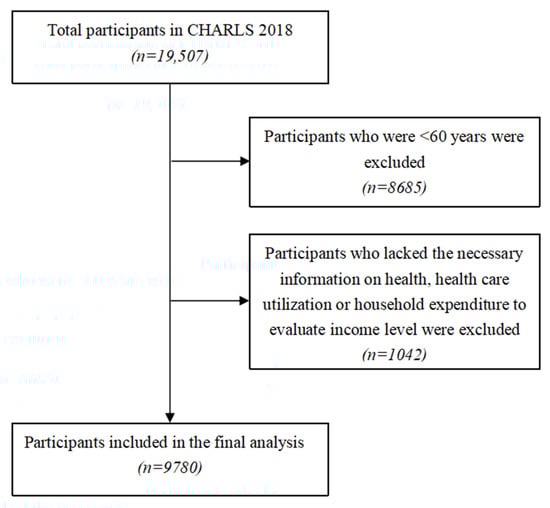
Figure 1.
Flow chart of study population selection.
2.2. Measurement
2.2.1. Dependent Variables
Outpatient and inpatient service utilization served as the dependent variables. The elderly study participants were asked if they had visited a public hospital, private hospital, public health center, clinic, health worker’s practice, or doctor’s practice or been visited by a health worker or doctor for outpatient care during the month prior to the interview and whether they had received inpatient services in the 12 months prior to the interview. The answers to these questions were coded as a dummy variable (0 = no, 1 = yes).
2.2.2. Independent and Control Variables
The Andersen Health Care Utilization Model has been verified by a number of empirical studies and was applied internationally to identify factors that influence health care utilization [23,24]. In accordance with this model, the independent variables in this study were divided into predisposing, enabling, and need factors.
Predisposing factors were defined as the individual characteristics of the elderly patients and included gender (male, female), age (60–69, 70–79, ≥80 years), education level (primary school or below, middle school, high school and above), marital status (single, married or partnered), and employment status (unemployed, employed, retired).
Enabling factors were those that affected an elderly patient’s ability to access the health care they needed, including region (east, central, west, northeast), Hukou status (a household registration system in China; agricultural, non-agricultural, unified residence), region of residence (urban, suburban, rural), income level (quintile1 [lowest], quintile2, quintile3, quintile4, quintile5 [highest]), health insurance (no health insurance, Urban Employee Basic Medical Insurance [UEBMI], Urban Resident Basic Medical Insurance [URBMI], Urban and Rural Resident Basic Medical Insurance [URRBMI], New Rural Cooperative Medical Scheme [NRCMS], other), number of household members, frequency of social activity (almost daily, almost every week, not regular, no social activities).
Need factors represented the patients’ perceived or evaluated health conditions and actual need for medical care, including self-reported health status (very good, good, fair, poor, very poor), chronic disease (no, yes), disability (no, yes), degree of pain (none, a little, somewhat, quite a bit, very much), smoking (no, yes), alcohol consumption (no, yes). Table 1 presents the definition of the dependent and independent variables.

Table 1.
Variable definitions.
2.2.3. Statistical Analysis
Descriptive statistics were used to analyze the distribution of outpatient and inpatient services among the elderly across various income and demographic groups and health-related behaviors.
Given that the dependent variables were binary variables, a non-linear probit regression model was used to calculate the concentration index (CI) and the decomposition of the CI to evaluate differences in health care utilization by income level and the contribution of predisposing, enabling, and need factors to unequal health care utilization among elderly adults [25].
The per capita household expenditure was adopted as a proxy for income and used to group individuals into five groups, from the lowest to the highest. The CI was calculated to measure income-related inequalities in health care utilization using Equation (1) [26,27]:
where hi is the measure of health care utilization, μ is its means and ri is the relative fractional rank of an individual i in the distribution of annual per capita household expenditures (i = 1 for the lowest and i = N for the highest).
The distribution of actual, need-expected, and need-standardized health care utilization by elderly adults was calculated across income groups. The CI of the actual health care utilization was a factual depiction of the level of inequality in the distribution of health care among the elderly. The CI of the need-expected health care utilization was the predicted inequality in the elderly’s health care utilization by the need variables. The CI of the need-standardized health care utilization implied that elderly adults with the same needs were treated the same.
The decomposition method was used to decompose inequalities in health care utilization into partial contributions of need and non-need contributors in order to reveal the sources of income-related inequalities [25,28]. Decomposition of the CI evaluated how determinants contributed proportionally to health care utilization inequality. A positive contribution to inequalities indicated that the variable increased the inequalities, meaning that the variable is associated with a greater concentration of outpatient or inpatient services among the richer elderly. The decomposition analysis included outpatient and inpatient service utilization as dependent variables and influencing variables included predisposing, enabling, and need factors.
As the dependent variable, health care utilization was defined using the following linear model:
where i denotes the individual, are predisposing factors, are enabling factors, and are need factors. , and denote the constant, coefficient, and error terms, respectively.
CI for health care utilization was decomposed as follows:
where , and are the marginal effects of the predisposing, enabling, and need factors, , and represent the means of the predisposing, enabling, and need factors, μ is the mean of y, , and represent the CI of the predisposing, enabling and need factors, and GC is the error term of health care.
All analyses were performed with the SPSS v25.0 (IBM Corp., Armonk, NY, USA) and Stata version 16.0 (Stata Corp., College Station, TX, USA). Statistical significance was defined as a two-sided p-value of <0.05.
3. Results
3.1. Sociodemographic Characteristics of the Elderly Study Participants
Descriptive statistics of the health care utilization and characteristics of the elderly study participants are shown in Table 2. About 16.3% of the participants had made outpatient visits in the month prior to the interview and 20.2% had received inpatient services in the 12 months before the interview. Approximately three-quarters of the elderly had a lower level of education, over 50.0% were still employed, and 73.7% were living in rural villages, compared to 19.5% and 6.6% living in urban and suburban areas, respectively. While the implementation of basic health insurance has ensured that most of the elderly in China are covered by medical insurance, 4.1% of the surveyed individuals were uninsured. About 24.2% of patients rated their health status as poor, of whom 84.6% were diagnosed with at least one kind of chronic disease and 44.7% had a disability.
Table 2.
Descriptive characteristics of elderly respondents.
3.2. Distribution of Health Care Utilization among the Elderly
Actual, need-standardized, and need-expected outpatient and inpatient service utilization across different income groups, along with the CIs for health care utilization inequalities, are shown in Table 3. The corresponding concentration curves for outpatient and inpatient service utilization is shown in Figure 2 and Figure 3.
Table 3.
Distribution of actual, need-expected, and need-standardized utilization of outpatient and inpatient services among the elderly across different income groups.
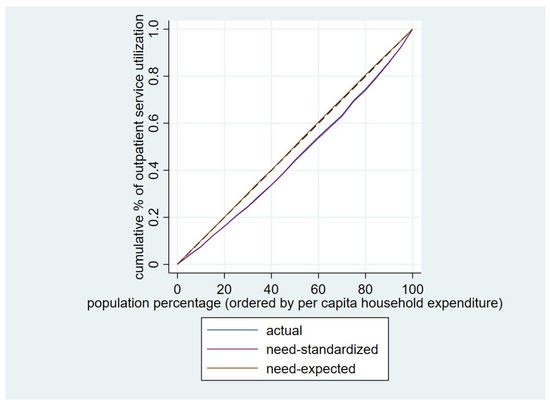
Figure 2.
Concentration curve for the utilization of outpatient service among the elderly.
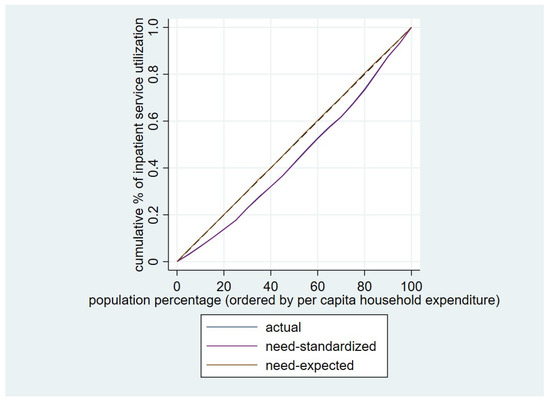
Figure 3.
Concentration curve for utilization of inpatient service among the elderly.
The CI for actual utilization of outpatient care was 0.0889. When controlling for need differences, the standardized CI was 0.0945, which was higher than the corresponding CI for actual utilization. The CI for need-expected outpatient visits utilization was −0.0058. A slight pro-poor inequality was found, but the CI was not statistically significant, and proportionality was not rejected in either case.
The CI for actual utilization of inpatient service was 0.1134, which was higher than the corresponding CI for actual outpatient care. After standardizing the differences in demands among the elderly, the standardized CI for inpatient service utilization was 0.1176. The CI for need-expected inpatient services utilization was −0.0043, which was not significant. Thus, the hypothesis of proportionality cannot be rejected.
3.3. Decomposition of Inequality in Elderly Outpatient and Inpatient Service Utilization
Table 4 shows the decomposition results based on the Andersen Health Care Utilization Model and the contribution of predisposing, enabling, and need factors to inequalities in health care utilization.
Table 4.
Decomposition of income-related inequality in the use of outpatient and inpatient services among the elderly.
Most of the observed inequalities in outpatient health care utilization could be positively attributed to income (73.68%), UEBMI (40.75%), non-agricultural Hukou status (12.63%), the lack of social activities (11.85%), and higher educational level (9.12%). NRCMS (−34.30%), “health poor” status (−7.36%), and living in a rural area (−6.22%) were the primary negative contributors to inequalities in outpatient utilization.
The main contributors to inequalities in inpatient service utilization were income (85.20%), UEBMI (32.03%), non-agricultural Hukou status (18.73%), employment (13.36%), and having a chronic disease (6.28%). NRCMS (−33.18%), “health poor” status (−8.30%), and residing in the western region (−4.57%) had a largely negative contribution to inequalities in inpatient service use.
Enabling factors positively contributed to inequalities in outpatient and inpatient service utilization, while need factors contributed negatively to inequalities in service use.
4. Discussion
This study evaluated inequalities in the utilization of health care services by the elderly in China and shed further light on the relative contributions of different risk factors. The findings showed obvious inequalities in the utilization of health services among the elderly. The predisposing factors had a minor impact on inequalities in health care utilization, the enabling factors made a dominant contribution to these inequalities, and the need factors slightly mitigated disparities in health care utilization. The health care utilization inequalities among the elderly in China were positively associated with income, UEBMI and non-agricultural Hukou status. The health care utilization inequalities among the elderly in China were negatively associated with NRCMS and poor health status.
This study revealed that the inequalities in health care utilization by elderly patients is a serious concern in China. Older adults in poverty were found to have high unmet health care needs, while wealthier adults overused the health care system. This may be because elderly individuals with a high-income level have more awareness and resources to access care than those with a lower income status [18]. Inequalities in inpatient service utilization were slightly greater than inequalities in outpatient service utilization. Since inpatients face more severe disease problems, hospitalization costs are often higher than outpatient expenses [20]. Low-income elderly patients tended to abandon hospitalization or sought cheaper outpatient visits.
Many countries and regions have reported that health care inequalities are primarily driven by differences in income [29,30]. However, Colombia and other Latin American countries are an exception [18,31,32]. They did not find inequality in access to inpatient care based on wealth because most hospital services were equally distributed among the rich and poor. In our Chinese study, similar to studies in many other countries, we found that income was the main contributor to inequalities in outpatient visits and inpatient services. Patients with higher-income levels were more likely to utilize outpatient and inpatient services compared to older patients with lower-income levels. Impoverished elderly patients had difficulty seeking care due to the high financial burden of treatments [33].
The second critical contributor to the inequalities in health care utilization was UEBMI coverage. This may be because UEBMI provides more health benefits to enrollees than URBMI and NRCMS [21]. Disparities in health care utilization between the elderly covered by UEBMI and those covered by other health insurance schemes were exacerbated.
NRCMS was the most important contributor to the reduction in outpatient and inpatient care utilization inequalities. This may be because NRCMS covered more poor people, providing greater access to healthcare for those who could not otherwise afford it. As a result, it helped reduce healthcare inequality by promoting nationwide access to healthcare. The disadvantaged rural population has benefited from increased accessibility to outpatient and inpatient services, resulting in a reduction of health care inequality among the elderly [34].
A longitudinal study conducted from 1991 to 2011 by the China Health and Nutrition Survey indicated that regional factors were a more important determinant of health care utilization inequalities than income. The study found that compared to urban residents, suburban, town, and village residents were less likely to use outpatient services; and village residents were less likely to use inpatient health care [35]. However, in this study focused on the elderly population, we did not find an apparent influence of regional residence on health care utilization inequalities. One possible explanation for this result could be that elderly patients, due to their poor health condition, were frequent healthcare resource users and therefore were less likely to be limited in healthcare access by region of residence. However, we found that rich elderly people with non-agricultural Hukou status used more health care services than those with agricultural Hukou status. This finding could be explained by disparities in medical service accessibility and the income gap between non-agricultural and agricultural Hukou groups [36].
Other factors, including more education and employment were also contributors to increase inequalities in health care utilization. Elderly people with more education were more likely to seek outpatient service than elderly with less education. This may be related to differences in health literacy [37]. Patients with a higher educational level are more likely to receive health information and thus make informed decisions about suitable medical services than those with a lower educational level [38]. Similarly, employed elderly individuals were more likely to use inpatient services than unemployed elderly people. This is supported by other studies conducted in low- and middle-income countries. A study conducted in India found that older people with formal sector employment had greater access to health care services than those with informal employment, likely due to their social pensions [39]. In the current study, employed older people had a steady source of income and were more able to afford hospitalization costs than unemployed elderly adults [40].
Our findings have important implications for the Chinese health care system and policymakers. The increasing aging population in China presents great challenges to the health care delivery system and cost containment [8]. Despite the implementation of targeted policies to address inequities in the utilization of health services, serious flaws exist in the design of China’s health insurance schemes [41]. Our study highlights the need to identify differences in health care utilization between socioeconomically disadvantaged and advantaged elderly patients and their influencing factors. Policies aimed at alleviating inequalities in health care utilization should prioritize elderly patients who are socioeconomically disadvantaged, such as those in poverty, lacking social security, and having agricultural Hukou status. Our study also suggests that financial capability remains the most significant determinant of inequalities in health care utilization amongst the elderly in China. The current health insurance schemes are insufficient to address this inequality, especially for the poor elderly. Therefore, to effectively target the elderly poor, policymakers should improve the design of health insurance and implement a more comprehensive insurance package, such as increasing subsidies for poor elderly individuals to relieve the economic burden on their families [42]. The benefit packages of health insurance programs should also place more emphasis on primary and long-term geriatric care.
This study has some limitations. First, health care utilization and annual per capita household expenditures were self-reported, so recall biases could not be avoided. Second, chronic disease diagnoses were self-reported, which could result in an under- or overestimation of disease prevalence. Third, a causation study could not be carried out because decomposition analysis is a descriptive statistic. Thus, the results should be viewed with caution. Another limitation of our study is that we used a subset of the CHARLES dataset consisting of individuals aged 60 years or older, while the original dataset included individuals aged 45 years or older. This may have led to a less representative sample of the elderly population in China, and our findings should be interpreted with caution.
5. Conclusions
Inequalities in health care utilization persist among the elderly in China. This study found that income was the most important contributing factor to inequalities in outpatient and inpatient service utilization, followed by UEBMI coverage. Meanwhile, having NRCMS reduced inequalities in health care utilization. Public health insurance failed to reduce the financial risks posed to elderly patients’ families. Individualized and targeted guidelines for elderly health management and social health insurance with expanded benefit packages are crucial to easing the burden of health care among the elderly in China.
Author Contributions
Conceptualization, M.C. and F.M.; methodology, H.Z.; data curation, M.C. and F.M.; formal analysis, H.Z.; writing—original draft, H.Z.; writing—review and editing, M.C. and F.M.; visualization, H.Z., M.C. and F.M.; supervision, M.C. and F.M.; project administration, M.C. and F.M.; funding acquisition, M.C.; M.C. and F.M. contributed equally to this work. All authors have read and agreed to the published version of the manuscript.
Funding
This study is funded by the National Natural Science Foundation of China (grant number: 71874086, 72174093).
Institutional Review Board Statement
This study involves human participants and was approved by the Nanjing Medical University Ethics Committee (ID: 555). Participants gave informed consent to participate in the study before taking part.
Informed Consent Statement
Informed consent was obtained from all subjects involved in the study.
Data Availability Statement
The data that support the findings of this study are openly available in the China Health and Retirement Longitudinal Study (CHARLS) at http://charls.pku.edu.cn/(accessed on 8 December 2022).
Acknowledgments
This study was supported by the Public Health Policy and Management Innovation Research Team, which is an Excellent Innovation Team of Philosophy and Social Sciences in Jiangsu Universities granted by the Jiangsu Education Department.
Conflicts of Interest
The authors declare no conflict of interest.
References
- Rudnicka, E.; Napierala, P.; Podfigurna, A.; Meczekalski, B.; Smolarczyk, R.; Grymowicz, M. The World Health Organization (WHO) approach to healthy ageing. Maturitas 2020, 139, 6–11. [Google Scholar] [CrossRef]
- United Nations. World Population Prospects 2019: Highlights. Available online: https://population.un.org/wpp/Download/Standard/Population (accessed on 8 December 2022).
- Bao, J.; Zhou, L.; Liu, G.; Tang, J.; Lu, X.; Cheng, C.; Jin, Y.; Bai, J. Current state of care for the elderly in China in the context of an aging population. Biosci. Trends 2022, 16, 107–118. [Google Scholar] [CrossRef]
- Wang, M.Y.; Sung, H.C.; Liu, J.Y. Population Aging and Its Impact on Human Wellbeing in China. Front. Public Health 2022, 10, 883566. [Google Scholar] [CrossRef] [PubMed]
- The Office of China National Committee on Aging. The general research report of Chinese strategic for dealing with population aging. Sci. Res. Aging 2015, 3, 4–38. [Google Scholar]
- De Winter, G. Aging as disease. Med. Health Care Philos. 2015, 18, 237–243. [Google Scholar] [CrossRef] [PubMed]
- Hou, Y.; Dan, X.; Babbar, M.; Wei, Y.; Hasselbalch, S.G.; Croteau, D.L.; Bohr, V.A. Ageing as a risk factor for neurodegenerative disease. Nat. Rev. Neurol. 2019, 15, 565–581. [Google Scholar] [CrossRef]
- Li, C.; Zhou, R.; Yao, N.; Cornwell, T.; Wang, S. Health Care Utilization and Unmet Needs in Chinese Older Adults with Multimorbidity and Functional Impairment. J. Am. Med. Dir. Assoc. 2020, 21, 806–810. [Google Scholar] [CrossRef]
- Chen, Y.; Klein, S.L.; Garibaldi, B.T.; Li, H.; Wu, C.; Osevala, N.M.; Li, T.; Margolick, J.B.; Pawelec, G.; Leng, S.X. Aging in COVID-19: Vulnerability, immunity and intervention. Ageing Res. Rev. 2021, 65, 101205. [Google Scholar] [CrossRef] [PubMed]
- Yang, W.; Wu, B.; Tan, S.Y.; Li, B.; Lou, V.W.Q.; Chen, Z.A.; Chen, X.; Fletcher, J.R.; Carrino, L.; Hu, B.; et al. Understanding Health and Social Challenges for Aging and Long-Term Care in China. Res. Aging 2021, 43, 127–135. [Google Scholar] [CrossRef]
- Health China Action Promotion Committee. Healthy China initiative (2019–2030). Available online: http://www.gov.cn/xinwen/2019-07/15/content_5409694.htm (accessed on 8 December 2022).
- Liu, Y.; Liu, N.; Cheng, M.; Peng, X.; Huang, J.; Ma, J.; Wang, P. The changes in socioeconomic inequalities and inequities in health services utilization among patients with hypertension in Pearl River Delta of China, 2015 and 2019. BMC Public Health 2021, 21, 903. [Google Scholar] [CrossRef]
- National Bureau of Statistics of China. China Statistical Yearbook 2020. Available online: http://www.nhc.gov.cn/mohwsbwstjxxzx/tjtjnj/202112/dcd39654d66c4e6abf4d7b1389becd01.shtml (accessed on 8 December 2022).
- Atella, V.; Piano Mortari, A.; Kopinska, J.; Belotti, F.; Lapi, F.; Cricelli, C.; Fontana, L. Trends in age-related disease burden and healthcare utilization. Aging Cell 2019, 18, e12861. [Google Scholar] [CrossRef] [PubMed]
- Cao, H.; Xu, X.; You, H.; Gu, J.; Hu, H.; Jiang, S. Healthcare Expenditures among the Elderly in China: The Role of Catastrophic Medical Insurance. Int. J. Environ. Res. Public Health 2022, 19, 14313. [Google Scholar] [CrossRef]
- Lipitz-Snyderman, A.; Bach, P.B. Overuse of health care services: When less is more … more or less. JAMA Intern. Med. 2013, 173, 1277–1278. [Google Scholar] [CrossRef] [PubMed]
- Acharya, S.; Ghimire, S.; Jeffers, E.M.; Shrestha, N. Health Care Utilization and Health Care Expenditure of Nepali Older Adults. Front. Public Health 2019, 7, 24. [Google Scholar] [CrossRef] [PubMed]
- Garcia-Ramirez, J.; Nikoloski, Z.; Mossialos, E. Inequality in healthcare use among older people in Colombia. Int. J. Equity Health 2020, 19, 168. [Google Scholar] [CrossRef] [PubMed]
- Ozturk, S.; Basar, D. Equity in utilization of health care services in Turkey: An index based analysis. East. Mediterr. Health J. 2020, 26, 547–555. [Google Scholar] [CrossRef] [PubMed]
- Wang, Y.; Wang, J.; Maitland, E.; Zhao, Y.; Nicholas, S.; Lu, M. Growing old before growing rich: Inequality in health service utilization among the mid-aged and elderly in Gansu and Zhejiang Provinces, China. BMC Health Serv. Res. 2012, 12, 302. [Google Scholar] [CrossRef]
- Li, C.; Dou, L.; Wang, H.; Jing, S.; Yin, A. Horizontal Inequity in Health Care Utilization among the Middle-Aged and Elderly in China. Int. J. Environ. Res. Public Health 2017, 14, 842. [Google Scholar] [CrossRef] [PubMed]
- Fu, X.Z.; Wang, L.K.; Sun, C.Q.; Wang, D.D.; He, J.J.; Tang, Q.X.; Zhou, Q.Y. Inequity in inpatient services utilization: A longitudinal comparative analysis of middle-aged and elderly patients with the chronic non-communicable diseases in China. Int. J. Equity Health 2020, 19, 6. [Google Scholar] [CrossRef]
- Kehrer, B.H.; Glaser, W.A. A behavioral model of families’ use of health services. J. Hum. Resoures 1972, 7, 125–127. [Google Scholar] [CrossRef]
- Evashwick, C.; Rowe, G.; Diehr, P.; Branch, L. Factors explaining the use of health care services by the elderly. Health Serv. Res. 1984, 19, 357–382. [Google Scholar] [PubMed]
- Owen, O.D.; Eddy, V.D.; Adam, W.; Magnus, L. Analyzing Health Equity Using Household Survey Data: A Guide to Techniques and Their Implementation; The World Bank: Washington, DC, USA, 2008; p. 2007. [Google Scholar]
- Wagstaff, A.; Paci, P.; van Doorslaer, E. On the measurement of inequalities in health. Soc. Sci. Med. 1991, 33, 545–557. [Google Scholar] [CrossRef] [PubMed]
- Wagstaff, A. Inequality aversion, health inequalities and health achievement. J. Health Econ. 2002, 21, 627–641. [Google Scholar] [CrossRef] [PubMed]
- Wagstaff, A.; Doorslaer, E.V.; Watanabe, N. On decomposing the causes of health sector inequalities with an application to malnutrition inequalities in Vietnam. J. Econom. 2003, 112, 207–223. [Google Scholar] [CrossRef]
- Joe, W.; Rudra, S.; Subramanian, S.V. Horizontal Inequity in Elderly Health Care Utilization: Evidence from India. J. Korean Med. Sci. 2015, 30 (Suppl. S2), S155–S166. [Google Scholar] [CrossRef]
- Ilinca, S.; Di Giorgio, L.; Salari, P.; Chuma, J. Socio-economic inequality and inequity in use of health care services in Kenya: Evidence from the fourth Kenya household health expenditure and utilization survey. Int. J. Equity Health 2019, 18, 196. [Google Scholar] [CrossRef]
- Ruiz Gómez, F.; Zapata Jaramillo, T.; Garavito Beltrán, L. Colombian health care system: Results on equity for five health dimensions, 2003–2008. Rev. Panam. Salud Publica 2013, 33, 107–115. [Google Scholar] [CrossRef]
- Dmytraczenko, T.; Gisele, A. Toward Universal Health Coverage and Equity in Latin America and the Caribbean: Evidence from Selected Countries. Directions in Development—Human Development. 2015. Available online: http://hdl.handle.net/10986/22026 (accessed on 20 April 2023).
- Li, Y.N.; Nong, D.X.; Wei, B.; Feng, Q.M.; Luo, H.Y. The impact of predisposing, enabling, and need factors in utilization of health services among rural residents in Guangxi, China. BMC Health Serv. Res. 2016, 16, 592. [Google Scholar] [CrossRef]
- Li, Q.; Zhang, L.; Jian, W. The impact of integrated urban and rural resident basic medical insurance on health service equity: Evidence from China. Front. Public Health 2023, 11, 1106166. [Google Scholar] [CrossRef]
- Zhu, D.; Guo, N.; Wang, J.; Nicholas, S.; Chen, L. Socioeconomic inequalities of outpatient and inpatient service utilization in China: Personal and regional perspectives. Int. J. Equity Health 2017, 16, 210. [Google Scholar] [CrossRef]
- Wang, Z.; Yang, X.; Chen, M. Inequality and Associated Factors in Utilization of Long-Term Care Among Chinese Older People: Evidence from the Chinese Longitudinal Healthy Longevity Survey. Soc. Indic. Res. 2020, 160, 467–486. [Google Scholar] [CrossRef]
- Van der Heide, I.; Wang, J.; Droomers, M.; Spreeuwenberg, P.; Rademakers, J.; Uiters, E. The relationship between health, education, and health literacy: Results from the Dutch Adult Literacy and Life Skills Survey. J. Health Commun. 2013, 18 (Suppl. S1), 172–184. [Google Scholar] [CrossRef] [PubMed]
- Kickbusch, I.; Pelikan, J.M.; Apfel, F.; Tsouros, A.D. Health Literacy: The Solid Facts; World Health Organization, Regional Office for Europe: Copenhagen, Denmark, 2013; Available online: https://apps.who.int/iris/handle/10665/326432 (accessed on 8 December 2022).
- Brinda, E.M.; Attermann, J.; Gerdtham, U.G.; Enemark, U. Socio-economic inequalities in health and health service use among older adults in India: Results from the WHO Study on Global AGEing and adult health survey. Public Health 2016, 141, 32–41. [Google Scholar] [CrossRef] [PubMed]
- Liu, X.; Gao, W.; Yan, H. Measuring and decomposing the inequality of maternal health services utilization in western rural China. BMC Health Serv. Res. 2014, 14, 102. [Google Scholar] [CrossRef] [PubMed]
- Xie, X.; Wu, Q.; Hao, Y.; Yin, H.; Fu, W.; Ning, N.; Xu, L.; Liu, C.; Li, Y.; Kang, Z.; et al. Identifying determinants of socioeconomic inequality in health service utilization among patients with chronic non-communicable diseases in China. PLoS ONE 2014, 9, e100231. [Google Scholar] [CrossRef]
- Sun, J.; Lyu, X.; Yang, F. The Effect of New Rural Cooperative Medical Scheme on the Socioeconomic Inequality in Inpatient Service Utilization Among the Elderly in China. Risk Manag. Healthc Policy 2020, 13, 1383–1390. [Google Scholar] [CrossRef]


Disclaimer/Publisher’s Note: The statements, opinions and data contained in all publications are solely those of the individual author(s) and contributor(s) and not of MDPI and/or the editor(s). MDPI and/or the editor(s) disclaim responsibility for any injury to people or property resulting from any ideas, methods, instructions or products referred to in the content. |
© 2023 by the authors. Licensee MDPI, Basel, Switzerland. This article is an open access article distributed under the terms and conditions of the Creative Commons Attribution (CC BY) license (https://creativecommons.org/licenses/by/4.0/).