Article

Innovative Imaging and Analysis Techniques for Quantifying Spalling Repair Materials in Concrete Pavements

1
Department of Regional Infrastructure Engineering, Kangwon National University, Chuncheon-si 24341, Republic of Korea
2
Department of Construction Science, Texas A&M University, College Station, TX 77843, USA
3
Department of Civil and Environmental Engineering, University of Alabama in Huntsville, Huntsville, AL 35899, USA
4
Department of Korean Peninsula Infrastructure Special Committee, Korea Institute of Civil Engineering and Building Technology, Ilsanseo-gu, Goyang-si 10223, Republic of Korea
*
Author to whom correspondence should be addressed.
Sustainability 2024, 16(1), 112; https://doi.org/10.3390/su16010112
Submission received: 8 November 2023 / Revised: 5 December 2023 / Accepted: 20 December 2023 / Published: 21 December 2023

Abstract

:
Traditional spalling repair on concrete pavement roads is labor-intensive. It involves traffic blockages and the manual calculation of repair areas, leading to time-consuming processes with potential discrepancies. This study used a line scan camera to photograph road surface conditions to analyze spalling without causing traffic blockage in an indoor setting. By using deep learning algorithms, specifically a region-based convolutional neural network (R-CNN) in the form of the Mask R-CNN algorithm, the system detects spalling and calculates its area. The program processes data based on the Federal Highway Administration (FHWA) spalling repair standards. Accuracy was assessed using root mean square error (RMSE) and Pearson correlation coefficient (PCC) via comparisons with actual field calculations. The RMSE values were 0.0137 and 0.0167 for the minimum and maximum repair areas, respectively, showing high accuracy. The PCC values were 0.987 and 0.992, indicating a strong correlation between the actual and calculated repair areas, confirming the high calculation accuracy of the method.

1. Introduction

Portland cement concrete is widely utilized in road pavement due to its high durability and low maintenance costs [1,2,3]. Despite their advantages, the lifespan and durability of concrete-paved roads are progressively diminishing due to road aging, environmental factors, and increased vehicle traffic [4,5]. These factors lead to increased spalling, a phenomenon where the concrete surface or edges become fragmented or lost. Various problems arise from spalling in concrete. Spalling weakens concrete’s overall strength and durability due to the loss of a portion of the cross-section [6]. Furthermore, the lost concrete creates a pathway for water and chemicals to penetrate, resulting in internal reinforcement corrosion, spalling, decreased pavement strength, and reduced durability [7].
Spalling on roads causes surface irregularities, reducing ride comfort [8] and increasing accident risks due to water accumulation or freezing in rainy or winter conditions [9]. Therefore, repair work is necessary when spalling occurs. Spalling repairs may take the form of surface patching [10,11] or removing and replacing the affected road section with new concrete [12]. The reason for removing the affected road section and replacing it with new concrete is that spalling often indicates not only visible surface damage but also a high likelihood of cracks in the surrounding internal area. Therefore, surrounding areas are cut and repaired using partial-depth repair or full-depth repair methods to address these potential internal damages [13]. However, partial and full-depth repair can be costlier in terms of labor, materials, and indirect costs during road closure, especially if only one or two instances of spalling occur within a narrow area, making the repair cost outweigh the expected benefits [14]. Spalling repair typically involves blocking the affected road, deploying workers to identify spalling on-site, and then calculating the repair area for each spalling instance. This process can be time-consuming, especially if numerous spalling instances exist [15]. Moreover, calculating the repair area relies on the experience of individual workers, leading to potential discrepancies [16,17]; even the same worker may produce inconsistent calculations depending on their condition, resulting in calculation errors [18,19]. Such errors may accumulate into significant discrepancies when dealing with dozens or hundreds of spalling instances [20], leading to either excessive material consumption and additional expenditure [21] or material shortages and construction delays [22].
In road maintenance, traditional spalling repair methods have significant economic, social, and environmental impacts. Economically, they are costly due to inefficient material and labor use, often leading to material waste and construction delays, which increase costs and disrupt traffic [23,24,25]. Socially, prolonged repairs affect community life, increasing traffic accidents and reducing residents’ quality of life [26,27]. Environmentally, these methods deplete natural resources, produce excessive waste, and contribute to higher carbon dioxide emissions from both manufacturing and increased vehicle emissions during extended construction and traffic disruptions [28,29,30]. These factors collectively underscore the need for innovative approaches in spalling repair, emphasizing efficiency, accuracy, and sustainability.
Numerous studies have proposed using computer vision technology, an AI technology that extracts meaningful information through image and video analysis, to mitigate these issues. Wu et al. [31] proposed a method for diagnosing the condition of structures, such as bridges, dams, and tunnels, by combining unmanned aerial vehicle (UAV) imaging and convolutional neural networks (CNNs), enabling damage classification and structural health grading. Dorafshan et al. [32] compared the performance of edge detection and deep convolutional neural networks (DCNNs) for detecting damage in concrete images. While edge detection showed 53–79% accuracy, it generated residual noise, whereas DCNN detected 86% of the crack images, even demonstrating the ability to identify finer cracks. They also proposed a method combining DCNN with edge detection, reducing noise by 24 times. Research has also been conducted on region-based convolutional neural networks (R-CNNs) to enhance detection capabilities [33] and Fast R-CNN to improve detection speed [34]. Kumar et al. [35] proposed the use of Mask R-CNN, a detection model based on Fast R-CNN, for detecting concrete surface cracks and spalling in civil infrastructure. This model can detect objects at the pixel level and achieve high accuracy. However, it requires significant processing time due to its complexity. Mandal et al. [36] proposed a method using CNN-based you only look once (YOLO) to detect road damage, demonstrating high accuracy but facing more difficulty in detecting smaller objects compared to R-CNN-based algorithms.
The existing precedents in the field have demonstrated the potential for reducing the time required for workers to identify spalling on-site through continuous research into innovative methods for spalling detection using deep learning algorithms and computer vision technology. However, these prior studies have primarily focused on developing high-performance deep learning algorithms for spalling detection, with a significant lack of awareness regarding the importance of accurately calculating the repair area and the amount of repair material required for spalling. Consequently, there is an absence of research related to the accurate calculation of repair areas and material quantities, and no existing studies to pre-emptively prevent or minimize problems, such as construction delays and the generation of construction waste, that can arise from inaccurate calculations of spalling repair areas and material quantities. Moreover, while UAVs have been widely used for photographing existing road conditions due to their high utility, they come with several issues, including limited battery life and operational constraints. Therefore, this study proposes a method for accurately calculating repair areas and material quantities for road sustainability, going beyond the current focus on spalling detection. The proposed method consists of three stages. First, a line scan camera is utilized to photograph the condition of the road. By mounting a line scan camera on a vehicle instead of using UAVs, it is possible to conduct this photography and analyze the road’s condition indoors. This enables analysis without the constraints of weather, battery life, the need for separate road closures, and traffic congestion. Second, since manually analyzing individual road photographs would be time-consuming, deep learning algorithms are employed to detect spalling and calculate the area to expedite the analysis. This stage involves the creation of training data for the deep learning algorithm and analyzing road photographs through learning. Third, the detected and calculated spalling area information is applied to the repair area calculation criteria to compute the accurate repair area and material quantity. This approach reduces the likelihood of construction delays and waste generation due to road closures and calculation errors inherent in the traditional repair processes, enabling the rapid and precise calculation of spalling repair areas and material quantities based on consistent criteria. This method allows for the assessment of road pavement conditions in an indoor environment without on-site traffic control, which is expected to reduce repair work and traffic control duration. In addition, the more accurate calculation of repair materials is anticipated to decrease energy consumption due to unnecessary material production. Collectively, these advancements contribute to a sustainable approach to road maintenance and offer a novel research direction to enhance the efficiency and accuracy of road repair work.

2. Materials and Methods

The framework of this study is structured as depicted in Figure 1. The initial phase entails the imaging of road pavement conditions, which is executed without necessitating road closures. This non-intrusive approach is crucial for evaluating the structural integrity of the pavement. Subsequently, the captured images are rigorously analyzed in a controlled setting to identify instances of spalling on the pavement surface and to quantify the areas needing repair.
The detection of pavement spalling, although possible through manual inspection, is hampered by its time-consuming nature and the potential for diminished accuracy. The main factors contributing to this reduced precision are human fatigue and the variability in spalling discernment criteria among different inspectors, leading to inconsistent detection results. The study integrates a deep learning-based object detection algorithm to address these challenges, significantly enhancing the speed and accuracy of the analysis. The algorithm undergoes a training phase with a dataset curated explicitly for this purpose, encompassing a diverse array of spalling instances captured in the images. This training is vital for the algorithm to develop the ability to identify spalling patterns in new images reliably.
After the training phase, the algorithm is utilized to detect spalling on the photographed road surfaces. The deployment of this advanced deep learning algorithm substantially improves upon conventional manual methods, significantly reducing the time for detection while ensuring high accuracy levels. Additionally, the study focuses on calculating the areas affected by spalling through a meticulous area extraction process. This step is critical for accurately assessing the extent of the damage, forming the basis for the subsequent repair procedures.
Conclusively, based on the algorithmically processed data, the study determines the precise repair areas and the requisite quantities of materials for each identified spalling instance. This determination is fundamental in ensuring that the repair work is efficient and precisely tailored, addressing the specific requirements of each identified defect in the pavement and optimizing the use of repair materials (specifically, the existing pavement material, which is Portland cement) to achieve the best possible outcomes.

2.1. Dataset Formation

For the indoor analysis of road pavement condition photographs captured without traffic control, a line scan camera, specifically the Piranha4 from Envision, was utilized to photograph the highway pavement condition. The camera was installed at a height of 2 m in the rear of a van owned by Road Korea (http://www.roadkorea.co.kr, accessed on 1 November 2023), as shown in Figure 2. The comprehensive survey spanned from 2 October 2021 to 14 February 2023. During this period, the van equipped with the line scan camera traversed 22 different routes across South Korea, covering significant highways and arterial roads in regions including, but not limited to, Jungang, Gyeongbu, Yeongdong, Honam, and Seohaean. The vehicle is outfitted with a line scan camera and operates within a speed range of 60 to 80 km/h during surveying activities. This speed range was chosen to strike an optimal balance between two critical factors: ensuring the clarity and precision of the images captured and minimizing any disruption to regular traffic flow. At these velocities, the line scan camera was capable of capturing detailed images of the road pavement conditions over an area measuring 4.1 m in width and 10 m in length, as shown in Figure 3. The vehicle’s speed and the camera’s positioning were calibrated to capture a wide expanse of the pavement without necessitating any road closures or significant traffic control measures, thereby facilitating a seamless integration into regular traffic conditions while gathering extensive and valuable pavement condition data.

2.2. Training Dataset

The deep learning algorithm employed for detecting spalling is structured into two main phases: data preprocessing and the creation of training data. The initial step involves addressing the challenge of using large images for training. Utilizing large images directly, without resizing, significantly increases the computational burden, leading to increased GPU memory usage and extended learning times [37]. A strategic approach was taken to circumvent this issue. Selected sections of images containing spalling were cropped to a resolution of 640 × 480 pixels. This size was chosen to maintain a balance between image detail and computational efficiency. These resized images then served as the training data for the deep learning algorithm, which was initially untrained. A part of the training data preparation involved manual annotation, executed using Roboflow, a web-based tool designed for training data creation, as shown in the purple area of Figure 4. This process entailed manually marking the areas of spalling within the images. Such supervised learning, where specific features in the data are annotated, is essential for the algorithm to learn object features effectively. Annotated training is superior to unannotated methods, as it significantly enhances the accuracy of the learning process, as per reference [38]. After the annotation, the data were divided into training and validation sets at a ratio of 80:20. This particular ratio represents the standard practice in machine learning, providing a balance between learning patterns (training) and evaluating the model’s performance (validation) [39]. Such a division is crucial for preventing overfitting, where a model becomes too tailored to the training data and performs poorly on new, unseen data. It also enhances the generalization capabilities of the model, ensuring that it learns sufficiently and effectively. The 80:20 split is renowned for its effectiveness in boosting the precision and robustness of the learning algorithm, making it a popular choice in the field [40].

2.3. Spalling Detection

In this study, Mask R-CNN (Detectron2 0.6), an advanced form of Fast R-CNN capable of extracting object features from images or videos for classification and even enabling segmentation at the pixel level, was employed [41]. Traditional Fast R-CNN operates by converting samples through convolutional layers into a feature map, then applying region of interest (RoI) pooling to create a fixed-size feature vector [42]. RoI designates areas of interest within an image, representing regions where an object is anticipated to exist. Pooling is a crucial component of CNN, primarily reducing the dimensions of an image while retaining essential information [43]; however, Fast R-CNN’s RoI pooling, which includes arbitrarily transforming the image to generate a fixed-size output, leads to a loss of precise object location information [44]. In order to overcome this issue, Mask R-CNN introduces a technique called RoIAlign, which interpolates values between pixels instead of arbitrarily transforming the image, allowing for more accurate object location recognition [45]. In addition, Mask R-CNN can create a separate segmentation mask to extract an object’s exact shape and area [46], as illustrated in Figure 5, where it takes an image input to detect objects and generates classification and segmentation masks for those objects. The mask, a binarized image relative to the original, marks the area corresponding to a specific object [47], accurately representing the object’s position and shape within the image. A key component of Mask R-CNN is the region proposal network (RPN) [48]. RPN is a network that proposes regions within an image where an object might exist, placing anchor boxes of various sizes and ratios on the image and evaluating how well each anchor box matches an object [49]. Anchor boxes, fixed shapes of various sizes and ratios, serve as criteria for determining the likelihood of an object’s presence at a specific location in the image. A sliding window method is also applied across the entire image at regular intervals, evaluating anchor boxes at each position and proposing regions likely to contain objects through objectness scores and location regression [50]. Accurate region proposal is a critical step in enhancing object detection performance, especially for small objects. These advantages contribute to the high performance of Mask R-CNN in detecting damage, such as cracks and spalling within images [51]. For these reasons, the Mask R-CNN algorithm was employed in this study. The training was conducted using datasets generated through Roboflow to train the Mask R-CNN algorithm. Moreover, the training was set to have 1500 epochs and a batch size of 16 to train the Mask R-CNN algorithm effectively.

2.4. Determining Spalling Repair Area and the Amount of Repair Material

Traditional spalling repair processes are conducted on-site by workers, consuming significant time, and the calculation results may vary depending on the worker performing the calculations or even the same worker’s condition. These drawbacks undermine the efficiency and accuracy of the repair work. This study utilized a proprietary repair area and material quantity calculation program to overcome these challenges and quickly determine accurate repair areas and material quantities. The calculation program estimates the repair area and material quantity based on the length and width of the spalling area calculated through Mask R-CNN, as shown in Figure 6. The formulas used in the calculation program for the repair area and material quantity are based on the standards of the Federal Highway Administration (FHWA) of the United States Department of Transportation (USDoT), as shown in Table 1 [52]. This approach was adopted to ensure adherence to internationally recognized guidelines and provide consistency with established global practices in spalling repair. Furthermore, these standards can be adapted to fit the specific criteria of the country where they are being applied. The program visualizes the spalling area data on one side, automatically calculates the repair areas according to the FHWA repair area standards, and considers the calculated repair area. The FHWA standards specify only the minimum repair area, as the minimum size is essential to ensure adequate repair. In contrast, a maximum repair area is not defined by the FHWA standards, acknowledging that the extent of the maximum repair should be flexible and determined based on the specific conditions of each site [52]. Additionally, areas less than 150 mm in length or 40 mm in width are not subjected to partial depth repair but are instead filled with a sealant [52]. Calculating the repair material quantities involves considering variables, such as road pavement thickness, material loss, and irregular cutting, during the repair process. This enables the determination of the material quantity necessary for the determined repair volume to be equivalent to the cutting quantity, as the amount of repair material needed is used to fill the volume removed by cutting. This approach ensures that the repair material, equivalent to the volume of the material removed, fills the removed area, restoring the pavement to its original condition. Automating the process eliminates potential errors, saves time, and provides consistent and reliable results.
Two statistical methods, such as the root mean square error (RMSE) and Pearson correlation coefficient (PCC), were used to validate the calculation accuracy of the proposed method. RMSE is the square root of the mean of the squared differences between the predicted and actual values, using the square of the error to give more weight to more significant errors, thereby accurately measuring the size of prediction errors, with results closer to 0 indicating a higher prediction accuracy [53]. This study used RMSE to measure the difference between the actual and calculated repair areas directly. Conversely, PCC measures the strength of the linear relationship between two variables, with results closer to 1 indicating a strong linear relationship and high prediction accuracy. Additionally, the strength of the relationship does not change even if the values of the two variables increase or decrease by a constant amount. This characteristic is advantageous when analyzing data of different sizes [54]. In this study, PCC was used to evaluate the linear relationship between the actual repair area and the calculated repair area. The equations used for the RMSE and PCC are as follows:
R M S E = 1 n y t r u e y p r e d 2 ,
where n is the total number of spalling incidents, y t r u e is the actual repair area, and y p r e d is the calculated repair area.
P C C = i n ( y t r u e y ¯ t r u e ) ( y p r e d y ¯ p r e d ) i n ( y t r u e i y ¯ t r u e ) 2 i n ( y p r e d i y ¯ p r e d ) 2 ,
where y ¯ t r u e is the mean of the actual repair area, and y ¯ p r e d is the mean of the calculated repair area.

3. Results and Discussion

In this study, a line scan camera mounted on the rear of a vehicle was used to collect 7834 images from 22 different highway routes across South Korea. After filtering out images of nonconcrete pavements and considering the lower-than-expected frequency of spalling, 513 images containing spalling were selected. Of these, 400 were used to create the training dataset for the Mask R-CNN algorithm, and 83 were set aside for validation. For the test of the trained Mask R-CNN, a total of 30 selected images of road pavement conditions were used for spalling detection and area calculation, as shown in Figure 7. Each detected spalling is presented along with the probability of the object being classified as spalling. However, a performance limitation was identified, as only 10 out of 44 spalling instances within the 30 images were detected, failing to detect nearly all the spalling present. Despite this detection limitation, masks were created to determine each pixel corresponding to spalling. The 10 detected spalling areas within the images were accurately separated, and their areas were calculated through these masks. Mask R-CNN was utilized to detect spalling within road images with high accuracy, and segmentation masks were used to calculate the spalling area. The calculated length and width of spalling in pixel values were converted into actual meters, considering the image resolution. These converted data were then input into the developed program to calculate and compare the repair area for the corresponding spalling area. The minimum repair area was determined using the FHWA guidelines, and the maximum repair area was calculated by adding 0.15 m to both the length and width of the field data received. These calculations and comparisons are detailed in Table 2 and Figure 8.
The RMSE and PCC calculation results show an RMSE of 0.0137 and 0.0167 (both close to 0) and a PCC of 0.987 and 0.992 (both close to 1) for the maximum and minimum repair areas, respectively. Therefore, the calculation values obtained through the proposed method were nearly identical to the actual repair area values calculated on-site, according to the RMSE and PCC. Subsequently, the minimum and maximum repair volumes were calculated based on the calculated repair areas, considering the FHWA standard, which involves cutting a volume equivalent to one-third of the actual road pavement thickness, noted as 0.2 m (with a minimum depth of 0.05 m). Furthermore, an arbitrary 4% loss was included in the calculation to account for potential material inefficiencies during the repair process (Table 3). These losses during repair work are often detailed and multifaceted, including material spillage during mixing and transportation, loss of fine particles to the air during the blending process, cement or concrete adhering to the sides of mixing containers, and inefficiencies in applying the material to the repair site. These calculations ensure the minimum and maximum repair material (Portland cement) quantities are accurately determined, equivalent to the cutting volume, while factoring in the standard cutting depth and the estimated material loss.
The ability to achieve calculations similar to the actual repair area by using the method proposed in this study is a significant step toward enhancing the efficiency and accuracy of road repair operations. This method eliminates labor-intensive and time-consuming processes and road closures for spalling detection, on-site repair area, and material calculations. Despite these advancements, efforts were made to adhere to the central limit theorem for statistical reliability. However, several challenges were encountered that impacted the study’s outcomes. The current Mask R-CNN algorithm is limited to detecting only 10 out of 44 spalling incidents, which underscores the necessity for further refinement. This includes increasing the quantity and quality of the training data, altering training conditions, and adapting to evolving deep learning algorithms, as well as securing and validating additional field data. The quality of the training dataset presented significant limitations, with an insufficient number of data points and a lack of diversity in the data types and conditions. This affected the robustness of the training process and limited the learning scope of the algorithm, particularly in varying spalling patterns and roadway conditions. The performance of Mask R-CNN in detecting spalling faced inherent limitations due to these deficiencies in the training dataset, hindering its ability to accurately detect and categorize spalling instances in diverse scenarios. The scarcity of available field data limited the algorithm’s practical applicability and accuracy, as it may not have fully represented the variety of spalling damages typically encountered on roads. Furthermore, difficulties were encountered in obtaining actual field measurement data, and the number of data points acquired was also limited. These challenges further constrained the algorithm’s ability to generalize and perform accurately across diverse real-world scenarios.
In order to address the issues identified in this study, it is essential to refine the deep learning algorithm for spalling detection and area calculation. This refinement process includes increasing the quantity and quality of training data, altering training conditions, and adapting to rapidly evolving state-of-the-art deep learning algorithms. The precise tuning of the calculation program is also necessary, along with obtaining and validating more field data. Such efforts will be crucial for enhancing the accuracy of spalling detection and overcoming errors due to calculation inconsistencies in the field. Moreover, refining the method of calculating the repair area and material quantity can further overcome these errors.

4. Conclusions

In this study, previous research that was limited to spalling detection was expanded, and a method for calculating the repair area of spalling and the amount of material required for repair is proposed. The main results of this study are as follows:
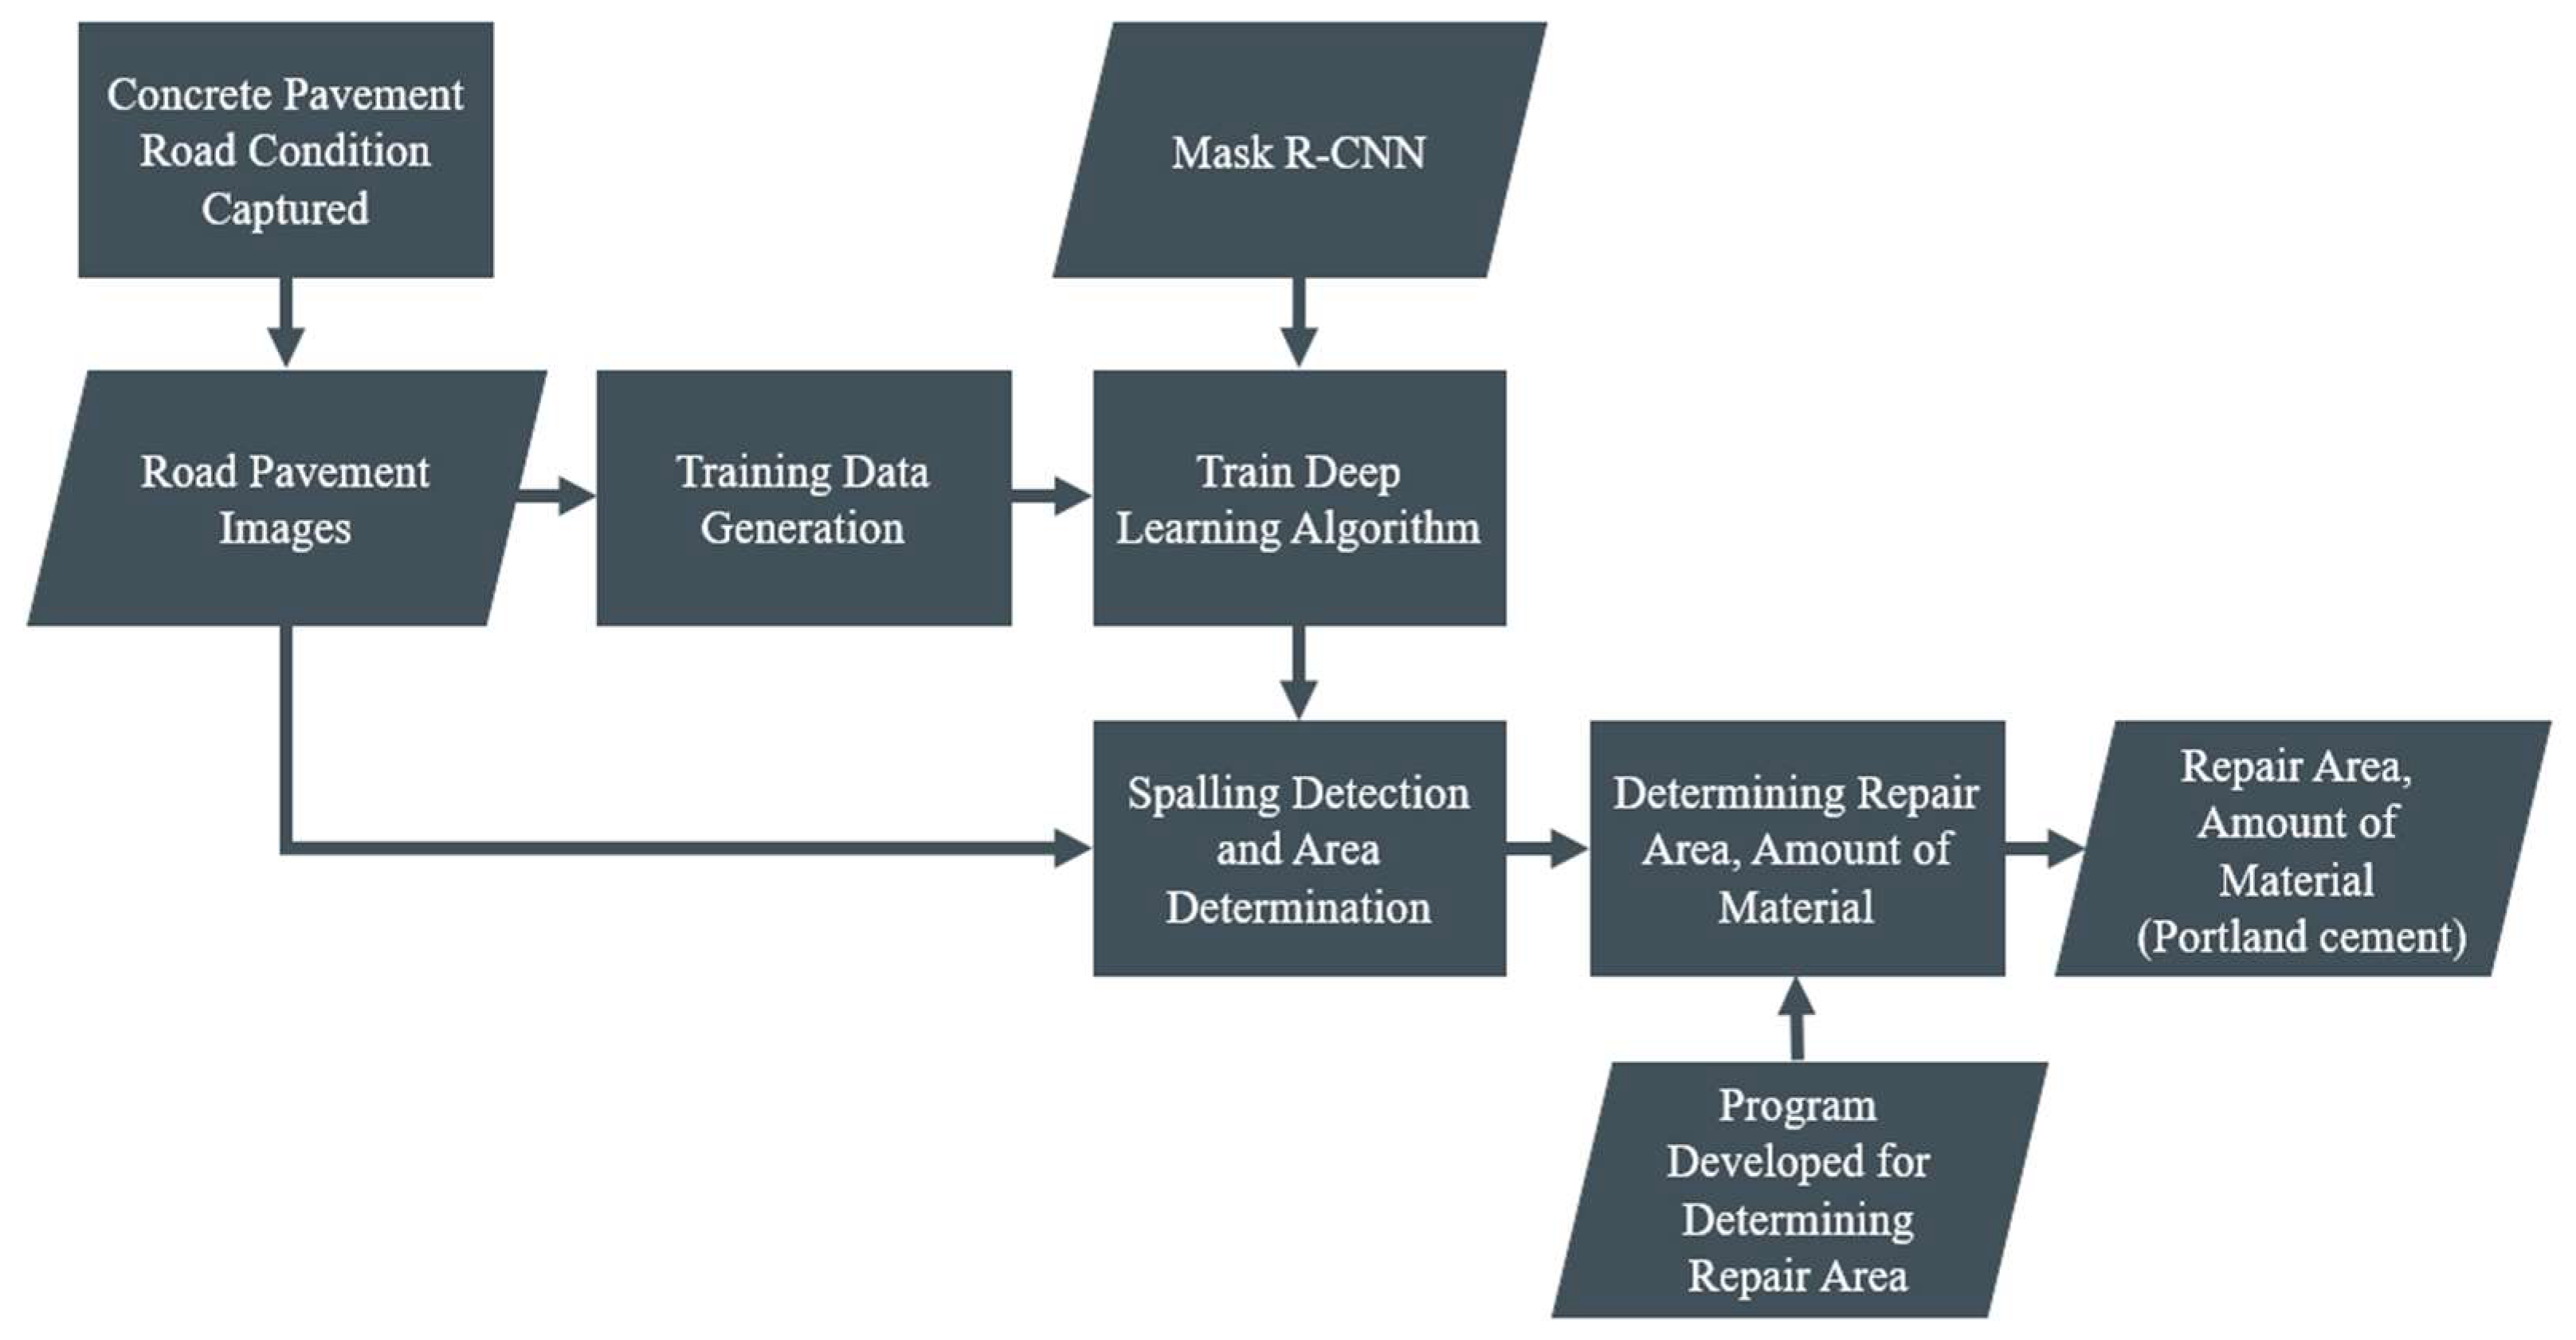
  • A line scan camera was utilized to capture the state of road pavements, enabling the analysis of its conditions in an indoor environment without road closures on-site.
  • The time-intensive process of spalling detection and repair area calculation, which was previously performed by human workers, has been replaced with Mask R-CNN, enabling the analysis of road conditions for spalling detection and area calculation to be conducted using less manpower.
  • A self-developed calculation program based on the spalling repair area calculation standards of the FHWA that automatically calculates spalling area and material quantity was utilized, enabling more consistent and faster calculations based on the same standard.
  • The effectiveness of the proposed method was validated by showing that the obtained spalling repair area values were very close to the actual repair area values calculated by workers, as confirmed by RMSE and PCC.
The method proposed in this study provides an essential foundation for the repair of spalling in concrete pavement roads, and it is anticipated that it will further enhance the efficiency and accuracy of effective spalling repair. By reducing the time consumed in repair operations, this approach significantly shortens the duration of traffic control and ensures precise calculations of material requirements. These improvements are expected to lead to reductions in carbon dioxide emissions from the production of repair materials and the lower consumption of resources and energy, establishing a new method for sustainable technology in road maintenance. Future research will focus on collecting data on more diverse road situations and enhancing detection performance through the refinement of the spalling detection algorithm, as well as applying it to various road situations to reduce area calculation errors.

Author Contributions

Conceptualization, J.Y.; methodology, J.K.; software, J.C.; validation, J.K.; formal analysis, Y.S.; investigation, J.Y.; resources, J.C. and S.L.; data curation, J.C. and S.L.; writing—original draft preparation, J.C.; writing—review and editing, J.K.; visualization, Y.S.; supervision, J.Y.; project administration, J.Y.; funding acquisition, J.Y. All authors have read and agreed to the published version of the manuscript.

Funding

This work was supported by the Institute of Information & Communications Technology Planning & Evaluation (IITP) grant funded by the Korean government (MSIT) (No. 2022-0-00033, Development of a bridge structure status evaluation technology using ICT-based complex sensing NDT Scanning technology).

Institutional Review Board Statement

Not applicable.

Informed Consent Statement

Not applicable.

Data Availability Statement

The data supporting the findings from this study are available on request from the authors.

Acknowledgments

This research was conducted with the technical support of Road Korea, based in Hwaseong, Gyeonggi-do, Republic of Korea.

Conflicts of Interest

The authors declare no conflict of interest.

References

  1. Wilde, W.J.; Waalkes, S.; Harrison, R. Life Cycle Cost Analysis of Portland Cement Concrete Pavements; Center for Transportation Research, University of Texas at Austin: Austin, TX, USA, 1999. [Google Scholar]
  2. Gates, T.J.; Hawkins, H.G.; Rose, E.R. Effective Pavement Marking Materials and Applications for Portland Cement Concrete Roadways; Texas Transportation Institute, Texas A & M University System: College Station, TX, USA, 2003. [Google Scholar]
  3. Li, J.; Zhang, W.; Cao, Y. Laboratory evaluation of magnesium phosphate cement paste and mortar for rapid repair of cement concrete pavement. Constr. Build. Mater. 2014, 58, 122–128. [Google Scholar] [CrossRef]
  4. Jiang, C.; Gu, X.; Huang, Q.; Zhang, W. Carbonation depth predictions in concrete bridges under changing climate conditions and increasing traffic loads. Cem. Concr. Compos. 2018, 93, 140–154. [Google Scholar] [CrossRef]
  5. Ismail, Z.-A.B. Thermal comfort practices for precast concrete building construction projects: Towards BIM and IOT integration. Engineering, Constr. Archit. Manag. 2022, 29, 1504–1521. [Google Scholar] [CrossRef]
  6. Rollings, R.S. Joint spalling in newly constructed concrete pavements. J. Perform. Constr. Facil. 1998, 12, 137–144. [Google Scholar] [CrossRef]
  7. Asamoto, S.; Sato, J.; Okazaki, S.; Chun, P.-j.; Sahamitmongkol, R.; Nguyen, G.H. The Cover Depth Effect on Corrosion-Induced Deterioration of Reinforced Concrete Focusing on Water Penetration: Field Survey and Laboratory Study. Materials 2021, 14, 3478. [Google Scholar] [CrossRef] [PubMed]
  8. Nguyen, T.; Lechner, B.; Wong, Y.D. Response-based methods to measure road surface irregularity: A state-of-the-art review. Eur. Transp. Res. Rev. 2019, 11, 43. [Google Scholar] [CrossRef]
  9. Ong, G.P.; Fwa, T. Wet-pavement hydroplaning risk and skid resistance: Modeling. J. Transp. Eng. 2007, 133, 590–598. [Google Scholar] [CrossRef]
  10. Kliethermes, J.C. Repair of spalling bridge decks. In Proceedings of the 51st Annual Meeting of the Highway Research Board, Washington, DC, USA, 17–21 January 1972. [Google Scholar]
  11. Yeon, J.; Kang, J.; Yan, W. Spall damage repair using 3D printing technology. Autom. Constr. 2018, 89, 266–274. [Google Scholar] [CrossRef]
  12. Chen, D.-H.; Lin, H.-H.; Sun, R. Field performance evaluations of partial-depth repairs. Constr. Build. Mater. 2011, 25, 1369–1378. [Google Scholar] [CrossRef]
  13. Russell, H.G. Adjacent Precast Concrete Box Beam Bridges: Connection Details; Transportation Research Board: Washington, DC, USA, 2009; Volume 393. [Google Scholar]
  14. Dekker, R.; Plasmeijer, R.P.; Swart, J.H. Evaluation of a new maintenance concept for the preservation of highways. IMA J. Manag. Math. 1998, 9, 109–156. [Google Scholar] [CrossRef]
  15. Yang, F.; Zhang, L.; Yu, S.; Prokhorov, D.; Mei, X.; Ling, H. Feature pyramid and hierarchical boosting network for pavement crack detection. IEEE Trans. Intell. Transp. Syst. 2019, 21, 1525–1535. [Google Scholar] [CrossRef]
  16. De Brito, J.; Branco, F.; Thoft-Christensen, P.; Sørensen, J.D. An expert system for concrete bridge management. Eng. Struct. 1997, 19, 519–526. [Google Scholar] [CrossRef]
  17. Jumaat, M.Z.; Kabir, M.; Obaydullah, M. A review of the repair of reinforced concrete beams. J. Appl. Sci. Res. 2006, 2, 317–326. [Google Scholar]
  18. Rasmussen, J. Human errors. A taxonomy for describing human malfunction in industrial installations. J. Occup. Accid. 1982, 4, 311–333. [Google Scholar] [CrossRef]
  19. Lea, F.C.; Middleton, C. Reliability of Visual Inspection of Highway Bridges; Department of Engineering, University of Cambridge: Cambridge, UK, 2002. [Google Scholar]
  20. Kee, S.-H.; Gucunski, N. Interpretation of flexural vibration modes from impact-echo testing. J. Infrastruct. Syst. 2016, 22, 04016009. [Google Scholar] [CrossRef]
  21. Dry, C. Three designs for the internal release of sealants, adhesives, and waterproofing chemicals into concrete to reduce permeability. Cem. Concr. Res. 2000, 30, 1969–1977. [Google Scholar] [CrossRef]
  22. Assaf, S.A.; Al-Hejji, S. Causes of delay in large construction projects. Int. J. Proj. Manag. 2006, 24, 349–357. [Google Scholar] [CrossRef]
  23. Polder, R.; Peelen, W.; Courage, W. Non-traditional assessment and maintenance methods for aging concrete structures–technical and non-technical issues. Mater. Corros. 2012, 63, 1147–1153. [Google Scholar] [CrossRef]
  24. Long, N.D.; Ogunlana, S.; Quang, T.; Lam, K.C. Large construction projects in developing countries: A case study from Vietnam. Int. J. Proj. Manag. 2004, 22, 553–561. [Google Scholar] [CrossRef]
  25. Samal, S.R.; Mohanty, M.; Santhakumar, S.M. Adverse effect of congestion on economy, health and environment under mixed traffic scenario. Transp. Dev. Econ. 2021, 7, 15. [Google Scholar] [CrossRef]
  26. Retallack, A.E.; Ostendorf, B. Current understanding of the effects of congestion on traffic accidents. Int. J. Environ. Res. Public Health 2019, 16, 3400. [Google Scholar] [CrossRef] [PubMed]
  27. Kaliba, C.; Muya, M.; Mumba, K. Cost escalation and schedule delays in road construction projects in Zambia. Int. J. Proj. Manag. 2009, 27, 522–531. [Google Scholar] [CrossRef]
  28. Grădinaru, C.M.; Muntean, R.; Șerbănoiu, A.A.; Ciocan, V.; Burlacu, A. Sustainable development of human society in terms of natural depleting resources preservation using natural renewable raw materials in a novel ecological material production. Sustainability 2020, 12, 2651. [Google Scholar] [CrossRef]
  29. Hasanbeigi, A.; Morrow, W.; Masanet, E.; Sathaye, J.; Xu, T. Energy efficiency improvement and CO2 emission reduction opportunities in the cement industry in China. Energy Policy 2013, 57, 287–297. [Google Scholar] [CrossRef]
  30. France-Mensah, J.; O’Brien, W.J. Developing a sustainable pavement management plan: Tradeoffs in road condition, user costs, and greenhouse gas emissions. J. Manag. Eng. 2019, 35, 04019005. [Google Scholar] [CrossRef]
  31. Wu, W.; Qurishee, M.A.; Owino, J.; Fomunung, I.; Onyango, M.; Atolagbe, B. Coupling deep learning and UAV for infrastructure condition assessment automation. In Proceedings of the 2018 IEEE International Smart Cities Conference (ISC2), Kansas City, MO, USA, 16–19 September 2018. [Google Scholar] [CrossRef]
  32. Dorafshan, S.; Thomas, R.J.; Maguire, M. Comparison of deep convolutional neural networks and edge detectors for image-based crack detection in concrete. Constr. Build. Mater. 2018, 186, 1031–1045. [Google Scholar] [CrossRef]
  33. Fang, Y.; Zhang, C.; Huang, C.; Liu, L.; Yang, Y. Phishing email detection using improved RCNN model with multilevel vectors and attention mechanism. IEEE Access 2019, 7, 56329–56340. [Google Scholar] [CrossRef]
  34. Ullah, A.; Xie, H.; Farooq, M.O.; Sun, Z. Pedestrian detection in infrared images using fast RCNN. In Proceedings of the 2018 Eighth International Conference on Image Processing Theory, Tools and Applications (IPTA), Xi’an, China, 7–10 November 2018; pp. 1–6. [Google Scholar] [CrossRef]
  35. Kumar, P.; Sharma, A.; Kota, S.R. Automatic multiclass instance segmentation of concrete damage using deep learning model. IEEE Access 2021, 9, 90330–90345. [Google Scholar] [CrossRef]
  36. Mandal, V.; Uong, L.; Adu-Gyamfi, Y. Automated road crack detection using deep convolutional neural networks. In Proceedings of the 2018 IEEE International Conference on Big Data (Big Data), Seattle, WA, USA, 10–13 December 2018; pp. 5212–5215. [Google Scholar] [CrossRef]
  37. Chitta, K.; Álvarez, J.M.; Haussmann, E.; Farabet, C. Training data subset search with ensemble active learning. IEEE Trans. Intell. Transp. Syst. 2021, 23, 14741–14752. [Google Scholar] [CrossRef]
  38. Li, G.; Xie, Y.; Lin, L. Weakly supervised salient object detection using image labels. In Proceedings of the AAAI Conference on Artificial Intelligence, New Orleans, LA, USA, 2–7 February 2018. [Google Scholar] [CrossRef]
  39. Xu, Y.; Goodacre, R. On splitting training and validation set: A comparative study of cross-validation, bootstrap and systematic sampling for estimating the generalization performance of supervised learning. J. Anal. Test. 2018, 2, 249–262. [Google Scholar] [CrossRef]
  40. Jiao, L.; Dong, S.; Zhang, S.; Xie, C.; Wang, H. AF-RCNN: An anchor-free convolutional neural network for multi-categories agricultural pest detection. Comput. Electron. Agric. 2020, 174, 105522. [Google Scholar] [CrossRef]
  41. Chiao, J.-Y.; Chen, K.-Y.; Liao, K.Y.-K.; Hsieh, P.-H.; Zhang, G.; Huang, T.-C. Detection and classification the breast tumors using mask R-CNN on sonograms. Medicine 2019, 98, e15200. [Google Scholar] [CrossRef] [PubMed]
  42. Girshick, R. Fast r-cnn. In Proceedings of the IEEE International Conference on Computer Vision, Santiago, Chile, 11–18 December 2015; pp. 1440–1448. [Google Scholar] [CrossRef]
  43. Sumida, I.; Magome, T.; Kitamori, H.; Das, I.J.; Yamaguchi, H.; Kizaki, H.; Aboshi, K.; Yamashita, K.; Yamada, Y.; Seo, Y. Deep convolutional neural network for reduction of contrast-enhanced region on CT images. J. Radiat. Res. 2019, 60, 586–594. [Google Scholar] [CrossRef] [PubMed]
  44. Su, H.; Wei, S.; Yan, M.; Wang, C.; Shi, J.; Zhang, X. Object detection and instance segmentation in remote sensing imagery based on precise mask R-CNN. In Proceedings of the IGARSS 2019-2019 IEEE International Geoscience and Remote Sensing Symposium, Yokohama, Japan, 28 July–2 August 2019; pp. 1454–1457. [Google Scholar] [CrossRef]
  45. Gao, X.; Chen, L.; Wang, K.; Xiong, X.; Wang, H.; Li, Y. Improved Traffic Sign Detection Algorithm Based on Faster R-CNN. Appl. Sci. 2022, 12, 8948. [Google Scholar] [CrossRef]
  46. He, K.; Gkioxari, G.; Dollár, P.; Girshick, R. Mask r-cnn. In Proceedings of the IEEE International Conference on Computer Vision, Venice, Italy, 22–29 October 2017; pp. 2961–2969. [Google Scholar] [CrossRef]
  47. Dey, B.; Goswami, D.; Halder, S.; Khalil, K.; Leray, P.; Bayoumi, M.A. Deep Learning-Based Defect Classification and Detection in SEM Images, Metrology, Inspection, and Process Control XXXVI, 2022; SPIE: Washington, DC, USA, 2022; p. PC120530Y. [Google Scholar] [CrossRef]
  48. Xu, X.; Zhao, M.; Shi, P.; Ren, R.; He, X.; Wei, X.; Yang, H. Crack detection and comparison study based on faster R-CNN and mask R-CNN. Sensors 2022, 22, 1215. [Google Scholar] [CrossRef] [PubMed]
  49. Jia, W.; Tian, Y.; Luo, R.; Zhang, Z.; Lian, J.; Zheng, Y. Detection and segmentation of overlapped fruits based on optimized mask R-CNN application in apple harvesting robot. Comput. Electron. Agric. 2020, 172, 105380. [Google Scholar] [CrossRef]
  50. Bharati, P.; Pramanik, A. Deep Learning Techniques—R-CNN to Mask R-CNN: A Survey. In Computational Intelligence in Pattern Recognition: Proceedings of CIPR 2019; Springer: Berlin/Heidelberg, Germany, 2020; pp. 657–668. [Google Scholar] [CrossRef]
  51. Attard, L.; Debono, C.J.; Valentino, G.; Di Castro, M.; Masi, A.; Scibile, L. Automatic crack detection using mask R-CNN. In Proceedings of the 2019 11th International Symposium on Image and Signal Processing and Analysis (ISPA), Dubrovnik, Croatia, 23–25 September 2019; pp. 152–157. [Google Scholar] [CrossRef]
  52. Wilson, T.P.; Romine, A.; Smith, K. Materials and Procedures for Rapid Repair of Partial-Depth Spalls in Concrete Pavements: Manual of Practice; Department of Transportation, Federal Highway Administration: Washington, DC, USA, 2000.
  53. Willmott, C.J.; Matsuura, K. Advantages of the mean absolute error (MAE) over the root mean square error (RMSE) in assessing average model performance. Clim. Res. 2005, 30, 79–82. [Google Scholar] [CrossRef]
  54. Cohen, I.; Huang, Y.; Chen, J.; Benesty, J. Pearson correlation coefficient. Noise Reduct. Speech Process. 2009, 1–4. [Google Scholar] [CrossRef]
Figure 1. Proposed research framework.
Sustainability 16 00112 g001
Figure 2. (a) Representation of a vehicle equipped with a line scan camera (image accessed from http://www.roadkorea.co.kr on 27 October 2023); (b) actual photograph of the vehicle on site.
Sustainability 16 00112 g002
Figure 3. Photograph of the road pavement.
Sustainability 16 00112 g003
Figure 4. Sample image annotation.
Sustainability 16 00112 g004
Figure 5. The overview of Mask R-CNN.
Sustainability 16 00112 g005
Figure 6. The overview of the developed program.
Sustainability 16 00112 g006
Figure 7. Partial results of Mask R-CNN detection.
Sustainability 16 00112 g007
Figure 8. (a) Comparison of minimum spalling repair area; (b) comparison of maximum spalling repair area.
Sustainability 16 00112 g008
Table 1. Minimum dimensions of spalling repair area.
Location of SpallingMinimum Dimensions of Repair Area
Depth (m)Length/Height (m)Width (m)
At one joint0.050.25 or length of spalled area
+ 0.1
Whichever is greater
0.1 or width of spalled area
+ 0.05
Whichever is greater
At two joints0.050.2 or length of spalled area
+ 0.05
Whichever is greater
0.1 or width of spalled area
+ 0.05
Whichever is greater
Away from joints0.050.25 or length of spalled area
+ 0.1
Whichever is greater
0.14 or width of spalled area
+ 0.1
Whichever is greater
Table 2. Spalling repair area comparison.
Actual Min. Spalling Repair Area (m2)Actual Max. Spalling Repair Area (m2)Program Min. Spalling Repair Area (m2)Program Max. Spalling Repair Area (m2)
0.0537950.1040150.052150.0957
0.228270.35310.2077740.329574
0.042390.088920.0441480.085248
0.1872240.2888340.1642260.260626
0.0793730.1409330.0752960.130946
0.0919240.1598740.0750880.137088
0.1893120.2917320.1764480.282948
0.08820.149760.1073160.165466
0.0569220.1097520.0483630.093613
0.0460460.0932960.0413850.080835
Table 3. The determined amount of spalling repair material.
Min. Spalling Repair Material (m3)Max. Spalling Repair Material (m3)
0.0035110.006444
0.013990.022191
0.0029730.00574
0.0110580.017549
0.005070.008817
0.0050560.009231
0.0118810.019052
0.0072260.011141
0.0032560.006303
0.0027870.005443
Disclaimer/Publisher’s Note: The statements, opinions and data contained in all publications are solely those of the individual author(s) and contributor(s) and not of MDPI and/or the editor(s). MDPI and/or the editor(s) disclaim responsibility for any injury to people or property resulting from any ideas, methods, instructions or products referred to in the content.

