Article

Co-Benefits Analysis of Coal De-Capacity in China

1
School of Marxism, China University of Mining and Technology (Beijing), Beijing 100083, China
2
College of Geoscience and Surveying Engineering, China University of Mining and Technology (Beijing), Beijing 100083, China
3
Institute of Geographic Sciences and Natural Resources Research, Chinese Academy of Sciences, Beijing 100101, China
*
Author to whom correspondence should be addressed.
These authors contributed equally to this work.
Sustainability 2024, 16(1), 115; https://doi.org/10.3390/su16010115
Submission received: 7 November 2023 / Revised: 3 December 2023 / Accepted: 18 December 2023 / Published: 21 December 2023

Abstract

:
China is the world’s largest carbon emitter and coal de-capacity is a policy with immediate and substantial CO2 reduction effects. However, the carbon emission reduction and health co-benefits arising from the coal de-capacity are often ignored. Here, we assessed the carbon emission reductions and quantified the health co-benefits from coal de-capacity based on an analysis of the spatial and temporal distribution characteristics of the mine closures and phase out during 2016–2022. Our findings show that China had closed/phased out a total of 4027 mines with a total de-capacity of 8.75 × 10⁸ t, spatially concentrated in Southwest and North China from 2016 to 2022. The coal life cycle emitted 1859 million t of carbon during the coal de-capacity. Importantly, 11,775 premature deaths were avoided during 2016–2022 due to reduced PM2.5 exposure as a result of coal mining. This study highlights the significant effects of coal de-capacity on carbon reduction and health co-benefits in China and provides scientific evidence and data to support the achievement of the sustainable development goals and the ‘dual carbon goals’.

1. Introduction

The Intergovernmental Panel on Climate Change (IPCC) Sixth Assessment Report suggests that the burning of fossil fuels and inequitable, unsustainable practices of energy and land use have caused global temperatures to be 1.1 °C higher than pre-industrial levels [1]. Specifically, coal, as one of the primary contributors to warming, will prevent the achievement of many of the global sustainable development goals (SDGs) outlined in the 2030 Agenda for Sustainable Development if temperatures are not kept within 1.5 °C [2]. Therefore, there is an urgent need to implement economic/climate policies to promote a shift in the energy consumption mix to phase out coal and other fossil fuels over the next 30 years to further curb the continuous rise in greenhouse gas (GHG) emissions [3,4].
As the foremost global producer and consumer of coal, China was responsible for 50.8% of the world’s production and 53.8% of its consumption in 2021 [5]. The coal-dominant energy consumption structure has led to serious air pollution and public health challenges. In 2021, the emission of sulfur dioxide (SO2), nitrogen oxides (NOx), and particulate matter (PM) in China amounted to 2.478 million t, 9.884 million t, and 5.374 million t, of which 54.4%, 30.62%, and 39.45% were caused by coal combustion, respectively [6]. Additionally, coal mining poses risks to miners’ lives, including threats from methane explosions and fires [7,8]. The development of the coal industry also had many negative impacts on ecosystem functions, including water pollution and wastage [9], biodiversity loss [10], vegetation degradation [11], and soil damage [12].
In response, the Chinese government announced the resolve excess capacity in the coal industry to achieve the ambitious ‘double carbon target’ [13]. However, the withdrawal from coal faces considerable resistance, such as the decline in gross domestic product (GDP) prioritized by local governments and the sunk costs incurred by coal and power companies [14,15,16]. Moreover, the issue of employment for the numerous miners whose livelihoods depend on coal mines also hinders the smooth exit from coal. Despite these challenges, it is an inevitable trend that coal will move from being reduced to being phased out [15]. Therefore, identifying the varied benefits of mine closures is critical as it could facilitate the coal phase out process for both the government and enterprises.
Given that coal is a common source of GHG and atmospheric pollutants, economic or climate mitigation policies aimed at phasing out the obsolete capacity can bring about health synergies from mitigated air pollution (i.e., PM2.5, NOx, and SO2) [17,18,19,20]. Improving air quality alone could herald significant economic benefits by promoting public health [20], potentially offsetting or even exceeding the costs of reducing or avoiding carbon emissions [1]. For example, the expenses of decreasing GHG emissions could be offset by the global health synergies benefits, with the health benefits in India and China approximated to be three to nine times greater than the expenditure of emissions cuts [21]. Hence, accounting for reduced carbon emissions, diminished air pollution, and health co-benefits during the coal phase out process was crucial, as it relates directly to the exit costs and the confidence in its execution [22,23].
Most current research focuses on carbon emissions generated during the coal utilization phase and the comparative studies of carbon emissions under different emission reduction measures (Table 1) [24,25]. For example, several studies have quantified NOx, SO2, PM2.5, and CO2 emissions from thermal power plants [26], steel plants [27], and cement plants [28], indicating at least a 50% reduction in air pollutants under stringent environmental policies and emission standards. Since the initiation of the coal de-capacity policy in 2016, significant backward coal production capacity has been phased out. However, there has been limited scholarly focus on the resulting carbon emission reductions, air pollution mitigation, and associated health co-benefits. Considering the literature on several policy scenarios, we hypothesize that China’s coal de-capacity can bring about notable carbon emission reduction and health co-benefits. Therefore, based on the analysis of the spatial and temporal distribution characteristics of closed/phased out mines during 2016–2022, this study’s objectives were to (1) account for carbon emission reductions from closed/phased out mines during the coal life cycling; and (2) quantify the health co-benefits of closed/phased out mines in the coal mining process, and provide a deep discussion about cross-boundary synergies and tradeoffs from closed/phased out mines. This information will be of positive contribution to the mine closures and energy transition in other coal-dominated countries of the world and will provide a foundation for further research to reveal more SDG synergies and tradeoffs.

2. Materials and Methods

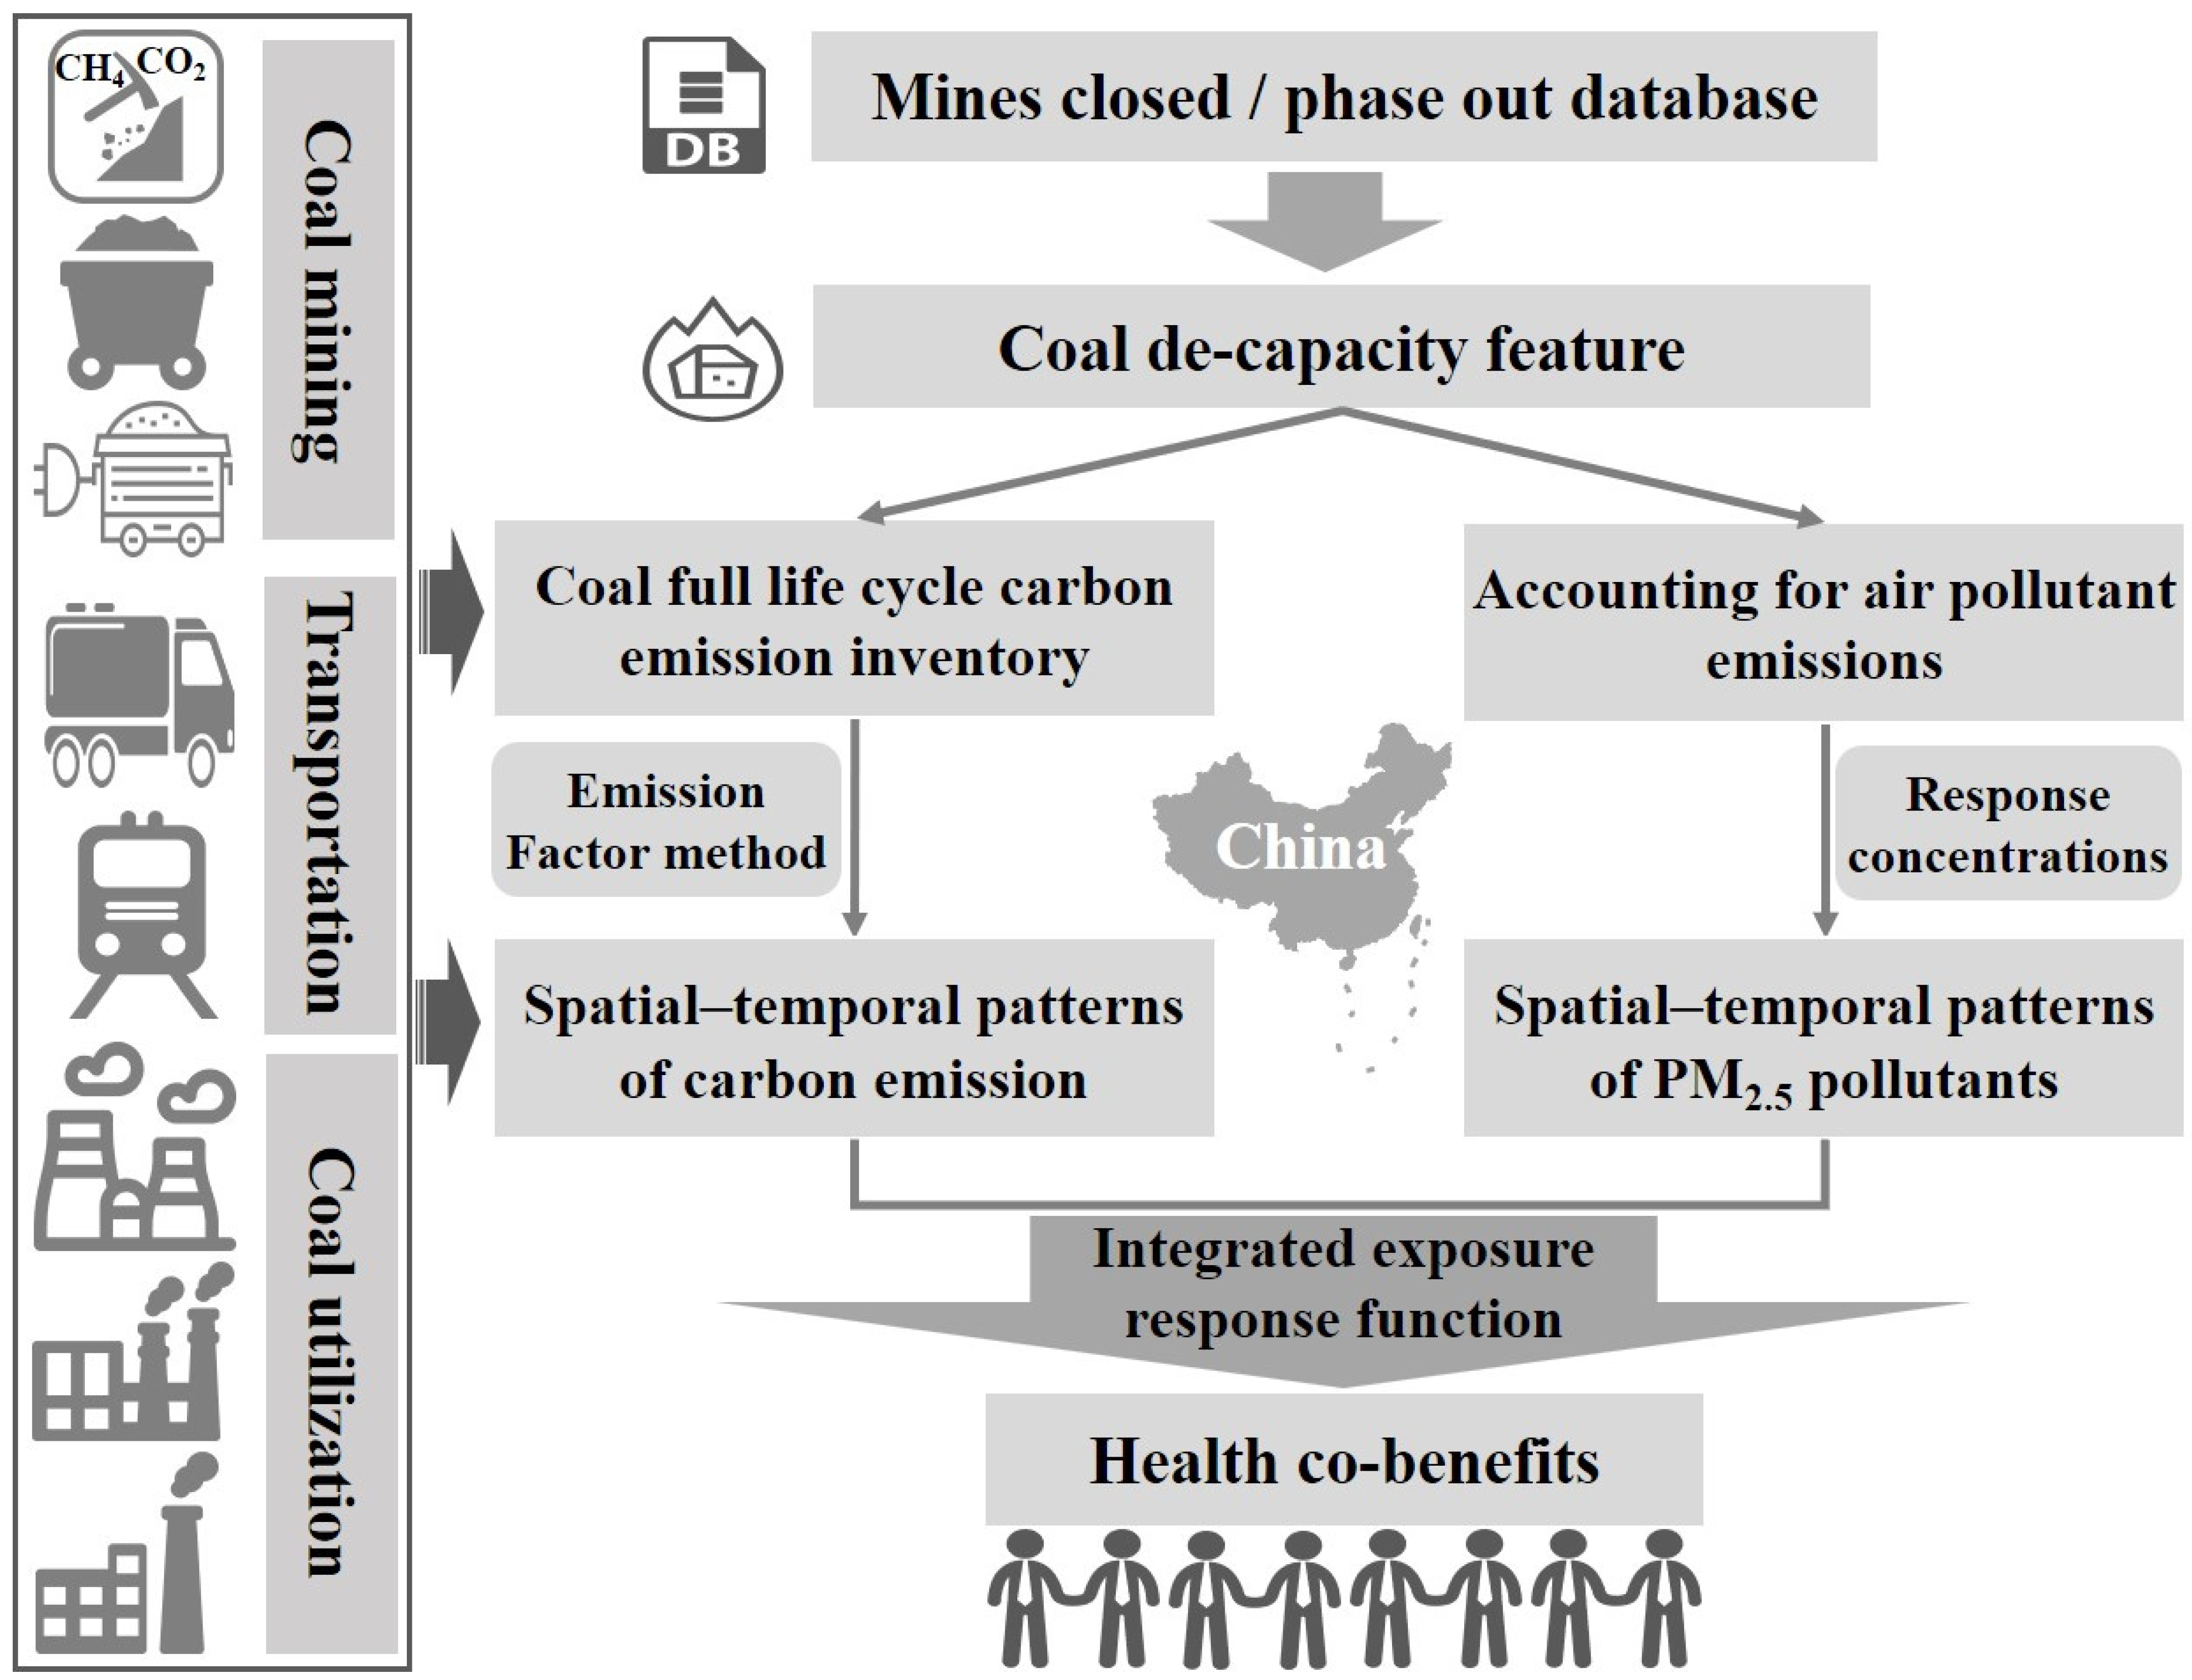
2.1. Overall Framework

Figure 1 presents the workflow of multiple synergistic benefits supported under China’s de-capacity policy. Step 1: Formulate a database for closed or phased out mines, inclusive of geographical location, area, and other details. Step 2: Quantify the reduced capacity of mines across different regions. Step 3: Establish a coal life cycle carbon emission inventory and calculate carbon reduction based on the emission factor method. Step 4: Construct the concentration of air pollutants emitted during the coal extraction process and derive the response concentration ratio at mining points based on environmental air pollution concentration. Step 5: Use the exposure–response function to calculate the number of deaths prevented resulting from a reduction in PM2.5 exposure. Specific information on each of these steps will be described in detail in subsequent sections.

2.2. Accounting for Coal De-Capacity

Firstly, we conducted a search on websites from the National Development and Reform Commission (http://www.ndrc.gov.cn, accessed on 12 February 2023), the National Energy Administration (http://www.nea.gov.cn, accessed on 16 February 2023), and the provincial people’s governments (excluding Hong Kong, Macao, and Taiwan) along with their respective departments in China. We used terms such as “coal capacity removal” or “coal de-capacity” or “decommissioning” or “closed mine” or “phase out mine” as keywords. The period of our search extended from 2016 through to the end of 2022. Secondly, to ensure the accuracy and validity of the coal de-capacity data, manual selection of information on mines undertaking underground work was conducted by carefully reading the content and text. Finally, information on a total of 4027 de-capacitated mines from 2016 to 2022, including those announced by the Central Committee of the Communist Party of China, the State Council and its departments, and provincial administrative departments involved in coal, was selected, and the following information was recorded: the province to which they belonged, the name of the mine, information on latitude and longitude, the area covered, and the number of years of mining. Among them, the actual de-capacity is directly approved for mines that are completely closed, while for partially closed mines, the difference between their production capacity and approved capacity is calculated as the actual de-capacity.

2.3. Development of the Coal’s Full Life Cycle Carbon Emission Inventory

The coal life cycle consists of three main stages: coal mining, coal transportation, and coal utilization [30]. The main sources of GHG (i.e., CO2 and CH4) in the coal mining process are coal bed methane escape, mining and transportation, and electricity consumption for mining. During the transportation of coal, the consumption of fuel oil results in CO2 and CH4 emissions, while the mining and washing activities produce carbon emissions attributable to electricity consumption. Coal utilization, i.e., coal combustion, generates greenhouse gases. This study assumes no damaging consumption of coal during its life cycle. The carbon emissions inventory formulas used for calculations were as follows:
E = E 1 + 2 + 3 + E 4 + E 5 + E 6
E 1 + 2 + 3 = E 1 + E 2 + E 3
E 1 = C 1 × β × ( e b + e a ) ρ × α 1 × 12 44
E 2 = C 1 × β × γ × i = 1 n e i × α i × 12 44
E 3 = C 1 × β × δ × θ × 12 44
E 4 = C 1 × β × ( D × 0.3665 + H × 0.6335 ) × i = 1 n e i × α i × 12 44 × t × 0.7
E 5 = C 1 × β × i = 1 n e i × α i × 12 44 × r × 0.2
E 6 = C 1 × β × i = 1 n e i × α i × 12 44
where E is the full life cycle carbon emissions of coal (t); E1+2+3 is carbon emissions from the production phase (t); E1 is carbon emissions from coal bed methane escape (t); E2 is the carbon emissions from the extraction and transport of coal (t); E3 is carbon emissions from coal extraction and electricity consumption (t); E4 is carbon emissions from coal rail transportation (t); E5 is carbon emissions from coal road transportation (t); E6 is the carbon emissions from the coal utilization phase (t); C1 is the reduction in mine capacity (t) from 2016 to 2022; αi is the global warming potential (GWP) due to the i greenhouse gas; 12 is the molar mass of C (g/mol); and 44 is the molar mass of CO2 (g/mol). Please see Tables S1 and S2 for details of the other parameters involved in Equations (1)–(8).

2.4. Accounting for Air Pollutant Emissions

Ground-level data from the Chinese General Environmental Monitoring Station (https://www.cnemc.cn, accessed on 18 February 2023) were crawled using the Python 3.8 software, and the data were cleaned to obtain PM2.5 monitoring data from 2016 to2022 for each monitoring site. Ordinary kriging interpolation was performed on the PM2.5 data to obtain spatialized results, and PM2.5 values were extracted by mine site, minus the regional average PM2.5 values, with the aim of removing the effect of regional background concentration data.

2.5. Health Impact Assessment Model

Prolonged human exposure to PM2.5 concentrations above safe concentrations can elevate the risk of mortality from various diseases, leading to premature death in humans. Establishing a quantitative model to relate PM2.5 exposure concentrations to premature mortality is important for assessing the associated risks. PM2.5 exposure increases the risk of death from four main diseases: lung cancer (LC), stroke, chronic obstructive pulmonary disease (COPD), and ischemic heart disease (IHD). The exposure–response equations for these four diseases are uniform, but the coefficients differ (Table 2). RRm(c) denotes the relative risk of disease m at PM2.5 concentration ck, as estimated by the equation referenced in Cao et al. [31]:
R R m c = 1 ,   if   c < c 0 , m   1 + σ m , 1 × 1 e σ m , 2 c c 0 , m σ m , 3 ,   e l s e
where c0,m represents the safe threshold concentration of PM2.5 exposure for disease m. c signifies the PM2.5 response concentration at the mine site, derived from the annual average PM2.5 concentration (μg/m3) at the surface air monitoring station minus the corresponding provincial average. This approach enables accurate assessment of the influence of mine closures or exits on ambient PM2.5 levels. The exposure–response curve shape for disease m is characterized by σ m , 1 , σ m , 2 , and σ m , 3 . Detailed values for these parameters can be found in Table 2.
We employed the integrated exposure–response (IER) function to quantify the health impacts of PM2.5 and estimate the associated premature deaths. Burnett et al. [32] indicate that IER can better simulate the situation in China. The detailed formulas are presented below:
M k = m P k × R R m c k 1 R R m c k × I N k , m
G i   =   P i ÷ P M k
where Mk represents the mortality rate associated with PM2.5 in area k; k denotes a specific area; m refers to a distinct disease type; Pk signifies the total exposed population within the age bracket of 0 to 85 years in area k; ck corresponds to the level of exposure in area k; and Ink,m stands for the baseline mortality derived from disease m in area k, specifically for the age group ranging from 0 to 85 years. In terms of baseline mortality data, the statistics are at the regional level for central, east, and west mainland China (Table S3). For provincial-level modelling, this study assembles regional age-specific mortality data by synthesizing information from multiple sources: the National Disease Surveillance System Cause of Death Surveillance Dataset (https://ncncd.chinacdc.cn/xzzq_1/202101/t20210111_223706.htm, accessed on 20 February 2023), the Global Burden of Disease Database (GBD) (http://vizhub.healthdata.org, accessed on 23 February 2023), and Hui [33]. These data were collated to produce provincial age-specific baseline mortality data.

3. Results

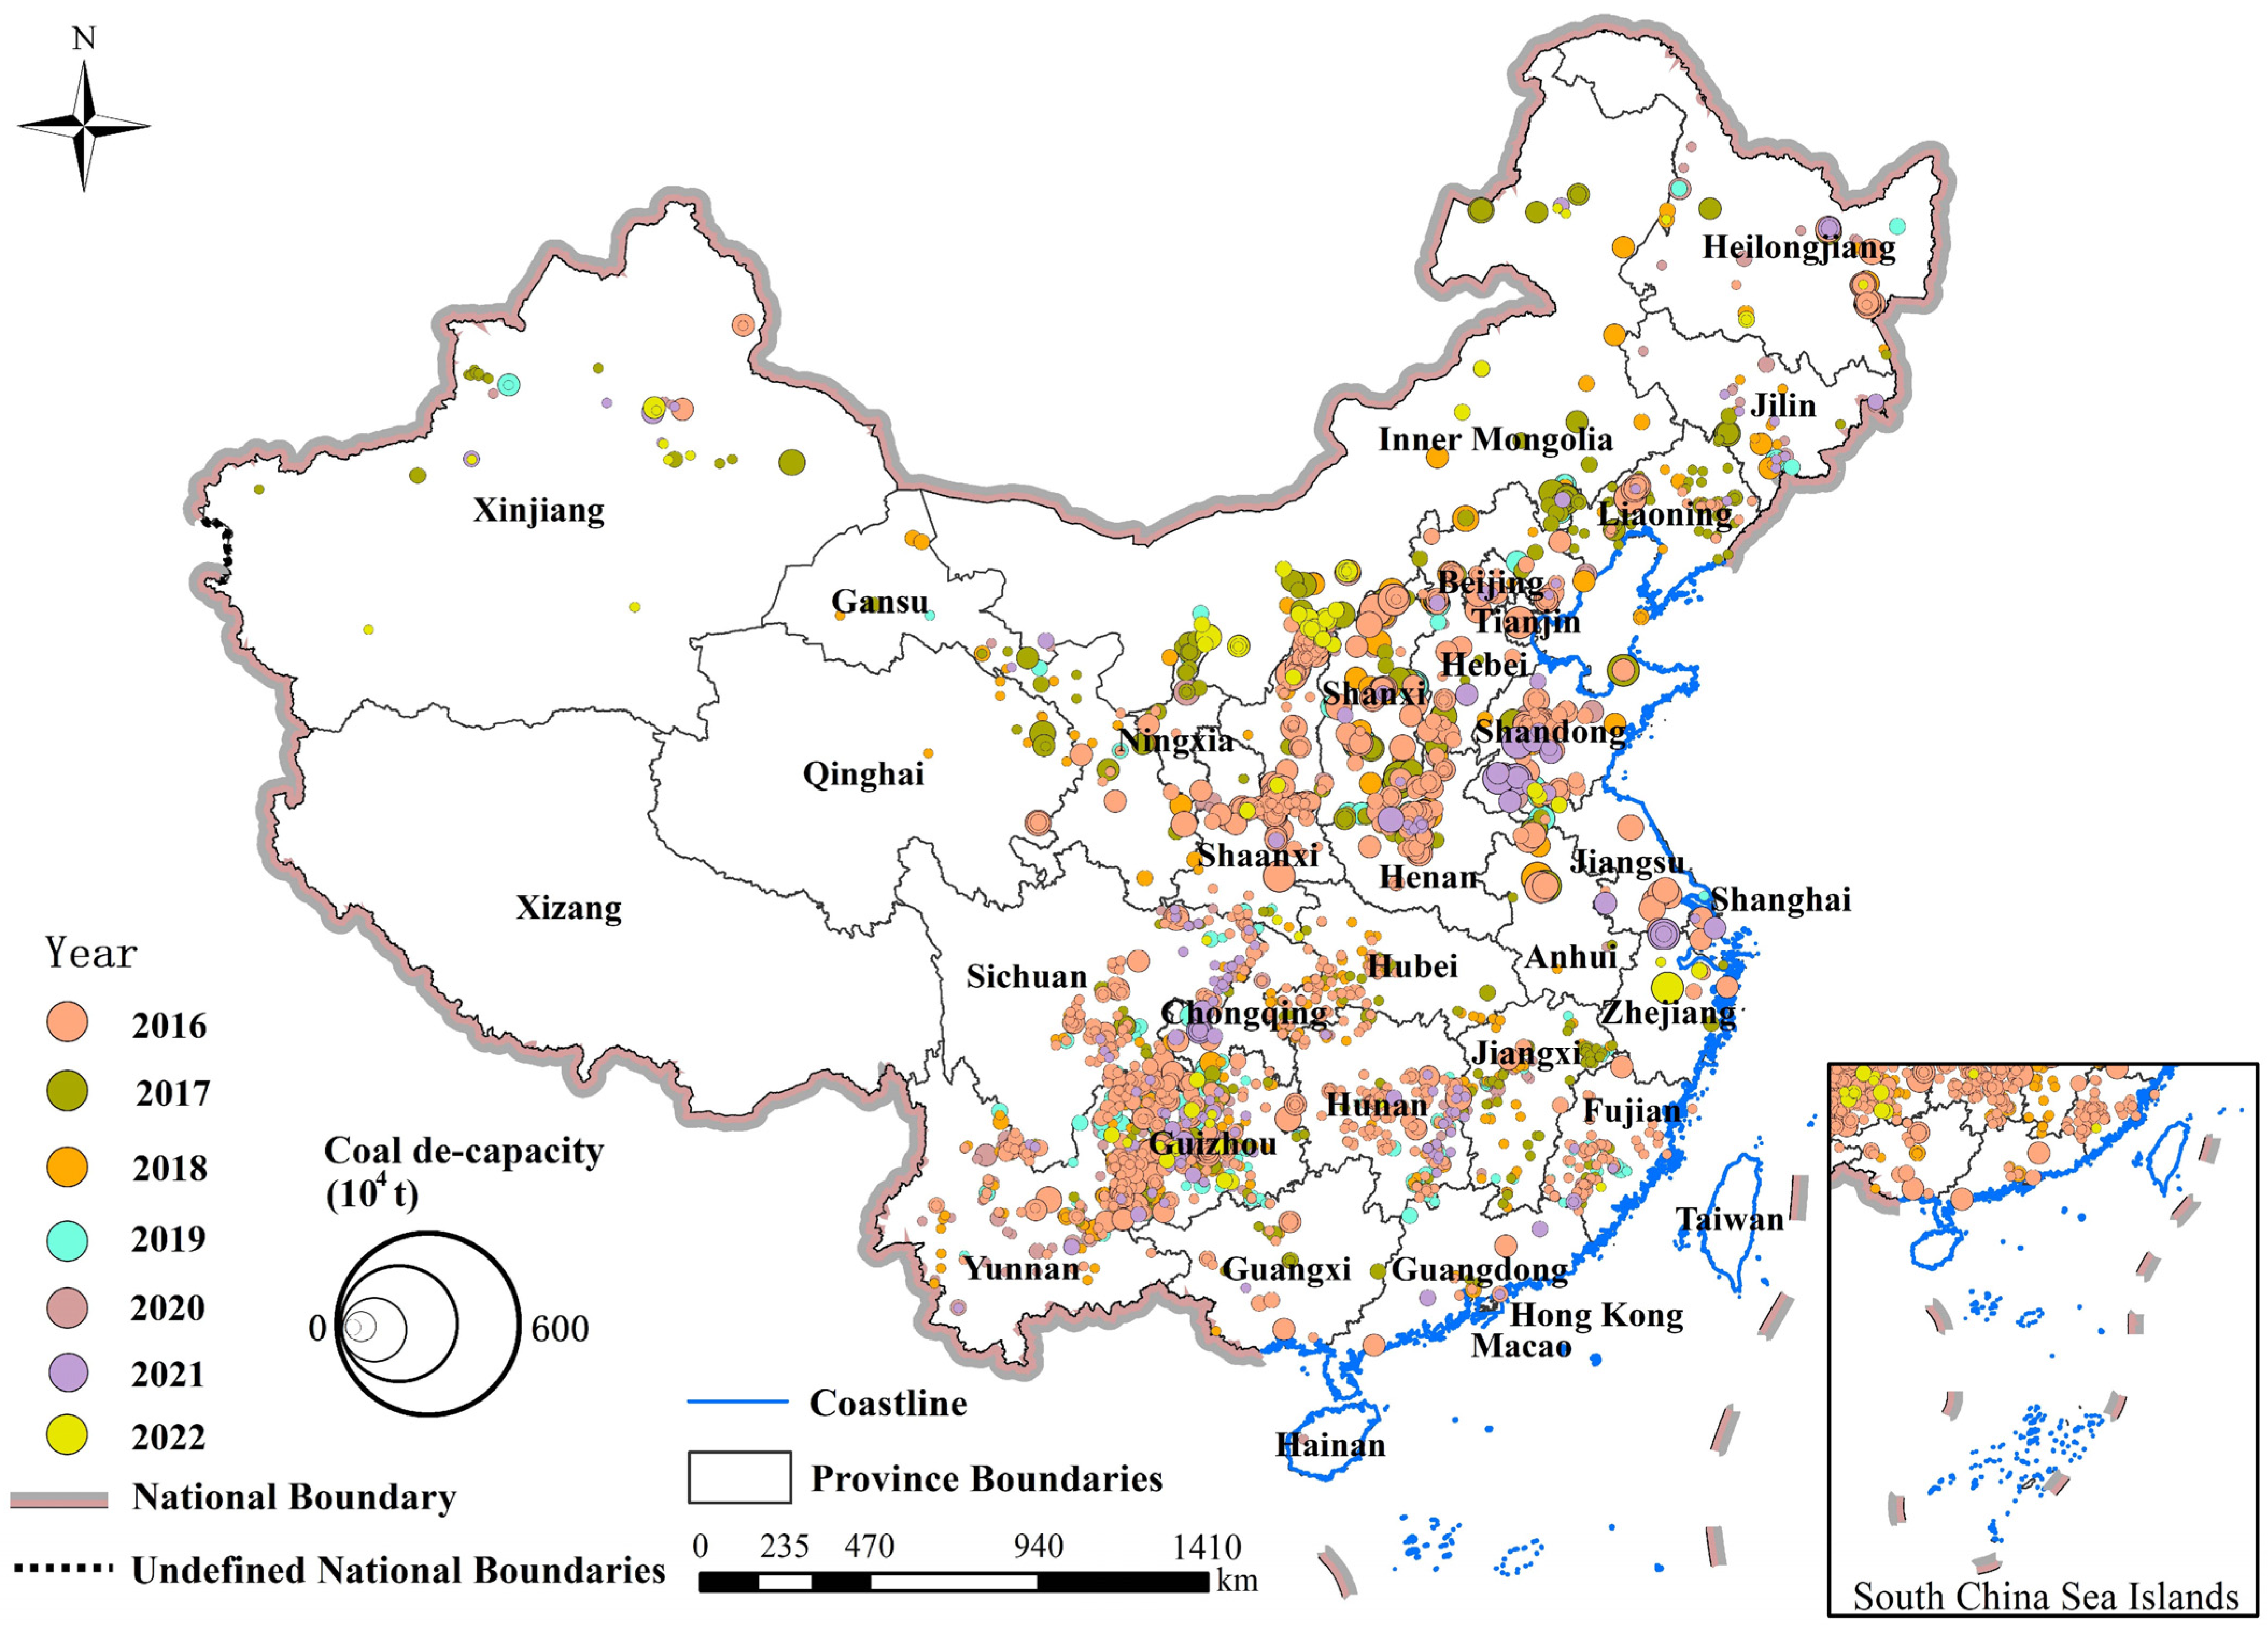
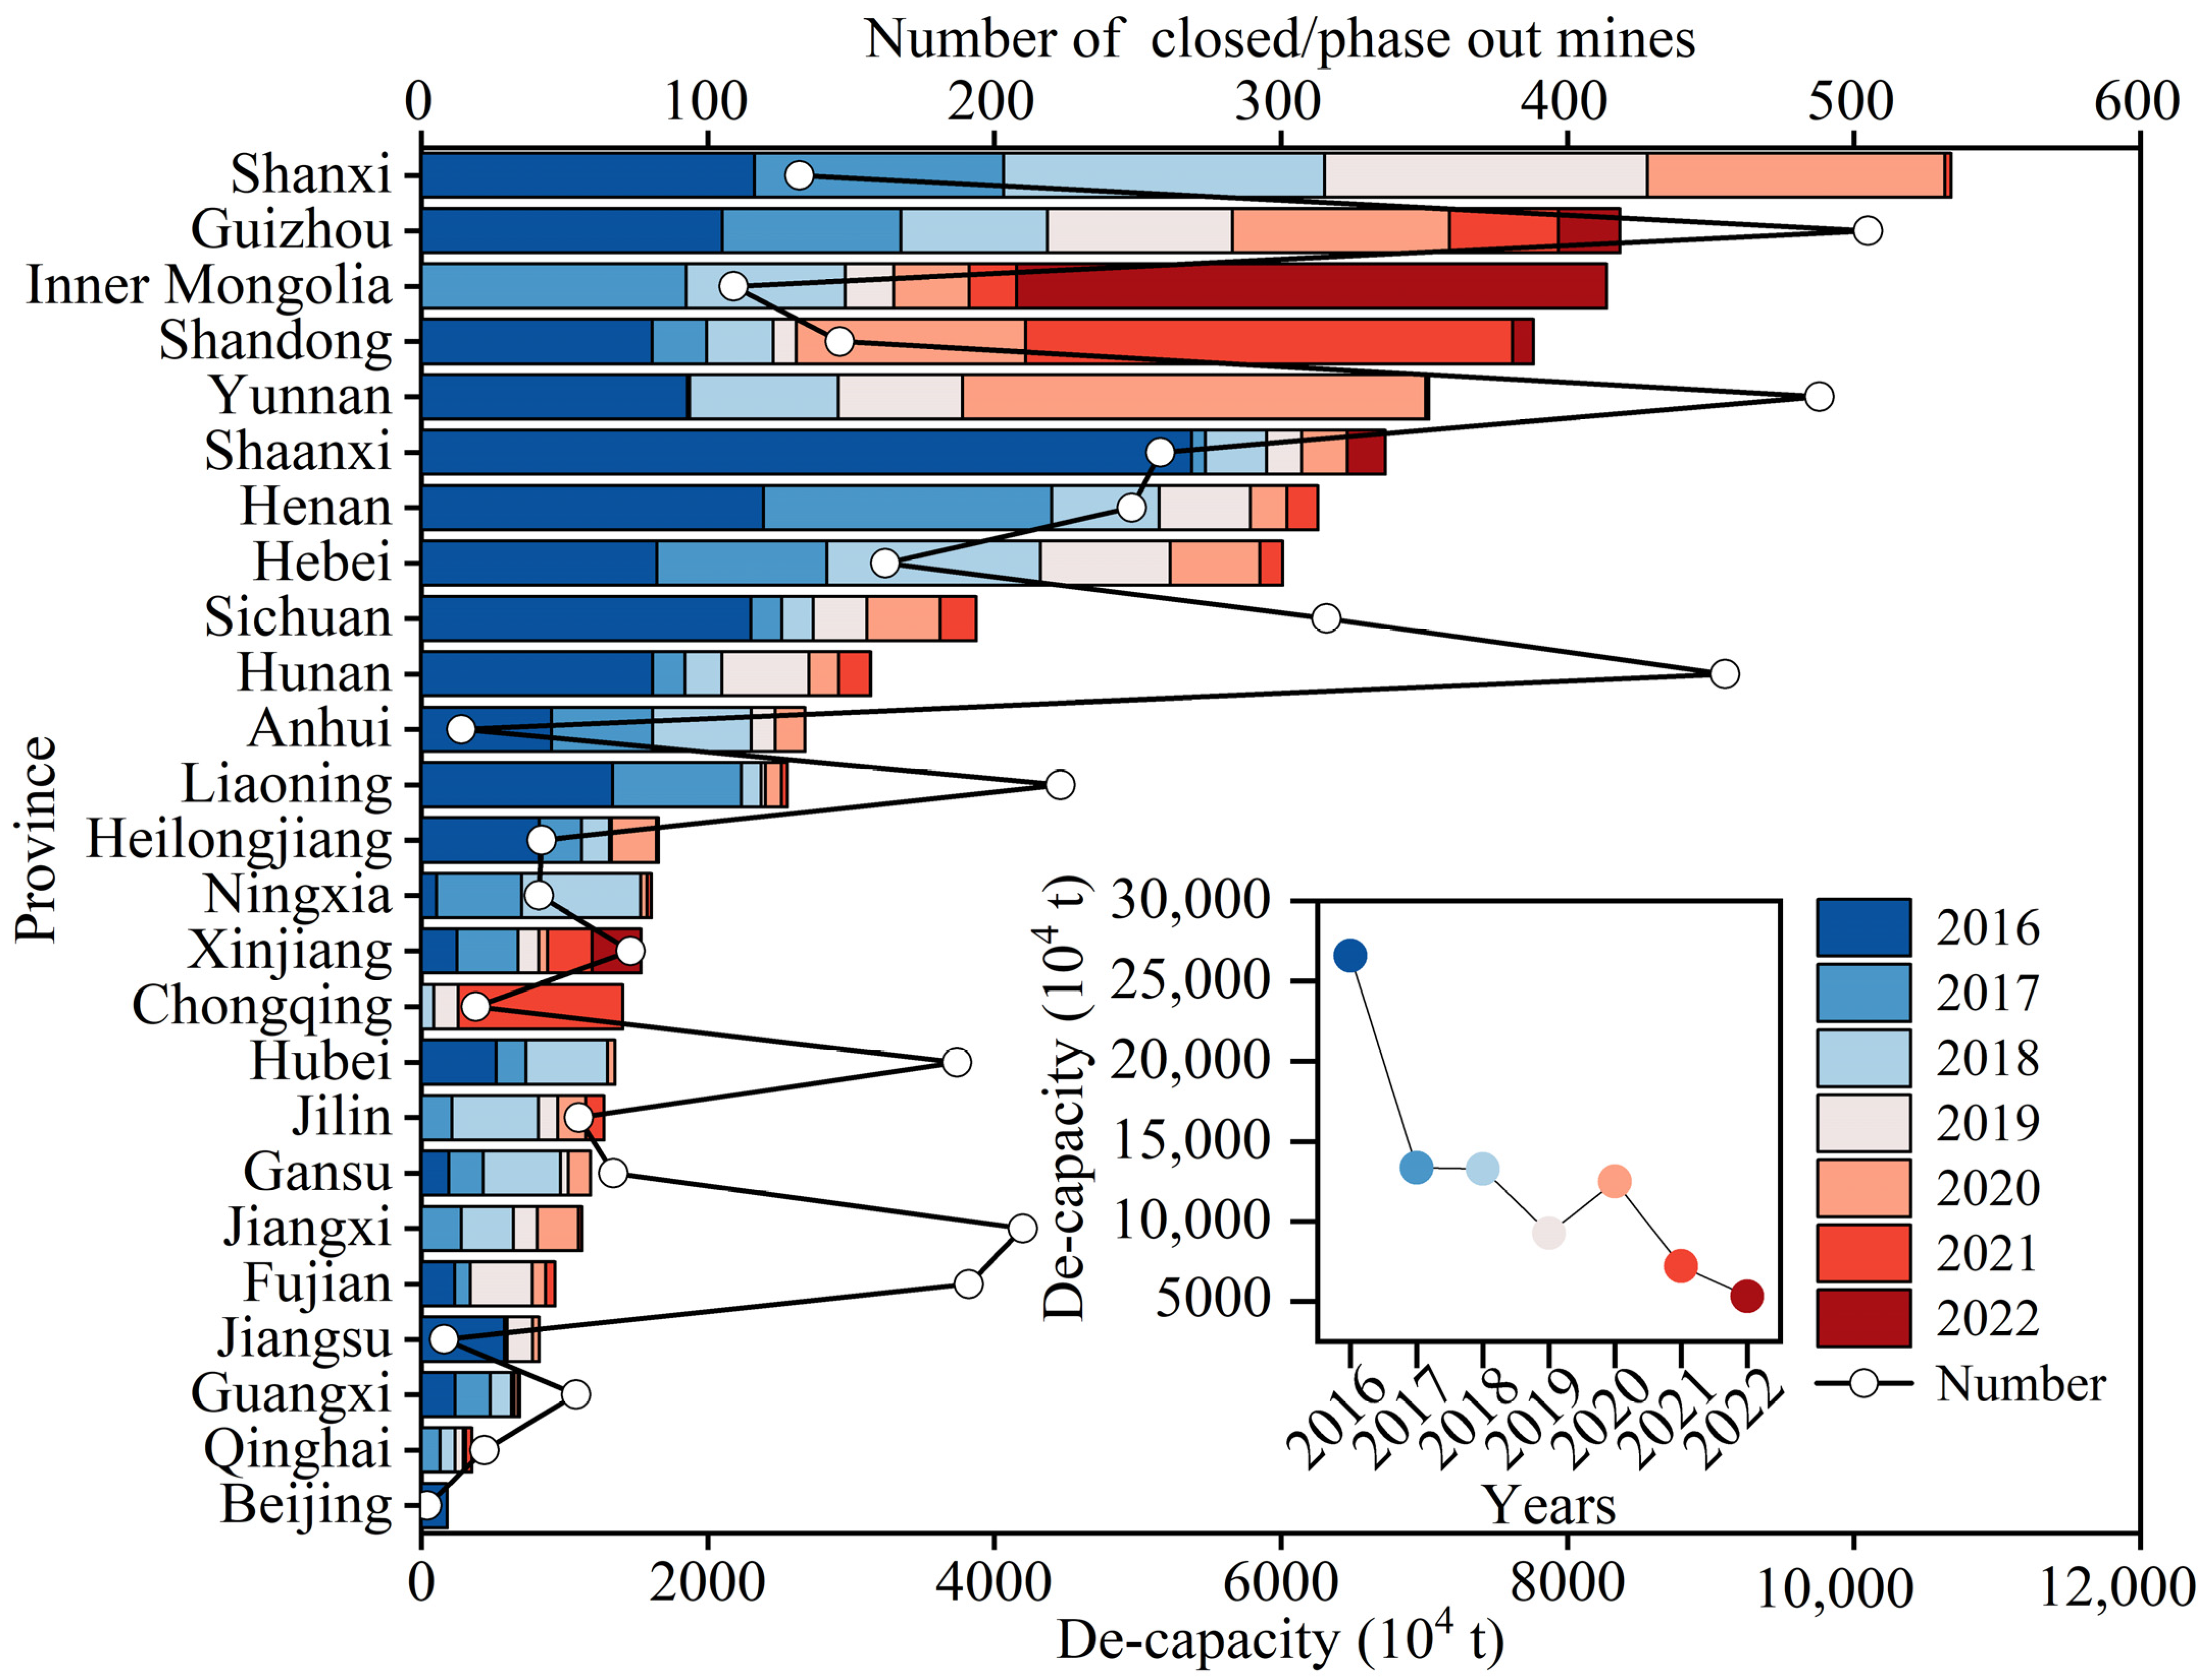
3.1. Coal De-Capacity Feature

China’s 2016–2022 mine closure/phase out were spread across 25 provinces. On the one hand, a significant high density of coal de-capacity was concentrated in the provinces within the middle and lower Yellow River basin. On the other hand, the provinces of the upper Yangtze River basin bore the majority of the mine closures/phase outs (Figure 2). The leading provinces in coal capacity reduction were Shanxi, Guizhou, and Inner Mongolia, with a total of 4027 mines closed or phased out, representing 8.75 × 10⁸ t of production capacity. The top three provinces in terms of coal de-capacity were Shanxi, Guizhou, and Inner Mongolia, with a total of 106.79 million t, 83.68 million t and 82.74 million t, respectively (Figure 3). The top three provinces in terms of number of mines closed/phased out were Guizhou, Yunnan, and Hunan provinces, with 505, 488, and 455 mines closed/phased out, respectively. The provinces with the largest de-capacity in each year from 2016 to 2022 were Shaanxi, Henan, Shanxi, Shanxi, Yunnan, Shandong, and Inner Mongolia, with de-capacity of 53.77, 20.14, 22.40, 22.55, 32.34, 34.00, and 41.20 million t. During 2016–2022, China’s coal de-capacity was 265.81 million t in 2016, after which the capacity phase out decreased year by year to 53.18 million t in 2022. However, coal de-capacity and the number of mines closed/phased out are not always positively correlated, e.g., Shanxi, Inner Mongolia, and Shandong provinces had large de-capacity for 2016–2022, but their number of mines closed/phased out was small. While provinces such as Guizhou, Yunnan, Hunan, and Jiangxi have a large number of mines closed/phased out, but their de-capacity was small. This illustrates the spatial variation in the mines closed/phased out, with Southwest China tending to close small and low-producing mines, which is also related to local coal policies.

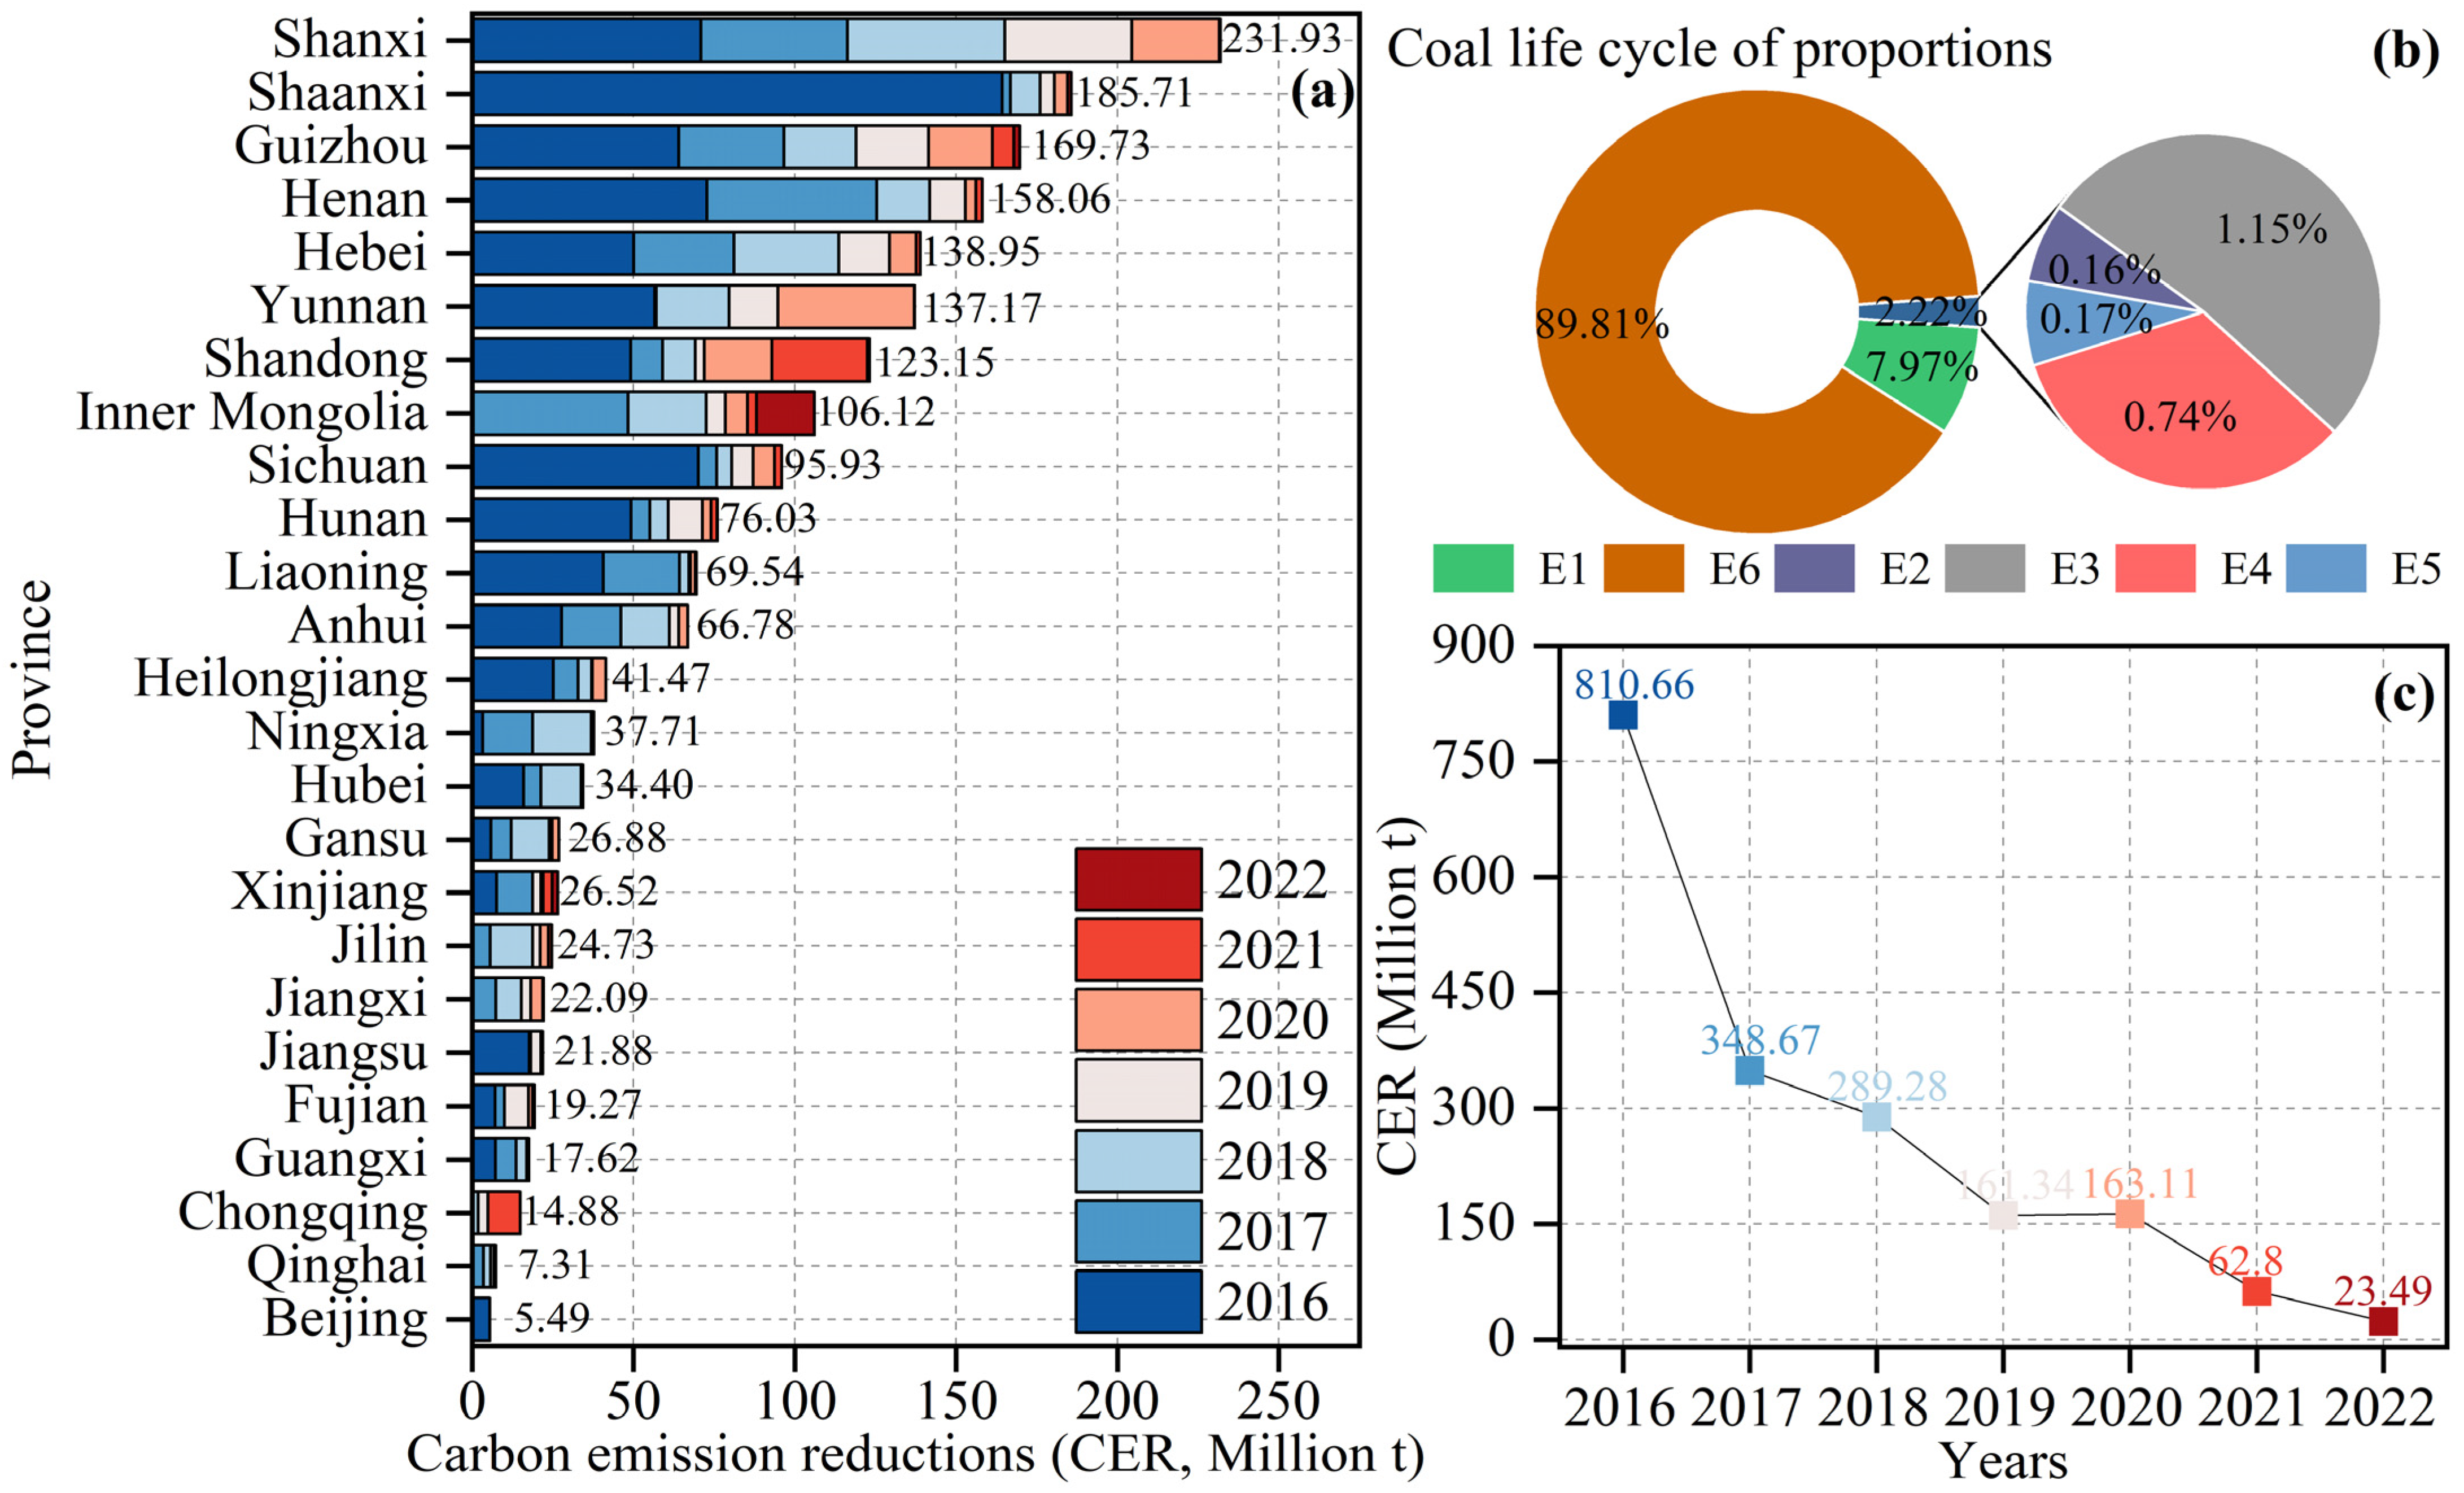
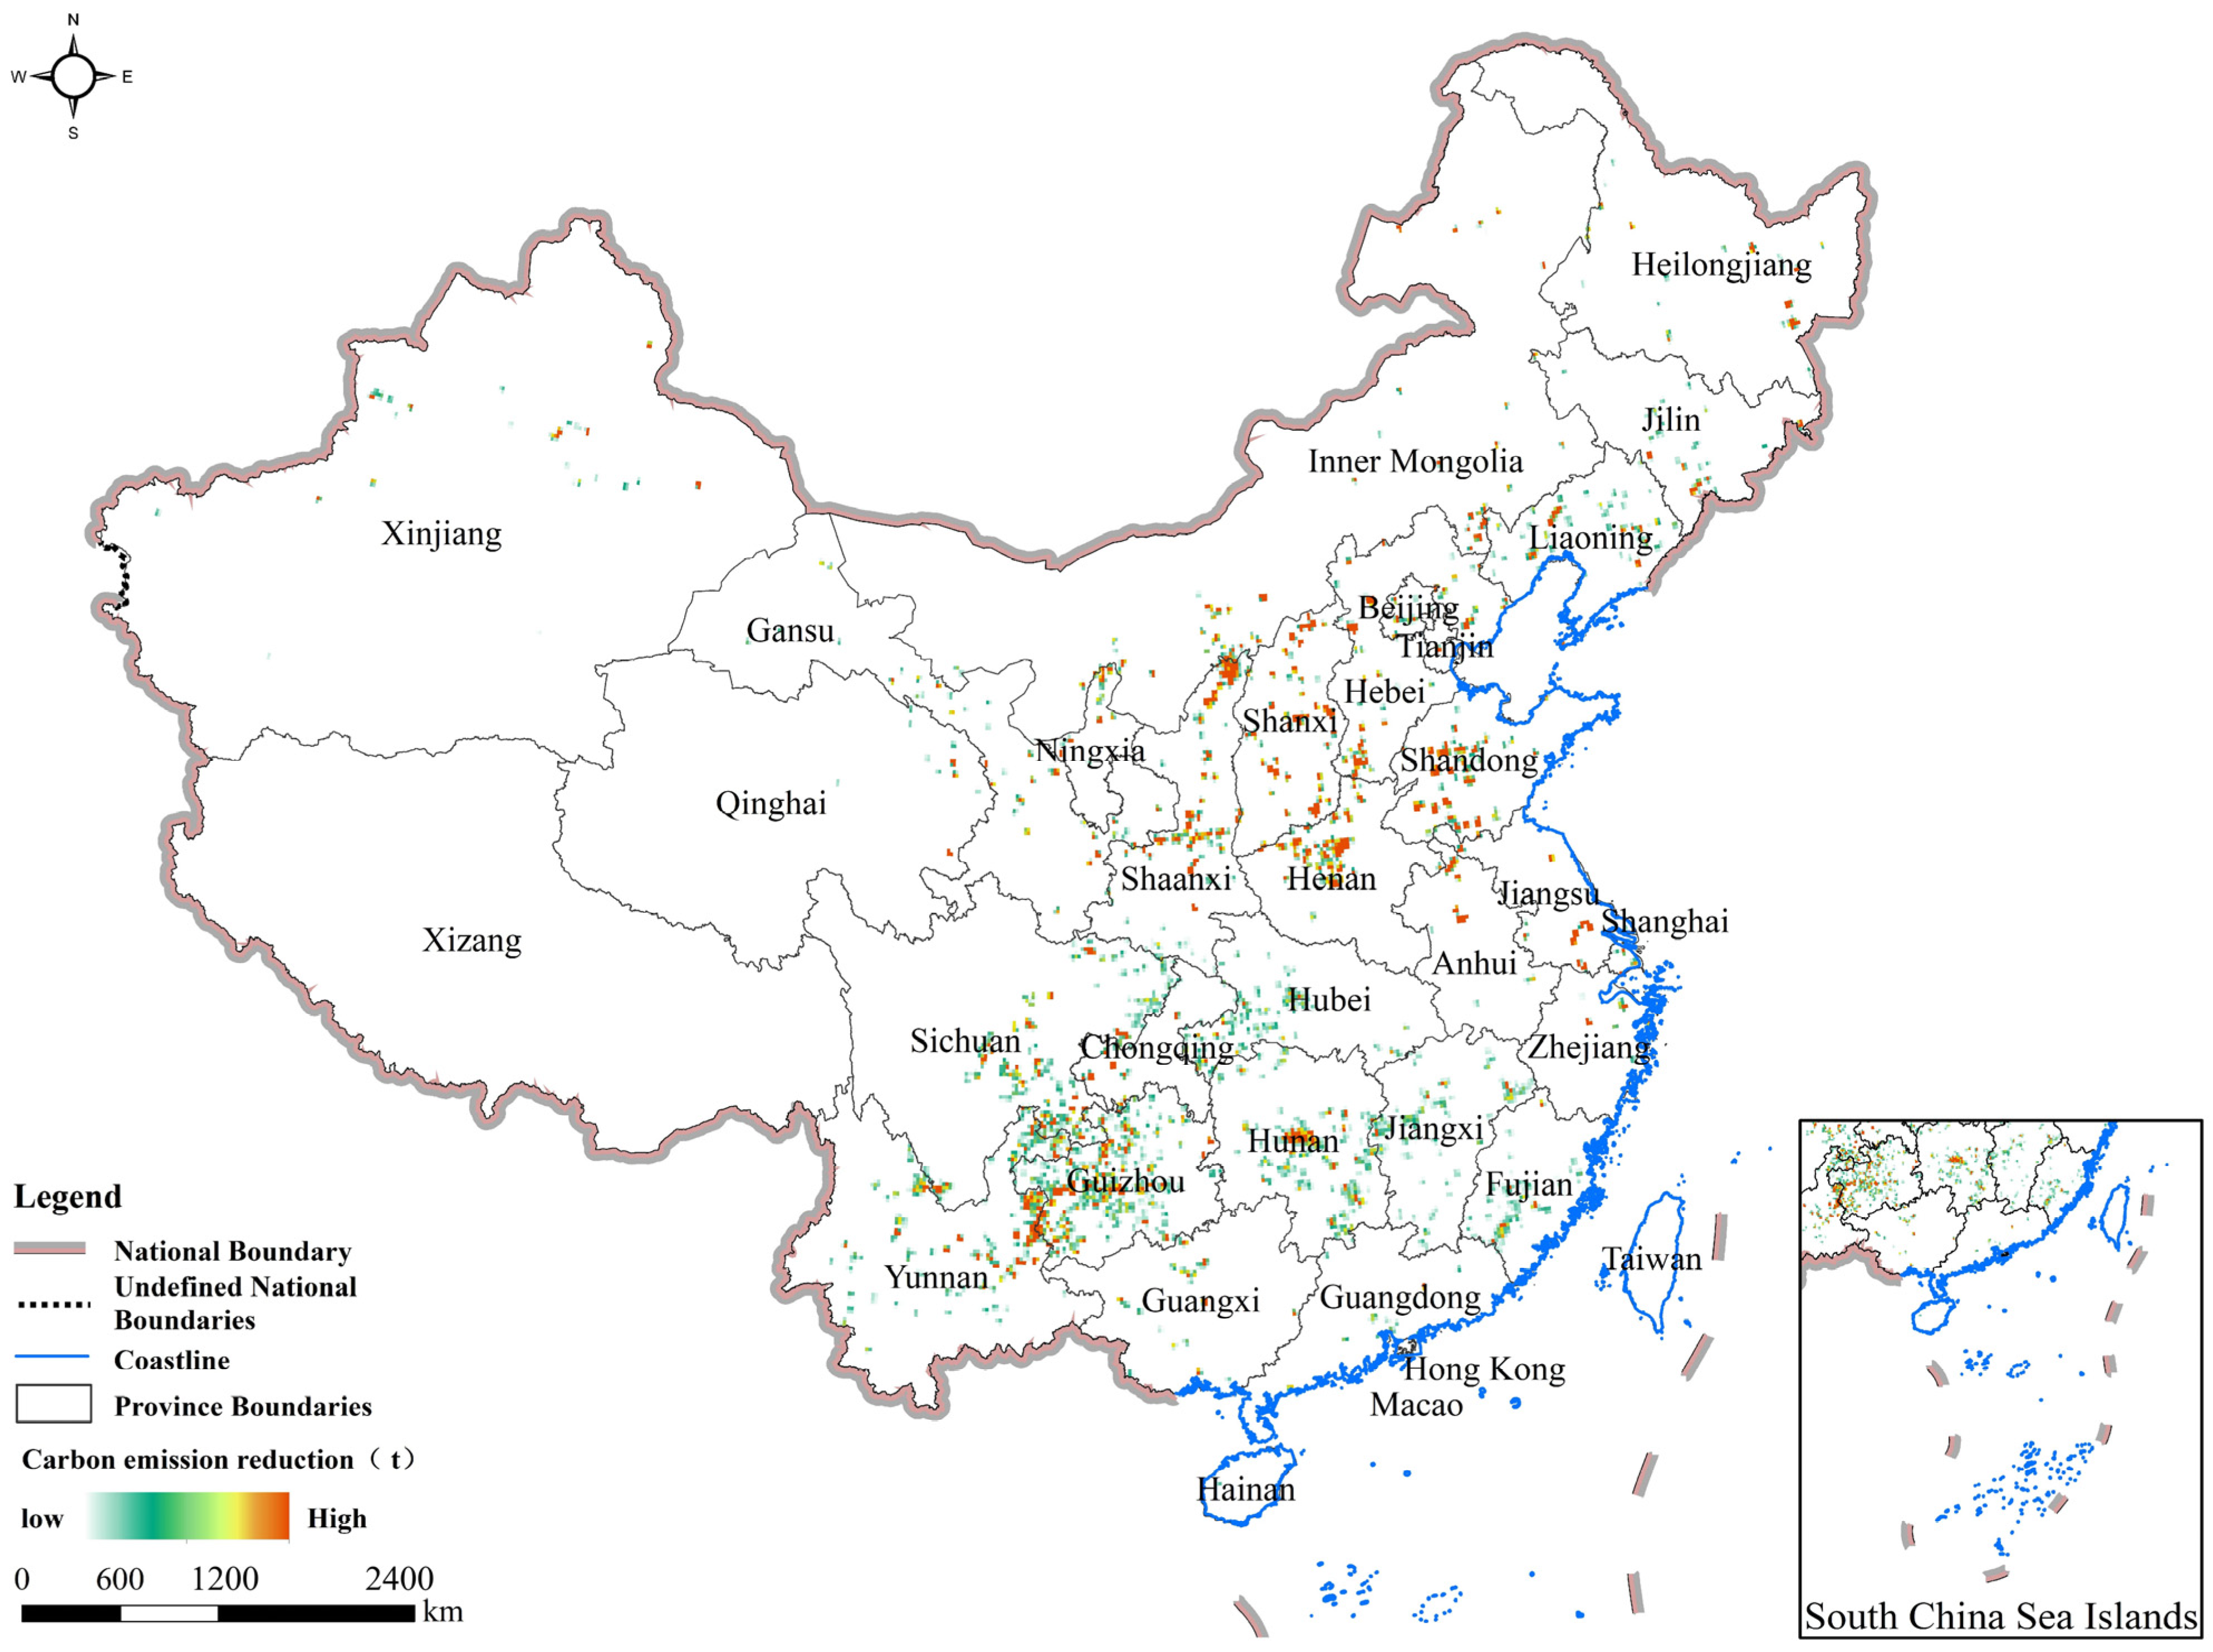
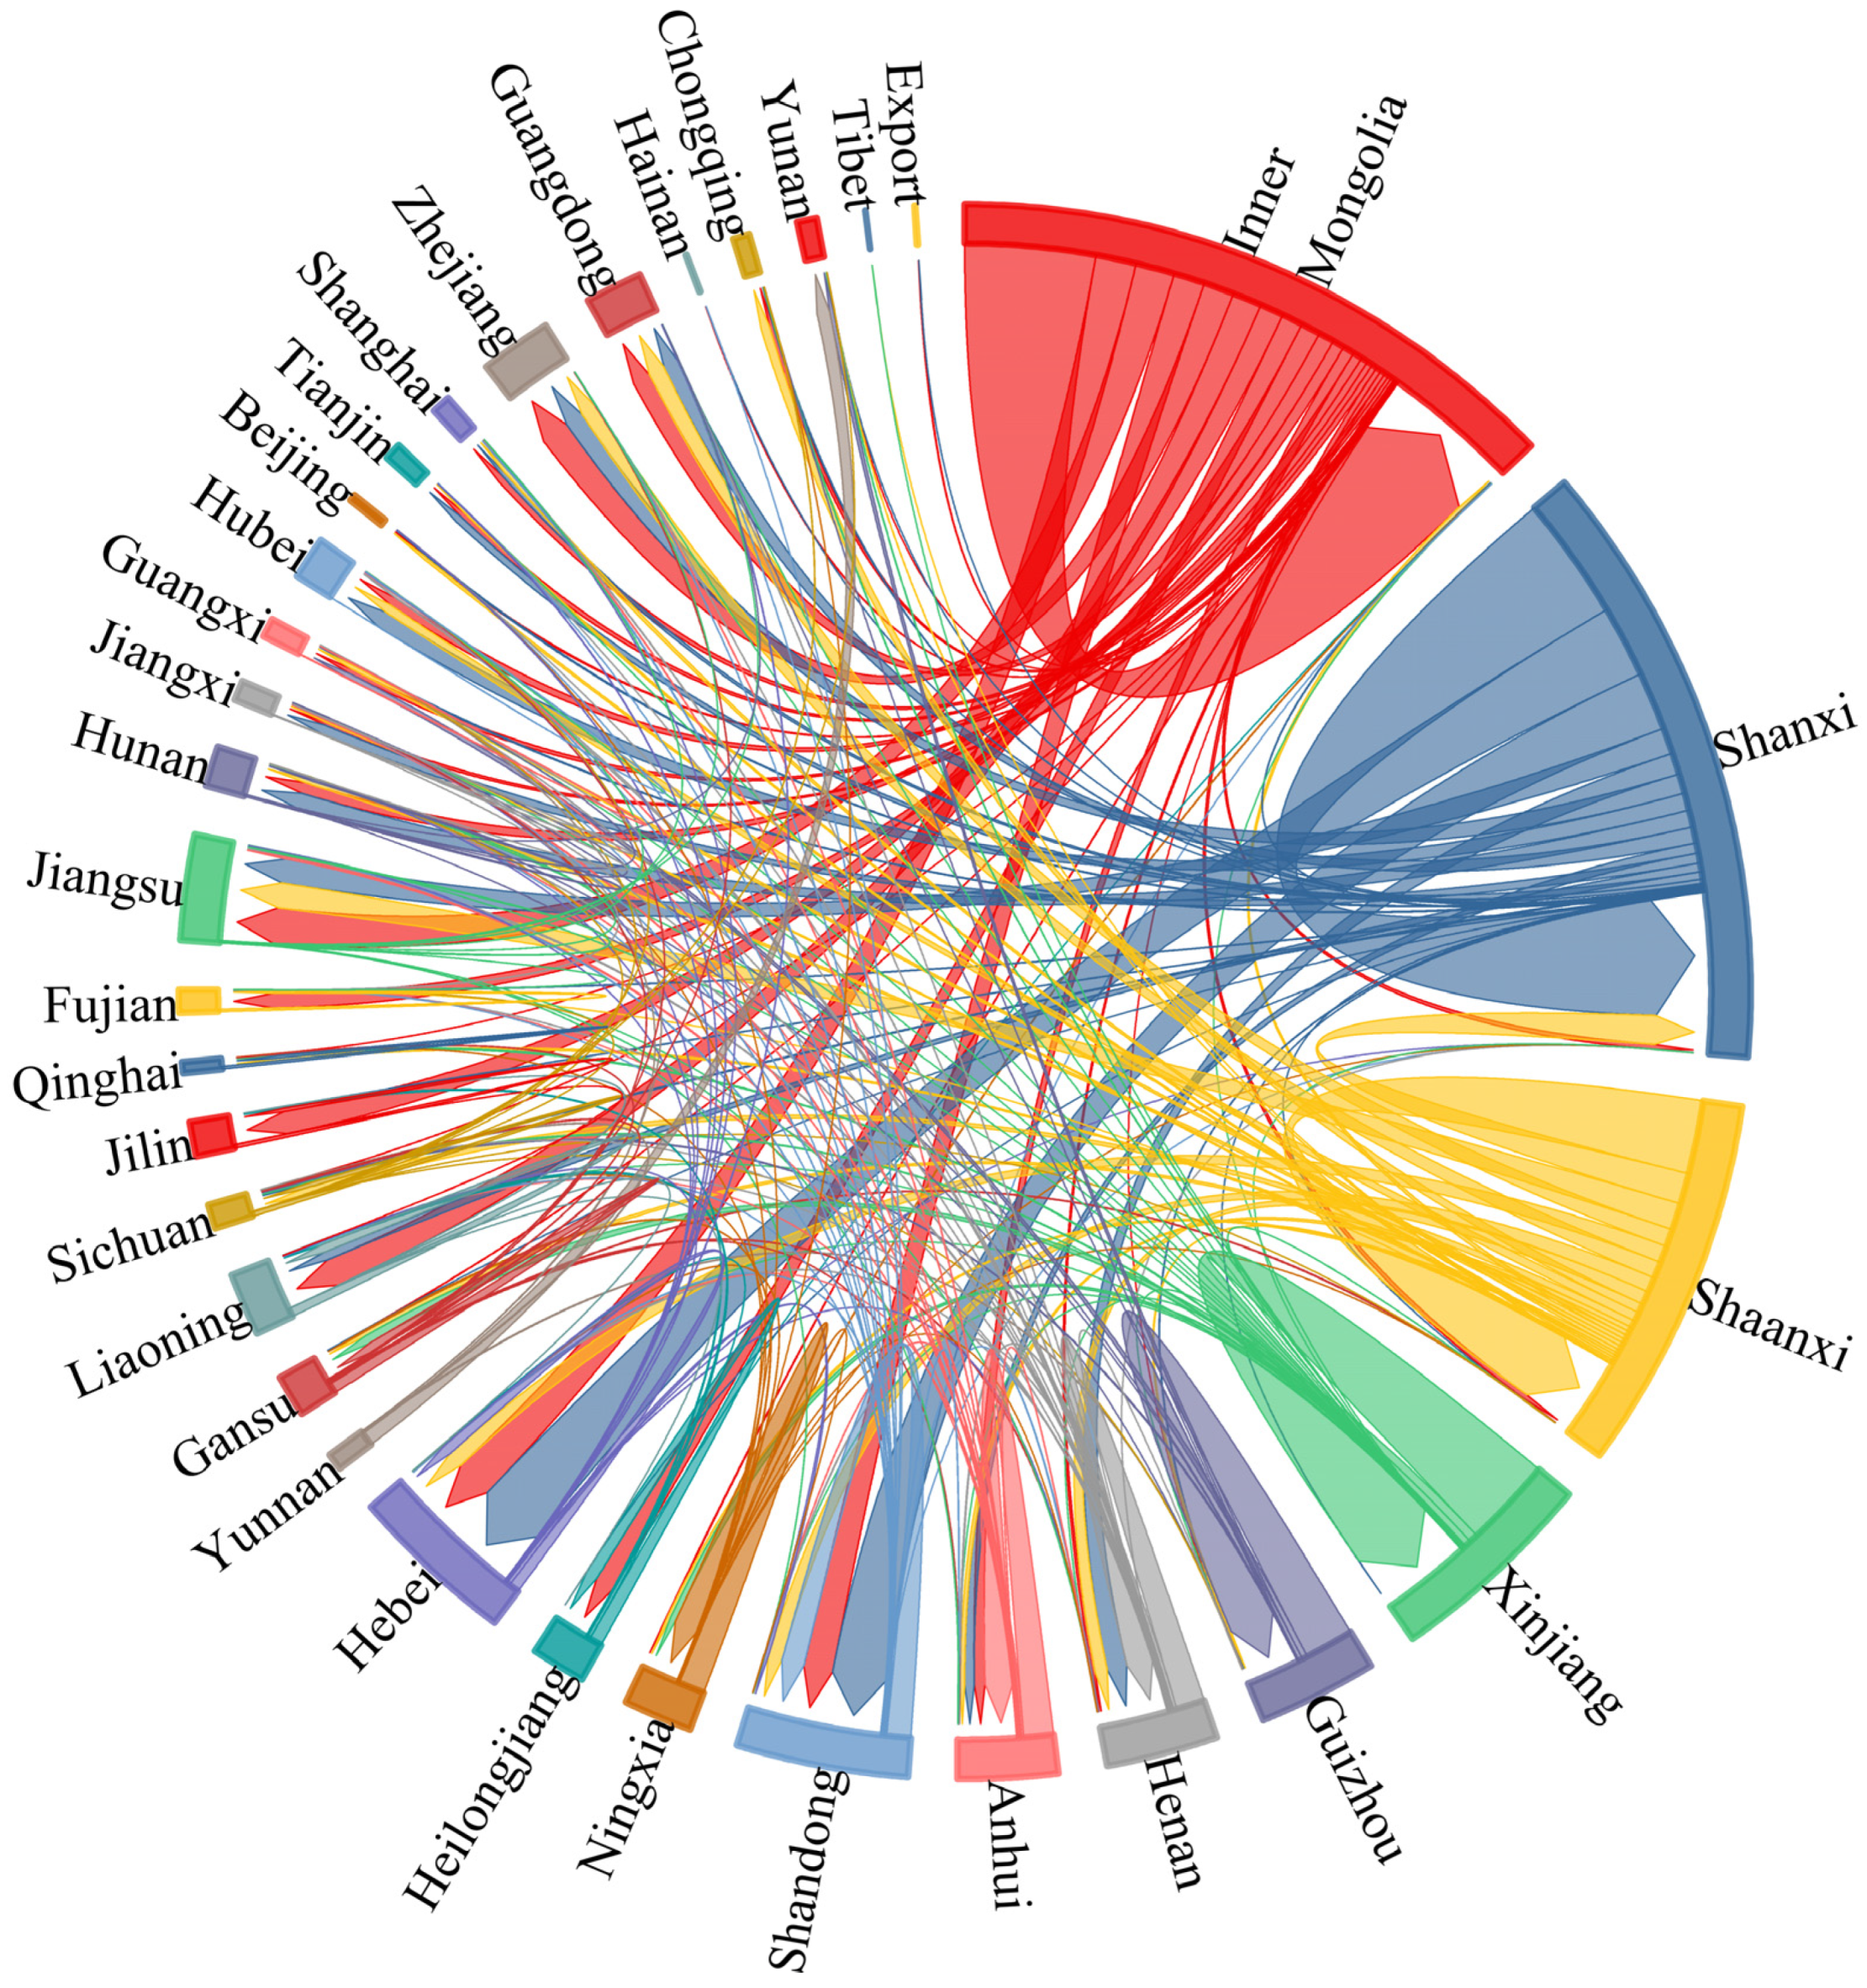
3.2. Spatial and Temporal Patterns of Carbon Emission Reductions

From 2016 to 2022, a total of 1859 million t of carbon emissions were reduced from closed/exited mines in China. The top 10 provinces in terms of carbon emission reduction from 2016 to 2022 are, in order, Shanxi, Shaanxi, Guizhou, Henan, Hebei, Yunnan, Shandong, Inner Mongolia, Sichuan, and Hunan, with carbon emission reductions of 231.93, 185.71, 169.73, 158.06, 138.95, 137.17, 123.15, 106.12, 95.93 and 76.03 million t, respectively (Figure 4a). The coal mining phase reduces 148.19, 2.97, and 21.38 million t for coal bed methane leakage, mining and transportation, and mining and electricity consumption, accounting for 7.97%, 0.16%, and 1.15% of the coal life cycle, respectively (Figure 4b). The coal utilization phase also reduces 1669.87 million t, accounting for 89.81% of carbon emissions over the full life cycle of coal (Figure 4b). It is worth noting that we use the three major combustion sectors to roughly estimate carbon emissions from the coal utilization phase, as thermal power plants, cement plants and steel plants account for more than 77% of coal consumption in China. In contrast, the coal transport phase, including rail and road transport, accounts for only 0.74% and 0.17% of the coal life cycle, respectively (Figure 4b). With the reduction in coal de-capacity, the carbon emissions were reduced from 810.66 million t in 2016 to 23.49 million t in 2022 (Figure 4c).
Spatially, they are mainly concentrated in Southwest China and North China (Figure 5), due to the rich coal resources in these two regions and the increasing pressure of ecological degradation. Guizhou and Shanxi, as typical examples in Southwest China and North China, respectively, represent two carbon reduction models, i.e., reducing production and improving quality in medium-sized and large-sized mines, and closing small-sized mines altogether. Our results show that medium and large mines have higher carbon reduction benefits.

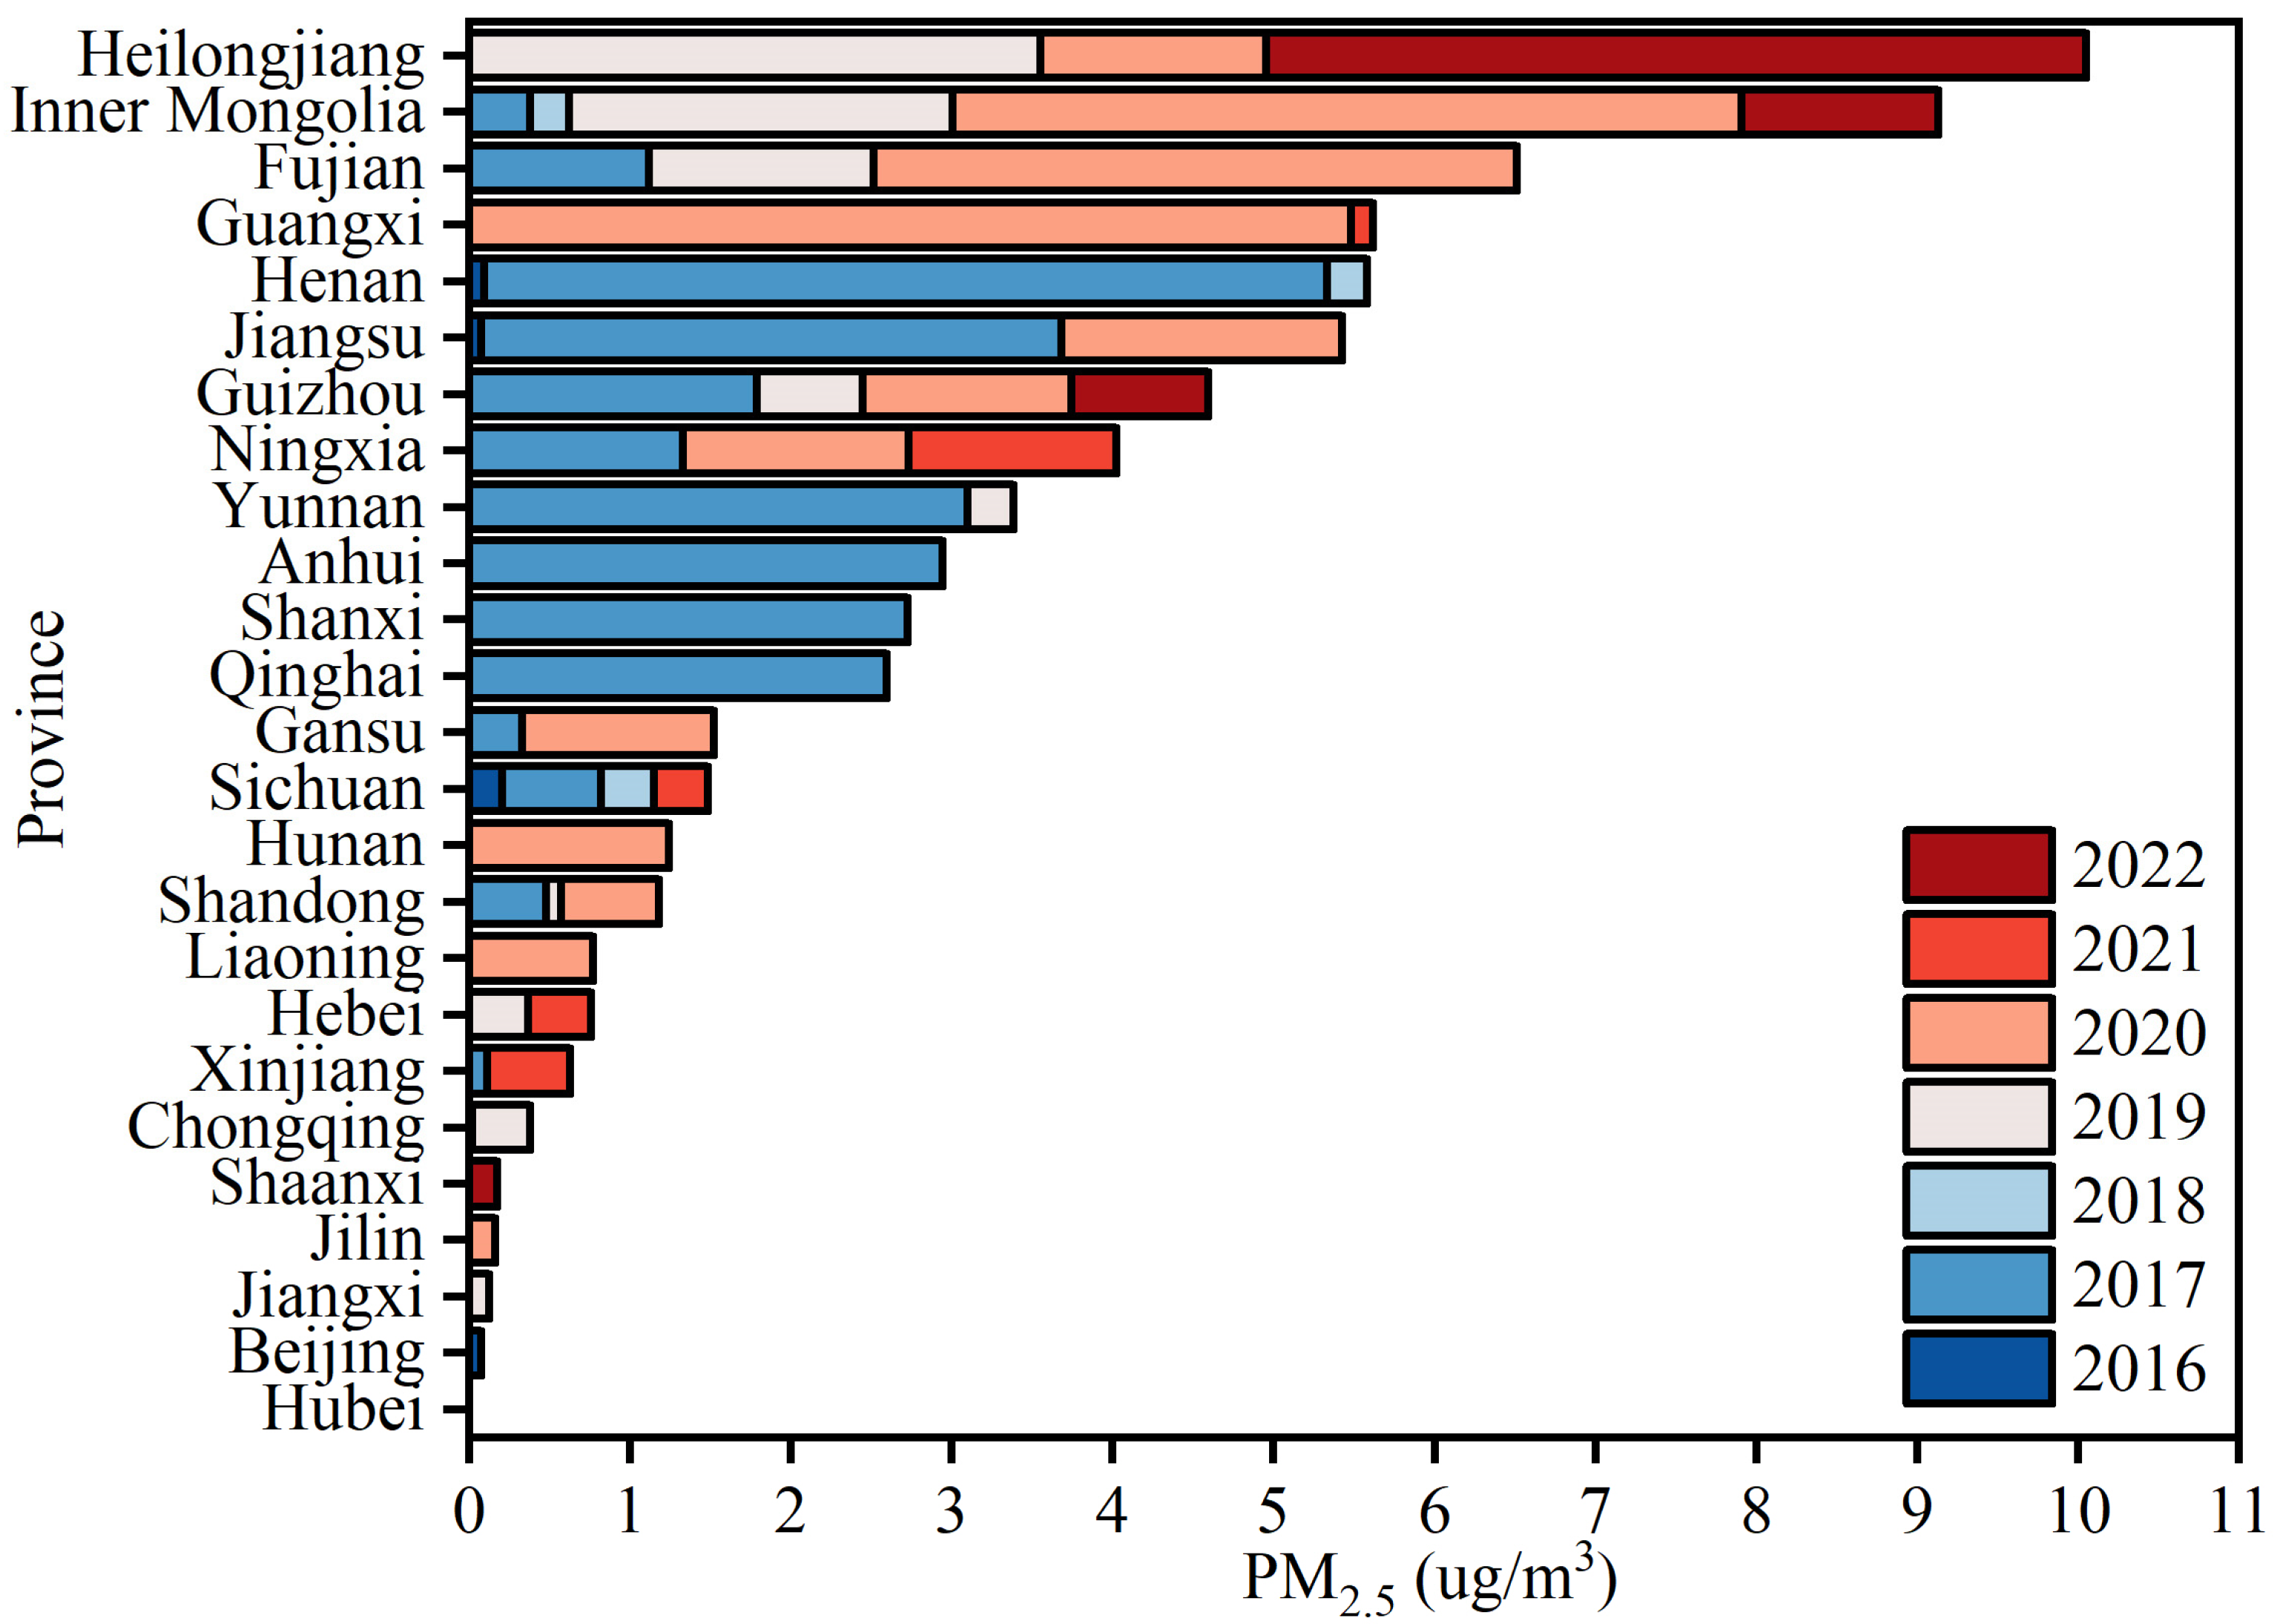
3.3. Response Concentrations of PM2.5 Pollutants

Response concentrations of PM2.5 greater than 4.5 µg/m3 were found in Heilongjiang, Inner Mongolia, Fujian, Guangxi, Henan, Jiangsu, and Guizhou provinces (Figure 6). In contrast, Hubei, Beijing, Jiangxi, Jilin, Shaanxi, and Chongqing all had PM2.5 response concentrations below 0.5 µg/m3. For the different years, 2017 and 2020 produced larger PM2.5 response concentrations than several other years. The correlation coefficient of 0.78 between capacity removal and carbon emission reduction strongly suggests that increased de-capacity results in heightened carbon emission reduction (Figure 7a). Furthermore, PM2.5 emission decreases exhibit a robust positive correlation with carbon emission cuts (r = 0.99), highlighting the potential for integrated strategies to concurrently mitigate carbon and air pollutant emissions (Figure 7b).

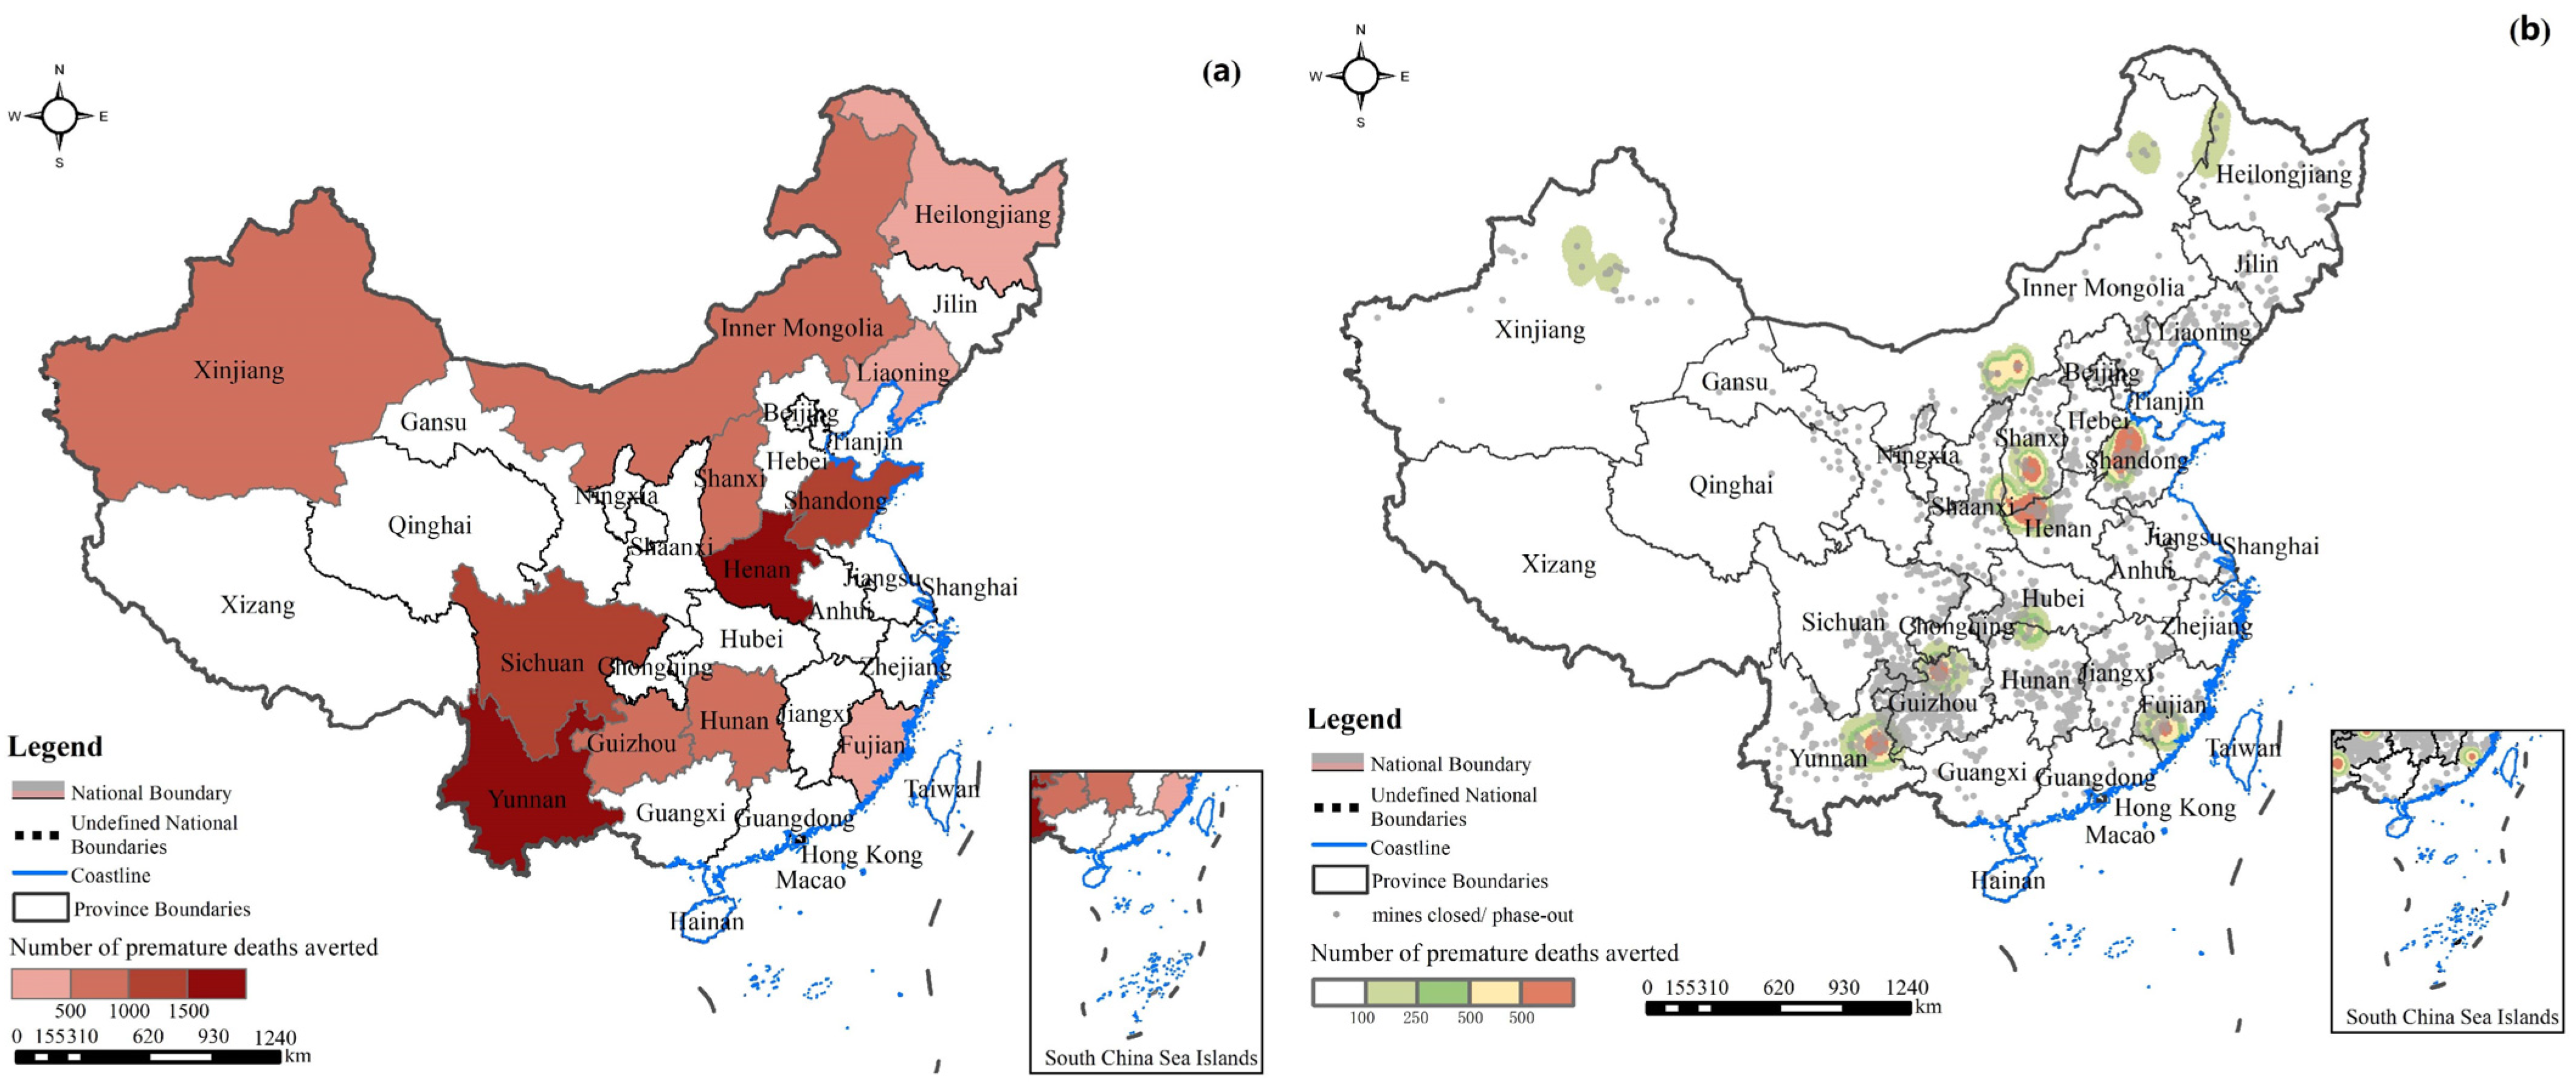
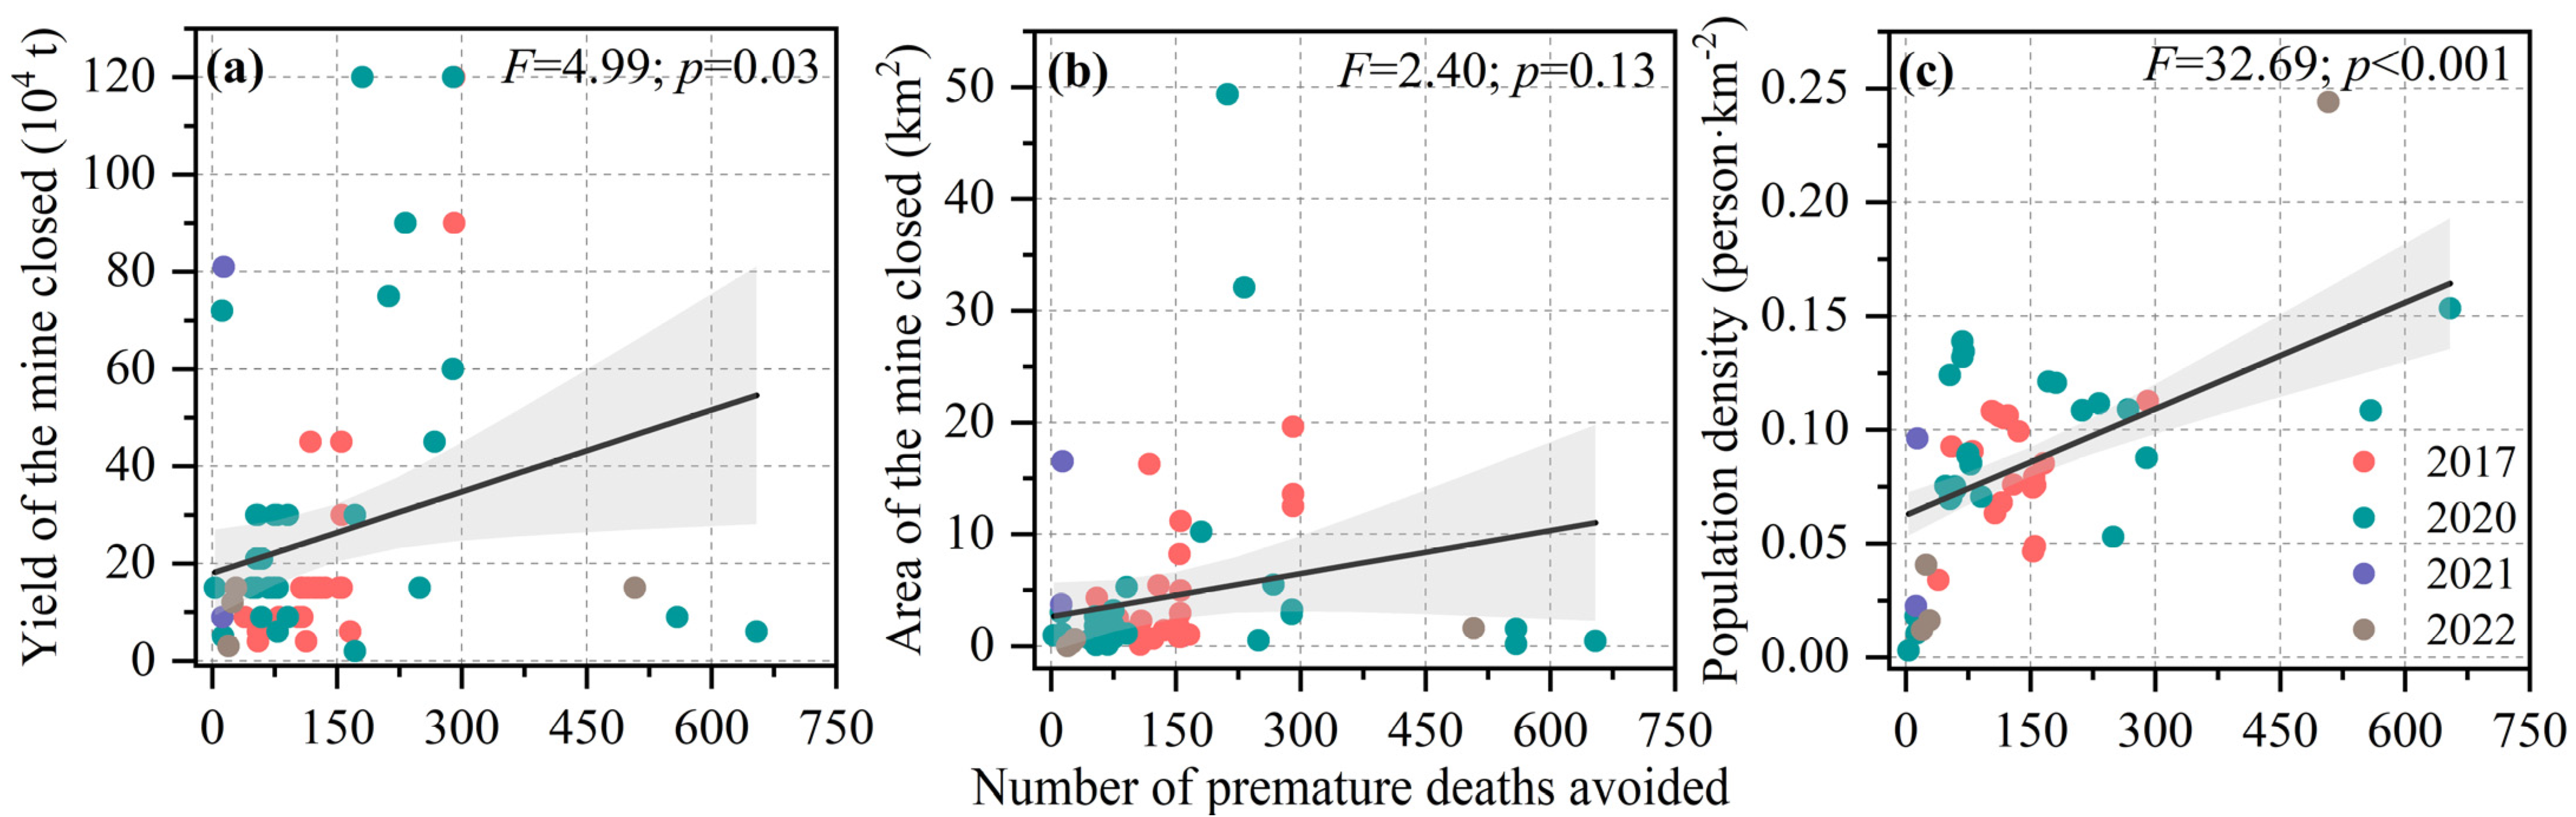
3.4. Health Co-Benefits

Table 3 and Table 4 outline the province-specific data on premature deaths averted due to reduced PM2.5 emissions associated with mine closures and phase outs. Additionally, the spatial distribution of these health effects is illustrated in Figure 8. A total of 11,774 avoided premature deaths are attributed to the reduced ambient PM2.5 exposure due to closed/phased out mines in the period of 2016–2022. The specific proportions of disease attribution are 70.63% for IHD, 18.33% for stroke, 10.01% for COPD, and 1.03% for LC. In addition, Henan (3017 premature deaths averted) had the largest health benefits caused by closed/phased out mines, followed by Yunnan (1577 premature deaths averted), Shandong (1179 premature deaths averted), and Sichuan (1118 premature deaths averted). There were 87, 46, 86 and 86 mines where ambient PM2.5 exposure at the mine contributed to the probability of death from IHD, Stroke, COPD and LC, respectively. Both population density (p < 0.001) and capacity (p < 0.05) around closed/eliminated mines had highly significant positive correlation with the number of averted premature deaths, while mine areas (p = 0.13) were not significantly associated with the reduction in premature deaths (Figure 9).

4. Discussion

In light of the above findings, we will implement them in the order initially proposed to further aid in China’s progress towards coal decommissioning and energy transition.
To retire outdated overcapacity [13] and achieve ambitious carbon peaking and carbon neutral targets [34], China had closed/phased out a total of 4027 mines, with a total de-capacity of 8.75 × 10⁸ t from 2016 to 2022. These mine sites are mainly concentrated in the Southwest and North China regions (Figure 2). The top three areas that saw the most coal de-capacity were the Shanxi, Guizhou, and Inner Mongolia provinces, while the top three mines closed/phased out were located in the Guizhou, Yunnan, and Hunan provinces. This may represent two models of coal transition in China, one is the reduction of capacity for large and medium mines in Northern China, and the other is the outright closure of small and medium mines in Southwest China. The reduction in coal production is accompanied by a reduction in coal consumption, which inevitably also leads to a reduction in carbon emissions; this is particularly demonstrated by the large amount of CO2 emissions contributed by coal-fired power plants as a typical example [35]. Our results show that the entire life cycle of coal emits 1859 million t of carbon during the coal de-capacity process, with 1669.87 million t of carbon generated during the coal utilization phase alone, accounting for approximately 89.81% of the coal life cycle. This result is consistent with the results of Wang et al. [36] and Wu et al. [30], who found that the coal utilization phase accounts for 91–95% of the carbon emissions in the full life cycle of coal. It is worth noting that we use thermal power plants, cement plants and steel plants to roughly estimate carbon emissions from the coal utilization phase, as these three major combustion sectors account for more than 77% of China’s coal consumption [37]. Furthermore, the carbon emissions from thermal power plants [26], cement plants [28] and steel plants [27] are calculated taking into account their use of ultra-low emission equipment [38], which makes our results relatively conservative. Another important finding is that the mining phase of coal emits 172.54 million t of carbon, representing approximately 9.28% of the coal life cycle. Although this proportion is small compared to the coal utilization phase, it is important as it has been ignored and difficult to quantify. It is well known that most countries face resistance to phasing out coal [39,40], and our research shows that phasing out coal has significant carbon reduction benefits, particularly in the coal mining phase. Further and stronger coal phase out policies could be a key contributor to China’s carbon peaking and carbon neutrality [14,23,41].
The dominance of coal in China’s energy pattern has led to serious environmental and public health ramifications [42]. A conspicuous finding is that coal phase outs can diminish the incidence of occupational injuries in coal enterprises as well as reduce the associated cost burden [7,8]. Outdoor air pollution is a significant risk factor for mortality in China, accounting for an estimated 7.3 million premature deaths in 2010 [19]. Also, Zhou et al. [43] reported that 1.2 million premature deaths in 2017 were attributed to PM2.5 pollution. Growing research has highlighted the considerable health co-benefits that result from reducing fossil fuel consumption [18,19,21,35]. Previous research has primarily concentrated on the health co-benefits of implementing ultra-low emission strategies during the coal utilization phases, which include thermal power plants, steel plants, and cement plants [17,19,27]. Additionally, these studies have considered various climate scenarios and policy objectives [4,18,44]. For instance, Hui [33] found that China’s carbon reduction policy could prevent 9013–31,320 and 26,061–126,272 premature deaths in 2030 and 2050, respectively, corresponding to health benefits of 18–62% and 1.1–12.3 times the cost of carbon reduction. Another major contribution of this research is the estimation of the health co-benefits generated by the coal mining phase. Specifically, our results find a total of 11,775 avoided premature deaths from 2016 to 2022 due to reduced PM2.5 exposure as a result of coal mining. The diseases are specifically attributed as follows: IHD has a proportion of 70.63%, strokes account for 18.33%, COPD contributes 10.01%, and LC accounts for a mere 1.03%. A certain study forecasts that by 2050 the combined health and environmental advantages in nearly all global regions will surpass the immediate policy expenses associated with ceasing coal usage [18]. Departing from coal usage serves as a particularly worthwhile starting point for climate policy, as it curtails CO2 emissions at a comparably low expense while garnering a majority of local environmental co-benefits [29]. It is noteworthy that carbon discharges stemming from the transportation phase of coal constitute less than 1% of its total life cycle; however, the health benefits remain ambiguous and are contingent upon the population density in the coal-receiving region and emission protocols of the coal-fired power plants [16]. Coal-exporting regions that are closer to developed regions, with sufficient coal resources and low rates of renewable energy technology development, are the regions vulnerable to health impacts, such as Inner Mongolia, Shaanxi, Xinjiang, and Jilin provinces [45]. Consequently, expediting a worldwide coal phase out stands as a strategy that yields prompt and substantial reductions in CO2 emissions. More crucially, the costs associated with this policy are fully offset by the accompanying environmental and health co-benefits. However, during the coal phase out, the employment concerns of workers previously engaged in the coal industry should be taken into account to ensure a just and swift energy transition [23]. For this reason, the near-term sacrifices made by coal workers and impacted communities in the transition, warrant consideration beyond conventional welfare systems or social assistance.
In this study, the synergies between the SDGs are much greater than the trade-offs, contrary to the widely held belief about broad trade-offs [46]. We also provide a case for empirical analysis of the increasingly important but largely neglected issue of spatial interactions in the context of SDG interactions. In addition to reductions in carbon emissions (SDG13), air pollutants (SDG12) and health co-benefit (SDG3), there are a significant number of other important environmental benefits from coal closure that are worth exploring [10,31,41,47]. A previous study found that the water resources co-benefitted from coal de-capacity in China from 2016 to 2022, only taking into consideration the avoided coal mining, and amounted to 3000 million m3 (SDG6) [48]. In addition, coal de-capacity is important to drive the energy transition (SDG12), as China has announced in its National Autonomous Contribution to reach about 20% of primary energy consumption from non-fossil energy sources by 2030 [34]. China’s coal resources and production are concentrated in four major provinces, Shanxi, Inner Mongolia, Shaanxi, and Xinjiang, all of which produce much more than they consume, despite being large coal consuming provinces. Meanwhile, the demand for coal is high in Northeastern China, which relies heavily on heavy industrial development and winter heating, and in developed regions where large numbers of the population need to be maintained for production and living (Figure 10). Coal de-capacitation contributes to the achievement of local SDGs in the area where the coal originates, and it is important to consider that coal de-capacity may have telecoupling co-benefits on the achievement of SDGs in coal receiving regions through the movement of coal between different provinces. Given these significant co-benefits and China’s coal policy, China’s coal phase out is unstoppable and more mines will be closed in the future [15,49,50]. Renewable energy sources—represented by hydro, wind, and photovoltaic power—display characteristics of rapid performance enhancement, continual economic improvement, and accelerated expansion of application scale [51]. Such clean, low-carbon energy serves as a viable coal alternative, particularly when considering the complementary advantages between renewable energy and decommissioned mine sites [52]. These abandoned mines, primarily concentrated in Eastern China, present opportunities for unleashing the potential of renewable energy in a land-scarce environment. The combination of pumped storage and solar power generation will be the future trend of new energy development in China, combining abandoned mines with distributed characteristics and the mine water and height difference they produce [53].

5. Conclusions

In summary, this paper investigated the information on all of the mines closed/phased out in China from 2016 to 2022, estimated carbon emissions and PM2.5 reductions from coal de-capacity using the emission factor method and response concentrations, and calculated the health co-benefits of mine closure/phase out using an integrated exposure–response function. Our results showed that a total of 4027 mines were closed/phased out in Southwest and North China, and a total of 1859 million t of carbon emissions were reduced across the coal life cycle in the coal full life cycles. Furthermore, the reduction in PM2.5 exposure due to less coal mining has resulted in the avoidance of 11,775 premature deaths from 2016 to 2022. Our research holds value for coal-dependent countries or regions worldwide, providing useful references to support global energy transition and climate change mitigation.

Supplementary Materials

The following supporting information can be downloaded at: https://www.mdpi.com/article/10.3390/su16010115/s1, Table S1. Parameters used in the coal mining phase: Table S2. Parameters used in the transportation and utilization phase of coal: Table S3. Classification of provinces or municipalities in China. References [1,54,55,56,57,58,59,60,61] are cited in the Supplementary Materials.

Author Contributions

Conceptualization, Y.Z.; methodology, S.L.; software, D.D.; validation, Y.Z.; formal analysis, G.C.; investigation, G.C.; resources, D.D.; data curation, S.L.; writing—original draft preparation, G.C. and S.L.; writing—review and editing, Y.Z.; visualization, S.L.; project administration, D.D. All authors have read and agreed to the published version of the manuscript.

Funding

This work was supported by a grant from the National Natural Science Foundation of China (Grant No. 41972255).

Institutional Review Board Statement

Not applicable.

Informed Consent Statement

Not applicable.

Data Availability Statement

The datasets are available from the corresponding author upon reasonable request.

Acknowledgments

We thank the anonymous reviewers for their helpful comments that greatly improved our manuscript.

Conflicts of Interest

The authors declare no conflict of interest.

References

  1. Mukherji, A.; Thorne, P.; Cheung, W.W.L.; Connors, S.L.; Garschagen, M.; Geden, O.; Hayward, B.; Simpson, N.P.; Totin, E.; Blok, K.; et al. Synthesis Report of the IPCC Sixth Assessment Report (AR6); IPCC: Geneva, Switzerland, 2022. [Google Scholar]
  2. United Nations. Transforming Our World: The 2030 Agenda for Sustainable Development; United Nations: New York, NY, USA, 2016. [Google Scholar]
  3. Wood, G. The Palgrave Handbook of Managing Fossil Fuels and Energy Transitions; Wood, G., Baker, K., Eds.; Springer International Publishing: Cham, Switzerland; Palgrave Macmillan: London, UK, 2020. [Google Scholar]
  4. Singh, S. Energy Crisis and Climate Change: Global Concerns and Their Solutions. In Energy; Singh, P., Singh, S., Kumar, G., Baweja, P., Eds.; Wiley: Hoboken, NJ, USA, 2021; pp. 1–17. [Google Scholar]
  5. BP. Statistical Review of World Energy 2022; BP p.l.c.: London, UK, 2022. [Google Scholar]
  6. Ministry of Ecology and Environment of the People’s Republic of China. Report on the State of the Ecology and Environment in China 2021; Ministry of Ecology and Environment of the People’s Republic of China: Beijing, China, 2022.
  7. Bosikov, I.I.; Martyushev, N.V.; Klyuev, R.V.; Savchenko, I.A.; Kukartsev, V.V.; Kukartsev, V.A.; Tynchenko, Y.A. Modeling and Complex Analysis of the Topology Parameters of Ventilation Networks When Ensuring Fire Safety While Developing Coal and Gas Deposits. Fire 2023, 6, 95. [Google Scholar] [CrossRef]
  8. Miao, D.; Lv, Y.; Yu, K.; Liu, L.; Jiang, J. Research on Coal Mine Hidden Danger Analysis and Risk Early Warning Technology Based on Data Mining in China. Process Saf. Environ. Prot. 2023, 171, 1–17. [Google Scholar] [CrossRef]
  9. Lin, G.; Jiang, D.; Fu, J.; Dong, D.; Sun, W.; Li, X. Spatial Relationships of Water Resources with Energy Consumption at Coal Mining Operations in China. Mine Water Environ. 2020, 39, 407–415. [Google Scholar] [CrossRef]
  10. Ma, Q.; Wu, J.; He, C.; Fang, X. The Speed, Scale, and Environmental and Economic Impacts of Surface Coal Mining in the Mongolian Plateau. Resour. Conserv. Recycl. 2021, 173, 105730. [Google Scholar] [CrossRef]
  11. Chen, L.; Zhang, H.; Zhang, X.; Liu, P.; Zhang, W.; Ma, X. Vegetation Changes in Coal Mining Areas: Naturally or Anthropogenically Driven? CATENA 2022, 208, 105712. [Google Scholar] [CrossRef]
  12. Feng, Y.; Wang, J.; Bai, Z.; Reading, L. Effects of Surface Coal Mining and Land Reclamation on Soil Properties: A Review. Earth-Sci. Rev. 2019, 191, 12–25. [Google Scholar] [CrossRef]
  13. State Council of the People’s Republic of China. Opinions on the Coal Industry to Resolve Excess Capacity and Achieve Development; State Council of the People’s Republic of China: Beijing, China, 2016.
  14. Hao, X.; Song, M.; Feng, Y.; Zhang, W. De-Capacity Policy Effect on China’s Coal Industry. Energies 2019, 12, 2331. [Google Scholar] [CrossRef]
  15. Diluiso, F.; Walk, P.; Manych, N.; Cerutti, N.; Chipiga, V.; Workman, A.; Ayas, C.; Cui, R.Y.; Cui, D.; Song, K.; et al. Coal Transitions—Part 1: A Systematic Map and Review of Case Study Learnings from Regional, National, and Local Coal Phase-out Experiences. Environ. Res. Lett. 2021, 16, 113003. [Google Scholar] [CrossRef]
  16. Jakob, M.; Steckel, J.C. The Political Economy of Coal: Obstacles to Clean Energy Transitions, 1st ed.; Routledge: London, UK, 2022; ISBN 978-1-00-304454-3. [Google Scholar]
  17. Li, J.; Cai, W.; Li, H.; Zheng, X.; Zhang, S.; Cui, X.; Zhang, Y.; Cao, C.; Sun, R.; Wang, C. Incorporating Health Cobenefits in Decision-Making for the Decommissioning of Coal-Fired Power Plants in China. Environ. Sci. Technol. 2020, 54, 13935–13943. [Google Scholar] [CrossRef]
  18. Rauner, S.; Bauer, N.; Dirnaichner, A.; Dingenen, R.V.; Mutel, C.; Luderer, G. Coal-Exit Health and Environmental Damage Reductions Outweigh Economic Impacts. Nat. Clim. Chang. 2020, 10, 308–312. [Google Scholar] [CrossRef]
  19. Tong, D.; Geng, G.; Zhang, Q.; Cheng, J.; Qin, X.; Hong, C.; He, K.; Davis, S.J. Health Co-Benefits of Climate Change Mitigation Depend on Strategic Power Plant Retirements and Pollution Controls. Nat. Clim. Chang. 2021, 11, 1077–1083. [Google Scholar] [CrossRef]
  20. Tang, R.; Zhao, J.; Liu, Y.; Huang, X.; Zhang, Y.; Zhou, D.; Ding, A.; Nielsen, C.P.; Wang, H. Air Quality and Health Co-Benefits of China’s Carbon Dioxide Emissions Peaking before 2030. Nat. Commun. 2022, 13, 1008. [Google Scholar] [CrossRef] [PubMed]
  21. Markandya, A.; Sampedro, J.; Smith, S.J.; Van Dingenen, R.; Pizarro-Irizar, C.; Arto, I.; González-Eguino, M. Health Co-Benefits from Air Pollution and Mitigation Costs of the Paris Agreement: A Modelling Study. Lancet Planet. Health 2018, 2, e126–e133. [Google Scholar] [CrossRef]
  22. Chen, C.; Xue, B.; Cai, G.; Thomas, H.; Stückrad, S. Comparing the Energy Transitions in Germany and China: Synergies and Recommendations. Energy Rep. 2019, 5, 1249–1260. [Google Scholar] [CrossRef]
  23. He, G.; Lin, J.; Zhang, Y.; Zhang, W.; Larangeira, G.; Zhang, C.; Peng, W.; Liu, M.; Yang, F. Enabling a Rapid and Just Transition Away from Coal in China. One Earth 2020, 3, 187–194. [Google Scholar] [CrossRef] [PubMed]
  24. Liu, Z.; Guan, D.; Wei, W.; Davis, S.J.; Ciais, P.; Bai, J.; Peng, S.; Zhang, Q.; Hubacek, K.; Marland, G.; et al. Reduced Carbon Emission Estimates from Fossil Fuel Combustion and Cement Production in China. Nature 2015, 524, 335–338. [Google Scholar] [CrossRef]
  25. Wang, J. Evaluation of the Suitability of Energy Plant Production and Development on Marginal Land in the Three Gorges Reservoir Area. Master’s Thesis, Southwest University, Chongqing, China, 2018. [Google Scholar]
  26. Tang, L.; Qu, J.; Mi, Z.; Bo, X.; Chang, X.; Anadon, L.D.; Wang, S.; Xue, X.; Li, S.; Wang, X.; et al. Substantial Emission Reductions from Chinese Power Plants after the Introduction of Ultra-Low Emissions Standards. Nat. Energy 2019, 4, 929–938. [Google Scholar] [CrossRef]
  27. Bo, X.; Jia, M.; Xue, X.; Tang, L.; Mi, Z.; Wang, S.; Cui, W.; Chang, X.; Ruan, J.; Dong, G.; et al. Effect of Strengthened Standards on Chinese Ironmaking and Steelmaking Emissions. Nat. Sustain. 2021, 4, 811–820. [Google Scholar] [CrossRef]
  28. Tang, L.; Ruan, J.; Bo, X.; Mi, Z.; Wang, S.; Dong, G.; Davis, S.J. Plant-Level Real-Time Monitoring Data Reveal Substantial Abatement Potential of Air Pollution and CO2 in China’s Cement Sector. One Earth 2022, 5, 892–906. [Google Scholar] [CrossRef]
  29. Tibrewal, K.; Venkataraman, C. Climate Co-Benefits of Air Quality and Clean Energy Policy in India. Nat. Sustain. 2020, 4, 305–313. [Google Scholar] [CrossRef]
  30. Wu, H.; Wang, Q.; Xu, Y.; Ye, Y.; Zeng, X. Coal Life-Cycle Analysis Embedded with Land–Energy Nexus of a Coal-Based City in China. Resour. Environ. Sustain. 2023, 12, 100109. [Google Scholar] [CrossRef]
  31. Cao, C.; Cui, X.; Cai, W.; Wang, C.; Xing, L.; Zhang, N.; Shen, S.; Bai, Y.; Deng, Z. Incorporating Health Co-Benefits into Regional Carbon Emission Reduction Policy Making: A Case Study of China’s Power Sector. Appl. Energy 2019, 253, 113498. [Google Scholar] [CrossRef]
  32. Burnett, R.T.; Pope, C.A.; Ezzati, M.; Olives, C.; Lim, S.S.; Mehta, S.; Shin, H.H.; Singh, G.; Hubbell, B.; Brauer, M.; et al. An Integrated Risk Function for Estimating the Global Burden of Disease Attributable to Ambient Fine Particulate Matter Exposure. Environ. Health Perspect 2014, 122, 397–403. [Google Scholar] [CrossRef] [PubMed]
  33. Hui, J. Research on the Health Impact of Low Carbon Development Based on China’s Provincial Level Power Sector Optimization Model. Ph.D. Thesis, Tsinghua University, Beijing, China, 2018. [Google Scholar]
  34. Xinhua News Agency. Xi Jinping ’s Speech in the General Debate of the Seventy-Fifth United Nations General Assembly; Xinhua News Agency: Beijing, China, 2020. [Google Scholar]
  35. Wang, P.; Lin, C.-K.; Wang, Y.; Liu, D.; Song, D.; Wu, T. Location-Specific Co-Benefits of Carbon Emissions Reduction from Coal-Fired Power Plants in China. Nat. Commun. 2021, 12, 6948. [Google Scholar] [CrossRef] [PubMed]
  36. Wang, N.; Shen, R.; Wen, Z.; De Clercq, D. Life Cycle Energy Efficiency Evaluation for Coal Development and Utilization. Energy 2019, 179, 1–11. [Google Scholar] [CrossRef]
  37. International Energy Agency. Coal 2022—Analysis; International Energy Agency: Paris, France, 2022. [Google Scholar]
  38. Ministry of Ecology and Environment of the People’s Republic of China; National Development and Reform Commission of the People’s Republic of China; National Energy Adminis of the People’s Republic of Chinatration. Work Plan of Full Implementing Ultra-Low Emission Policy and Energy Saving Transformation for Coal-Fired Power Plants; Ministry of Ecology and Environment of the People’s Republic of China: Beijing, China, 2015.
  39. Balakrishnan, V.S. Germany’s Delayed Coal Phase-out and Respiratory Health. Lancet Respir. Med. 2018, 6, 90–91. [Google Scholar] [CrossRef] [PubMed]
  40. Brauers, H.; Oei, P.-Y.; Walk, P. Comparing Coal Phase-out Pathways: The United Kingdom’s and Germany’s Diverging Transitions. Environ. Innov. Soc. Transit. 2020, 37, 238–253. [Google Scholar] [CrossRef] [PubMed]
  41. Zhang, R.; Qie, X.; Hu, Y.; Chen, X. Does De-Capacity Policy Promote the Efficient and Green Development of the Coal Industry? –Based on the Evidence of China. Resour. Policy 2022, 77, 102717. [Google Scholar] [CrossRef]
  42. National Development and Reform Commission of the People’s Republic of China. Contribution of Coal Use to China’s Air Pollution; National Development and Reform Commission of the People’s Republic of China: Beijing, China, 2014.
  43. Zhou, M.; Wang, H.; Zeng, X.; Yin, P.; Zhu, J.; Chen, W.; Li, X.; Wang, L.; Wang, L.; Liu, Y.; et al. Mortality, Morbidity, and Risk Factors in China and Its Provinces, 1990–2017: A Systematic Analysis for the Global Burden of Disease Study 2017. Lancet 2019, 394, 1145–1158. [Google Scholar] [CrossRef]
  44. Cai, W.; Zhang, C.; Zhang, S.; Ai, S.; Bai, Y.; Bao, J.; Chen, B.; Chang, N.; Chen, H.; Cheng, L.; et al. The 2021 China Report of the Lancet Countdown on Health and Climate Change: Seizing the Window of Opportunity. Lancet Public Health 2021, 6, e932–e947. [Google Scholar] [CrossRef]
  45. Zinke, L. Decommissioning Coal. Nat. Rev. Earth Environ. 2020, 1, 626. [Google Scholar] [CrossRef]
  46. Kroll, C.; Warchold, A.; Pradhan, P. Sustainable Development Goals (SDGs): Are We Successful in Turning Trade-Offs into Synergies? Palgrave Commun. 2019, 5, 1–11. [Google Scholar] [CrossRef]
  47. Peng, W.; Wagner, F.; Ramana, M.V.; Zhai, H.; Small, M.J.; Dalin, C.; Zhang, X.; Mauzerall, D.L. Managing China’s Coal Power Plants to Address Multiple Environmental Objectives. Nat. Sustain. 2018, 1, 693–701. [Google Scholar] [CrossRef]
  48. Lin, G.; Fu, J.; Jiang, D.; Zhao, Y. Analysis of Water Synergy Benefits of Coal De-Capacity in China. Coal Sci. Technol. 2023, 51, 1–10. [Google Scholar]
  49. Bridle, R.; Kitson, L.; Duan, H.; Sanchez, L.; Merrill, T. At the Crossroads: Balancing the Financial and Social Costs of Coal Transition in China; International Institute for Sustainable Development: Winnipeg, MB, Canada, 2017. [Google Scholar]
  50. Andrews-Speed, P. China’s Efforts to Constrain Its Fossil Fuel Consumption. In The Palgrave Handbook of Managing Fossil Fuels and Energy Transitions; Springer International Publishing: Cham, Switzerland; Palgrave Macmillan: London, UK, 2019; pp. 109–137. [Google Scholar]
  51. Owusu, P.A.; Asumadu-Sarkodie, S. A Review of Renewable Energy Sources, Sustainability Issues and Climate Change Mitigation. Cogent Eng. 2016, 3, 1167990. [Google Scholar] [CrossRef]
  52. Liang, Y.; Yu, B.; Wang, L. Costs and Benefits of Renewable Energy Development in China’s Power Industry. Renew. Energy 2019, 131, 700–712. [Google Scholar] [CrossRef]
  53. Lin, G.; Zhao, Y.; Fu, J.; Jiang, D. Renewable Energy in China’s Abandoned Mines. Science 2023, 380, 699–700. [Google Scholar] [CrossRef]
  54. GB/T 2589-2020; State Administration for Market Regulation General Rules for Calculation of the Comprehensive Energy Consumption. Standardization Administration of PRC, Standards Press of China: Beijing, China, 2020.
  55. Ma, C.; Dai, E.; Liu, Y.; Wang, Y.; Wang, F. Methane fugitive emissions from coal mining and post-mining activities in China. Resour. Sci. 2020, 42, 311–322. [Google Scholar] [CrossRef]
  56. Cui, X. Carbon emission calculation of China’s coal industry. Energy Conserv. 2022, 5, 33–35+73. [Google Scholar]
  57. Wu, J.; Zhang, Y.; Tian, Y.; Xie, K. Analysis on carbon emission based on the life cycle of new coal chemical industry. Strateg. Study CAE 2015, 17, 69–74. [Google Scholar]
  58. Yin, Z. Research on Carbon Emission Accounting and Reduction Pathways for Coal Products. Master’s Thesis, Capital University of Economics and Business, Beijing, China, 2015. [Google Scholar]
  59. Gao, J.; Xu, X.; Zheng, F.; Huo, R. Coal carbon emission inventory calculation and uncertainties analysis based on lifecycle analysis. China Coal 2017, 43, 22–26. [Google Scholar] [CrossRef]
  60. He, J.; Wu, W.; Xu, Y. Energy consumption of locomotives in China railways during 1975–2007. J. Transp. Syst. Eng. Inf. Technol. 2010, 10, 22–27. [Google Scholar] [CrossRef]
  61. National Bureau of Statistics of the People’s Republic of Chin China Statistical Yearbook-2022; China Statistics Press: Beijing, China, 2023.
Figure 1. Overall framework for multiple co-benefits in the coal phase out process.
Sustainability 16 00115 g001
Figure 2. Spatial distribution of mines closed/phased out in China from 2016 to 2022.
Sustainability 16 00115 g002
Figure 3. China’s coal-related provinces’ de-capacity in 2016–2022.
Sustainability 16 00115 g003
Figure 4. The coal life cycle of reduced carbon emissions in the coal de-capacity in 2016–2022 (millions t). E1: coal bed methane escape; E2: coal extraction and transportation; E3: coal extraction and electricity consumption; E4: coal rail transportation; E5: coal road transportation; and E6: coal utilization phase.
Sustainability 16 00115 g004
Figure 5. Spatial pattern of carbon emissions reduction during coal de-capacitation, 2016–2022.
Sustainability 16 00115 g005
Figure 6. Response concentrations of PM2.5 pollutants.
Sustainability 16 00115 g006
Figure 7. Linear regression equations of coal de-capacity (a) and PM2.5 emission reduction (b) with carbon emission reduction, respectively.
Sustainability 16 00115 g007
Figure 8. Spatial patterns of health co-benefits arising from the coal de-capacity during 2016–2022 at the provincial level (a) and site level (b).
Sustainability 16 00115 g008
Figure 9. Correlation between the number of avoided premature deaths and coal production (a), mine area (b), and mine population (c).
Sustainability 16 00115 g009
Figure 10. Flow of China’s coal resources between different provinces in 2022.
Sustainability 16 00115 g010
Table 1. Health co-benefits of multiple environmental or energy policies.
LiteraturesPoliciesCoal Life CycleJournals
Tang et al. [26]Ultra-low emissions standards policy in plant powerCoal utilizationNature Energy
Bo et al. [27]Ultra-low emissions standards policy in ironmaking and steelmakingCoal utilizationNature Sustainability
Tang et al. [28]Ultra-low emissions standards policy in cement sectorCoal utilizationOne Earth
Tibrewal et al. [29]Biomass cooking, curbing brick production and agricultural residue burning emissions-Nature Sustainability
Tang et al. [20]Different carbon emission reduction pathways-Nature Communications
Rauner et al. [18]Coal-exit reductionsCoal transportationNature Climate Change
This studyMine closures, de-capacityCoal miningSustainability
Table 2. The parameters employed within the integrated exposure–response function.
Disease σ m , 1 σ m , 2 σ m , 3 c 0 , m
LC33.490.000050131.01287.24
COPD29.000.000593800.67867.17
Stroke1.010.017400001.12448.38
IHD0.830.071700000.55166.96
Table 3. Number of premature deaths from four diseases averted by coal de-capacity in China, 2016–2022.
YearsIHDStrokeCOPDLCTotal
20174336.08631.75563.5252.415583.76
20203692.821286.69544.3561.155585.01
202123.580.132.020.1125.84
2022264.34240.7567.987.17580.24
Total8316.822159.321177.87120.8411,774.85
Table 4. Number of premature deaths from the four diseases avoided at the provincial level in China, 2016–2022.
Province2017202020212022Total
Henan3017.770.000.000.003017.77
Yunnan0.001577.640.000.001577.64
Shandong0.001179.420.000.001179.42
Sichuan0.001118.030.000.001118.03
Hunan320.34654.130.000.00974.47
Inner Mongolia0.00846.080.0072.24918.32
Guizhou885.040.000.000.00885.04
Shanxi872.810.000.000.00872.81
Xinjiang39.170.0025.84508.00573.01
Liaoning338.790.000.000.00338.79
Fujian109.84181.660.000.00291.50
Heilongjiang0.0028.050.000.0028.05
Total5583.765585.0125.84580.2411,774.86
Disclaimer/Publisher’s Note: The statements, opinions and data contained in all publications are solely those of the individual author(s) and contributor(s) and not of MDPI and/or the editor(s). MDPI and/or the editor(s) disclaim responsibility for any injury to people or property resulting from any ideas, methods, instructions or products referred to in the content.

