Article

Spatial Distribution and Sources of Growth of Dairy Farming in the State of Pará, Brazil

by
Amanda Mendonça de Oliveira
1,
Marcos Antônio Souza dos Santos
2,
Jamile Andrea Rodrigues da Silva
2,
Wânia Mendonça dos Santos
1,
Thomaz Cyro Guimarães de Carvalho Rodrigues
1,*,
Welligton Conceição da Silva
1,
Sheryle Santos Hamid
1 and
José de Brito Lourenço-Júnior
1
1
Postgraduate Program in Animal Science (PPGCAN), Institute of Veterinary Medicine, Federal University of Para (UFPA) , Castanhal 68746-360, Brazil
2
Institute of Animal Health and Production, Federal Rural University of the Amazon, Belém 66077-830, Brazil
*
Author to whom correspondence should be addressed.
Sustainability 2024, 16(1), 122; https://doi.org/10.3390/su16010122
Submission received: 28 September 2023 / Revised: 27 November 2023 / Accepted: 28 November 2023 / Published: 22 December 2023

Abstract

:
The characterization of dairy farming is fundamental for the sector, as the information obtained directs institutional and public policy actions, which contribute to the development of the milk production chain. The objective of this research was to highlight and analyze two points: identify the spatial concentration of production and investigate the existence of centers specializing in milk production; evaluate the sources of growth in dairy farming in micro-regions of Pará and verify their participation in the growth and productivity of the herd. Regarding specialization in milk production, in the initial year of the study, there were nine specialized micro-regions; however, in the final year, only six fell into this classification, being Parauapebas, Marabá, Tucuruí, Redenção, São Félix do Xingu, and Altamira. Southeastern Pará stands out as the main dairy hub in the state, which encompasses municipalities with a tradition in dairy farming, such as Água Azul do Norte, the largest state producer since 2012. The effective growth in milk production from the 1990s to 2020 showed an increase in state production of 3.23% per year, with a greater contribution to this growth in herd productivity gains than in relation to the expansion of the herd; however, ten micro-regions presented a negative average annual growth rate, being located in the Northeast of Pará, Marajó, and the Metropolitan Region of Belém, a result resulting from the reduction of the herd expansion effect, as the productivity effect of all micro-regions exhibited positive rates, with the exception of Cametá and Arari. The sharpest decline occurred in Arari, with a sharp drop in milk production, number of animals milked, and cow yield. The twelve micro-regions with positive annual rates are located in the mesoregions of Southeast Pará, Southwest Pará, and Baixo Amazonas, nine associated with intensive growth and three more linked to extensive growth. In general, the results show that the regions specialized in the activity are more articulated, presenting the highest percentages in terms of quantity produced, herd milked, and financial movement, compared to non-specialized locations. Through analyses, it is possible to obtain a better understanding of the regional growth process, with a focus on dairy activity, as the information and particularities of properties are fundamental to guide public and private institutions on the reality and existing problems, enabling readjustment and new policy formulations with the aim of alleviating producers’ limitations, as well as enhancing growth and reducing intra- and inter-regional imbalances.

1. Introduction

Rich in calcium, vitamins, and proteins, milk is the most consumed food in the world [1]. Therefore, its production chain has high socioeconomic importance in generating jobs and income. In Brazil, the third largest dairy producer in the world, it is estimated that 4 million workers are involved throughout the chain, which produced approximately 35.3 billion liters in 2021 [1].
The activity is widely spread across Brazilian territory, with the highest concentration (%) in the states of Minas Gerais (27.34), Paraná (13.09), Rio Grande do Sul (12.1), Goiás (9.0), and Santa Catarina (8.85), responsible for 70.38% of national production. It is an activity that presents peculiar characteristics, marked by the immense structural difference in the means of production, varying according to the socioeconomic, climatic, and cultural conditions of each region and producer [2,3].
Dairy farming in Brazil is largely developed on small family farms that produce little, with the minority of medium- and large-scale producers accounting for the largest volume of milk produced. Furthermore, the activity is diverse in terms of herd specialization, technologies used in the process, product quality and management, and form of organization of those involved in the production chain, with some being integrated into the vertical and/or horizontal form of production. In fact, some producers do not have dairy production as their main productive branch, making it difficult to group by scale, herd specialization, and adoption of technological instruments to represent the dairy production chain, even in dairy basins [4,5].
In the Amazon states, dairy farming is closely linked to family farming with diversified production systems and the exploitation of annual and perennial crops. According to [6], the heterogeneity in these states is more pronounced due to the majority of production being carried out by small producers. The obstacles for small properties are related to the price of the product, since prices are lower when compared to large productions, as well as they purchase inputs at higher prices, making it difficult to adopt technologies on these properties. Producers who are unable to keep up with modernization end up selling their products in the informal market or, in some cases, leading to their exit from the dairy production sector [4].
The state of Pará is the second producing state in the regional ranking, being responsible for 28.21% of production; in third place is Tocantins, with 19.88%; and in first, Rondônia, contributing 46.92% of the quantity produced. Together, they represent 95.01% of the total produced in the north region. The development of regional dairy activity can replace the import of dairy products from other regions of the country, avoiding high transport costs and contributing to local production movement [2,7].
In these three states, a small number of properties have specialized herds, but technological advances have occurred, made possible through financial incentives and the adoption of correct health and pasture management techniques. Highlighting the state of Pará, the activity has shown intense growth since the 1970s due to factors linked to the lower opportunity cost of land and labor, ease of access to rural credit, strengthening and expansion of the dairy agroindustry, and the possibility of developing cattle breeding with dual aptitude, a positive point for producers, with another income alternative, changing according to the conditions imposed by the market, making the activity attractive, especially for family farming [6,8].
In 2020, state production reached 600 million liters of milk, concentrated in the mesoregion of Southeast Pará, responsible for 70.17% of the total. The Southwest Parense and Lower Amazonas Mesoregions contributed 13.11% and 11.97%, respectively. The smallest shares occur in the Northeast of Pará, Marajó, and Metropolitana de Belém, with 2.66%, 1.40%, and 0.69%, accounting for 4.75% of the quantity of milk produced. Over the last three decades, dairy production has shown significant progress, approximately 159.47% [1].
Growth in milk production can occur through two means: the first is by increasing the number of cows milked, called extensive growth; the second is by increasing the yield of each animal, resulting in increased productivity, classified as intensive growth, or by the combination of these two means. Measuring this growth is possible by decomposing the two effects that influence milk production, being the herd expansion effect, given by quantifying the increase in the herd of milked cows and the animal productivity effect, defined by L/cow/year [9].
Given the relevance and expansion of dairy activity in the state of Pará, this research was developed with the objective of highlighting and analyzing two points: (1) identify the spatial concentration of production to ascertain the existence of hubs specialized in milk production; (2) evaluate the sources of growth in dairy farming in the micro-regions of Pará, with the purpose of verifying the participation in growth of the herd expansion effect and productivity effect.

2. Materials and Methods

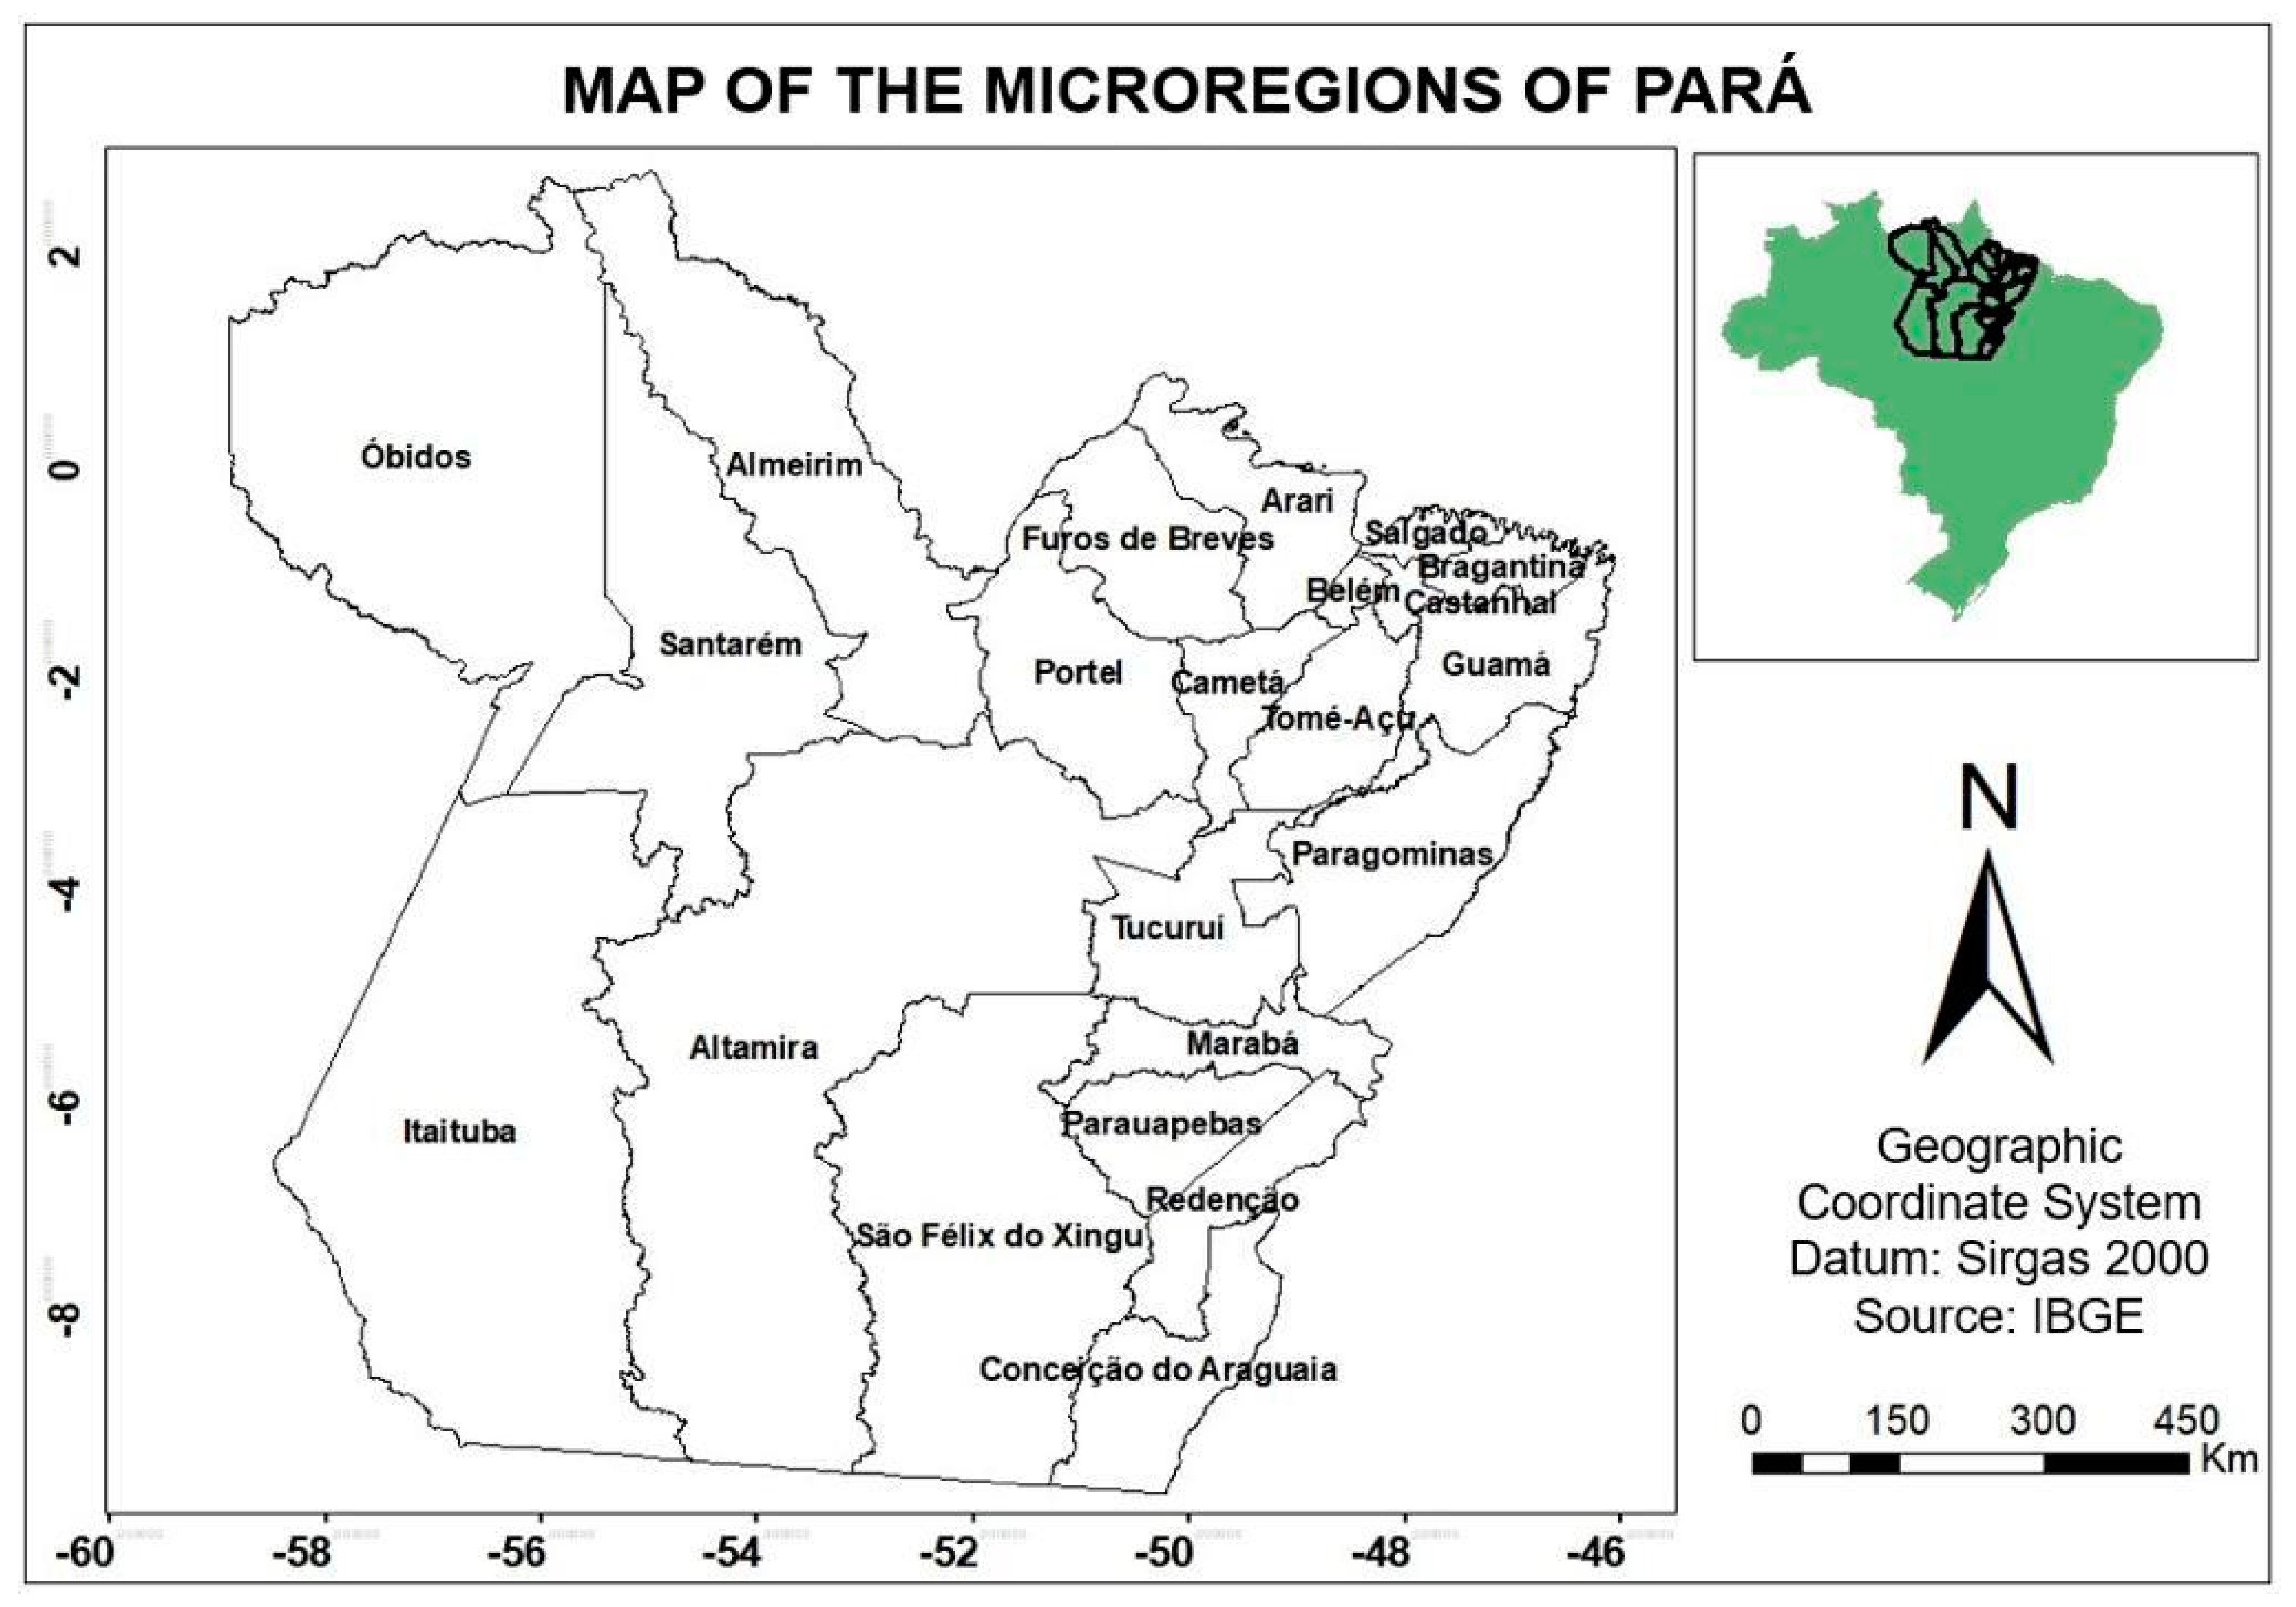
2.1. Study Area and Data Sources

The state of Pará is made up of 6 mesoregions, distributed in 22 micro-regions (144 municipalities), with approximately 1,245,870 km2 (second largest state in Brazil) and 8,602,865 inhabitants [10]. The research area is made up of 22 micro-regions of Pará (Figure 1).
The research was based on the collection of secondary data from the Brazilian Institute of Geography and Statistics (IBGE), the country’s main data and information provider, with information from the Agricultural Census between 2006 and 2017 and the Municipal Livestock Survey (PPM), with elements available from dairy farming. For plotting and formulating graphs and tables, the Microsoft Office Excel 2016 package was used.

2.2. Analysis Models

Analysis of Indicators of Spatial Distribution and Specialization of Dairy Farming

Information regarding establishments with dairy production in the micro-regions of the state of Pará (IBGE). Subsequently, the Locational Quotient and Locational Gini were adopted. According to Crocco et al. [11], the indicators (QL and GL) verify spatial distribution, identify regional specializations, and map regional changes in economic activities, which may be due to processes of economic concentration or decentralization.
The QL is a traditional indicator in regional economic studies, with the purpose of determining the relative specialization of a location, in relation to the region to which it belongs, in order to make a comparison between the two spaces in relation to certain economic activities.
To calculate the levels of specialization of the micro-regions that develop dairy farming in the state of Pará, the formula was used whose base variable is the value of VP production:
Q L = V P i j V P j V P i V P
where VPij = value of milk production in micro-region j; VPj = value of agricultural production in micro-region j; VPi• = value of milk production in Pará; VP•• = value of agricultural production in Pará.
Milk production data in each micro-region were taken from the IBGE Automatic Recovery System. For the value of agricultural production, the values of all available data on Pará production were added.
QL results greater than 1 mean that the micro-region (j) has greater relevance in the state context of dairy activity, in relation to total agricultural activity, which can be classified as specialized in the milk production chain. If the QL result is less than 1, it means that the micro-region is not specialized in dairy production.
The Locational Gini is an indicator of the spatial concentration of a certain activity or economic sector [12]. This calculation was used to measure the spatial distribution of each micro-region in the state of Pará, in relation to the milk production chain, with the same basic QoL information.
The GL varies from 0 to 1. The closer to one, the activity of high concentration is considered [11,13]. Therefore, it can be concluded from this work that when the analysis found is close to 1, the more concentrated the activity is. The results found can be explained as follows:
GL close to 1: the activity is more concentrated (it is not uniformly distributed in the micro-regions of the state of Pará). It is GL close to 0: less concentrated is the activity (it is uniformly distributed in the micro-regions of the state of Pará).
When calculating the GL, it is necessary to organize the micro-regions in decreasing order of QL, constructing the so-called location curve. For this, it is necessary to define the variables X and Y, which represent accumulated proportions [12,13,14].
On the horizontal axis, it represents the variable resulting from the denominator of the QLs (VP•j and VP••). In this way, with the value of the indexes calculated for each micro-region, the accumulated proportion of these values can be calculated on the X axis of the location curve diagram. The vertical axis displays the variable Y, which depicts the accumulated proportion of milk production in each micro-region j in the state’s milk production, comes from the numerator of the QLs (VPij and VPi•). Then, with the results of the indices for each micro-region, the accumulated proportion of these values can be calculated on the Y axis of the diagram.
If the percentage values (vertical and horizontal axis) presented are the same, the location curve will cross the 45-degree diagonal that is drawn from the origin of the axes. If the values are different, it will result in a location curve placed higher and to the left of the diagonal, thus demonstrating the magnitude of the distance, as it will indicate greater or lesser concentration (Figure 2).
Axis Y: Accumulated share of the value of milk production in each micro-region j in state milk production; Axis X: Share of the value of the agricultural activity of each micro-region j in state agriculture.
The next step is to determine the GL concentration, shown by ∝ on the graph. It is calculated as follows: first, the total area above ∝, which is the area of each triangle and trapezoid formed above and to the left, as represented by Sj:
S j = X j + X j 1 × Y j Y j 1 2
S is obtained by adding the areas Sj:
S = j = 1 n X J + X J 1 × Y J Y J 1 2 = j = 1 n S j
where n is the number of micro-regions (j = 1, 2, …, 22, in this study).
Then, α is given by:
α = 0.5 − S
By definition, GL is the ratio of the concentration area (α) and half the area of Figure 1 (corresponds to 0.50). Like this:
GL = α/0.5 = 2α

2.3. Analysis of Sources of Growth in Dairy Farming

The statistical model used was the shift-share or structural differential method, based on the article by Moura and Santos [12], adopting that the variation in milk production can be due to the size of the dairy herd or changes in individual productivity. Based on the variant of the method used in the aforementioned author’s study, the analyzed variation in milk production (∆Q), in a given period, can be simulated as follows:
∆Q = Qt − Q0
Q0 and Qt are, simultaneously, milk production in the initial year (year 0 of the research) and in the final year (year t of the research), in a given period of interest.
The information is taken from IBGE on the quantity of milk produced (Q) and the total number of cows milked (CM), referring to each year, thus calculating the herd productivity (PDT). The calculation performed for each year (0 and t) is as follows:
Q0 = CM0 × PDT0
Qt = CMt × PDTt
The variation in production, between these two periods, is found with the formula:
∆Q = (CMt × PDTt) − (CM0 × PDT0)
If the variation occurs exclusively from the variation in the number of cows milked, production in year t will be equal to:
QCM = CMt × PDT0
This will give rise to the herd expansion effect (HEE):
HEE = QCM− Q0
or
HEE = (CMt × PDTt) − (CM0 × PDT0)
The productivity effect (PE) is acquired per residue, subtracting it from the milk production in year t, the variation occurs exceptionally in the number of cows milked:
PE = Qt − QCM
or
PE = (CMt × PDTt) − (CMt × PDT0)
It will reflect the variation in milk production resulting solely from the increase in productivity. Moura and Santos [12] mention that Q0 and Qt are observable values, while QCM is an unobserved (hypothetical, estimated) value.
With the HEE and PE results, presented in absolute form, their sum will correspond to the total variation observed in milk production:
(Qt − Q0) = HEE + PE = (QCM − Q0) + (Qt − QCM)
The results obtained will be described in average annual growth rates, thus being expressed as a percentage. Therefore, both sides of Equation (15) are divided by (Qt− Q0). Subsequently, both sides are multiplied by:
r = Q t Q 0 1 P   100
r = average annual growth rate of milk production in %;
p = root index (extension of the analysis period).
Obtaining it this way:
r = ( Q C M   Q 0   ) ( Q t Q 0 )   r + ( Q t Q C M ) ( Q t Q 0 ) r
The first term represents HEE (right side) and the second PE (left side), expressed as a percentage.

3. Results

3.1. The Specialization of Dairy Production in the Micro-Regions of Pará

The QL results highlight the micro-regions specialized in dairy activity, QL ≥ 1, calculated from the latest Agricultural Censuses [15,16]. The sectoral dynamics, referring to milk production in the 22 micro-regions of Pará, portray a heterogeneous expansion, changing the map of the geographic distribution of state activity. In 2006, nine micro-regions were classified as specialized, but in 2017, only six were classified.
In 2006, the specialized micro-regions were Santarém, Furos de Breves, Arari, Altamira, Tucuruí, Paragominas, Parauapebas, Marabá, and Redenção (Table 1). It is worth highlighting the remoteness of specialized locations from four micro-regions: Santarém, Furos de Breves, Arari, and Paragominas, and the entrance to São Félix do Xingu.
In the state of Pará, over the years, there was the formation of some centers that stand out in the quantity produced, such as Redenção, Parauapebas, and Paragominas, both located in the Southeast of Pará (first, second, and third in the state production ranking in 2020). However, when analyzing the leading micro-regions in productivity, Redenção stands out, with 1037 L/cow/year, followed by Altamira with 1008 L/cow/year and Itaituba with 932 L/year (Table 2).
The state’s main dairy basin is in the mesoregion of Southeast Pará, where the micro-regions of Redenção, Parauapebas, Paragominas, Marabá, Tucuruí, São Félix do Xingu, and Conceição do Araguaia are located. Five of them had QL ≥ 1 in 2017, covering municipalities with a tradition in dairy farming, such as Água Azul do Norte (largest state producer since 2012). Likewise, São Félix do Xingu has the largest cattle herd at the municipal level (2.4 million), with Marabá also standing out, with 1.3 million animals in 2020 [2].

3.2. The Spatial Concentration and Characteristics of Dairy Production in Pará

The concentration levels of milk production in the micro-regions of the state of Pará were obtained using Locational Gini calculations (close to 1 indicates high concentration of production; close to 0 represents decentralization of production, being evenly distributed).
The spatial distribution index of activity for the years 2006 and 2017 had a significant increase of 88%. However, the index is still below 0.5, indicating that milk production in Pará is decentralized, but tends to be concentrated; that is, it is more unequal when compared to the initial period.
The largest number of dairy establishments in Pará is in the range of less than 50 hectares, also concentrating the most significant percentage of cows milked and quantity produced, highlighting their importance in supplying the state (Table 3).
With the classification of micro-regions into specialized and non-specialized in dairy activity, the 2017 data reveal 6 specialized micro-regions and 16 non-specialized ones. To verify the importance and economic participation, Table 4 shows activity information according to the division based on the QL index.
The specialized micro-regions hold the highest percentage of the milked herd, and the quantity produced is greater in these locations (78.27% of the milk produced in the state in 2017). In relation to productivity, the state has a low rate in both regions (specialized and non-specialized), with an average of 740.63 L/cow/year and 534.54 L/cow/year, respectively.
The Agricultural Census typifies family and non-family farming establishments (Law 11,326/2006), which regulates and establishes the National Policy for Family Farming and Rural Family Enterprises. The law defines the family unit as a set of individuals in the same family who exploit a combination of production factors for their own subsistence and for society, providing food and/or other goods and services, residing in the location or nearby [17].
The significant participation of family farming in milk production, with 28,308 thousand properties, 74.52% in specialized micro-regions, and the largest quantity of milk produced (375,064 thousand L) (Table 5). There are 7055 thousand non-family establishments, 74.54% in specialized regions, producing 131,171 thousand L.
Specialized micro-regions have the majority of production and value of milk production, regardless of classification (family farming or not). The gross value of production indicates that the largest economic movement of dairy activity occurs in the six locations, with 74.47% from family farming and 69.77% from non-family farming (total state income).
The sale of dairy products is greater in the six micro-regions, and the highest percentage of establishments that sell raw milk is observed in specialized micro-regions (77.03%), and in non-specialized regions only 22.97% (Table 6). Likewise, there is a predominance of the six locations in relation to the raw milk sold (80.63%), accompanied by a production value of 77.10%.
It should be noted that not all raw milk produced in the country, and especially in the state of Pará, is purchased by dairy companies under sanitary inspection. Informal milk is sold clandestinely in open-air markets, bakeries, and grocery stores and supplied to dairies. According to the Municipal Livestock Survey [18], the quantity of raw milk purchased by authorized dairies was 24.3 billion liters; however, total production was estimated at 33.5 billion L.
The sale of raw milk must follow the rules established by the Ministry of Agriculture, Livestock and Supply (MAPA), referring to the new standards, IN 76 and 77, published on 30 November 2018, with criteria for obtaining quality and safe milk for the consumer, involving aspects ranging from the production process on rural properties to the way raw materials are processed in industry.

3.3. Sources of Growth in Dairy Farming in Pará

The application of the shift-share method made it possible to identify and decompose the growth of milk production in the state of Pará and micro-regions, presented and discussed in a given period and sub-periods, starting the analyses in the period from 1990 to 2020, subsequently the 10-year sub-periods (1990–2000; 2000–2010; and 2010–2020), in order to detect possible differences.
Between 1990 and 2020, milk production in Pará grew by 3.23% per year, growth due to gains in herd productivity, explained by the productivity effect (PE) of 2.85% per year, complemented by the herd expansion effect (HEE), recording a value of 0.38% per year. Thus, 88.24% is linked to the increase in animal productivity and 11.76% to the increase in the number of cows milked in the herd.
Table 7 shows the average annual growth rates of production of milk in the 22 micro-regions of Pará. It is possible to observe that of the total micro-regions analyzed, ten presented negative average annual growth rates, portraying the decrease in production, and despite that most of these had a negative HEE, the productivity effect (PE) was positive; however, this was not enough to overcome the reduction in the dairy herd. Arari showed a retraction in both effects, and Cametá showed an increase in the expansion of cows and a decline in productivity. This behavior reflects the low participation of these micro-regions in the share of the total amount of milk produced in the state of Pará, which was only 4.75%.
The other micro-regions, totaling 12, showed a positive average growth rate. Of these, nine recorded an average above the state, being Parauapebas, Almeirim, São Félix do Xingu, Itaituba, Tucuruí, Óbidos, Marabá, Santarém, and Redenção, and the remaining three that showed a lower average growth, compared to the state average, were Altamira, Conceição do Araguaia, and Paragominas. This result highlights the heterogeneity of primary dairy production in the state of Pará, portrayed in the rates: twelve with satisfactory growth, and among these, nine with growth above the state average rate and three below the average, followed by ten with negative rates, but some with gains of cow productivity.
The micro-regions that show the highest growth rates are located in Southeast Pará (Parauapebas, São Félix do Xingu, Tucuruí, Marabá, Redenção), Baixo Amazonas (Almeirim, Óbidos, Santarém), and Southwest Pará (Itaituba), contributing 72% of the total milk produced in the state of Pará in 2020. The importance of Paragominas, Altamira, and Conceição do Araguaia is highlighted, which despite showing growth rates below the state average, are responsible for 10.74%, 8.52%, and 4.43%, together representing 23.69% of production.
In relation to the productivity effect, twenty micro-regions of Pará showed gains over the thirty years of the analysis, ranging from 0.07% to 7.56% of growth, with the state’s annual average productivity being 2.85%, with only two micro-regions with a negative productivity effect (Cametá and Arari). In relation to the herd expansion effect, nine micro-regions increased, and thirteen showed a decline in the number of cows, with a sharper drop in Salgado, with an HEE of −7.88% per year.
The Arari micro-region was the only one that showed a decline in milk production, a decrease in the number of milked cows, and a reduction in animal performance (1990 to 2020). The highest average annual growth rate was in Parauapebas (8.97% per year), with a PE of 5.25% per year and an HEE of 3.72%. Marabá recorded the biggest herd expansion (HEE of 4.56% per year) and Itaituba the biggest increase in the productivity effect (PE of 7.56% per year).
In general, the ten drops in production are located in the Northeast of Pará, Marajó, and the Metropolitan Region of Belém. The biggest increases occurred in regions with strong livestock farming or in intense development of dairy activity, including the intensification of the system (Santarém, Almeirim, Itaituba, Altamira, Paragominas, São Félix do Xingu, Parauapebas, Redenção, and Conceição do Araguaia) and three linked to the increase in the extensive system (Óbidos, Tucuruí and Marabá).
The period from 1990 to 2020 is disaggregated into three sub-periods: 1990–2000, 2000–2010, and 2010–2020 (Table 8). It is noted that in the first sub-period (1990–2000), the average annual growth rate of state production was higher than the period as a whole, with a rate of 5.09%; much of it comes from a PE of 3.8% per year, filled by an HEE of 1.29% per year, with growth in this period in fourteen micro-regions, and eight with negative rates. The highest growth rate was in São Félix do Xingu, with 31.82% per year (PE of 17.11% per year, and HEE of 14.71% per year), and the most intense retraction was 18.47% per year, (HEE of -18.01% per year, and PE of −0.46% per year in Salgado. It is also observed that, among the fourteen locations, in nine, the productivity effect predominated, and in five, the herd expansion effect prevailed.
In the second sub-period (2000 to 2010), production expanded by 4.01% per year, and the largest part of the growth occurred due to animal productivity (4.4% per year), with a decrease in the number of herds (−0.39% per year). When analyzing only the micro-regions, fifteen were positive; among these, eight had a significant portion of extensive growth, and seven were linked to the productivity effect and growth of the intensive system.
In relation to the average annual negative rates, seven micro-regions showed a drop. Negative rates ranged from −0.52% to −8.18% per year (Portel, Furos de Breves, Arari, Belém, Tomé-Açu, and Guamá). The drop in production is associated, above all, with the decrease in the number of herds, with the exception of Bragantina, which increased the number of cows by 0.53%, but there was a drop in productivity (−1.17% per year). In this sub-period, the micro-regions of Guamá and Arari showed a reduction in three segments: quantity of milk produced, number of cows milked, and productivity. Tucuruí, Almeirim, Marabá, Parauapebas, Óbidos, Castanhal, Salgado, and Santarém stood out for their best performances, with a rate above the state rate (4.01%), a fact linked to the effect of herd expansion and productivity gains. It is noteworthy that this sub-period was the only one with a drop in the number of animals (−0.39% per year).
In the last sub-period (2010 to 2020), the average annual growth rate was lower than the others (0.64%), with a drop of approximately 3.37 percentage points, compared to the previous sub-period. A notable moment, too, as part of the production is linked to the expansion of the herd and the drop in the productivity effect (HEE of 0.64%; PE of −0.05% per year).
Among the twenty-two micro-regions analyzed, thirteen showed negative performance, representing the decade with the smallest advances, both in the number of animals and herd productivity. The regions that showed growth were Lower Amazonas (Santarém, Almeirim, and Óbidos), Southwest Pará (Altamira and Itaituba); Southeast (Marabá, Parauapebas, and Tucuruí) and Northeast (Cametá). Altamira had the highest percentage in the productivity effect (5.16%), and Cametá in the herd expansion effect (8.98%). However, the biggest decline in productivity was also in this location (−8.21% per year). Arari, Belém, Castanhal, Guamá, and São Félix do Xingu saw a decline in production, milked cows, and productivity.
When analyzing the period and sub-periods, changes are noticed that only with this analysis become clear, such as the greatest retraction in growth at the state level that occurred in sub-period three (2010–2020) due to thirteen micro-regions presenting negative average rates. The ten years referring to sub-period two (2000–2010) were those with the greatest reduction in the herd of milked cows in Pará, but did not affect production growth due to the increase in the animals’ productive performance. Satisfactory advances were recorded in fifteen regions, both in terms of livestock and productivity. The first sub-period (1990–2000) presented the best average annual growth rate (5.09% per year of the entire period evaluated, referring to state progress (higher effect on productivity, lower on herd expansion).
The average annual growth rates (Southwest and Lower Amazonas) showed positive percentages in all sub-periods, and those in the Southeast showed some reductions: between the years 1990 and 2020, only in Altamira, and in 2010 to 2020, in São Félix do Xingu, Paragominas, Redenção, and Conceição do Araguaia. The micro-regions of the Northeast of Pará, Marajó, and the Metropolitan Region of Belém presented a low percentage, for the most part, with negative rates over the thirty years. The intense decline, throughout this historical series, of the Arari micro-region stands out, with a reduction in the three indicators analyzed.

4. Discussion

According to Valdo et al. [19], micro-regions that obtain high Gini coefficient results exhibit a greater geographic concentration of dairy activity, indicating greater chances of production systems being more specialized. Marion Filho et al. [20] emphasize that greater regional centralization of production favors increased specialization. However, the results found in this research were the opposite of the authors’ statement, as there was an increase in the spatial concentration of activity in the state of Pará; however, there was a decline in micro-regions specialized in milk production.
The decrease in specialization in dairy activity in the Arari and Furos de Breves micro-regions, both located in the Marajó mesoregion, is linked to the gradual decrease in the cattle herd and the increase in buffaloes, given that, in this region, there is a predominance of buffalo farming, especially by edaphoclimatic conditions in the Marajó region, with the economy revolving around buffalo farming.
In the Paragominas micro-region, dairy farming has been losing space to other agricultural activities, such as soybean, corn, and eucalyptus crops. In general, the agriculture and forestry sectors cause a decrease in the specialization of dairy farming. A similar situation occurred in the Santarém micro-region, which is one of the main expansions of agricultural frontiers in the Amazon, intensifying grain production, driven by the BR-163 highway, connecting the municipalities of Santarém/Pará to Cuiabá/Mato Grosso and the waterway port of Santarém, assists in the flow of production, affecting the reduction of improvement in the dairy sector [21,22].
On the other hand, the inclusion of the São Félix do Xingu micro-region among those specialized in dairy activity is related to the predominance of large cattle properties in the region, conditioned by policies and programs for the colonization of the Amazon in previous decades, making the agriculture-livestock system of the main economic activities in the region [23], contributing to the formation of the main dairy basin in the state of Pará located in the Southeast Pará mesoregion, in which the micro-regions of Redenção, Parauapebas, Paragominas, Marabá, Tucuruí are located, São Félix do Xingu and Conceição do Araguaia. The concentration of production in the mesoregion of Southeastern Pará is linked to productivity gains, rather than to the effect of the herd of milked cows, referring to the years 1990 to 2008 [6].
With the existence of the activity in all micro-regions of Pará and the low productive capacity portrayed by the studied micro-regions, it is of fundamental importance to evaluate in more detail the productive structure of each region, to encourage improvements in credit policies for the sector [6], since instruments to support the development of the dairy sector, such as rural credit from the Northern Constitutional Financing Fund (FNO), being one of the main sources of availability of rural financial resources destined for the states in the Northern region of Brazil, which can result positively in improving dairy production.
Bearing in mind that the credit is directed to several smaller-scale producers, with a focus on family farming, companies that use local labor and raw materials, focused on the production of basic foods and projects designed for environmental sustainability [6], dairy farming corresponds to this context, with peculiarities that favor growth without expanding new agricultural frontiers, through deforestation.
Dairy farming in Pará is developed, for the most part, on small family properties, with a low degree of organization; that is, each farmer negotiates their products individually, thus obstructing the obtaining of better prices for milk, a value that varies between harvest and off-season, ending with a suboptimal amount paid [24]. Consequently, the specialization of micro-regions is affected, resulting from the majority of small producers due to the lack of organization and structuring, mainly generating difficulties in introducing technologies and acquiring specialized dairy herds.
In this circumstance, the results of the last decade are worrying, with the need to seek alternatives for milk production to return to significant growth, highlighting the productivity effect in relation to the expansion of the herd. Therefore, obtaining better results requires actions based on the transfer of technologies, which must be carried out according to the reality of producers, with the aim of increasing the production and quality of milk while at the same time improving the economic, social, and environmental indicators of production in Pará [25].

5. Conclusions

Given the regional aspects highlighted in this research, dairy activity in Pará is performing below its productive potential, failing to meet the state’s demand. Despite significant growth over the decades of the study, the changes achieved are still far from the intensive production systems practiced in the country’s main dairy basins. In this way, the information and particularities of properties are fundamental to guide public and private institutions in relation to the reality and existing problems, enabling the readjustment of financial and technical support policies, with the objective of enhancing growth, associated with the reduction of intra- and inter-regional imbalance.
The work clearly highlights the fluctuations that occur within the milk production chain in the state of Pará; the difficulties encountered by family farming, which is the majority in the state, and the need for public and/or private policies with the aim of enhancing productive growth, but aligned with science. In this way, growth would be in fair accordance with current laws, environmental respect, and sustainability. There are many examples inside and outside the country, where there is a reduction in herds and a reduction in grazing areas, in line with the increase in animal productivity. This is possible with the work of genetic improvement of herds and intensification of systems, which can even use co-products from the agony industry to supplement animals.

Author Contributions

Conceptualization, M.A.S.d.S., J.A.R.d.S., S.S.H. and J.d.B.L.-J.; Methodology, M.A.S.d.S.; Software, M.A.S.d.S.; Validation, J.A.R.d.S. and W.C.d.S.; Formal analysis, S.S.H.; Investigation, A.M.d.O., W.M.d.S. and S.S.H.; Data curation, A.M.d.O. and W.M.d.S.; Writing—original draft, A.M.d.O., W.M.d.S. and W.C.d.S.; Writing—review & editing, T.C.G.d.C.R. and W.C.d.S.; Visualization, J.A.R.d.S. and T.C.G.d.C.R.; Supervision, T.C.G.d.C.R. and J.d.B.L.-J.; Project administration, J.d.B.L.-J. All authors have read and agreed to the published version of the manuscript.

Funding

This study received financial support for publication fee from Pró-Reitoria de Pesquisa e Pós-Graduação (PROPESP/UFPA Funding number—02/2023). Also, A.M.d.O. received scholar-ship from the Coordenação de Aperfeiçoamento de Pessoal de Nível Superior (CAPES)–Braszil (Finance Code 001).

Institutional Review Board Statement

Not applicable.

Informed Consent Statement

Not applicable.

Data Availability Statement

The data presented in this study are available upon reasonable request from the corresponding author.

Acknowledgments

To the Programa de Pós-Graduação em Ciência Animal–PPGCAN-UFPA/Embrapa/UFRA; Dean of Research and Graduate Studies (PROPESP/UFPA); Fundação Amazônia de Amparo a Estudos e Pesquisas (FAPESPA).

Conflicts of Interest

The authors declare no conflict of interest

References

  1. FAO. Food and Agriculture of the United Nations. Statistical Databases. Available online: https://www.fao.org/faostat/en/#data (accessed on 20 February 2022).
  2. IBGE. Instituto Brasileiro de Geografia e Estatística. Pesquisa da Pecuária Municipal. 2021. Available online: https://sidra.ibge.gov.br/pesquisa/ppm (accessed on 30 October 2021).
  3. Ferreira, L.A.; Claudino, L.S.D.; de Carvalho, S.A.; Maneschy, R.Q.; Poccard-Chapuis, R. Caracterização da pecuária leiteira de base familiar no Estado do Pará: Reflexões sobre práticas agroecológicas. Agric. Fam. Pesqui. Formação Desenvolv. 2020, 14, 126–141. [Google Scholar] [CrossRef]
  4. Alves, E.R.d.A.; Lício, A.M.A.; Contini, E. Perspectivas do Brasil no comércio internacional de lácteos. In Pecuária de Leite no Brasil: Cenários e Avanços Tecnológicos, 1st ed.; Vilela, D., Ferreira, R.d.P., Fernandes, E.N., Juntolli, F.V., Eds.; Embrapa: Brasília, Brazil, 2016; 435p. [Google Scholar]
  5. Silvi, R.; Pereira, L.G.R.; Paiva, C.A.V.; Tomich, T.R.; Teixeira, V.A.; Sacramento, J.P.; Ferreira, R.E.P.; Coelho, S.G.; Machado, F.S.; Campos, M.M.; et al. Adoption of precision technologies by Brazilian dairy farms: The farmer’s percPEion. Animals 2021, 11, 3488. [Google Scholar] [CrossRef] [PubMed]
  6. Sena, A.L.d.S.; Santos, M.A.S.d.; Santos, J.C.d.; Homma, A.K.O. Concentração espacial e caracterização da pecuária leiteira no estado do Pará. In Congresso Brasileiro De Economia, Administração e Sociologia Rural; SOBER: Campo Grande, Brazil, 2010. [Google Scholar]
  7. Sena, A.L.d.S.; Santos, M.A.S.d.; Santos, J.C.d.; Homma, A.K.O. Avaliação do nível tecnológico dos produtores de leite na região Oeste do estado do Pará. Rev. Econ. Agronegócio 2012, 10, 398–418. [Google Scholar]
  8. Lourenço Júnior, J.d.B.; Santos, M.A.S.d. Qualileite: Qualidade e Tecnologia na Cadeia Produtiva do Leite no Estado do Pará; Marques Editora: Belém, Brazil, 2015; 324p. [Google Scholar]
  9. Raiol, L.C.B.; Santos, M.A.S.d.; Rebello, F.K.A. A pecuária leiteira no Nordeste Paraense: Estrutura e fontes de crescimento no período 1990–2007. Movendo Ideias 2009, 15, 37–57. [Google Scholar]
  10. IBGE. Instituto Brasileiro de Geografia e Estatística. Cidades. Rio de Janeiro. 2020. Available online: https://cidades.ibge.gov.br/brasil/pa/panorama (accessed on 20 August 2021).
  11. Crocco, M.A.; Galinari, R.; Santos, F.; Lemos, M.B.; Simões, R. Metodologia de Identificação de Aglomerações Produtivas Locais; Nova Economia; UFMG: Belo Horizonte, Brazil, 2006; Volume 16. [Google Scholar]
  12. Moura, A.P.F.; Santos, C.V.D. Distribuição espacial e fontes de crescimento da pecuária leiteira paranaense. Rev. Política Agrícola 2017, XXVI, 5–19. [Google Scholar]
  13. Suzigan, W.; Furtado, J.; Garcia, R.; Sampaio, S.E.K. Coeficientes de Gini Locacionais—GL: Aplicação à indústria de calçados do Estado de São Paulo. Nova Econ. Belo Horiz. 2003, 13, 39–60. [Google Scholar]
  14. Haddad, P.R. Medidas de localização e especialização. In Economia Regional: Teorias e Métodos de Análise; Haddad, P.R., Ferreira, C.M.C., Boisier, S., Andrade, T.A., Eds.; BNB-ETENE: Fortaleza, Brazil, 1989; pp. 225–247. [Google Scholar]
  15. IBGE. Instituto Brasileiro de Geografia e Estatística. Censo Agropecuário 2006: Segunda Apuração [Database]. 2009. Available online: https://sidra.ibge.gov.br/pesquisa/censo-agropecuario/censo-agropecuario-2006/segunda-apuracao (accessed on 30 August 2021).
  16. IBGE. Instituto Brasileiro de Geografia e Estatística. Censo Agropecuário 2017: Resultados Definitivos [Database]. 2019. Available online: https://sidra.ibge.gov.br/pesquisa/censo-agropecuario/censo-agropecuario-2017/resultados-definitivos (accessed on 30 August 2021).
  17. BRASIL. Lei n° 11.326, de 24 de Julho de 2006. Estabelece as Diretrizes para a Formulação da Política Nacional da Agricultura Familiar e Empreendimentos Familiares Rurais. Available online: http://www.planalto.gov.br/ccivil_03/_ato2004-2006/2006/lei/l11326.htm (accessed on 25 November 2021).
  18. IBGE. Instituto Brasileiro de Geografia e Estatística. Produção da Pecuária Municipal 2018. Rio de Janeiro, v. 46, pp. 1–8. 2018. Available online: https://biblioteca.ibge.gov.br/visualizacao/periodicos/84/ppm_2018_v46_br_informativo.pdf (accessed on 4 August 2021).
  19. Valdo, N.N.; Firetti, R.; Bonacelli, M.B.M. Concentração Regional e Especialização da Produção de Leite no Estado de São Paulo (2007–2017). 2019. Available online: https://www.researchgate.net/profile/Ricardo-Firetti-2/publication/338196977_ (accessed on 30 November 2021).
  20. Marion Filho, P.J.; Moura, A.C.; Brites, M.; Lorenzoni, R.K. Especialização na produção de leite e concentração no Rio Grande do Sul. Rev. Adm. Negócios Amaz. 2016, 8, 22–38. [Google Scholar] [CrossRef]
  21. Soares, B.C.; Lourenço Júnior, J.d.B.; Santos, M.A.S.d.; Sena, A.L.d.S.; Rodrigues Filho, J.A.; Santana, A.C.d.S.; Homma, A.K.O.; Silva, A.G.M.e; Andrade, S.J.T.d. Caracterização da cadeia produtiva da pecuária leiteira em Rondon do Pará, Pará, Brasil. Nucl. Anim. 2019, 11, 25–37. [Google Scholar] [CrossRef]
  22. Gusmão, L.H.A.; Watrin, O.d.S.; Oliveira Junior, M.C.M.d. Dinâmica da agricultura anual no polo de Santarém, oeste do estado do Pará, no período 2004/2014. In Simpósio Brasileiro De Sensoriamento Remoto; Embrapa Amazônia Oriental-Artigo em Anais de Congresso (ALICE); INPE: São José dos Campos, Brazil, 2017. [Google Scholar]
  23. Claudino, L.S.D.; Angelica, F.L.; René, P.-C. Evolução dos sistemas agrários na microrregião de São Félix do Xingu (Amazônia Brasileira): História e questões para pensar o desenvolvimento territorial. DELOS Desarro. Local Sosten. 2020, 13, 283–305. [Google Scholar]
  24. Mattos, C.A.C.; Santana, A.C. As contribuições da pecuária leiteira para os agricultores familiares: Um estudo no sudeste do estado do Pará. Rev. Extensão Rural 2014, 20, 56–71. [Google Scholar]
  25. Sena, A.L.d.S.; Santos, J.C.d.; Marques, T.R.; Oliveira, R.C.d.; Costa, M.O.X.d. Demandas Tecnológicas para o Sistema Produtivo da Pecuária de Leite Nas Microrregiões de Marabá e de Redenção, Estado do Pará; Embrapa Amamônia Oriental: Belém, Brazil, 2014; 27p. [Google Scholar]
Figure 1. Location of the micro-regions in the state of Pará.
Sustainability 16 00122 g001
Figure 2. Location curve and concentration area used to calculate GL. Source: Moura and Santos [12], Suzigan et al. [13].
Sustainability 16 00122 g002
Table 1. Micro-regions of Pará with a degree of specialization (QL ≥ 1) in milk production in at least one of the two years: 2006 and 2017.
Micro-Regions20062017Micro-Regions20062017
Óbidos0.590.85Tomé-Açu0.600.19
Santarém1.280.81Guamá0.780.45
Almeirim0.360.47Itaituba0.710.75
Portel0.270.26Altamira1.031.09
Furos de Breves1.310.02Tucuruí1.542.30
Arari1.060.05Paragominas1.730.67
Belém0.180.03São Félix do Xingu0.931.66
Castanhal0.130.08Parauapebas1.702.69
Salgado0.090.07Marabá1.102.45
Bragantina0.600.21Redenção1.042.25
Cametá0200.05Conceição do Araguaia0.590.80
Source: Prepared by the author with data from IBGE [15,16].
Table 2. Ranking of the largest milk-producing micro-regions in 2020.
RankingMicro-RegionsProduction
(Thousand L)
Milked Cows (Heads)Productivity
(L/Cow/Year)
Redenção89,37186,1311037
Parauapebas88,563113,029783
Paragominas64,50691,970701
Marabá53,174108,850488
Tucuruí53,12390,937584
Altamira51,18950,7401008
São Félix do Xingu46,14853,651860
Santarém34,29048,553706
Óbidos29,58650,649584
10ºItaituba27,57029,560932
Source: Prepared by the author with data from IBGE [2].
Table 3. Distribution of the number of establishments, herd of milked cows, quantity produced, and gross value of milk production, according to the total area strata of establishments in the state of Pará—2017.
Total Area Strata of
Properties (ha)
Number of EstablishmentsCows
Milked
Quantity ProducedGV* of Production
Units%Heads%Thousand
L
%Thousand R$%
Less than 50 ha14,10739.89135,33027.75175,22027.09149,42826.90
From 50 to less than 100 ha886425.07118,53224.31156,28224.16131,62923.69
From 100 to less than 200 ha606917.16100,77020.67135,53420.95116,15420.91
From 200 to less than 500 ha387110.9581,35516.68113,39017.5398,86717.80
More than 200 ha24369.8951,49510.5666,19810.2359,32313.68
Producer without area160.051150.021760.031690.03
Total35,363100487,597100646,800100555,570100
Source: Prepared by the author with data from the 2017 Agricultural Census, IBGE [16]. Note: GV* = Gross value of milk production.
Table 4. Distribution of the number of micro-regions, herd of milked cows, quantity produced, and gross value of milk production, according to specialized and non-specialized micro-regions in the state of Pará—2017.
VariablesSpecialized Micro-RegionsNon-Specialized
Micro-Regions
Total
Amount%Amount %Amount%
Number of Micro-regions627.271672.7322100
Number of cows milked375,17676.94112,42123.06487.597100
Quantity produced (L)506,23478.27140,56521.73646.799100
Dairy productivity (L/cow/year)740.63-534.54-590.74-
GV* of milk production (R$)406,45873.16149,11226.84555.570100
Source: Prepared by the author with data from the 2017 Agricultural Census, IBGE [16]. Note: GV* = Gross value of milk production.
Table 5. Distribution of the number of establishments and gross value of milk production, according to specialized and non-specialized micro-regions in the state of Pará—2017.
VariablesSpecialized Micro-RegionsNon-Specialized
Micro-Regions
Total
Amount%Amount%Amount%
Number of establishments—
family farming
21,09474.52721425.4828,308100
Number of establishments—
Non-family farming
525974.54179625.467055100
Quantity produced (L)—Family farming375,06479.0999,17020,.1474,234100
Quantity produced (L)—Non-family farming131,17176.0141,39423.99172,565100
GV* of Milk production—Family farming298,57974.47102,36225.53400,941100
GV* of Milk production—Non-family farming107,88069.7746,75030.23154,630100
Source: Prepared by the author with data from the 2017 Agricultural Census, IBGE [16]. Note: GV* = Gross value of milk production.
Table 6. Distribution of the number of establishments indicating the sale of raw milk, quantity and value of raw milk sold, according to specialized and non-specialized micro-regions in the state of Pará—2017.
VariablesSpecialized Micro-RegionsNon-Specialized
Micro-Regions
Total
Amount%Amount%Amount%
Establishments selling raw milk15,63377.03466222.9720,295100
Raw milk sold
(Thousand L)
399,59280.6395,98919.37495,581100
Value of raw milk sold
(Thousand R$)
314,28177.1093,35722.9407,638100
Source: Prepared by the author with data from the 2017 Agricultural Census, IBGE [16].
Table 7. Average annual growth rates in milk production in the state of Pará and micro-regions, from 1990 to 2020.
Micro-RegionsTACPHEEPEGreater Participation
Óbidos6.873.962.92HEE
Santarém5.680.475.20PE
Almeirim8.733.455.27PE
Portel−4.37−4.750.38Retraction
Furos de Breves−1.71−1.810.10Retraction
Arari−3.43−3.31−0.13Retraction
Belém−5.00−5.590.6Retraction
Castanhal−1.52−1.540.03Retraction
Salgado−7.76−7.880.12Retraction
Bragantina−2.00−2.070.07Retraction
Cametá−3.650.25−3.9Retraction
Tomé-Açu−1.51−1.900.39Retraction
Guamá−1.78−1.980.2Retraction
Itaituba8.140.577.56PE
Altamira1.85−0.792.64PE
Tucuruí6.884.542.33ERR
Paragominas0.40−0.811.21PE
São Félix do Xingu8.631.187.45PE
Parauapebas8.973.725.25PE
Marabá6.594.562.03HEE
Redenção4.78−0.465.24PE
Conceição do Araguaia1.06−2.063.11PE
Pará3.230.382.85PE
Note: AAPGR = average annual production growth rate; HEE = herd expansion effect; PE = productivity effect. Source: Prepared by the author with data from IBGE [2].
Table 8. Average annual growth rates in milk production in the subperiods 1990–2000, 2000–2010, and 2010–2020 in the state of Pará and Micro-regions.
Micro-Regions1990–20002000–20102010–2020
AAPGREEPEAAPGRHEEPEAAPGRHEEPE
Óbidos6.863.793.079.687.921.764.143.011.13
Santarém4.70−0.755.446.08−1.377.466.256.160.10
Almeirim8.791.287.5211.3413.50−2.176.112.973.14
Portel−3.44−3.830.39−8.18−9.251.08−1.37−1.710.34
Furos de Breves−0.282.58−2.86−0.52−2.952.43−4.29−4.350.06
Arari−4.14−4.960.82−2.92−2.68−0.24−3.24−1.91−1.33
Belém−4.57−4.13−0.44−8.10−11.072.97−2.22−1.88−0.34
Castanhal−4.78−5.881.109.188.041.13−8.12−6.61−1.51
Salgado−18.47−18.01−0.468.467.281.18−11.25−12.331.08
Bragantina1.940.851.09−0.630.53−1.17−7.07−7.340.27
Cametá−11.36−9.02−2.340.132.19−2.060.778.98−8.21
Tomé-Açu7.757.720.03−3.13−3.360.22−8.46−9.200.74
Guamá1.66−0.662.31−2.26−1.71−0.55−4.63−3.87−0.76
Itaituba17.611.3916.221.86−0.152.015.552.23.36
Altamira−1.60−4.372.760.20−0.941.147.162.005.16
Tucuruí5.214.171.0415.8913.012.890.12−0.951.08
Paragominas0.24−4.044.292.592.260.32−1.580.01−1.59
São Félix do Xingu31.8214.7117.110.87−6.297.16−3.59−0.90−2.70
Parauapebas15.2115.42−0.110.070.359.722.033.41−1.38
Marabá4.755.10−0.3511.166.194.974.014.16−0.14
Redenção12.021.8810.43,.2−3.267.08−1.1−1.430.33
Conceição do Araguaia2.89−4.677.560.46−0.631.09−0.15−3.663.51
Pará5.091.293.84.01−0.394.400.640.69−0.05
Note: AAPGR = average annual production growth rate; HEE = herd expansion effect; PE= productivity effect. Source: Prepared by the author with data from IBGE [2].
Disclaimer/Publisher’s Note: The statements, opinions and data contained in all publications are solely those of the individual author(s) and contributor(s) and not of MDPI and/or the editor(s). MDPI and/or the editor(s) disclaim responsibility for any injury to people or property resulting from any ideas, methods, instructions or products referred to in the content.

