Article

The Application of an Electrocoagulation Process to the Sustainable Treatment of Initial Rainwater and the Simulation of a Flow Pattern in an Experimental Device

1
Key Laboratory of Urban Stormwater System and Water Environment, Ministry of Education/Sino-Dutch R&D Centre for Future Wastewater Treatment Technologies, Beijing University of Civil Engineering and Architecture, Beijing 100044, China
2
Wudi County Land Consolidation and Reserve Center, Binzhou 251900, China
*
Author to whom correspondence should be addressed.
Sustainability 2024, 16(1), 161; https://doi.org/10.3390/su16010161
Submission received: 15 November 2023 / Revised: 13 December 2023 / Accepted: 18 December 2023 / Published: 23 December 2023
(This article belongs to the Topic Sustainable Technologies for Water Purification)

Abstract

:
The pollutant content in initial rainwater is very high, so the treatment and research of initial rainwater has become an engagement issue in controlling non-point source pollution and realizing sustainable development in Chinese cities. This study explores the best flow pattern suitable for treating initial rainwater by electrocoagulation (EC), and a pilot-scale experiment is conducted to analyze the effect of the EC process on the treatment of initial rainwater. The findings indicate that the latter enhances the turbulent flow effect and the EC process treatment effect better under the two flow modes of parallel perforation flow and dislocation perforation flow. For the dislocation perforated flow pattern, the removal rates of suspended matter (SS), chemical oxygen demand (COD), and phosphorus (TP) are 94.00%, 81.95%, and 98.97%, respectively, which reach the expected treatment targets. Using the electrocoagulation–filtration (ECF) process to treat initial rainwater, the final effluent exhibits high quality and could be used as urban circulating cooling water. Specifically, SS, COD, and TP concentrations are 15.00 mg/L, 21.06 mg/L, and 0.11 mg/L, respectively. The hydraulic retention time of the process is short, only 30 min, and the energy consumption is low, 0.57 kWh. This study provides a reference for the sustainable treatment of early urban rainwater and the design of the flow pattern of the EC process.

1. Introduction

Urban water environment protection and resource utilization are critical for sustainable urban development. In recent years, with the continuous deepening of the battle against water pollution prevention and control, the quality of China’s water environment has significantly improved, urban non-point source pollution is gradually becoming a significant factor influencing urban water environments, and the water pollution problems faced by most cities have also changed from point source pollution to non-point source pollution caused by initial rainwater [1,2]. Initial rainwater refers to the runoff that occurs within a certain period after the formation of surface flow during rainfall, with the specific definition varying by region. Generally, it refers to the runoff that occurs within 10–30 min or the first 3–5 mm of rainfall [3,4]. Compared to the runoff in the middle and late stages of rainfall, the water quality of initial rainwater is more complex, approaching or even exceeding the levels of domestic wastewater [5,6,7]. If initial rainwater is discharged directly without treatment into receiving water bodies, such as urban rivers and lakes, it affects water quality and aggravates urban non-point source pollution [8,9,10]. The treatment of initial rainwater and control of surface pollution sources are receiving increasing attention.
In recent years, research on the treatment of early rainwater has been carried out in different areas at home and abroad. Governance methods mainly include source governance [11,12,13], process governance [14,15], and end governance [16,17]. Each method has a certain treatment effect. However, in high rainfall intensity, the treatment effect of source governance and process governance diminishes, and the treatment pressure of the sewage treatment plant at end governance is immense, making it difficult to treat initial rainwater promptly. The existing sewage treatment plants in China take little account of the initial rainfall of the locals. Therefore, it is necessary to consider the treatment of initial rainwater separately and design a targeted treatment process to ensure timely treatment and discharge. This will help alleviate water pollution problems effectively [18,19].
Relevant studies indicate that suspended solids (SS), chemical oxygen demand (COD), and total phosphorus (TP) constitute the primary pollutants in the initial contamination of urban rainwater runoff in China [1,3,20,21,22]. The precipitation–filtration process is widely employed for the treatment of rainwater. Nevertheless, traditional precipitation–filtration techniques prove inadequate in effectively mitigating elevated levels of SS, COD, and TP. These methods necessitate prolonged treatment durations, rendering them unsuitable for initial rainwater treatment. Moreover, the substantial sludge concentration produced by this process further escalates treatment expenses and operational complexities in subsequent stages [23,24]. In contrast, the electrocoagulation (EC) process offers a faster flocculation rate due to its electrochemical effect, enabling the water treatment process to be completed quickly. This process efficiently removes suspended matter and microorganisms, generates less sludge, and is environmentally friendly with low operating costs [25,26,27]. Numerous studies have shown the effectiveness, reliability, and environmental friendliness of the EC process in eliminating SS, COD, and TP [25,28,29,30,31,32]. It is noteworthy to mention that an effective flow pattern holds the potential to enhance the flocculation effect in the EC device and improve its efficiency. This aspect serves as a significant influencing factor [33]. Consequently, the present study employed the EC process to treat initial rainwater and established various flow patterns to conduct the investigation.
In this study, we initially determined the optimal conditions for plate combination, electrolytic time, plate spacing, current density, and plate number, among other parameters, in the EC process. The results lay the foundation for subsequent flow simulation experiments. Subsequently, we designed various flow patterns by altering the board layout and employed COMSOL 5.5 software to simulate these patterns. The simulation results were then validated through experimental verification. Finally, to enhance the relevance of the experimental findings, we conducted a pilot-scale experiment. The combined electrocoagulation–filtration (ECF) process was applied to treat initial rainwater, thereby confirming the feasibility and economic viability of employing the EC process for the rapid treatment of such water. The outcomes of this research provide concrete evidence for optimizing the design of EC board layout and serve as a valuable reference for the expeditious treatment of initial rainwater.

2. Materials and Methods

2.1. Initial Rainwater Characterization and Analytical Methods

Based on the investigation findings regarding the concentration ranges of different pollutants in initial rainwater [5,34,35], the research chose effluent from a primary sedimentation tank at a sewage treatment plant in Beijing as the experimental water source. The water quality conditions were SS concentration from 300 to 310 mg/L, COD concentration from 190 to 210 mg/L, and TP concentration from 5 to 6 mg/L. There has yet to be a unified national standard for the effluent quality of pollutants in the initial treatment of rainwater in China. However, we can combine the relevant local standards as the reference basis of this study. Therefore, this study refers to the control standards for initial runoff pollution in the Technical Specifications for Rainwater Utilization Engineering of Shenzhen City [36], and the final control standards for each pollutant are determined in Table 1 below.
The following formula calculated the target removal rate of the three pollutants:
d = c 0 c t c 0 × 100 %
where d is the removal rate of SS, COD, and TP pollutants, c0 is the concentration of pollutants in the effluent, and ct is the concentration of pollutants in the effluent.
The concentration of the SS pollutant was determined by the gravimetric method. A DIKANG Tech DAR-500 multi-parameter water quality analyzer determined the concentrations of the COD and TP pollutants.

2.2. Reactor Setup

2.2.1. Experiment Equipment of the EC Process and Experimental Pilot-Scale Equipment for the ECF Process

The continuous flow EC experimental device was designed for this experiment (Figure 1a), and its production material was acrylic plexiglass. The EC container had dimensions of 60 cm in length, 15 cm in width, and 25 cm in height. Its total volume was 22.5 L, with a practical volume of 20 L.
The EC reactor was divided into three areas: the influent region, the EC contact reaction area, and the precipitation reaction area. Raw water was transferred from the water intake tank to the peristaltic pump at an appropriate flow rate. It was then directed into the water inlet located in the upper section of the EC contact reaction zone. After undergoing the necessary reactions, the water exited from the opposite side at the bottom and proceeded into the precipitation reaction zone.
Metal plates, measuring 15 cm in length and 25 cm in width, were placed within the contact reaction zone of the EC device. The plate layout was divided into two ways: parallel placement and staggered placement. The thickness of the plates was 2 mm. A total of 4–8 plates could be set according to the experimental requirements. There were 49 holes uniformly distributed on each plate, and the diameter of a single hole was 5 mm. The height and distance between these plates could be changed by adjusting the plastic threaded rods and plastic nuts, and the contact area between these plates and the solution could be changed by adjusting the water entry height of the plates. Generally, the plate spacing could be adjusted between 10 and 50 mm according to experimental requirements. The power supply used in the experiment was a voltage-stabilized DC power supply. The current could be adjusted from 0 to 6 A, and the voltage could be adjusted from 0 to 30 V. During an experiment, the EC experimental device controlled the flow rate and residence time of the liquid in the reaction device by adjusting the inlet water pump. The residence time and settling time of the EC device fluid were 10 to 60 min, and the specific time was determined according to the experiment. Iron and aluminum are the primary plate materials used in EC research. On this basis, iron (Fe), aluminum (Al), aluminum–magnesium alloy (Al(Mg)), and aluminum–zinc alloy (Al(Zn)) were selected for pairwise combinations to form six plate combination methods: Fe-Fe, Fe-Al, Al-Al, Al-Fe, Al(Mg)-Al, and Al(Zn)-Al.
Figure 1b shows a schematic of the reactor for the pilot-scale EC and filtration combined process. The pilot reactor, consisting of an EC reactor and filter basin, was designed independently.
The EC reactor was constructed with polypropylene and included a baffle plate in the middle, separating the device into two areas for preparation and use. The effective size of a single EC reaction region was L × W × H = 1.8 m × 1 m × 1 m, with an actual effective volume of 1.8 m3. The metal plate in the reactor used iron as an anode and aluminum as a cathode, with a plate perforation form providing water flow channels. The plates were staggered to ensure the formation of staggered perforation flow in the EC device. An inclined plate settling area was located beneath the metal plate, serving two functions: increasing surface area for precipitation and preventing settled sludge from floating back into the water body.
Figure 1c depicts the physical appearance of the EC device. The filter basin was constructed from stainless steel. Water flowed into the filter basin from above and exited from below. Internally, the filter basin was divided into three sections: the upper water distribution area, the middle filter material area, and the lower water discharge area. This study selected a novel sponge filter material with high pollution interception efficiency, resistance to blockage, and easy backwashing. In this study, the filtration tank utilized a top three-sided overflow channel for water discharge, ensuring a more uniform water distribution and promoting enhanced filtration efficiency.
This study utilizes a regulated DC power supply with an adjustable current range of 0 to 200 A and an adjustable voltage range of 0 to 30 V. The inlet water pump controls the liquid flow velocity and residence time within the experimental device. The pilot reactor can be operated and adjusted manually or automatically through a preset PLC-programmed electric control cabinet.
The conductivity of the solution was measured using a DDS-11A (Shanghai Yueping Scientific Instrument Co., Ltd., Suzhou, China) conductivity meter. The initial conductivity of the experimental raw water is about 700–900 μs/cm. In some cases, supporting electrolytes were added to increase the electrical conductivity [37]. The initial pH of raw water is about 7.2. During the experiment, the pH of the solution remained weakly alkaline.

2.2.2. Principle of the EC Process

The EC process mainly removes various pollutants in the water through flocculation, oxidation reduction, and partial air flotation [38,39].
The metal electrode is placed in the treated water, and the direct current is applied. At this time, the metal anode undergoes an electrochemical reaction to generate metal ions. Metal ions will hydrolyze in water, polymerize to form hydroxides and multi-nuclear hydroxyl complexes, and finally form polymer flocculants. Thus, coagulation or flocculation occurs. The process and mechanism of electrocoagulation are the same as chemical coagulation. However, the hydroxides and complexes produced by the electrocoagulation process show a more substantial adsorption effect than those obtained by general chemical hydrolysis.
In Fe-Fe electrocoagulation (Fe-Fe-EC) and Fe-Al electrocoagulation (Fe-Al-EC), the anodic reaction can be seen as Equation (2). In Al-Al electrocoagulation (Al-Al-EC), Al-Fe electrocoagulation (Al-Fe-EC), Al(Mg)-Al electrocoagulation (Al(Mg)-Al-EC), and Al(Zn)-Al electrocoagulation (Al(Zn)-Al-EC), the anodic reaction can be seen as Equation (3). The cathode reaction in each experimental device is shown in Equation (4) [38].
At anode:
Fe(s) → Fe2+(aq) + 2e
Al(s) → Al3+(aq) + 3e
At cathode:
nH2O + ne → (n/2)H2(g) + nOH(aq)
During the electrolysis process, some O2 and H2 are produced on the surface of the anode and cathode. They appear in the form of tiny bubbles, adsorb pollutants, such as suspended solids in water, bring pollutants to the surface of the solution, and then remove them.
In the case of high current and high voltage, the organic matter in the water will be oxidized to small molecular organic matter or directly oxidized to CO2 and H2O. The cathode will also produce new ecological hydrogen with reduction ability due to electron exchange and reduce the pollutants in the water to degrade various pollutants.

2.3. Model Construction

2.3.1. Introduction to the COMSOL Software Model

COMSOL is a large-scale advanced numerical simulation software package based on the finite element method. It can simulate actual physical phenomena by solving partial differential equations (single field) or partial differential equations (multiple fields). It is called “the first real software for direct coupling analysis of arbitrary multiple physical fields” by scientists worldwide [40]. Using COMSOL software, numerical solutions, and visualizations are employed to quantitatively describe the flow field and its associated phenomena in time and space. These results can solve various physical problems, including fluid flow issues with intricate internal structure designs and complex boundary conditions. Currently, COMSOL software is extensively utilized due to its advantageous features, such as a user-friendly interface, parameterization, and automation capabilities [40,41,42,43].

2.3.2. Establishment of the COMSOL Model

The workflow of the COMSOL software is mainly divided into the following steps: constructing a simplified geometric model and a grid model, establishing a mathematical model, determining the boundary conditions and operating conditions, and selecting the solution method. Finally, the simulation results are obtained and analyzed [44].
First, the geometric model of the board layout is constructed, and the grid is divided. The results are shown in Figure 2. The EC contact reaction zone was subdivided into three parts: the uniform water distribution zone, plate reaction zone, and effluent zone, of which the plate reaction zone was the central part. The experiment takes the form of water entering from the top of the device and leaving the exit from the bottom. Raw water was injected into the experimental device from the upper water inlet through a peristaltic pump. After the water was evenly distributed in the water distribution area, it flowed to the plate reaction area, where it came into contact and reacted with the metal plate and metal cations in the solution. The treated water flowed from the bottom of the other side of the plate reaction zone into the precipitation reaction zone and entered the next stage. As part of the pre-processing in COMSOL software, the grid division converts the continuous space of the EC reaction device into a series of finite discrete points [44].
Second, after simplifying the experimental device, it was necessary to build a suitable numerical model for simulation. Simulation of the phenomena in an EC process includes the numerical solution of motion equations (mass, momentum) with other sets of equations related to the problem. These equations are usually used to explain transport mechanics, such as the reaction of chemical species, migration, and diffusion in the presence of an electric field [43]. Referring to the COMSOL user manual and considering the accuracy of numerical calculation and the turbulent conditions of the average flow of the fluid, the RNG k-ε model was adopted in this study to simulate the turbulence of the fluid, where k is the turbulent kinetic energy and ε is the energy dissipation rate. The control equation mainly refers to the research by Di et al. [44,45].
Third, we analyzed and determined the boundary conditions and operating conditions. The boundary conditions refer to the conditions that the solution of the equations should satisfy on the moving boundary. The setting of the boundary conditions can be applied to the nodes, edges, or surfaces of the model. The COMSOL model established in this study set the entrance boundary condition and the exit boundary condition in the free-flow physical field interface. The inlet of the EC reactor adopted the velocity inlet; the inlet velocity was calculated as 0.17 m/s according to the flow rate, the outlet was the pressure outlet, and the pressure was 101.325 kPa [46]. In addition to the inlet and outlet boundaries of the experimental device, other boundaries, such as the wall surface and the metal plate in contact with the liquid, were non-slip boundaries with a concentration gradient of 0 [44]. The EC reactor fed water through a peristaltic pump, and the diameter of the inlet pipe was DN6. To investigate the influence of different perforation forms on the flow pattern, two plate layout forms were set up to simulate different flow patterns for the same number of plates and effective contact area. The first plate layout form was parallel perforations between adjacent plates, and the second was staggered perforations. The diameter of a single hole was 5 mm, and each plate had 49 round holes.
Fourth, the solution was determined. This study used the finite volume method to discretize the equation. The momentum equation was discretized in a second-order upwind scheme, and the pressure implicit operator splitting algorithm was used to solve the velocity and pressure coupling [46].
Finally, the flow and velocity cloud diagrams were obtained through simulation calculations. The flow fields and kinetic energy were analyzed according to the results. EC experiments further verified the performance and simulation results of the COMSOL model.

3. Results

3.1. Single-Factor Experiments

3.1.1. Material Selection and Combinations of Electrode Plates

Under the experimental conditions of an electrolytic time of 30 min, static settling time of 30 min, plate spacing of 2 cm, four plates, and current density of 60 A/m2, each plate combination was used for the experiment to select the best plate combination. Experiments were carried out under the condition of each plate combination, and the experimental results are shown in Figure S1a.
Figure S1a shows some differences in the removal rates of pollutants for different combinations of plates. The difference in the removal rate of SS was the most obvious, and the differences in the removal rates of COD and TP were minor. Overall, the pollutant removal efficiencies, from high to slow, were Fe-Al-EC > Fe-Fe-EC > Al(Zn)-Al-EC > Al(Mg)-Al-EC > Al-Al-EC > Al-Fe-EC. The pollutant removal effect was the best for the Fe-Al-EC, and the removal rates of SS, COD, and TP were 91.50%, 74.71%, and 99.73%, respectively. The reason for the highest removal rate of Fe-Al-EC was that studies have shown that for Fe-Al-EC, metal ions were mainly oligomerized polynuclear polymers that formed dense and heavy flocculation bodies with pollutants [47]. Moreover, when aluminum serves as the cathode, the hydrogen evolution reaction is faster than an iron cathode. The hydrogen evolution reaction will produce many tiny bubbles, which can not only stir the water and flocs and accelerate material transfer between plates but also help transfer and remove some tiny flocs that are not easy to settle [48]. However, the EC process with iron as the anode has apparent shortcomings; that is, the effluent chroma problem, which must be solved by further processing technology. Therefore, Fe-Al and Fe-Fe are not suitable for use as plate materials in experimental equipment.
When aluminum was used as the anode, removing Al(Mg)-Al-EC and Al(Zn)-Al-EC was better than Al-Al-EC. The removal rates of all pollutants by Al(Zn)-Al-EC were the highest: SS: 86.93%, COD: 71.65%, and TP: 99.21%. The main reason is that the activation degree of an aluminum alloy is much higher than pure aluminum due to the small amounts of magnesium, zinc, and other metal elements in aluminum alloy materials. In addition, the low solubility of these metal elements led to the formation of numerous pits with smaller pore sizes and shallower depths on the surface of the aluminum alloy plate during the reaction process, making the dissolution and diffusion of metal ions more uniform and more conducive to the formation of flocs of various forms [49,50]. In addition, an experimental comparison showed that Al(Zn)-Al-EC was superior to the other two aluminum ECs in terms of treatment effect and energy consumption during operation. Throughout the whole operation, Al(Zn)-Al-EC had the smallest voltage increase and least plate passivation. Moreover, Al(Zn) was more suitable as an anode material than the other two materials.
Therefore, considering the removal effect, operating energy consumption, and effluent chromaticity, Al (Zn)-Al was used as the plate combination in this experiment.

3.1.2. Electrolysis Time

The experimental conditions were as follows: Al(Zn)-Al plate combination, 30 min static settling time, 2 cm plate spacing, four plates, and a 60 A/m2 current density. The experimental results are shown in Figure S1b.
As shown in Figure S1b, the removal rates of SS and COD were relatively low at 10 min and began to increase sharply at 10–30 min, reaching 80.13% and 72.21% at 30 min, respectively, and the highest values at 40 min, 80.77% and 75.20%, respectively. The removal rate of TP reached 98.64% at 10 min; that is, the EC process could effectively remove phosphorus from water in a short time, similar to most researchers’ results [31,51]. Regarding the treatment effect, the best electrolysis time was 40 min, but there was no significant difference compared with the treatment effect after 30 min. In the case of a constant current, the electrolysis time determined the energy consumption, and thus, the comprehensive treatment effect and energy consumption were considered; the electrolysis time of the follow-up experiment was 30 min.

3.1.3. Static Settling Time

The experimental conditions were as follows: Al(Zn)-Al plate combination, 30 min static settling time, 2 cm plate spacing, four plates, and a 60 A/m2 current density. The experimental results are shown in Figure S1c.
As seen in Figure S1c, the effluent from the EC process achieved a higher removal rate during the initial 10 min. After that, the removal rates of various pollutants still increased, but the trends gradually slowed. After 60 min of static sedimentation, the final removal rates of SS, COD, and TP reached their maximum values of 83.33%, 73.55%, and 99.57%, respectively. However, in terms of treatment efficiency, the static sedimentation efficiency in the early stage (0–30 min) was significantly higher than in the later stage (30–60 min). The length of settling time affected the removal of various pollutants. For the sedimentation tank, once the treatment scale was determined, the longer the settling time was, the larger the area of the sedimentation tank and the greater the capital construction cost. Therefore, considering the removal efficiency and financial cost, the static settling time of the follow-up experiment was 30 min.

3.1.4. Spacing of the Electrode Plates

The experimental conditions were as follows: the combination of plates was Al (Zn)-Al, the electrolysis time was 30 min, the settling time was 30 min, the number of plates was four, and the current density was 60 A/m2. The experimental results are shown in Figure S1d.
Different plate spacings have a particular impact on the actual treatment effect, and the voltage changes further affect the energy consumption level [52]. As shown in Figure S1d, when the plate spacing was 2 cm, the removal rates of SS, COD, and TP were 86.62%, 71.29%, and 99.27%, respectively, and the removal effect was the best. Proper plate spacing can effectively improve the mixed mass transfer effect of the solution, prevent many metal ions and their flocs from accumulating between the plates, and improve the treatment efficiency of pollutants. When the distance between electrodes is too large, the effect of EC on pollutant removal becomes worse. Too large or too small of a plate spacing reduces the efficiency of removing pollutants and leads to increases in plate voltage, operation energy consumption, and financial cost. Thus, after careful consideration, the plate spacing of the follow-up experiment in this study was 2 cm.

3.1.5. Current Density and Number of Plates

The experimental conditions were as follows: the plate combination was Al (Zn)-Al, the plate spacing was set to 2 cm, the electrolysis time was 30 min, and the static sedimentation time was 30 min. The experiment was divided into three series. The number of plates in the three series was 4, 6, and 8. The current densities of the series were 20 A/m2, 40 A/m2, 60 A/m2, 80 A/m2, and 100 A/m2. The experimental results are shown in Figure S1e.
As shown in Figure S1e, in the experimental device with four plates, with the continuous increase in current density, the removal rate of each pollutant showed a gradual upward trend. When the current density increased to 100 A/m2, the removal rate of each pollutant reached a maximum. Under the condition of six plates, the removal rates of SS and COD increased at first and then decreased with increasing current density, and the removal rates of pollutants reached optimal values when the current density was 60 A/m2. The removal rates of pollutants reached optimal values when the current density was 60 A/m2. Table S1 shows that when the total current was constant, compared with the large current density of the few plates, the pollutant removal rate was faster, the operating voltage was smaller, and the energy consumption and financial cost were less under the condition of the low current density of the multi-electrode plate.
In summary, considering the pollutant removal effect and financial cost, the number of plates was eight, and the current density was 40 A/m2 in the follow-up experiment.
From the single-factor static experiments, Al (Zn)-Al was taken as the plate combination; the optimal ranges of the other parameters are shown in the Table 2 below. For the optimal values, the SS, COD, and TP removal rates were 91.25%, 84.38%, and 99.68%, respectively. The SS, COD, and TP concentrations in the effluent were 26 mg/L, 30 mg/L, and 0.02 mg/L, respectively, and all concentrations reached the expected targets.

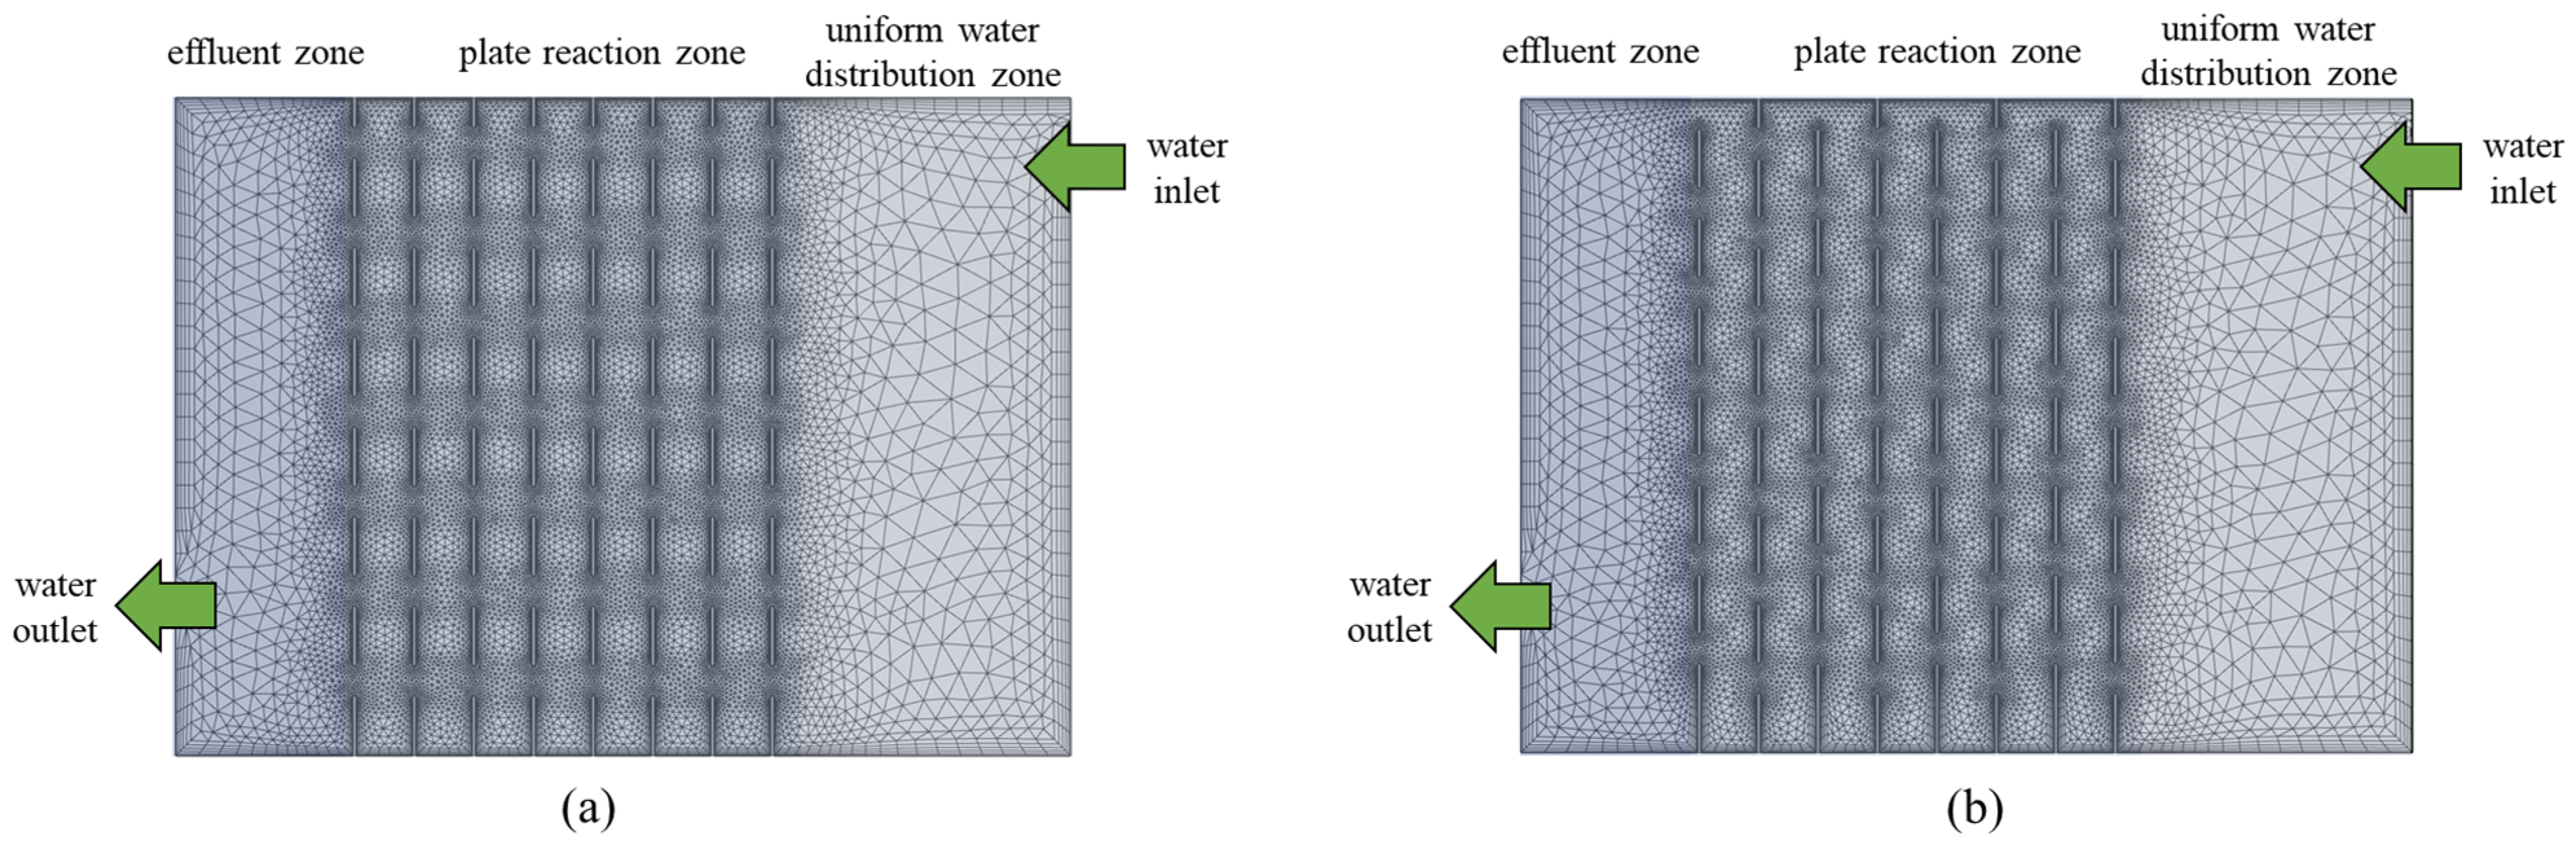
3.2. Flow Simulation Analysis

This study used COMSOL flow simulation software to simulate flow patterns for two plate layouts, and the corresponding flow lines and kinetic energy diagrams were obtained.

3.2.1. Flow Field Analysis

A fluid streamline diagram is a diagram used to describe the operation of the fluid at a certain time; this was very important for the analysis of the flow pattern in the reactor. This was because keeping a good flow pattern in the reactor improved the effect of mass transfer between fluids and enhanced the collision probability between metal flocs and all kinds of pollutants. In this flow pattern simulation, the flowcharts of parallel and dislocated perforated flows are shown in Figure 3.
As seen in Figure 3, after reaching a stable operation state, the fluid first underwent a certain degree of cyclic mixed flow in the front area of the device (uniform water distribution area) and then entered the EC reaction zone and finally accumulated at the outlet. In the front and outlet areas of the device, the streamline density was more significant for the dislocation perforated flow than the parallel perforated flow. This proved that for the flow pattern of dislocation perforation flow, the velocity between the plates changed rapidly and created a more excellent disturbance, which enhanced the formation of colloidal complexes and flocculation reactions. In the EC reaction zone, the fluid was turbulent, and the turbulent motion could be regarded as the result of the superposition of vortex motion on different scales and the average velocity. The shear force and centrifugal inertia force produced by the vortex motion were the main forces for the contacts and collisions of flocculating particles, and the vortex shear force was the main driving force of the flocculation reaction [53]. According to the change in streamlines, in the parallel perforated flow state, the fluid flowed parallel along the orifice between the plates, and upward or downward flow rarely occurred. The shear force produced by the vortex motion was relatively small. To a certain extent, this led to insufficient contact between the fluid and the metal cations precipitated from the plates and the lack of dominant power of the flocculation reaction, which affected the treatment of pollutants by EC. In the case of the staggered perforated flow state, the distribution and change in the streamlines showed that each fluid flow through a plate had an upward or downward dislocation flow, and the shear and centrifugal inertial forces generated by such vortex motion were large. This could not only enhance the contact degree with the plate and metal cations and strengthen the contact flocculation effect but also effectively produce a significant degree of disturbance between the plate metal ions, preventing their accumulation on the plate surface and passivation of the plate.
The effect of the fluid on flocculation could be reflected indirectly by the fluid flowchart; the effect of the fluid on the dislocation flow pattern was better and had a more direct impact on the load of the subsequent water treatment process and the final effluent quality [54,55]. Therefore, it was preliminarily determined that the pollutant removal effect of the EC process with a staggered perforation flow pattern was better than the EC process with a parallel perforation flow pattern.

3.2.2. Kinetic Energy Analysis

A velocity cloud diagram was used to describe the magnitude of the fluid velocity in the device at a particular time. When the fluid velocity changed significantly at some points, there was more incredible turbulent kinetic energy at those points, and the mixed mass transfer effect of the fluid improved.
As seen in Figure 3, similar to the fluid flowchart, for the parallel perforated flow pattern, there was only a change in kinetic energy among the perforated water channels between the plates. In contrast, the kinetic energy was low in other parts of the flow, and the change was small. This showed that the turbulent effect of the fluid in this flow state was not good, and the effect of mass transfer in most areas was poor, which was not conducive to the diffusion of metal cations and the contact reaction between metal cations and pollutants. In the dislocation perforated flow pattern, the flow direction changed every time the fluid passed through each plate due to the different orifice heights between the adjacent plates. Thus, there was more velocity variation and more turbulent kinetic energy. This change further affected the area outside the orifice. As depicted in Figure 3, the lighter the blue shade, the higher the kinetic energy and the stronger the impact of turbulence. Compared with the parallel perforated flow, the light-colored area in the velocity cloud image of the dislocation perforated flow was more extensive, which indicated that the mass transfer effect of fluid mixing in this flow pattern was better.
The turbulent kinetic energy quantitatively described the mass transfer effect of the fluid. The greater the kinetic energy was, the greater the turbulence intensity and the better the mass transfer effect [44]. The calculation of the turbulent kinetic energy at the orifice showed that the turbulent kinetic energy in the parallel perforation flow was 8.25 × 10⁻⁶ m2/s2, which was less than the dislocation perforation flow, 9.80 × 10⁻⁶ m2/s2.
According to the overall results in the flowcharts, velocity cloud diagrams, and kinetic energy comparison, the effect of the EC process on pollutant treatment should be better for the dislocation perforated flow pattern than the parallel perforated flow pattern.

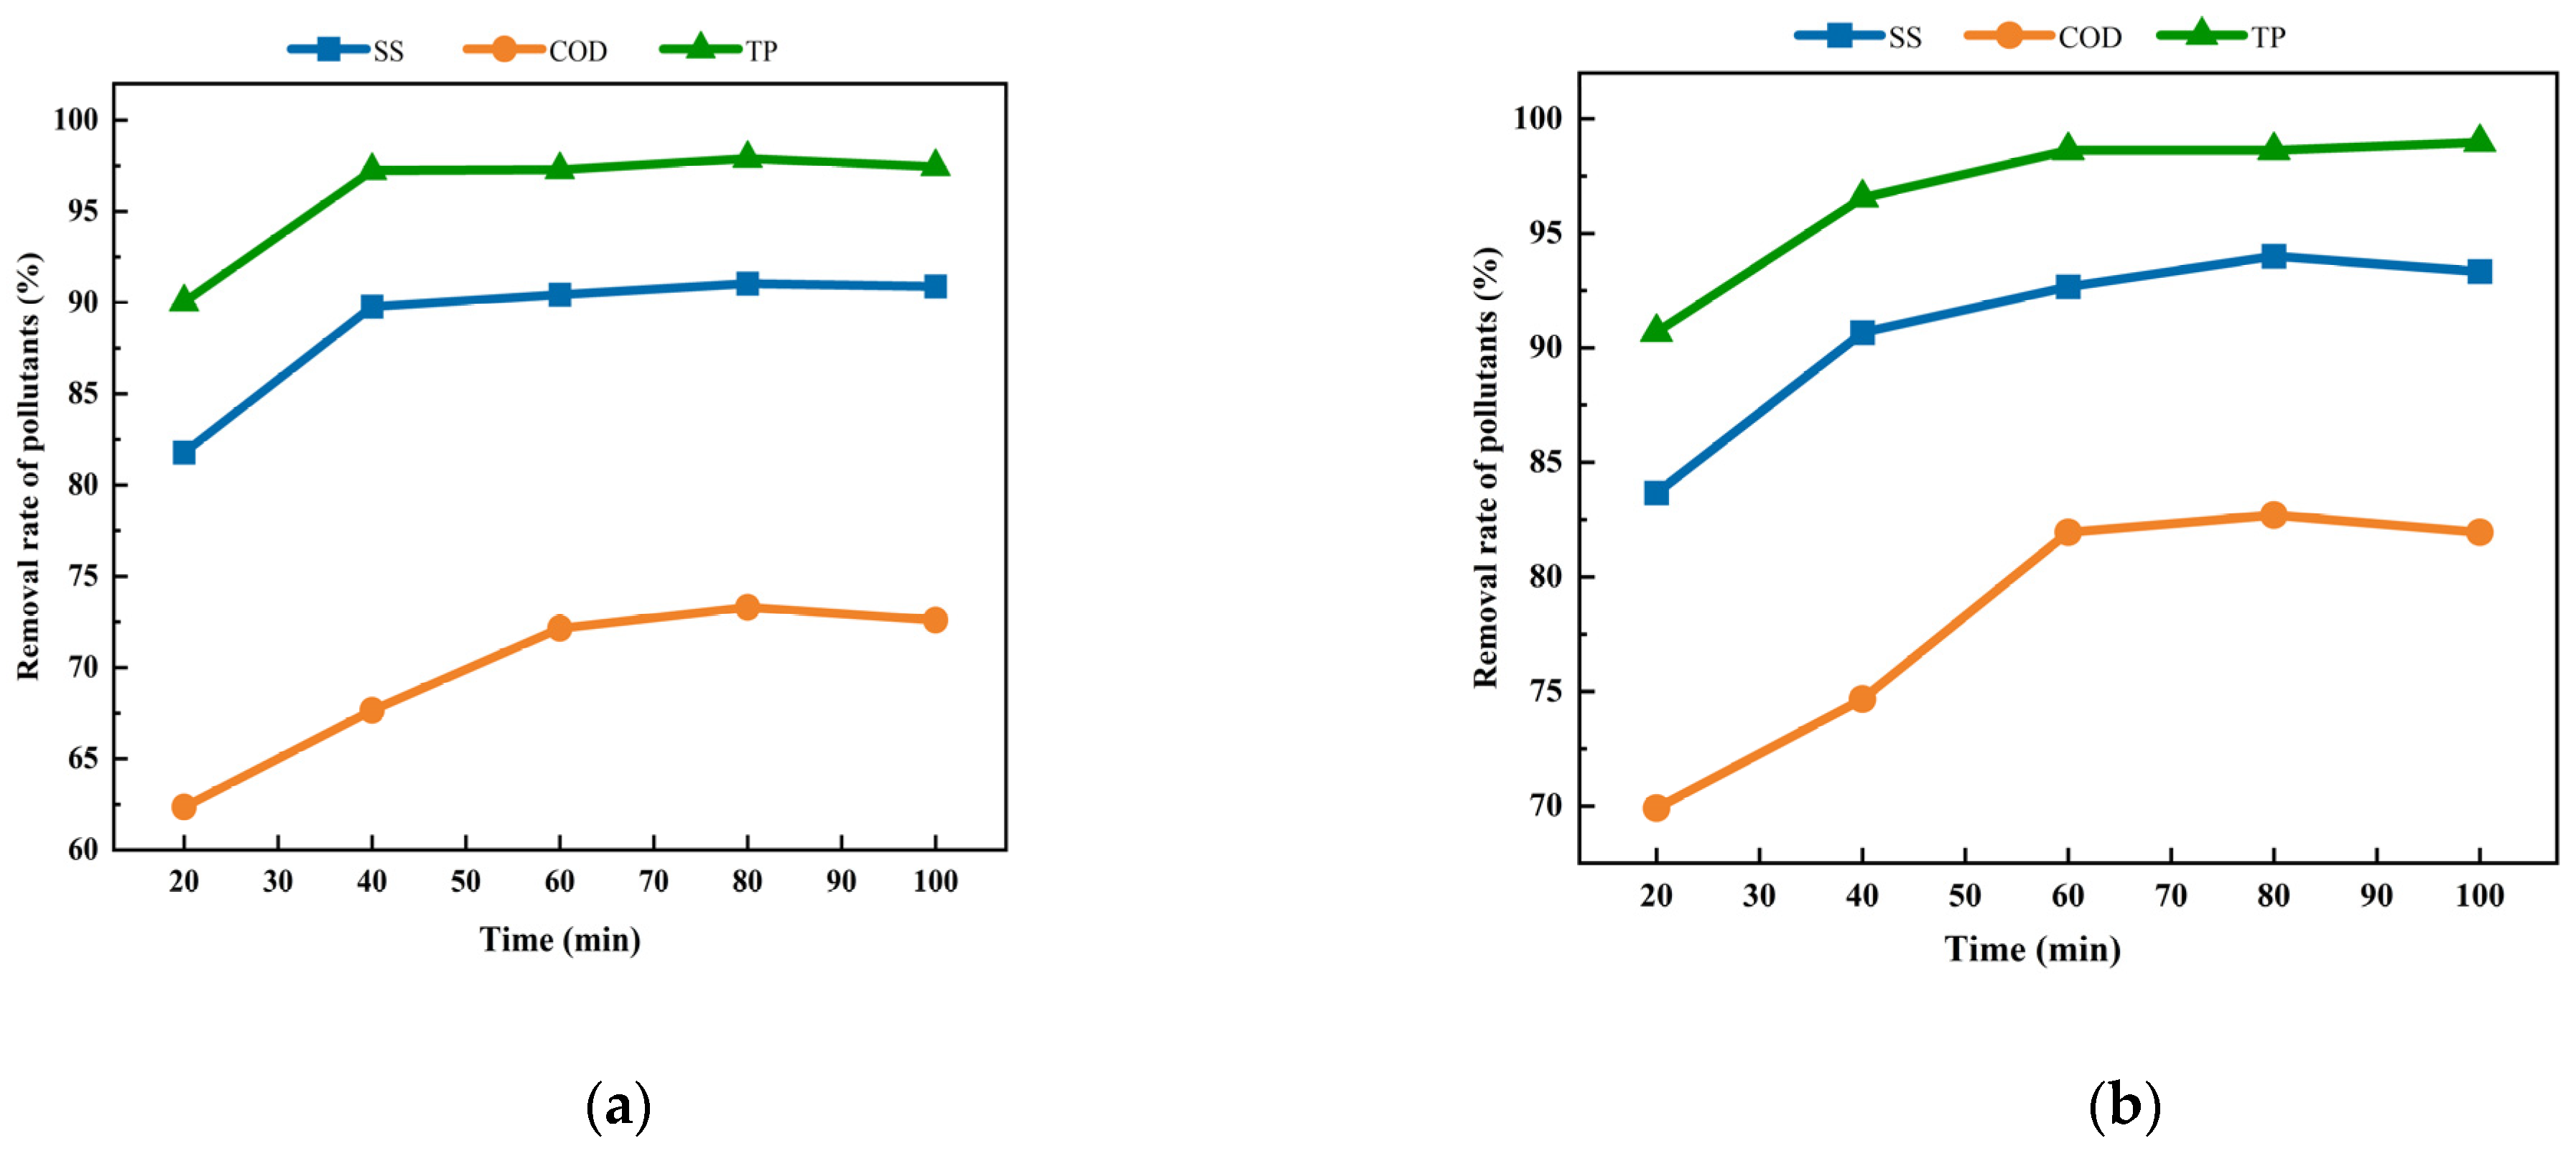
3.3. Analysis of the Pollutant Removal Effect for Different Flow Patterns

To verify the accuracy of the simulation results for flow patterns and considering the interaction of the experimental parameters, flow pattern experiments were performed consecutively, and the removal of SS, COD, and other pollutants was measured under the following experimental conditions: the anode material was a Al-Zn alloy, the number of plates was eight, the current density was 30 A/m2, the distance between plates was 2 cm, the electrode connection mode was a monopole parallel connection, the residence time was 20 min, and the precipitation time was 30 min. The sampling times were 20 min, 40 min, 60 min, 80 min, and 100 min. Continuous flow experiments were conducted with parallel and dislocation perforation flows to verify the final experimental results, as shown in Figure 4 below.
As shown in Figure 4a, in the parallel perforated flow pattern, the removal rates of pollutants by the EC process gradually increased with time in the early stage of treatment and then remained stable. In the first treatment cycle (20 min), the removal rates of SS, COD, and TP were 81.78%, 62.35%, and 90.03%, respectively, and the treatment rate was relatively low. To ensure the regular operation of the EC device, we filled the device with raw water. Therefore, in the first operating cycle, the mixing of raw water in the pool affected the device, resulting in the treatment rate of pollutants not reaching the highest state. With the continuation of the reaction, the raw water that was injected into the pool before the reaction gradually reacted and was discharged. After the water flow pattern reached a stable state, the removal rates of pollutants gradually increased and remained stable. The diagram showed that after 40 min, the removal rates of SS, COD, and TP by the EC process fluctuated slightly around 91.00%, 73.00%, and 97.00%, respectively. Finally, the effluent concentration of pollutant SS was 27 mg/L, the effluent concentration of TP was 0.15 mg/L, and the effluent concentration of COD was 54 mg/L, which did not meet the expected treatment target.
Figure 4b shows that for the flow pattern of dislocation perforation, the trend of the removal rate of pollutants by the EC process with time was approximately like the parallel perforation flow pattern, first rising and then stabilizing. The difference was that for the dislocation perforation flow pattern, the pollutant removal rate at each time point was 2–8 percentage points higher than the parallel perforation flow pattern. At 20 min, the removal rates of SS, COD, and TP were 83.67%, 69.90%, and 90.69%, respectively, which were 1.89%, 7.55%, and 0.66% higher than the parallel perforated flow patterns. After the stable operation, the optimal treatment rates of various pollutants (SS, COD, TP) for the dislocation perforation flow pattern were 94.00%, 81.95%, and 98.97%, respectively, which were 1.96%, 10.1%, and 1.07% higher than the parallel perforation flow pattern. Among them, the improvement of the removal rate of COD was the most obvious because in the state of dislocation perforation flow, the contact time between water and plate was sufficient, and the contact degree was more uniform. The delicate particle COD in water more easily contacted metal flocs; however, some soluble COD decomposed into small molecules through direct redox reactions and was easily removed by flocculant adsorption. The final effluent concentrations of SS, COD, and TP in the dislocation perforation flow were 18 mg/L, 35 mg/L, and 0.05 mg/L, respectively, which met the expected treatment targets.
In addition, in terms of operating energy consumption, the per ton waterpower consumption of the parallel perforated flow EC device was 1.33 kWh. In contrast, the dislocation perforated flow EC device was less, 1.27 kWh. This was because the effect of mass transfer was better for the dislocation perforated flow EC device; tiny bubbles, such as hydrogen and oxygen, did not easily gather between the plates, and metal ions were evenly distributed, which reduced the solution resistance; thus, the required plate voltage was slightly lower for the same current. The combination of the results of flow pattern simulations and experiments showed that the treatment effect was better for the dislocation perforation flow pattern EC device. The pollutant removal rates reached the expected targets, and the operating energy consumption was lower.

3.4. Pilot-Scale ECF Process Performance Analysis for Simulated Rainwater Treatment

3.4.1. Analysis of the Trial Operation Results of the Pilot Experiment under Four Working Conditions

According to Section 3.1.1 of this study, combining iron as the anode material and aluminum as the cathode material has shown the best treatment effect for pollutants under the same experimental conditions. However, this combination leads to a pale-yellow color in the effluent due to the presence of iron ions or unprecipitated metal flocs. This discoloration is a challenging issue in the EC process [28]. After adding the filtration process, on the one hand, in terms of the EC process, a reduction in the current density means that the outflow of iron ions will be relatively reduced. On the other hand, the filtration stage will also intercept the iron ions or iron flocs in the water, thus solving the problem of effluent chromaticity when iron is used as an anode. Therefore, the ECF process was tested using a combination of Fe-Al plates.
In the pilot experimental study, four working conditions were set up for trial operation, as shown in Table 3. By adjusting the residence time, the number of plates, the current density, and the optimal experimental parameters for the pilot experiment were determined.
Figure 5a and Table 4 show the pilot test results under different working conditions.
As can be seen in Figure 5a, under the four working conditions, the EC device reached a stable operation state after a certain period. The EC process operated basically stable at 180 min of working condition Ⅰ and basically stable at 240 min of the remaining working conditions. Compared with working condition Ⅰ, working condition Ⅱ increased the residence time in the EC Reactor and partially improved the SS and COD removal rate; working condition Ⅳ reduced the number of plates, increased the current density and the residence time, and significantly improved the SS, COD, and TP removal effect. However, working condition Ⅲ reduced the number of plates and increased the current density for working condition Ⅰ, which worsened the removal effect of various pollutants. The reason was that the effective contact time between the flocculants and pollutants was reduced, and the pollutants could not be effectively removed with the flocculants flowing out of the EC device.
By and large, the EC process had the best comprehensive removal effect on pollutants under working condition Ⅳ, and the EC device had a basically stable operating state after 4 h of operation. It can effectively remove pollutants in a short time. After the EC process ran stably, working condition Ⅳ had the best removal effect on COD and TP, and the removal effect on SS was second only to working condition Ⅱ. Working condition Ⅰ had poor removal effects on COD and SS, working condition Ⅱ had poor removal effects on TP, and working condition Ⅲ had an overall poor removal effect on pollutants.
Table 4 demonstrates that incorporating the filter basin greatly improved the quality of the effluent during the treatment process. Among them, under working conditions Ⅰ and Ⅱ, the improvement effect of adding the filter on water quality was not as good as under working conditions Ⅲ and Ⅳ, mainly because the backwashing time during the experiment was short, and the backwashing effect was not good. It is important to note that only when operating under condition Ⅳ did the pollutant removal effect meet the anticipated objective. The final removal rates of SS, COD, and TP by the ECF process were 93.01%, 80.51%, and 95.81%, respectively.
Consequently, the experimental parameters of condition Ⅳ were selected as the parameters of the subsequent continuous operation experiment of the pilot plant.

3.4.2. Analysis of the Results from the Continuous Operation Experiment of the Pilot Plant

Considering the frequent rainfall in the rainy season, continuous processing of initial rainwater intercepted by multiple rainfalls may be needed. To verify the stability of the device under long-term operation, the total operation time was set to 7 days, and the remaining experimental parameters were consistent with the fourth working condition. The experimental results are shown in Figure 5b.
Based on Figure 5b, it is evident that the effluent water quality deteriorated significantly after the EC device operated continuously for 24 h, with a mere 27.50% removal rate of SS. Because in the actual operation process of the EC device, the air flotation effect was noticeable, and the tiny flocculant in the water was carried to the surface of the water by the floating bubble to form a scum layer. If the scum at the bottom of the scum layer was not promptly cleaned, it could easily be carried away by the water flow, leading to a significant increase in pollutant concentration in the effluent. During the 24th hour of detection of effluent pollutant concentration, it was observed that despite the deteriorating effluent effect of the EC device, the effluent quality of the filter basin was relatively good. It achieved a 69.38% removal rate for SS, 76.67% for COD, and 96.5% for TP. This indicated that it is necessary to use the filter tank as the subsequent deepening treatment stage, which further improves the impact resistance of the overall device and can effectively ensure the final effluent concentration, even when the effluent quality of the EC tank becomes worse.
Scum was cleaned before sampling on the second day, and water samples were taken for testing half an hour after scum cleaning. On the second day, the concentration of pollutants in the effluent from the EC device was still high. It was considered that the water body was stirred violently during slagging, which caused the metal flocculants in the water body to break and disperse into the water body and run out with the water flow, resulting in poor effluent effect in the initial period after slagging and further affecting the effluent effect of the filter.
In this study, the slag removal treatment was also carried out on the third day, but the sample was taken one hour after slag removal. The sampling time was delayed to ensure that the water flow inside the device reached a stable state again and provided a specific time for the further growth of the metal flocculant. The test results showed that the effluent pollutant concentration was effectively reduced, and the final removal rates of SS, COD, and TP reached 84.38%, 88.71%, and 98.33%, respectively.
On the fourth day, the removal efficiency of all pollutants reached the highest level; the removal rates of SS, COD, and TP were 95.00%, 89.47%, and 98.33%, respectively, and the effluent concentration was 15.00 mg/L, 21.06 mg/L, and 0.11 mg/L, respectively. After the long-term continuous operation of the ECF experimental device, the removal rate of each pollutant stayed stable at more than 90%, meeting the expected treatment target. According to the Technical code for rainwater management and utilization of building and sub-district [56], the water treated by the ECF process in this study could be used as industrial circulating cooling water, and the recovery and utilization of rainwater can be realized. It is also worth saying that the device’s water and electricity consumption was about 0.57 kWh. Combined with the research results of researchers, the device in this study had low energy consumption and economic feasibility and meets the goal of sustainable urban development [37,41,57].
In short, in the actual project, initial rainwater can be quickly pretreated by the EC process to reduce the treatment pressure of the sewage treatment plant, the filtration process can be used as a deep treatment process, and the water body treated by the ECF process can be reused to realize the resource utilization of rainwater.

4. Conclusions

The innovation of this study is that initial rainwater was treated separately, and the electrocoagulation–filtration process was applied to the treatment and recycling of initial rainwater. The pilot-scale experiment was carried out to verify the feasibility of the process in the actual project. In addition, two flow patterns of parallel perforation flow and dislocation perforation flow were set up. The flow pattern of the fluid in the EC device was simulated by COMSOL software. The main results are as follows:
(1)
The analysis of fluid flowcharts and velocity cloud images showed that for the dislocation perforated flow pattern, the fluid flow condition was more complex, and the turbulent effect of the fluid was more substantial. The actual experimental verification of parallel and dislocation perforation flows was performed, and the results showed that under the same experimental conditions, the removal rates of pollutants by the EC process were more significant in the case of dislocation perforation flow, which verified the results of the flow pattern simulations. The SS, COD, and TP removal rates were 94.00%, 81.95%, and 98.97%, respectively.
(2)
The pilot-scale ECF experiment effectively treated initial rainwater, producing high-quality effluent water. The final effluent had an SS of 15.00 mg/L, a COD of 21.06 mg/L, and a TP of 0.11 mg/L, making it suitable for use as urban industrial water. In addition, the energy consumption during operation was low, with an electricity consumption of approximately 0.57 kWh per ton of water. These results confirmed the reliability of the EC process for initial rainwater treatment and demonstrated the stability of continuous long-term operation. Furthermore, it highlighted the practical applicability of the EC process for rainwater treatment in real-world projects.
In this study, the EC process is used to treat initial rainwater quickly with low energy consumption and realize the reuse of the rainwater, reducing the urban non-point source pollution and alleviating the urban water resource demand. It has a specific value and significance for the city’s sustainable development.

Supplementary Materials

The following supporting information can be downloaded at https://www.mdpi.com/article/10.3390/su16010161/s1, Figure S1: The pollutant removal rate in single-factor experiments. (a) combinations of electrode plates; (b) electrolysis time; (c) static settling time; (d) spacing of the electrode plates; (e) current density and number of plates; Table S1: Experimental results for varying current sizes and plate numbers.

Author Contributions

Conceptualization, H.Y. and K.F.; methodology, Z.W. and K.F.; software, K.F.; data curation, Z.W. and K.F.; writing—original draft preparation, Z.W.; writing—review and editing, H.Y., Q.L., K.F. and Z.W.; visualization, Z.W.; funding acquisition, H.Y. All authors have read and agreed to the published version of the manuscript.

Funding

This research was supported by the National Key R&D Plan of China (grant No. 2021YFC3001400) and The Fundamental Research Funds for Beijing University of Civil Engineering and Architecture, No. X20066.

Institutional Review Board Statement

Not applicable.

Informed Consent Statement

Not applicable.

Data Availability Statement

Data are contained within the article.

Conflicts of Interest

Kai Fu was employed by the Wudi County Land Consolidation and Reserve Center in Shandong, China. The remaining authors declare that the research was conducted in the absence of any commercial or financial relationships that could be construed as potential conflicts of interest.

Abbreviations

Some of the abbreviations used in this study are listed below, including suspended matter (SS); chemical oxygen demand (COD); phosphorus (TP); electrocoagulation (EC); electrocoagulation–filtration (ECF); iron (Fe); aluminum (Al); aluminum–magnesium alloy (Al(Mg)); aluminum–zinc alloy (Al(Zn)); Fe-Al electrocoagulation (Fe-Al-EC); Fe-Fe electrocoagulation (Fe-Fe-EC); Al(Zn)-Al electrocoagulation (Al(Zn)-Al-EC); Al(Mg)-Al electrocoagulation (Al(Mg)-Al-EC); Al-Al electrocoagulation (Al-Al-EC); Al-Fe electrocoagulation (Al-Fe-EC).

References

  1. Yang, Z.; Zou, L.; Xia, J.; Qiao, Y.; Bai, F.; Wang, Q.; Cai, D. Spatiotemporal variation characteristics and source identification of water pollution: Insights from urban water system. Ecol. Indic. 2022, 139, 108892. [Google Scholar] [CrossRef]
  2. Huang, L.; Han, X.; Wang, X.; Zhang, Y.; Yang, J.; Feng, A.; Li, J.; Zhu, N. Coupling with high-resolution remote sensing data to evaluate urban non-point source pollution in Tongzhou, China. Sci. Total Environ. 2022, 831, 154632. [Google Scholar] [CrossRef] [PubMed]
  3. Chen, A.; Hui, E.; Wang, N.; Zhou, X.; Gan, F. Study on the Concept and Characteristics of Stormwater First Flush. Environ. Impact Assess. 2022, 44, 58–62. [Google Scholar] [CrossRef]
  4. Qionghua, Z.H.; Qian, W.A.; Xiaochang, W.A.; Fei, C.O. Discussion on road runoff pollution and its utilization standard in typical cities. Chin. J. Environ. Eng. 2016, 10, 3451–3456. [Google Scholar] [CrossRef]
  5. Zheng, Z.; Duan, X.; Lu, S. The application research of rainwater wetland based on the Sponge City. Sci. Total Environ. 2021, 771, 144475. [Google Scholar] [CrossRef] [PubMed]
  6. Zhang, L.; Lan, Y.; Cheng, Y.; Dang, W. Testing and analysis of rainwater quality in Shenyang. J. Southeast Univ. 2014, 30, 246–250. [Google Scholar]
  7. Zhang, Q.; Wang, X.; Hou, P.; Wan, W.; Ren, Y.; Ouyang, Z.; Yang, L. The temporal changes in road stormwater runoff quality and the implications to first flush control in Chongqing, China. Environ. Monit. Assess. 2013, 185, 9763–9775. [Google Scholar] [CrossRef]
  8. Lu, Y. Design Strategy of Emergency Pools at Source Water Protection Areas. J. Archit. Res. Dev. 2022, 6, 35–40. Available online: https://go.exlibris.link/dtypPrjl (accessed on 5 August 2022). [CrossRef]
  9. Yang, L.; Li, J.; Zhou, K.; Feng, P.; Dong, L. The effects of surface pollution on urban river water quality under rainfall events in Wuqing district, Tianjin, China. J. Clean. Prod. 2021, 293, 126136. [Google Scholar] [CrossRef]
  10. Wang, Z.; Gao, J.; Du, Z.; Zhang, Y.; Lai, X. Simulation of interception capacity of Nanhe initial rain storage tanks. IOP Conf. Ser. Ear. Environ. Sci. 2021, 787, 012138. [Google Scholar] [CrossRef]
  11. Selbig, W.R.; Buer, N.; Danz, M.E. Stormwater-quality performance of lined permeable pavement systems. J. Environ. Manag. 2019, 251, 109510. [Google Scholar] [CrossRef] [PubMed]
  12. Molineux, C.J.; Gange, A.C.; Newport, D.J. Using soil microbial inoculations to enhance substrate performance on extensive green roofs. Sci. Total Environ. 2017, 580, 846–856. [Google Scholar] [CrossRef] [PubMed]
  13. Iqbal, H.; Anwar Baig, M. Characterization of First Flush in Urban Highway Runoffs. Environ. Eng. Manag. J. 2015, 14, 45–50. [Google Scholar] [CrossRef]
  14. He, S.; Chen, W.; Mu, X.; Cui, W. Constrained optimization model of the volume of initial rainwater storage tank based on ANN and PSO. Environ. Sci. Pollut. Res. 2020, 27, 21057–21070. [Google Scholar] [CrossRef] [PubMed]
  15. Li, J.; You, X.-Y.; Wang, F.; Ji, M. On Regulation of Urban Runoff Pollution Abatement. In Advances in Computer Science, Intelligent System and Environment; Springer: Berlin/Heidelberg, Germany, 2011; pp. 645–650. [Google Scholar]
  16. Zuo, X.; Zhang, H.; Yu, J. Microbial diversity for the improvement of nitrogen removal in stormwater bioretention cells with three aquatic plants. Chemosphere 2020, 244, 125626. [Google Scholar] [CrossRef] [PubMed]
  17. Luo, Y.; Yue, X.; Duan, Y.; Zhou, A.; Gao, Y.; Zhang, X. A bilayer media bioretention system for enhanced nitrogen removal from road runoff. Sci. Total Environ. 2020, 705, 135893. [Google Scholar] [CrossRef]
  18. Zhou, C.; Wang, M.; Xing, Y.; Zhu, F.; An, Y.; Zhou, Z. Research Progress of Urban Initial Stormwater Pollution and Treatment Measures. Water Purif. Technol. 2022, 41, 17–26. [Google Scholar] [CrossRef]
  19. Qin, P.; Zhu, D.; Jia, X.; Ding, Y.; Feng, H. Flocculation-Magnetic Separation Technology for the Rapid Treatment of First Flush Rain. Environ. Sci. Technol. 2019, 42, 012085. [Google Scholar]
  20. Chen, Y.; Zhao, J.; Hu, B. Study on the pollution load of the urban trunkroad runoff in Xi’an. J. Saf. Environ. 2011, 31, 781–788. [Google Scholar]
  21. Lee, J.Y.; Kim, H.; Kim, Y.; Han, M.Y. Characteristics of the event mean concentration (EMC) from rainfall runoff on an urban highway. Environ. Pollut. 2011, 159, 884–888. [Google Scholar] [CrossRef]
  22. Zhong, D.; Zhang, H.; Li, L.; Xu, Y. Pollution and treatment measures of urban initial rainwater: A review. Environ. Pollut. Control 2019, 41, 224–230. [Google Scholar]
  23. Yang, L.; Wang, Y.; Wang, Y.; Wang, S.; Yue, J.; Guan, G.; Guo, Y.; Zhang, Y.; Zhang, Q. Water quality improvement project for initial rainwater pollution and its performance evaluation. Environ. Res. 2023, 237 Pt 1, 116987. [Google Scholar] [CrossRef] [PubMed]
  24. Hu, Y. Design proposal of treatment process for the inital rainwater treatment plant in old town of Feixi County of Hefei City. Water Purif. Technol. 2019, 38, 47–51. [Google Scholar] [CrossRef]
  25. Tegladza, I.D.; Xu, Q.; Xu, K.; Lv, G.; Lu, J. Electrocoagulation processes: A general review about role of electro-generated flocs in pollutant removal. Process Saf. Environ. Prot. 2021, 146, 169–189. [Google Scholar] [CrossRef]
  26. Balouchi, H.; Baziar, M.; Dehghan, A.; Alidadi, H.; Shams, M. Combination of electrocoagulation and MOF adsorption systems for EBT removal from water. Int. J. Environ. Anal. Chem. 2020, 102, 1307–1317. [Google Scholar] [CrossRef]
  27. Bazrafshan, E.; Mohammadi, L.; Ansari-Moghaddam, A.; Mahvi, A.H. Heavy metals removal from aqueous environments by electrocoagulation process- a systematic review. J. Environ. Health Sci. Eng. 2015, 13, 74. [Google Scholar] [CrossRef] [PubMed]
  28. Xu, J.; Du, X.; Zhao, W.; Wang, Z.; Lu, X.; Zhu, L.; Wang, Z.; Liang, H. Roofing rainwater cleaner production using pilot-scale electrocoagulation coupled with a gravity-driven membrane bioreactor (EC-GDMBR): Water treatment and energy efficiency. J. Clean. Prod. 2021, 314, 128055. [Google Scholar] [CrossRef]
  29. Juan, M.-R.; Belkis, S.-R.; Kelly Joel, G.-T.; Jorge, d.R.-O.; Virgilio, Z.-G. Modeling and Optimization of COD Removal from Cold Meat Industry Wastewater by Electrocoagulation Using Computational Techniques. Processes 2020, 8, 1139. [Google Scholar] [CrossRef]
  30. Alkhatib, A.M.; Hawari, A.H.; Hafiz, M.A.; Benamor, A. A novel cylindrical electrode configuration for inducing dielectrophoretic forces during electrocoagulation. J. Water Process Eng. 2020, 35, 101195. [Google Scholar] [CrossRef]
  31. Ano, J.; Assémian, A.S.; Yobouet, Y.A.; Adouby, K.; Drogui, P. Electrochemical removal of phosphate from synthetic effluent: A comparative study between iron and aluminum by using experimental design methodology. Process Saf. Environ. Prot. 2019, 129, 184–195. [Google Scholar] [CrossRef]
  32. Yilmaz, S.; Gerek, E.E.; Yavuz, Y.; Koparal, A.S. Treatment of vinegar industry wastewater by electrocoagulation with monopolar aluminum and iron electrodes and toxicity evaluation. Water Sci. Technol. 2018, 78, 2542–2552. [Google Scholar] [CrossRef] [PubMed]
  33. Moussa, D.T.; El-Naas, M.H.; Nasser, M.; Al-Marri, M.J. A comprehensive review of electrocoagulation for water treatment: Potentials and challenges. J. Environ. Manag. 2017, 186 Pt 1, 24–41. [Google Scholar] [CrossRef] [PubMed]
  34. Zhang, M.; Chen, H.; Wang, J.; Pan, G. Rainwater utilization and storm pollution control based on urban runoff characterization. J. Environ. Sci. 2010, 22, 40–46. [Google Scholar] [CrossRef] [PubMed]
  35. You, X.-Y.; Li, Y.-W.; Ji, M.; Wang, X.-D.; Zhao, L.-J.; Pan, L.-M. On the Control Strategies of Initial Period Rainwater Pollution in Tianjin City. In Proceedings of the 2010 International Conference on Challenges in Environmental Science and Computer Engineering, Wuhan, China, 6–7 March 2010; pp. 232–235. [Google Scholar] [CrossRef]
  36. SZDB/Z 49-2011; Technical Specifications for Shenzhen Rainwater Utilization Engineering. SMSA: Abu Dhabi, United Arab Emirates, 2011.
  37. Koyuncu, S.; Ariman, S. Domestic wastewater treatment by real-scale electrocoagulation process. Water Sci. Technol. 2020, 81, 656–667. [Google Scholar] [CrossRef] [PubMed]
  38. Boinpally, S.; Kolla, A.; Kainthola, J.; Kodali, R.; Vemuri, J. A state-of-the-art review of the electrocoagulation technology for wastewater treatment. Water Cycle 2023, 4, 26–36. [Google Scholar] [CrossRef]
  39. Holt, P.K.; Barton, G.W.; Mitchell, C.A. The future for electrocoagulation as a localised water treatment technology. Chemosphere 2005, 59, 355–367. [Google Scholar] [CrossRef]
  40. Dickinson, E.J.; Ekström, H.; Fontes, E. COMSOL Multiphysics®: Finite element software for electrochemical analysis. A mini-review. Electrochem. Commun. 2014, 40, 71–74. [Google Scholar] [CrossRef]
  41. Qi, Z.; You, S.; Liu, R.; Chuah, C.J. Performance and mechanistic study on electrocoagulation process for municipal wastewater treatment based on horizontal bipolar electrodes. Front. Environ. Sci. Eng. 2020, 14, 2–9. [Google Scholar] [CrossRef]
  42. Hawari, A.H.; Alkhatib, A.M.; Hafiz, M.; Das, P. A novel electrocoagulation electrode configuration for the removal of total organic carbon from primary treated municipal wastewater. Environ. Sci. Pollut. Res. 2020, 27, 23888–23898. [Google Scholar] [CrossRef]
  43. Al-Barakat, H.S.; Matloub, F.K.; Ajjam, S.K.; Al-Hattab, T.A. Modeling and Simulation of Wastewater Electrocoagulation Reactor. Environ. Pollut. Control 2020, 87, 012002. [Google Scholar] [CrossRef]
  44. Di, Z.; Zhou, L.; Bai, Y.; Ma, K.; Cao, Z.; Zhang, Z. Study on the effect of electrode layout on the performance of electrocoagulation. Water Wastewater Eng. 2020, 56, 513–516+520. [Google Scholar]
  45. Jiang, T.-W.; Huang, Z.-W.; Li, J.-B.; Zhou, Y.-S. Internal flow mechanism of cone-straight nozzle. Pet. Sci. 2021, 18, 1507–1519. [Google Scholar] [CrossRef]
  46. Wei, W.; Li, P.; Hong, Y.; Liu, Y. Numerical simulation study on hydraulic characteristics of wall jets on corrugated beds with limited tailwater. Chin. J. Appl. Mech. 2016, 33, 7. [Google Scholar]
  47. Omwene, P.I.; Kobya, M. Treatment of domestic wastewater phosphate by electrocoagulation using Fe and Al electrodes: A comparative study. Process Saf. Environ. Prot. 2018, 116, 34–51. [Google Scholar] [CrossRef]
  48. Dang, Y.; Lan, S.; Hu, Y.; Luo, X. Influence Factors and Mechanisms of Ni-EDTA Wastewater Treatment by Electrocoagulation with Fe/Al. Sci. Total Environ. 2017, 17, 150–156. [Google Scholar]
  49. Dura, A.; Breslin, C.B. Electrocoagulation using aluminium anodes activated with Mg, In and Zn alloying elements. J. Hazard. Mater. 2019, 366, 39–45. [Google Scholar] [CrossRef]
  50. Dura, A.; Breslin, C.B. The removal of phosphates using electrocoagulation with Al−Mg anodes. J. Electroanal. Chem. 2019, 846, 113161. [Google Scholar] [CrossRef]
  51. Tian, Y.; He, W.; Zhu, X.; Yang, W.; Ren, N.; Logan, B.E. Improved electrocoagulation reactor for rapid removal of phosphate from wastewater. ACS Sustain. Chem. Eng. 2017, 5, 67–71. [Google Scholar] [CrossRef]
  52. Yang, B.; Zhang, F.; Zhang, H.; Zhao, X.; Liu, J. Influence Mechanism of Cu2+ Removal in Wastewater by Electrocoagulation. Environ. Sci. Technol. 2014, 37, 53–56. [Google Scholar]
  53. Wu, D.; Tan, F. Study on flocculation kinetics of turbulence. Ind. Water Treat. 1999, 19, 6–7. [Google Scholar] [CrossRef]
  54. Xia, X.; Lan, S.; Li, X.; Xie, Y.; Liang, Y.; Yan, P.; Chen, Z.; Xing, Y. Characterization and coagulation-flocculation performance of a composite flocculant in high-turbidity drinking water treatment. Chemosphere 2018, 206, 701–708. [Google Scholar] [CrossRef] [PubMed]
  55. Babayemi, K.A.; Onukwuli, D.O.; Okewale, O.A. Statistical Modeling and Optimization of Coag-Flocculation Process of Phosphate Removal from Aqueous Solution Using Ox-Eye Seed (Chrysanthemum leucanthemum) as Coagulant. Adv. Eng. Forum 2018, 28, 90–95. [Google Scholar] [CrossRef]
  56. GB 50400-2016; Technical Code for Rainwater Management and Utilization of Building and Sub-District. China Architecture & Building Press: Beijing, China, 2016.
  57. Carvalho, E.H.d.S.; Cuba, R.; Carvalho, R.V.d.; Marra, E. Application of eletrocoagulation/flotation process for rainwater reuse. Period. Tche Quim. 2019, 16, 89–94. [Google Scholar] [CrossRef]
Figure 1. Experimental device diagram. (a) Plan view of the EC device: 1. water intake tank; 2. water inlet pipe; 3. peristaltic pump; 4. electrocoagulation reactor; 5. perforated plate; 6. cathode power line; 7. DC power supply; 8. anode power line; 9. water outlet pipe; 10. sedimentation tank. (b) Plan view of the pilot-scale ECF reactor: 1. water inlet pipe; 2. lift pump; 3. EC device; 4. DC power supply; 5. cathode power cord; 6. anode power cable; 7. perforated plate; 8. slag baffle plate; 9. inclined plate sedimentation tank; 10. mud pipe; 11. discharge pipe of the electrocoagulation device; 12. filter basin; 13. overflow trough; 14. filter material layer; 15. aeration pipe; 16. filter outlet pipe. (c) Site layout of the EC device.
Sustainability 16 00161 g001
Figure 2. The layout of the metal plate in the EC device and internal grid division diagram. (a) Parallel perforation; (b) dislocation perforation.
Sustainability 16 00161 g002
Figure 3. A streamline diagram and kinetic energy diagram of the fluid in the device under different flow conditions. (a) Parallel perforated flow; (b) dislocation perforated flow.
Sustainability 16 00161 g003
Figure 4. The removal effect of the EC device on each pollutant under different flow conditions. (a) Parallel perforated flow; (b) dislocation perforated flow.
Sustainability 16 00161 g004
Figure 5. The removal effect of the EC process on pollutants. (a) The trial operation results of the pilot experiment under four working conditions; (b) the results of the continuous operation experiment of the pilot plant.
Sustainability 16 00161 g005
Table 1. Experimental water quality and effluent concentration.
PollutantSSCODTP
Initial concentration300–310 mg/L190–210 mg/L5–6 mg/L
Effluent discharge Concentration30 mg/L40 mg/L0.2 mg/L
Target removal rate90%80%96%
Table 2. The optimal values of different parameters.
Experimental ParameterExperimental Value RangeRecommended Value RangeOptimal Value of This Time 1
Reaction time10–60 min20–40 min30 min
Settling time10–60 min20–40 min30 min
Plate spacing1–5 cm2–3 cm2 cm
Number of platesFour to eight piecesSix to eight pieceseight pieces
Current density20–100 A/m240–60 A/m240 A/m2
1 The optimal value was a comprehensive selection considering removal effect, operation energy consumption, and construction cost.
Table 3. The specific experimental parameters corresponding to the four working conditions.
Working ConditionCombinations of Electrode PlatesNumber of Metal Anode PlatesCurrent Density (A/m2)Residence Time in EC Reactor (min)Spacing of the Electrode Plates (cm)
IFe-Al1613.89302
IIFe-Al1613.89452
IIIFe-Al1022.22302
IVFe-Al1022.22452
Table 4. Comparison table of the pollutant removal effect of the two stages of the ECF process under different working conditions.
Working ConditionWater Treatment ReactorTime (min)Removal Rate of Pollutant SS (%)Removal Rate of Pollutant COD (%)Removal Rate of Pollutant SS (%)
IEC24062.1258.5792.58
filtration24069.7065.5093.96
IIEC30077.0465.6689.49
filtration30088.8973.4693.64
IIIEC30054.7353.4879.12
filtration30083.7878.2296.47
IVEC30074.8974.0294.03
filtration30093.0180.5195.81
Disclaimer/Publisher’s Note: The statements, opinions and data contained in all publications are solely those of the individual author(s) and contributor(s) and not of MDPI and/or the editor(s). MDPI and/or the editor(s) disclaim responsibility for any injury to people or property resulting from any ideas, methods, instructions or products referred to in the content.

