
Effects of Organic Fertilizers on the Quality, Yield, and Fatty Acids of Maize and Soybean in Southeast Kazakhstan
 , , ,
, , ,
Abstract
:1. Introduction
2. Materials and Methods
2.1. Data Collection
2.2. Site Description and Experimental Design
2.3. Determination of Fertilizer NPK and Efficiency
2.4. Determination of Quality Parameters of Maize and Soybean
2.5. Sample Preparation for Fatty Acid Determination
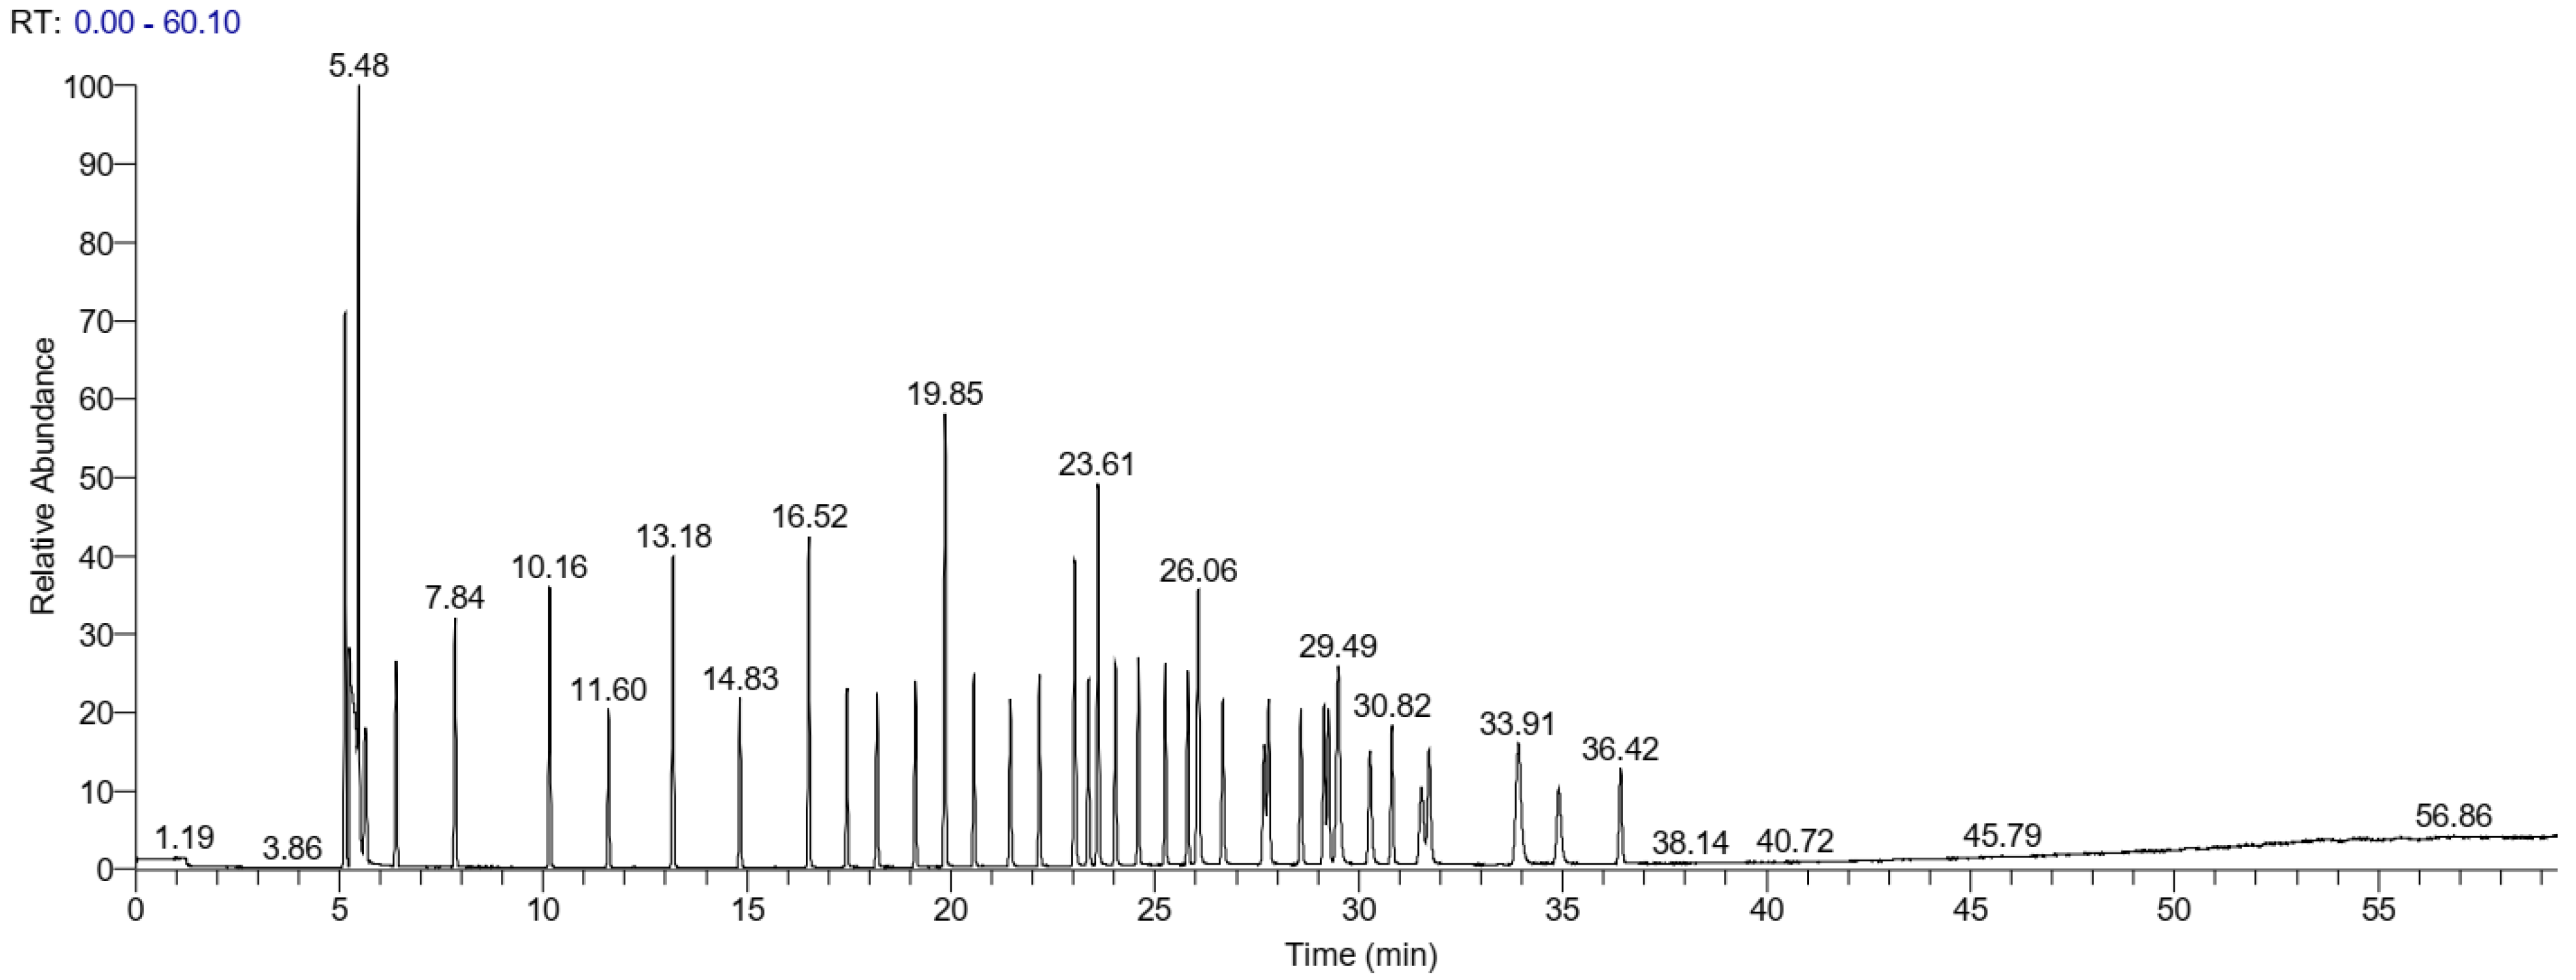
2.6. Fatty Acid Methyl Ester (FAME) Preparation and GC/MS Analysis
2.7. Validation of GC/MS Analysis
2.8. Statistical Analysis
3. Results and Discussion
3.1. Fertilizer Application
3.2. Effects of Different Fertilizers on Maize and Soybean Quality
3.3. Effects of Different Fertilizers on Yield of Maize and Soybean
3.4. Validation of Method by GC/MS for Fatty Acids
3.5. Determination of Fatty Acids in Vegetable Oils
3.6. Principal Component Analysis
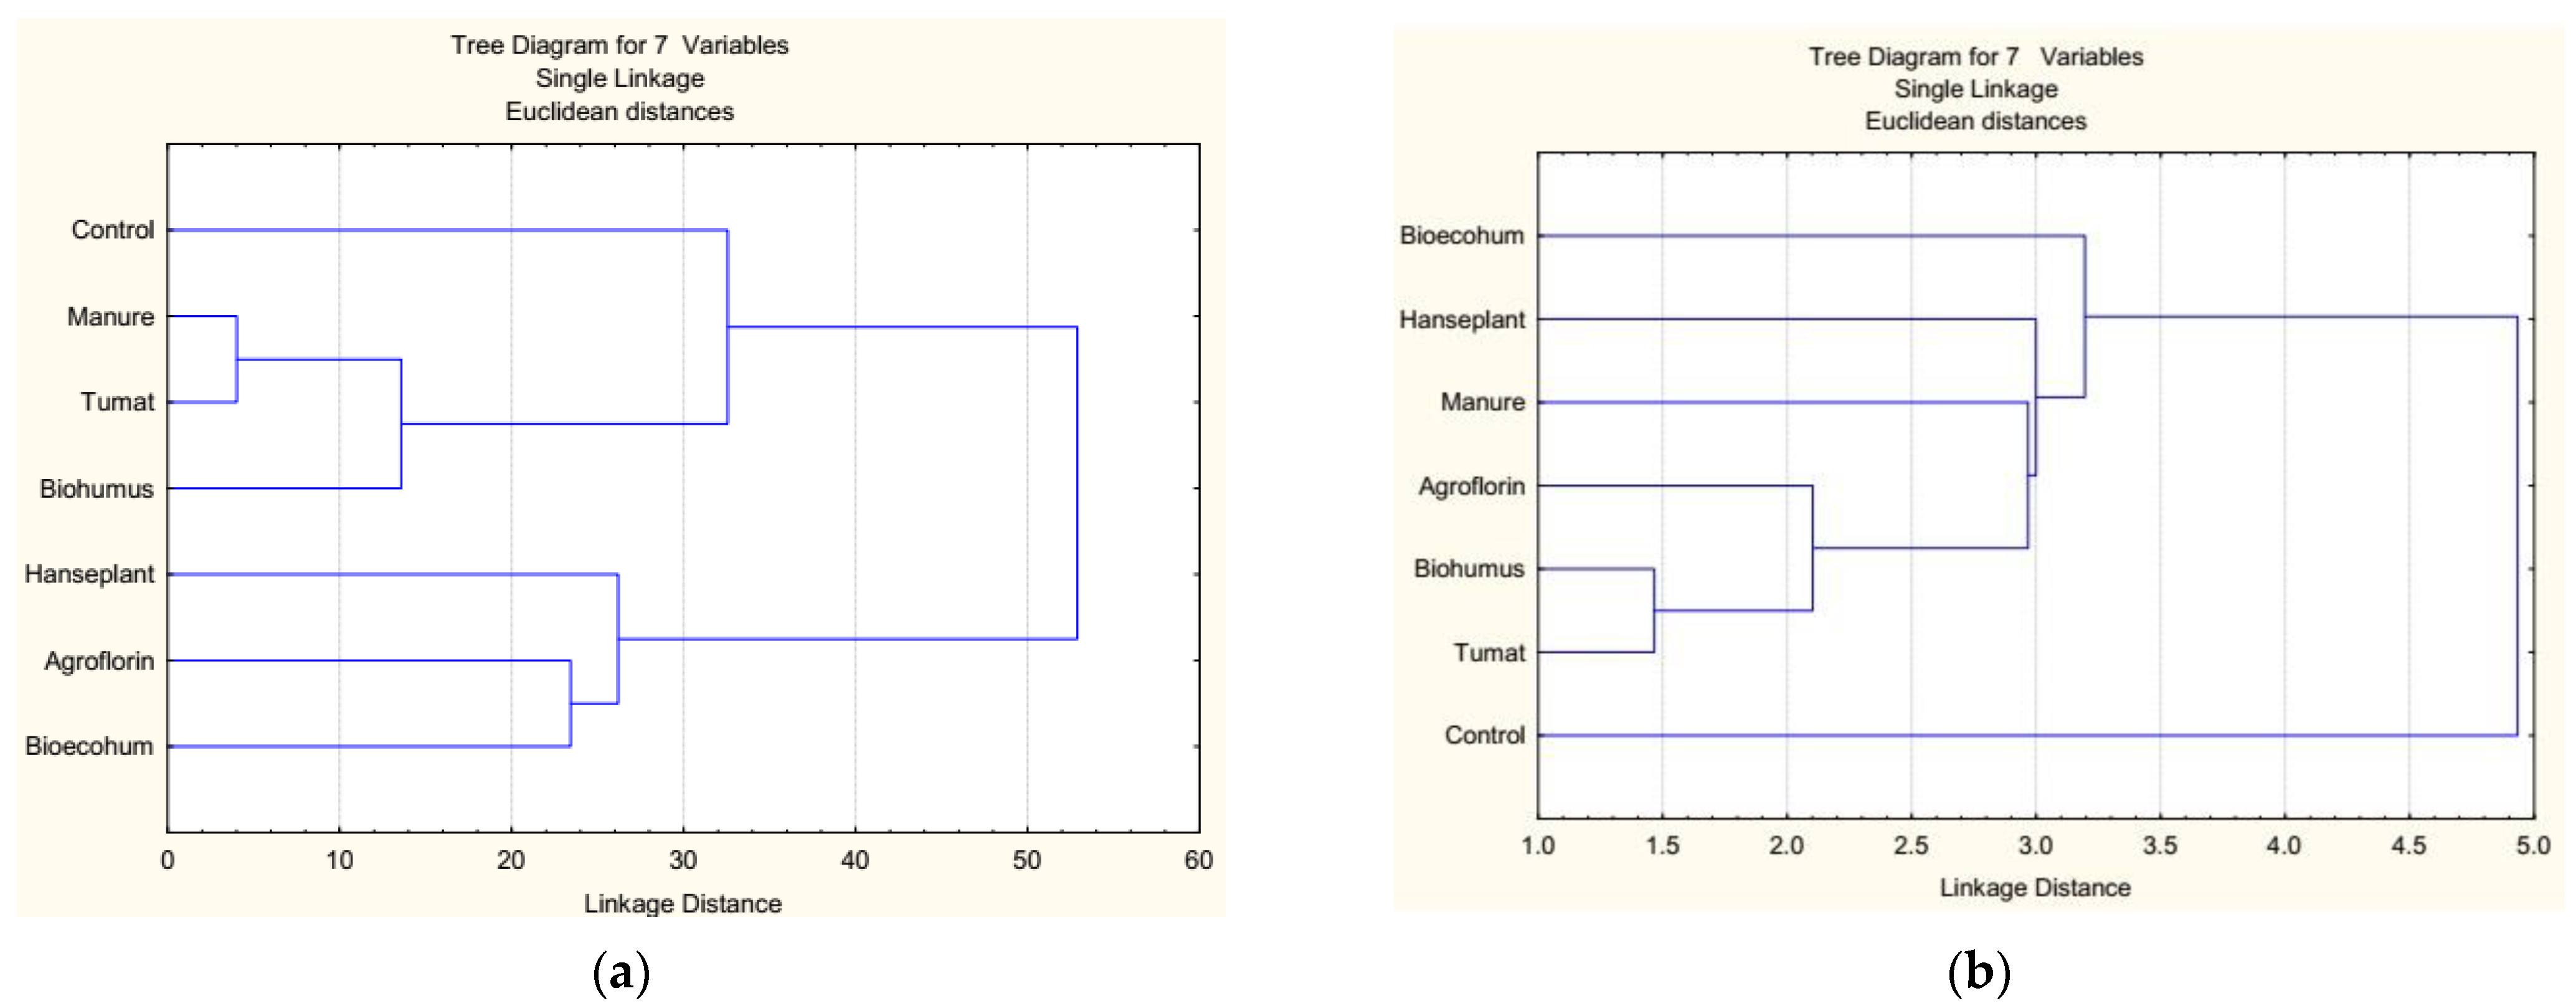
3.7. Cluster Analysis
3.8. Correlation Analysis
4. Conclusions
Supplementary Materials
Author Contributions
Funding
Institutional Review Board Statement
Informed Consent Statement
Data Availability Statement
Conflicts of Interest
References
- Reganold, J.P.; Wachter, J.M. Organic agriculture in the twenty-first century. Nat. Plants 2016, 2, 15221. [Google Scholar] [CrossRef] [PubMed]
- Willer, H.; Trávníček, J.; Meier, C.; Schlatter, B. The World of Organic Agriculture 2021-Statistics and Emerging Trends. Research Institute of Organic Agriculture FiBL, Frick, Switzerland, IFOAM—Organics International, Bonn, Germany. 2021. Available online: https://www.organic-world.net/yearbook/yearbook-2021.html (accessed on 13 August 2023).
- Rempelos, L.; Baranski, M.; Wang, J.; Adams, T.N.; Adebusuyi, K.; Beckman, J.J.; Brockbank, C.J.; Douglas, B.S.; Feng, T.; Greenway, J.D.; et al. Integrated Soil and Crop Management in Organic Agriculture: A Logical Framework to Ensure Food Quality and Human Health? Agronomy 2021, 11, 2494. [Google Scholar] [CrossRef]
- Caradonia, F.; Battaglia, V.; Righi, L.; Pascali, G.; La Torre, A. Plant biostimulant regulatory framework: Prospects in Europe and current situation at international level. J. Plant Growth Regul. 2019, 38, 438–448. [Google Scholar] [CrossRef]
- Al-Suhaibani, N.; Selim, M.; Alderfasi, A.; El-Hendawy, S. Integrated Application of Composted Agricultural Wastes, Chemical Fertilizers and Biofertilizers as an Avenue to Promote Growth, Yield and Quality of Maize in an Arid Agro-Ecosystem. Sustainability 2021, 13, 7439. [Google Scholar] [CrossRef]
- Bernal, M.P.; Sommer, S.G.; Chadwick, D.; Qing, C.; Guoxue, L.; Michel Jr, F.C. Current approaches and future trends in compost quality criteria for agronomic, environmental, and human health benefits. Adv. Agron. 2017, 144, 143–233. [Google Scholar] [CrossRef]
- Zulfiqar, F.; Casadesús, A.; Brockman, H.; Munné-Bosch, S. An overview of plant-based natural biostimulants for sustainable horticulture with a particular focus on moringa leaf extracts. Plant Sci. 2020, 295, 110194. [Google Scholar] [CrossRef] [PubMed]
- Nosheen, S.; Ajmal, I.; Song, Y. Microbes as Biofertilizers, a Potential Approach for Sustainable Crop Production. Sustainability 2021, 13, 1868. [Google Scholar] [CrossRef]
- Lazarovits, G. Management of soil-borne plant pathogens with organic soil amendments: A disease control strategy salvaged from the past. Can. J. Plant Pathol. 2001, 23, 1–7. [Google Scholar] [CrossRef]
- Miransari, M. Soil microbes and plant fertilization. Appl. Microbiol. Biotechnol. 2011, 92, 875–885. [Google Scholar] [CrossRef]
- Kuldybayev, N.; Dutbayev, Y.; Konstantinova, O.; Borodulin, D.; Yessimbekova, M.; Daugaliyeva, S.; Toishimanov, M.; Yesserkenov, A.; Bastaubaeva, S.; Temreshev, I. Identification and Pathogenicity of the Soybean Root Rot Pathogen in Arid Conditions. OnLine J. Biol. Sci. 2023, 23, 202–209. [Google Scholar] [CrossRef]
- The FAO’s Crops and Livestock Products Statistics (FAOSTAT). Crops and Livestock Products. Available online: https://www.fao.org/faostat/en/#data/QCL (accessed on 17 July 2022).
- Lin, S.; Pi, Y.; Long, D.; Duan, J.; Zhu, X.; Wang, X.; He, J.; Zhu, Y. Impact of Organic and Chemical Nitrogen Fertilizers on the Crop Yield and Fertilizer Use Efficiency of Soybean–Maize Intercropping Systems. Agriculture 2022, 12, 1428. [Google Scholar] [CrossRef]
- El-Tahlawy, Y.A.; Ali, O.A. 11 Role of Humic Substances on Growth and Yield of Crop plant. In Biostimulants for Crop Production and Sustainable Agriculture; Hasanuzzaman, M., Hawrylak-Nowak, B., Islam, T., Fujita, M., Eds.; CAB International: Boston, MA, USA, 2022; pp. 159–178. [Google Scholar]
- Kussainova, M.; Toishimanov, M.; Iskakova, G.; Nurgali, N.; Chen, J.Q. Effects of different fertilization practices on CH4 and N2O emissions in various crop cultivation systems: A case study in Kazakhstan. Eurasian J. Soil Sci. 2023, 12, 363–370. [Google Scholar] [CrossRef]
- Dutbayev, Y.; Kharipzhanova, A.; Yessimbekova, M.; Toishimanov, M.; Lozowicka, B.; Iwaniuk, P.; Bastaubaeva, S.; Kokhmetova, A. Ochratoxin A and Deoxynivalenol Mycotoxin Profile in Triticale Seedlings with Different Susceptibility to the Root Rot. OnLine J. Biol. Sci. 2023, 23, 87–93. [Google Scholar] [CrossRef]
- Hussain, A.; Zahir, Z.A.; Ditta, A.; Tahir, M.U.; Ahmad, M.; Mumtaz, M.Z.; Hayat, K.; Hussain, S. Production and Implication of Bio-Activated Organic Fertilizer Enriched with Zinc-Solubilizing Bacteria to Boost up Maize (Zea mays L.) Production and Biofortification under Two Cropping Seasons. Agronomy 2020, 10, 39. [Google Scholar] [CrossRef]
- Nguma, E.; Munthali, C.; Murayama, D.; Onishi, K.; Mori, M.; Kinoshita, R.; Yamashita, S.; Kinoshita, M.; Tani, M.; Palta, M.; et al. Fertilizer Effects on Endosperm Physicochemical Properties and Resistance to Larger Grain Borer, Prostephanus truncatus (Coleoptera: Bostrichidae), in Malawian Local Maize (Zea mays L.) Varieties: Potential for Utilization of Ca and Mg Nutrition. Agronomy 2022, 12, 46. [Google Scholar] [CrossRef]
- Szpunar-Krok, E.; Wondołowska-Grabowska, A.; Bobrecka-Jamro, D.; Jańczak-Pieniążek, M.; Kotecki, A.; Kozak, M. Effect of Nitrogen Fertilisation and Inoculation with Bradyrhizobium japonicum on the Fatty Acid Profile of Soybean (Glycine max (L.) Merrill) Seeds. Agronomy 2021, 11, 941. [Google Scholar] [CrossRef]
- Li, Z.; Hong, T.; Zhao, Z.; Gu, Y.; Guo, Y.; Han, J. Fatty Acid Profiles and Nutritional Evaluation of Fresh Sweet-Waxy Corn from Three Regions of China. Foods 2022, 11, 2636. [Google Scholar] [CrossRef]
- Gao, J.; Hao, X.; Thelen, K.D.; Robertson, G.P. Agronomic management system and precipitation effects on soybean oil and fatty acid profiles. Crop Sci. 2009, 49, 1049–1057. [Google Scholar] [CrossRef]
- Yin, X.; Bellaloui, N.; McClure, A.M.; Tyler, D.D.; Mengistu, A. Phosphorus fertilization differentially influences fatty acids, protein, and oil in soybean. Am. J. Plant Sci. 2016, 7, 1975–1992. [Google Scholar] [CrossRef]
- Krueger, K.; Goggi, A.S.; Mallarino, A.P.; Mullen, R.E. Phosphorus and Potassium Fertilization Effects on Soybean Seed Quality and Composition. Crop Sci. 2013, 53, 602. [Google Scholar] [CrossRef]
- Daurova, A.; Daurov, D.; Volkov, D.; Zhapar, K.; Raimbek, D.; Shamekova, M.; Zhambakin, K. Doubled haploids of interspecific hybrids between Brassica napus and Brassica rapa for canola production with valuable breeding traits. OCL 2020, 27, 45. [Google Scholar] [CrossRef]
- The FAO’s Crops and Livestock Products Statistics (FAOSTAT). Fertilizers Indicators. Available online: https://data.apps.fao.org/catalog/dataset/fertilizers-indicators-national-global-annual-faostat (accessed on 10 February 2022).
- Bureau of National Statistics of the Republic of Kazakhstan. Statistics of Agriculture, Forestry, Hunting and Fisheries. Main Indicators of Crop Production. Available online: https://stat.gov.kz/ru/industries/business-statistics/stat-forrest-village-hunt-fish/spreadsheets/ (accessed on 31 January 2023).
- Beesigamukama, D.; Mochoge, B.; Korir, N.; Musyoka, M.W.; Fiaboe, K.K.M.; Nakimbugwe, D.; Khamis, F.M.; Subramanian, S.; Dubois, T.; Ekesi, S.; et al. Nitrogen Fertilizer Equivalence of Black Soldier Fly Frass Fertilizer and Synchrony of Nitrogen Mineralization for Maize Production. Agronomy 2020, 10, 1395. [Google Scholar] [CrossRef]
- Johan, P.D.; Ahmed, O.H.; Hasbullah, N.A.; Omar, L.; Paramisparam, P.; Hamidi, N.H.; Jalloh, M.B.; Musah, A.A. Phosphorus Sorption following the Application of Charcoal and Sago (Metroxylon sagu) Bark Ash to Acid Soils. Agronomy 2022, 12, 3020. [Google Scholar] [CrossRef]
- Toishimanov, M.; Abilda, Z.; Daurov, D.; Daurova, A.; Zhapar, K.; Sapakhova, Z.; Kanat, R.; Stamgaliyeva, Z.; Zhambakin, K.; Shamekova, M. Phytoremediation Properties of Sweet Potato for Soils Contaminated by Heavy Metals in South Kazakhstan. Appl. Sci. 2023, 13, 9589. [Google Scholar] [CrossRef]
- Le, A.V.; Parks, S.E.; Nguyen, M.H.; Roach, P.D. Physicochemical Properties of Gac (Momordica cochinchinensis (Lour.) Spreng) Seeds and Their Oil Extracted by Supercritical Carbon Dioxide and Soxhlet Methods. Technologies 2018, 6, 94. [Google Scholar] [CrossRef]
- Shi, S.; Wang, E.; Li, C.; Zhou, H.; Cai, M.; Cao, C.; Jiang, Y. Comprehensive Evaluation of 17 Qualities of 84 Types of Rice Based on Principal Component Analysis. Foods 2021, 10, 2883. [Google Scholar] [CrossRef]
- Khrisanapant, P.; Kebede, B.; Leong, S.Y.; Oey, I. A Comprehensive Characterisation of Volatile and Fatty Acid Profiles of Legume Seeds. Foods 2019, 8, 651. [Google Scholar] [CrossRef]
- Miroshnichenko, D.; Timerbaev, V.; Klementyeva, A.; Pushin, A.; Sidorova, T.; Litvinov, D.; Nazarova, L.; Shulga, O.; Divashuk, M.; Karlov, G.; et al. CRISPR/Cas9-induced modification of the conservative promoter region of VRN-A1 alters the heading time of hexaploid bread wheat. Front. Plant Sci. 2022, 13, 1048695. [Google Scholar] [CrossRef]
- Mandha, J.; Shumoy, H.; Matemu, A.O.; Raes, K. Valorization of Mango By-Products to Enhance the Nutritional Content of Maize Complementary Porridges. Foods 2021, 10, 1635. [Google Scholar] [CrossRef]
- Toishimanov, M.; Nurgaliyeva, M.; Serikbayeva, A.; Suleimenova, Z.; Myrzabek, K.; Shokan, A.; Myrzabayeva, N. Comparative Analysis and Determination of the Fatty Acid Composition of Kazakhstan’s Commercial Vegetable Oils by GC-FID. Appl. Sci. 2023, 13, 7910. [Google Scholar] [CrossRef]
- Di Stefano, V.; Bongiorno, D.; Buzzanca, C.; Indelicato, S.; Santini, A.; Lucarini, M.; Fabbrizio, A.; Mauro, M.; Vazzana, M.; Arizza, V.; et al. Fatty Acids and Triacylglycerols Profiles from Sicilian (Cold Pressed vs. Soxhlet) Grape Seed Oils. Sustainability 2021, 13, 13038. [Google Scholar] [CrossRef]
- Validation of Analytical Procedures: Text and Methodology. In ICH Harmonization Tripartite Guideline; European Medicines Agency: Geneva, Switzerland, 2005; pp. 1–13. Available online: https://database.ich.org/sites/default/files/Q2%28R1%29%20Guideline.pdf (accessed on 12 February 2022).
- Huculak-Mączka, M.; Hoffmann, J.; Hoffmann, K. Evaluation of the possibilities of using humic acids obtained from lignite in the production of commercial fertilizers. J. Soils Sediments 2018, 18, 2868–2880. [Google Scholar] [CrossRef]
- Canellas, L.P.; Olivares, F.L.; Aguiar, N.O.; Jones, D.L.; Nebbioso, A.; Mazzei, P.; Piccolo, A. Humic and fulvic acids as biostimulants in horticulture. Sci. Hortic. 2015, 196, 15–27. [Google Scholar] [CrossRef]
- Ozlu, E.; Sandhu, S.S.; Kumar, S.; Arriaga, F.J. Soil health indicators impacted by long-term cattle manure and inorganic fertilizer application in a corn-soybean rotation of South Dakota. Sci. Rep. 2019, 9, 11776. [Google Scholar] [CrossRef]
- Li, Y.; Xie, Z.; Zhou, M.; Liu, C.; Yu, Z.; Wu, J.; Jin, J.; Chen, Y.; Zhang, X.; Liu, X. Soybean yield and quality relative to Mollisols fertility with 7-year consecutive cattle manure application under maize-soybean rotation. Land Degrad. Dev. 2021, 32, 4740–4754. [Google Scholar] [CrossRef]
- Sible, C.N.; Seebauer, J.R.; Below, F.E. Plant Biostimulants: A Categorical Review, Their Implications for Row Crop Production, and Relation to Soil Health Indicators. Agronomy 2021, 11, 1297. [Google Scholar] [CrossRef]
- Księżak, J.; Bojarszczuk, J. The Effect of Mineral N Fertilization and Bradyrhizobium japonicum Seed Inoculation on Productivity of Soybean (Glycine max (L.) Merrill). Agriculture 2022, 12, 110. [Google Scholar] [CrossRef]
- Efthimiadou, A.; Sparangis, P.; Leonidakis, D.; Kasimatis, C.-N.; Kakabouki, I.; Mylonas, I.; Ninou, E.; Gianniotis, P.; Katsenios, N. Comparative Evaluation of Mineral and Organo-Mineral Nitrogen Fertilization and the Role of Amino Acids as Plant Growth Promoters in Maize Cultivation. Agronomy 2022, 12, 2638. [Google Scholar] [CrossRef]
- Ghodpage, R.M.; Balpande, S.S.; Babhulkar, V.P.; Sarika, P. Effect of phosphorus and zinc fertilization on nutrient content in root, yield and nutritional quality of maize. J. Soils Crops 2008, 18, 458–461. [Google Scholar]
- Zhang, M.; Mukhamed, B.; Yang, Q.; Luo, Y.; Tian, L.; Yuan, Y.; Huang, Y.; Feng, B. Biochar and Nitrogen Fertilizer Change the Quality of Waxy and Non-Waxy Broomcorn Millet (Panicum miliaceum L.) Starch. Foods 2023, 12, 3009. [Google Scholar] [CrossRef]
- Batyrbek, M.; Abbas, F.; Fan, R.; Han, Q. Influence of Mineral Fertilizer and Manure Application on the Yield and Quality of Maize in Relation to Intercropping in the Southeast Republic of Kazakhstan. Plants 2022, 11, 2644. [Google Scholar] [CrossRef] [PubMed]
- Jjagwe, J.; Chelimo, K.; Karungi, J.; Komakech, A.J.; Lederer, J. Comparative Performance of Organic Fertilizers in Maize (Zea mays L.) Growth, Yield, and Economic Results. Agronomy 2020, 10, 69. [Google Scholar] [CrossRef]
- Glaser, B.; Wiedner, K.; Seelig, S.; Schmidt, H.P.; Gerber, H. Biochar organic fertilizers from natural resources as substitute for mineral fertilizers. Agron. Sustain. Dev. 2015, 35, 667–678. [Google Scholar] [CrossRef]
- Guo, L.; Wu, G.; Li, C.; Liu, W.; Yu, X.; Cheng, D.; Jiang, G. Vermicomposting with maize increases agricultural benefits by 304%. Agron. Sustain. Dev. 2015, 35, 1149–1155. [Google Scholar] [CrossRef]
- Gao, C.; El-Sawah, A.M.; Ali, D.F.I.; Alhaj Hamoud, Y.; Shaghaleh, H.; Sheteiwy, M.S. The Integration of Bio and Organic Fertilizers Improve Plant Growth, Grain Yield, Quality and Metabolism of Hybrid Maize (Zea mays L.). Agronomy 2020, 10, 319. [Google Scholar] [CrossRef]
- Baghdadi, A.; Halim, R.A.; Ghasemzadeh, A.; Ramlan, M.F.; Sakimin, S.Z. Impact of organic and inorganic fertilizers on the yield and quality of silage corn intercropped with soybean. PeerJ 2018, 6, e5280. [Google Scholar] [CrossRef]
- Prommaban, A.; Kuanchoom, R.; Seepuan, N.; Chaiyana, W. Evaluation of Fatty Acid Compositions, Antioxidant, and Pharmacological Activities of Pumpkin (Cucurbita moschata) Seed Oil from Aqueous Enzymatic Extraction. Plants 2021, 10, 1582. [Google Scholar] [CrossRef]
- Zuil, S.G.; Izquierdo, N.G.; Luján, J.; Cantarero, M.; Aguirrezábal, L.A.N. Oil quality of maize and soybean genotypes with increased oleic acid percentage as affected by intercepted solar radiation and temperature. Field Crops Res. 2012, 127, 203–214. [Google Scholar] [CrossRef]
- Sanjeev, P.; Chaudhary, D.P.; Sreevastava, P.; Saha, S.; Rajenderan, A.; Sekhar, J.C.; Chikkappa, G.K. Comparison of fatty acid profile of specialty maize to normal maize. J. Am. Oil Chem. Soc. 2014, 91, 1001–1005. [Google Scholar] [CrossRef]
- Hariri, N.; Gougeon, R.; Thibault, L. A highly saturated fat-rich diet is more obesogenic than diets with lower saturated fat content. Nutr. Res. 2010, 30, 632–643. [Google Scholar] [CrossRef]
- Ruiz-Núñez, B.; Dijck-Brouwer, D.J.; Muskiet, F.A. The relation of saturated fatty acids with low-grade inflammation and cardiovascular disease. J. Nutr. Biochem. 2016, 36, 1–20. [Google Scholar] [CrossRef] [PubMed]
- Simopoulos, A.P. The importance of the ratio of omega-6/omega-3 essential fatty acids. Biomed. Pharmacother. 2002, 56, 365–379. [Google Scholar] [CrossRef] [PubMed]
- Gazem, R.A.A.; Chandrashekariah, S.A. Omega Fatty Acids in Health and Disease: A Review. J. Pharm. Res. 2014, 8, 1027–1044. Available online: https://www.academia.edu/14952628/Omega_Fatty_Acids_in_Health_and_Disease_A_Review (accessed on 29 March 2023).
- Bellaloui, N.; Yin, X.; Mengistu, A.; McClure, A.M.; Tyler, D.D.; Reddy, K.N. Soybean Seed protein, oil, fatty acids, and isoflavones altered by potassium fertilizer rates in the midsouth. Am. J. Plant Sci. 2013, 4, 976–988. [Google Scholar] [CrossRef]
- Sharifi, R.S.; Namvar, A.; Sharifi, R.S. Grain filling and fatty acid composition of safflower fertilized with integrated nitrogen fertilizer and biofertilizers. Pesqui. Agropecuária Bras. 2019, 52, 236–243. [Google Scholar] [CrossRef]
- Silva, L.R.; Pereira, M.J.; Azevedo, J.; Mulas, R.; Velazquez, E.; González-Andrés, F.; Valentão, P.; Andrade, P.B. Inoculation with Bradyrhizobium japonicum enhances the organic and fatty acids content of soybean (Glycine max (L.) Merrill) seeds. Food Chem. 2013, 141, 3636–3648. [Google Scholar] [CrossRef]
- Pande, M.; Goli, M.B.; Bellaloui, N. Effect of foliar and soil application of potassium fertilizer on soybean seed protein, oil, fatty acids, and minerals. Am. J. Plant Sci. 2014, 5, 541–548. [Google Scholar] [CrossRef]
- Chen, J.; Liu, H. Nutritional indices for assessing fatty acids: A mini-review. Int. J. Mol. Sci. 2020, 21, 5695. [Google Scholar] [CrossRef]
- Zhang, P.; Sun, J.; Li, L.; Wang, X.; Li, X.; Qu, J. Effect of Soybean and Maize Rotation on Soil Microbial Community Structure. Agronomy 2019, 9, 42. [Google Scholar] [CrossRef]
- Holík, L.; Hlisnikovský, L.; Honzík, R.; Trögl, J.; Burdová, H.; Popelka, J. Soil Microbial Communities and Enzyme Activities after Long-Term Application of Inorganic and Organic Fertilizers at Different Depths of the Soil Profile. Sustainability 2019, 11, 3251. [Google Scholar] [CrossRef]
- Hatanaka, T.; Yamamoto, N.; Araki, R.; Kishigami, M.; Nakamoto, T.; Masumura, T.; Sugimoto, T. Fatty acid compositions of triacylglycerols in flax (Linum usitatissimum L.) seeds with varied seeding dates and nitrogen fertilization in a temperate region of Japan: Seeding date and fatty acids in flax seed. Soil Sci. Plant Nutr. 2021, 67, 269–276. [Google Scholar] [CrossRef]
- Moradi, S.; Sajedi, N.A.; Madani, H.; Gomarian, M.; Chavoshi, S. Integrated effects of nitrogen fertilizer, biochar, and salicylic acid on yield and fatty acid profile of six rapeseed cultivars. J. Soil Sci. Plant Nutr. 2023, 23, 380–397. [Google Scholar] [CrossRef]
- Yu, L.; Lu, X.; He, Y.; Brookes, P.C.; Liao, H.; Xu, J. Combined biochar and nitrogen fertilizer reduces soil acidity and promotes nutrient use efficiency by soybean crop. J. Soils Sediments 2017, 17, 599–610. [Google Scholar] [CrossRef]


| Parameter | Unit | Year | |||||
|---|---|---|---|---|---|---|---|
| 2016 | 2017 | 2018 | 2019 | 2020 | 2021 | ||
| Consumption of mineral fertilizers | |||||||
| Area of agricultural land (sown area of agricultural crops) | Million ha | 21.5 | 21.8 | 21.9 | 22.1 | 22.6 | 22.9 |
| Nitrogen (N) fertilizer use | Thousand tons | 80 | 104.2 | 81.2 | 54.5 | 74.4 | 81 |
| kg/ha | 3.7 | 4.8 | 3.7 | 2.5 | 3.3 | 3.5 | |
| Phosphate (P2O5) fertilizer use | Thousand tons | 31.5 | 50.3 | 38.3 | 29.4 | 88.1 | 47.7 |
| kg/ha | 1.5 | 2.3 | 1.7 | 1.3 | 3.9 | 2.1 | |
| Potash (K2O) fertilizer use | Thousand tons | 2.3 | 3.7 | 1.2 | 1.7 | 2.3 | 3.2 |
| kg/ha | 0.1 | 0.2 | 0.1 | 0.1 | 0.1 | 0.1 | |
| Total volume of applied mineral fertilizers | Thousand tons | 113.8 | 158.2 | 120.9 | 86.5 | 165.5 | 132.9 |
| Volume of mineral fertilizer use per unit area | kg/ha | 5.3 | 7.3 | 5.5 | 3.9 | 7.3 | 5.8 |
| Area treated with mineral fertilizers | Million ha | 1.65 | 2.51 | 2.34 | 2.66 | 3.05 | 3.8 |
| Share of area treated with mineral fertilizers in total area of agricultural land | % | 7.7 | 11.5 | 10.7 | 12.0 | 13.5 | 16.6 |
| Use of organic fertilizers | |||||||
| Area under organic agriculture | Thousand ha | 303.4 | 277.1 | 192.1 | 294.3 | 114.89 | 113.24 |
| Application of organic fertilizers | Thousand tons | 626.6 | 896 | 633.0 | 619.5 | 1214.1 | 995.2 |
| Use of organic fertilizers per unit area | kg/ha | 29.1 | 41.1 | 28.9 | 28.0 | 53.7 | 43.5 |
| Area treated with organic fertilizers | Million ha | 0.08 | 0.12 | 0.10 | 0.1 | 0.1 | 0.1 |
| Share of area treated with organic fertilizers in total area of agricultural land | % | 0.38 | 0.53 | 0.46 | 0.43 | 0.44 | 0.44 |
| Parameter | Unit | Year | ||||||
|---|---|---|---|---|---|---|---|---|
| 2016 | 2017 | 2018 | 2019 | 2020 | 2021 | |||
| Maize | Production | Thousand tonnes | 762.36 | 784.69 | 862.09 | 895.98 | 958.11 | 1129.51 |
| Area harvested | Thousand ha | 135.11 | 136.67 | 150.06 | 156.28 | 162.81 | 188.70 | |
| Yield | ton/ha | 5.64 | 5.74 | 5.74 | 5.73 | 5.88 | 5.98 | |
| Soybean | Production | Thousand tonnes | 231.17 | 252.32 | 255.44 | 282.18 | 260.64 | 237.85 |
| Area harvested | ha | 106.09 | 125.49 | 123.62 | 138.84 | 125.07 | 112.97 | |
| Yield | ton/ha | 2.17 | 2.01 | 2.06 | 2.03 | 2.08 | 2.10 | |
| Soil Characteristics | Value |
|---|---|
| Texture | Loam |
| pH | 8.0 |
| Humus (%) | 1.34 |
| N (mg/kg) | 2.8 |
| P (mg/kg) | 35.2 |
| K (mg/kg) | 240.2 |
| S (mg/kg) | 3.4 |
| Zn (mg/kg) | 38.89 |
| Fe (mg/kg) | 51.5 |
| Mn (mg/kg) | 18.4 |
| Ni (mg/kg) | 0.70 |
| Co (mg/kg) | 0.77 |
| # | Fertilizer | Description | Treatment |
|---|---|---|---|
| 1 | Control | No fertilizer | - |
| 2 | Manure | Rotted dairy manure | 30 ton/ha |
| 3 | Biohumus | Biologically active organic fertilizer produced via an original biotechnology, vermiculture, a product of manure processing by the Californian red worm | 2 ton/ha |
| 4 | HansePlant | Complex nutrition consisting of balanced concentrated nitrogen–phosphorus–potassium fertilizers:
| SeedSpor S 2.0 mL/kg seed: seed treatment before sowing; Smart Start P 150 kg/ha: application of starter fertilizer at sowing; HanseBiosulfur 5.0 L/ha: first foliar application in 2-to-4-leaf phase; Prairie Pride A 3.0 L/ha + Prairie Pride B 7.5 kg/ha + Absorb 1.0 L/ha: second foliar application in 6-leaf phase |
| 5 | Bioecohum | Dark brown liquid suspension obtained from vermicompost processed by compost worms in special nurseries with various organic, raw materials via enrichment with nutrients in a form accessible to plants. | 0.25 L/100 kg: seed treatment before sowing; 5.0 L/ha: first foliar application in 2-to-4-leaf phase; 5.0 L/ha: second foliar application in 6-leaf phase |
| 6 | Tumat | Organic humic fertilizer produced from brown coal (leonardite and lignite) and specially prepared water; contains humic acids, fulvic acids, amino acids, organic salts, organic acids, natural auxins, and cytokinins. | 30 mL/100 kg: seed treatment before sowing; 1.0 L/ha: first foliar application in 2-to-4-leaf phase; 1.0 L/ha: second foliar application in 6-leaf phase |
| 7 | Agroflorin | Enzyme complex preparation used for increasing soil productivity and fertility or for emergency treatment in case of signs of plant disease and stress factors. | 0.25 L/ha: first foliar application in 2-to-4-leaf phase; 0.25 L/ha: second foliar application in 6-leaf phase |
| # | Fertilizer | N (%) | P2O5 (%) | K2O (%) |
|---|---|---|---|---|
| 1 | Control | - | - | - |
| 2 | Manure | 0.52 ± 0.01 | 0.23 ± 0.01 | 0.64 ± 0.01 |
| 3 | Biohumus | 0.28 ± 0.01 | 0.75 ± 0.01 | 8.78 ± 0.02 |
| 4 | HansePlant | 3.81 ± 0.08 * | 33.23 ± 0.25 * | 0.14 ± 0.01 * |
| 1.12 ± 0.09 ** | 3.14 ± 0.08 ** | 3.43 ± 0.04 ** | ||
| 10.11 ± 0.12 *** | 40.21 ± 0.75 *** | 6.13 ± 0.09 *** | ||
| 5 | Bioecohum | 1.05 ± 0.8 | 1.10 ± 0.02 | 5.23 ± 0.09 |
| 6 | Tumat | 2.11 ± 0.08 | 7.64 ± 0.03 | 0.74 ± 0.08 |
| 7 | Agroflorin | 2.72 ± 0.07 | 16.14 ± 0.08 | 5.45 ± 0.05 |
| Quality Parameter | Crop | Fertilizer | ||||||
|---|---|---|---|---|---|---|---|---|
| Control | HansePlant | Manure | Agroflorin | Bioecohum | Biohumus | Tumat | ||
| Moisture (%) | Maize | 72.15 ± 1.35 | 71.88 ± 1.55 | 80.51 ± 1.10 | 81.48 ± 1.28 | 82.04 ± 1.25 | 80.45 ± 1.11 | 82.32 ± 1.41 |
| Soybean | 12.77 ± 0.02 | 12.83 ± 0.02 | 12.43 ± 0.03 | 12.71 ± 0.01 | 12.69 ± 0.03 | 12.97 ± 0.09 | 13.09 ± 0.08 | |
| Fat (%) | Maize | 3.42 ± 0.07 | 4.16 ± 0.05 | 4.06 ± 0.06 | 3.86 ± 0.09 | 3.90 ± 0.05 | 4.61 ± 0.00 | 4.07 ± 0.01 |
| Soybean | 19.09 ± 0.19 | 19.22 ± 0.23 | 22.85 ± 0.11 | 20.07 ± 0.85 | 19.49 ± 0.56 | 19.58 ± 0.63 | 19.87 ± 0.32 | |
| Protein (%) | Maize | 6.30 ± 0.01 | 6.86 ± 0.09 | 7.37 ± 0.01 | 6.42 ± 0.03 | 6.45 ± 0.03 | 7.66 ± 0.03 | 7.01 ± 0.04 |
| Soybean | 34.33 ± 0.25 | 35.23 ± 0.74 | 35.51 ± 0.54 | 35.05 ± 0.26 | 34.5 ± 0.28 | 34.65 ± 0.93 | 34.74 ± 0.36 | |
| Fiber (%) | Maize | 3.74 ± 0.03 | 3.98 ± 0.09 | 4.05 ± 0.04 | 3.68 ± 0.09 | 3.81 ± 0.06 | 4.28 ± 0.06 | 3.45 ± 0.09 |
| Soybean | 11.11 ± 0.15 | 11.18 ± 0.25 | 12.3 ± 0.58 | 11.9 ± 0.48 | 11.72 ± 0.99 | 11.24 ± 0.65 | 11.28 ± 0.63 | |
| Starch (%) | Maize | 73.2 ± 0.78 | 77.17 ± 1.72 | 73.77 ± 0.85 | 78.81 ± 2.24 | 78.87 ± 0.81 | 74.89 ± 0.82 | 75.74 ± 1.19 |
| Soybean | 1.29 ± 0.09 | 1.26 ± 0.02 | 1.24 ± 0.03 | 0.95 ± 0.03 | 1.03 ± 0.05 | 1.28 ± 0.04 | 1.19 ± 0.09 |
| Treatment | Yield | Agronomy Efficiency | ||||
|---|---|---|---|---|---|---|
| Maize (t/ha) | Soybean (t/ha) | Maize | Soybean | |||
| N (kg Yield/kg N) | P2O5 (kg Yield/kg P) | N (kg Yield/kg N) | P2O5 (kg Yield/kg P) | |||
| Control | 10.48 ± 0.21 e | 3.43 ± 0.37 e | - | - | - | - |
| HansePlant | 14.06 ± 0.17 b | 4.96 ± 0.26 a | 1.30 | 2.81 | 0.56 | 1.20 |
| Manure | 13.92 ± 0.09 c | 4.34 ± 0.44 c | 0.02 | 0.05 | 0.01 | 0.01 |
| Agroflorin | 14.2 ± 0.22 b | 4.31 ± 0.12 c | 37.20 | 4.65 | 8.80 | 1.10 |
| Bioecohum | 15.36 ± 0.25 a | 4.71 ± 0.17 b | 32.53 | 44.36 | 8.53 | 11.64 |
| Biohumus | 12.72 ± 0.11 d | 4.21 ± 0.22 d | 0.40 | 1.49 | 0.14 | 0.52 |
| Tumat | 12.38 ± 0.38 d | 4.62 ± 0.19 b | 47.50 | 12.67 | 29.75 | 7.93 |
| # | Fatty Acid Component | RT (Mean) | R2 | Calibration Curve Equation | Range (ng/mL) | LOD (ng/mL) | LOQ (ng/mL) |
|---|---|---|---|---|---|---|---|
| 1 | C4:0 | 5.63 | 0.9929 | y = 3104.53 + 1283.98 ∗ x | 10.1–404 | 0.14 | 0.42 |
| 2 | C6:0 | 6.40 | 0.9761 | y = 4055.65 + 2253.24 ∗ x | 10.1–404 | 0.29 | 0.90 |
| 3 | C8:0 | 7.84 | 0.9968 | y = −4498.98 + 2166.69 ∗ x | 10.1–404 | 0.10 | 0.38 |
| 4 | C10:0 | 10.16 | 0.9943 | y = −7250.46 + 2412.19 ∗ x | 10.2–408 | 0.12 | 0.37 |
| 5 | C11:0 | 11.60 | 0.9972 | y = −8557.36 + 2688.21 ∗ x | 5.1–204 | 0.18 | 0.36 |
| 6 | C12:0 | 13.18 | 0.9715 | y = 9022.17 + 2778.84 ∗ x | 10.1–404 | 0.28 | 0.85 |
| 7 | C13:0 | 14.83 | 0.9822 | y = −20,977.31 + 2877.44 ∗ x | 5–203 | 0.22 | 0.67 |
| 8 | C14:0 | 16.52 | 0.9844 | y = −2093.06 + 2948.31 ∗ x | 10.1–404 | 0.20 | 0.62 |
| 9 | C14:1 | 17.45 | 0.9795 | y = −25,140.38 + 2986.51 ∗ x | 5.1–204 | 0.23 | 0.72 |
| 10 | C15:0 | 18.19 | 0.9855 | y = −22,493.77 + 3076.91 ∗ x | 5–203 | 0.20 | 0.61 |
| 11 | C15:1 | 19.13 | 0.9826 | y = −24,875.84 + 3126.89 ∗ x | 5–203 | 0.22 | 0.66 |
| 12 | C16:0 | 19.85 | 0.9604 | y = 10,724.23 + 1959.15 ∗ x | 15.3–612 | 0.37 | 1.13 |
| 13 | C16:1 | 20.56 | 0.9754 | y = −21,441.35 + 3363.23 ∗ x | 5.1–204 | 0.26 | 0.79 |
| 14 | C17:0 | 21.46 | 0.9834 | y = −25,294.81 + 3098.58 ∗ x | 5.2–210 | 0.21 | 0.65 |
| 15 | C17:1 | 22.17 | 0.9771 | y = −30,493.98 + 3341.48 ∗ x | 5.1–204 | 0.25 | 0.76 |
| 16 | C18:0 | 30.46 | 0.9805 | y = −48,181.39 + 3154.23 ∗ x | 10.2–408 | 0.23 | 0.70 |
| 17 | C18:1n9t | 23.37 | 0.9693 | y = 26,390.54 + 3563.75 ∗ x | 5–202 | 0.29 | 0.89 |
| 18 | C18:1n9c | 23.61 | 0.9804 | y = −58,757.32 + 3551.80 ∗ x | 10.1–404 | 0.23 | 0.70 |
| 19 | C18:2n6t | 24.03 | 0.9888 | y = −9356.52 + 3581.82 ∗ x | 5–202 | 0.17 | 0.53 |
| 20 | C18:2n6c | 24.60 | 0.9718 | y = −15,503.47 + 3639.81 ∗ x | 5–202 | 0.28 | 0.85 |
| 21 | C20:0 | 25.26 | 0.9809 | y = −28,503.12 + 1668.46 ∗ x | 10.2–408 | 0.21 | 0.69 |
| 22 | C18:3n6c | 25.81 | 0.9745 | y = 14,267.24 + 3307.24 ∗ x | 5–203 | 0.27 | 0.80 |
| 23 | C20:1n9c | 26.01 | 0.9618 | y = 8327.76 + 3712.91 ∗ x | 5–202 | 0.38 | 1.15 |
| 24 | C18:3n3c | 26.57 | 0.9769 | y = −58,364.16 + 6629.89 ∗ x | 5.1–204 | 0.25 | 0.77 |
| 25 | C21:0 | 27.68 | 0.9583 | y = −36,143.35 + 3030.50 ∗ x | 5–203 | 0.34 | 1.03 |
| 26 | C20:2 | 27.79 | 0.9774 | y = −32,230.17 + 3667.30 ∗ x | 5.1–204 | 0.25 | 0.76 |
| 27 | C22:0 | 28.58 | 0.9797 | y = −28,402.9 + 1657.1 ∗ x | 10.1–405 | 0.23 | 0.71 |
| 28 | C20:3 | 29.15 | 0.9630 | y = −7570.47 + 3334.73 ∗ x | 5.1–204 | 0.32 | 0.97 |
| 29 | C22:1 | 29.25 | 0.9649 | y = −9612.72 + 3435.02 ∗ x | 5.1–204 | 0.31 | 0.95 |
| 30 | C20:3 | 29.49 | 0.9846 | y = −41,006.87 + 5944.15 ∗ x | 5.1–204 | 0.21 | 0.62 |
| 31 | C23:0 | 30.28 | 0.9639 | y = 28,419.21 + 3093.43 ∗ x | 5–203 | 0.32 | 0.96 |
| 32 | C20:4 | 30.82 | 0.9636 | y = 28,013.89 + 3119.79 ∗ x | 5–202 | 0.32 | 0.97 |
| 33 | C22:2 | 31.53 | 0.9657 | y = 29,603.17 + 2804.69 ∗ x | 5.1–204 | 0.31 | 0.94 |
| 34 | C24:0 | 31.73 | 0.9924 | y = −21,241.08 + 1442.07 ∗ x | 5.1–204 | 0.14 | 0.43 |
| 35 | C20:5 | 33.91 | 0.9920 | y = 4049.98 + 4276.11 ∗ x | 5.1–204 | 0.15 | 0.45 |
| 36 | C24:1 | 34.90 | 0.9638 | y = 22,871.14 + 2312.33 ∗ x | 5.1–204 | 0.32 | 0.96 |
| 37 | C22:6 | 36.42 | 0.9845 | y = −1542.03 + 2480.62 ∗ x | 5–203 | 0.21 | 0.62 |
| Fatty Acid | Fatty Acid Content (%) | |||||||
|---|---|---|---|---|---|---|---|---|
| Control | HansePlant | Manure | Agroflorin | Bioecohum | Biohumus | Tumat | ||
| C4:0 | Butyric | 0.04 ± 0.00 g | 0.10 ± 0.05 g | 0.02 ± 0.01 g | 0.08 ± 0.01 g | 0.05 ± 0.02 g | 0.07 ± 0.01 g | 0.06 ± 0.01 g |
| C6:0 | Caproic | 0.06 ± 0.01 g | 0.15 ± 0.08 g | 0.05 ± 0.01 g | 0.13 ± 0.00 g | 0.11 ± 0.06 g | 0.10 ± 0.00 g | 0.15 ± 0.01 g |
| C8:0 | Caprylic | ND | 0.04 ± 0.04 g | ND | 0.20 ± 0.02 g | 0.01 ± 0.01 g | ND | 0.04 ± 0.01 g |
| C10:0 | Capric | ND | 0.09 ± 0.09 g | ND | 0.48 ± 0.02 g | 0.01 ± 0.01 g | 0.01 ± 0.00 g | 0.02 ± 0.01 g |
| C12:0 | Lauric | 0.01 ± 0.00 g | 0.10 ± 0.01 g | ND | 0.63 ± 0.03 g | 0.02 ± 0.02 g | 0.03 ± 0.01 g | 0.01 ± 0.00 g |
| C14:0 | Myristic | 0.06 ± 0.02 g | 0.15 ± 0.01 g | 0.05 ± 0.00 g | 0.75 ± 0.03 g | 0.06 ± 0.03 g | 0.08 ± 0.01 g | 0.06 ± 0.01 g |
| C15:0 | Pentadecanoic | ND | 0.01 ± 0.01 g | ND | 0.01 ± 0.00 g | ND | ND | ND |
| C16:0 | Palmitic | 15.12 ± 1.06 c | 14.62 ± 0.83 c | 15.93 ± 0.43 c | 14.89 ± 0.10 c | 14.77 ± 1.10 c | 14.28 ± 0.32 c | 15.85 ± 0.44 c |
| C16:1 | Palmitoleic | 0.08 ± 0.03 g | 0.17 ± 0.12 g | 0.10 ± 0.00 g | 0.63 ± 0.00 g | 0.08 ± 0.02 g | 0.09 ± 0.01 g | 0.09 ± 0.01 g |
| C17:0 | Heptadecanoic | 0.05 ± 0.02 g | 0.03 ± 0.01 g | 0.07 ± 0.00 g | 0.05 ± 0.00 g | 0.04 ± 0.02 g | 0.05 ± 0.01 g | 0.06 ± 0.01 g |
| C17:1 | cis-Heptadecanoic | 0.01 ± 0.00 g | 0.01 ± 0.01 g | 0.03 ± 0.00 g | 0.02 ± 0.01 g | 0.01 ± 0.01 g | ND | 0.01 ± 0.00 g |
| C18:0 | Stearic | 2.08 ± 0.31 d | 2.09 ± 0.12 d | 2.29 ± 0.12 d | 2.41 ± 0.03 d | 2.33 ± 0.26 d | 2.30 ± 0.05 d | 2.43 ± 0.11 d |
| C18:1n9t | Oleic trans | 0.05 ± 0.00 g | ND | 0.01 ± 0.00 g | 0.02 ± 0.01 g | 0.08 ± 0.02 g | 0.06 ± 0.01 g | 0.03 ± 0.0 g |
| C18:1n9c | Oleic | 30.82 ± 0.63 b | 31.37 ± 0.48 b | 33.89 ± 0.39 b | 30.31 ± 0.20 b | 30.80 ± 0.38 b | 31.14 ± 0.20 b | 32.86 ± 0.14 b |
| C18:2n6t | Linoleic trans | 0.01 ± 0.01 g | 0.01 ± 0.01 g | 0.03 ± 0.01 g | ND | 0.01 ± 0.01 g | 0.02 ± 0.01 g | 0.03 ± 0.00 g |
| C18:2n6c | Linoleic | 50.13 ± 2.05 a | 49.50 ± 1.62 a | 46.21 ± 1.25 a | 47.99 ± 0.80 a | 50.35 ± 1.61 a | 50.95 ± 0.63 a | 47.11 ± 0.82 a |
| C20:0 | Arachidic | 0.03 ± 0.02 g | 0.01 ± 0.01 g | ND | ND | 0.02 ± 0.01 g | ND | 0.02 ± 0.00 g |
| C18:3n6c | γ-Linolenic | 0.76 ± 0.43 e | 0.21 ± 0.02 e | 0.38 ± 0.01 e | 0.22 ± 0.02 e | 0.29 ± 0.04 e | 0.28 ± 0.03 e | 0.38 ± 0.02 e |
| C18:3n3c | α-Linolenic | 0.30 ± 0.21 ef | 2.21 ± 0.02 ef | 0.38 ± 0.01 ef | 1.04 ± 0.01 ef | 0.73 ± 0.41 ef | 0.38 ± 0.03 ef | 0.38 ± 0.02 ef |
| C20:1n9c | Gondoic | 0.19 ± 0.05f g | 0.13 ± 0.03 fg | 0.28 ± 0.01 fg | 0.14 ± 0.02 fg | 0.18 ± 0.03 fg | 0.19 ± 0.01 fg | 0.25 ± 0.0f g |
| C20:3n3c | Eicosatrienoic | 0.03 ± 0.03 g | 0.01 ± 0.01 g | 0.09 ± 0.01 g | 0.01 ± 0.00 g | 0.05 ± 0.02 g | 0.04 ± 0.00 g | 0.09 ± 0.00 g |
| C22:1n9c | Erucic | 0.03 ± 0.03 g | 0.01 ± 0.00 g | 0.09 ± 0.01 g | 0.02 ± 0.01 g | 0.05 ± 0.02 g | 0.04 ± 0.00 g | 0.09 ± 0.00 g |
| C20:3 | Eicosatrienoic | 0.03 ± 0.03 g | ND | ND | 0.02 ± 0.01 g | 0.02 ± 0.02 g | ND | ND |
| C24:1n9c | Nervonic | 0.03 ± 0.01 g | ND | 0.09 ± 0.00 g | 0.01 ± 0.00 g | 0.02 ± 0.00 g | 0.04 ± 0.00 g | 0.05 ± 0.00 g |
| SFA | 17.45 ± 1.45 | 17.37 ± 1.42 | 18.41 ± 0.57 | 19.61 ± 0.21 | 17.39 ± 1.52 | 16.91 ± 0.38 | 18.66 ± 0.62 | |
| USFA | 82.36 ± 3.47 | 83.60 ± 2.30 | 81.45 ± 1.71 | 80.35 ± 0.32 | 82.50 ± 2.53 | 83.10 ± 0.89 | 81.20 ± 1.03 | |
| MUFA | 31.12 ± 0.73 | 31.67 ± 0.63 | 34.39 ± 0.42 | 31.09 ± 0.22 | 31.07 ± 0.44 | 31.46 ± 0.22 | 33.25 ± 0.16 | |
| PUFA | 51.24 ± 2.74 | 51.93 ± 1.67 | 47.06 ± 1.29 | 49.26 ± 0.10 | 51.43 ± 2.09 | 51.64 ± 0.68 | 47.95 ± 0.87 | |
| Omega-6 | 50.13 ± 2.05 | 49.50 ± 1.62 | 46.21 ± 1.25 | 47.99 ± 0.08 | 50.35 ± 1.61 | 50.95 ± 0.63 | 47.11 ± 0.82 | |
| Omega-3 | 0.30 ± 0.43 | 2.21 ± 0.02 | 0.38 ± 0.02 | 1.04 ± 0.02 | 0.73 ± 0.04 | 0.38 ± 0.03 | 0.38 ± 0.02 | |
| PUFA/SFA | 2.94 | 2.99 | 2.56 | 2.51 | 2.96 | 3.05 | 2.57 | |
| Omega-6/omega-3 | 167.10 | 22.40 | 121.61 | 46.36 | 69.45 | 135.85 | 123.96 | |
| Fatty Acid | Fatty Acid Content (%) | |||||||
|---|---|---|---|---|---|---|---|---|
| Control | HansePlant | Manure | Agroflorin | Bioecohum | Biohumus | Tumat | ||
| C4:0 | Butyric | 0.06 ± 0.04 f | 0.05 ± 0.01 f | 0.03 ± 0.00 f | 0.02 ± 0.00 f | 0.03 ± 0.01 f | 0.03 ± 0.01 f | 0.03 ± 0.01 f |
| C6:0 | Caproic | 0.08 ± 0.03f | 0.07 ± 0.01 f | 0.04 ± 0.01 f | 0.03 ± 0.00 f | 0.04 ± 0.00 f | 0.04 ± 0.01 f | 0.04 ± 0.01 f |
| C8:0 | Caprylic | ND | ND | ND | ND | ND | 0.01 ± 0.01 g | ND |
| C10:0 | Capric | 0.02 ± 0.01 g | ND | ND | ND | 0.01 ± 0.01 g | 0.01 ± 0.01 g | ND |
| C12:0 | Lauric | 0.01 ± 0.01 g | ND | ND | ND | 0.01 ± 0.01 g | 0.01 ± 0.00 g | ND |
| C14:0 | Myristic | 0.13 ± 0.01 if | 0.11 ± 0.01 if | 0.11 ± 0.01 if | 0.10 ± 0.00 if | 0.15 ± 0.02 if | 0.13 ± 0.02 if | 0.13 ± 0.02 if |
| C15:0 | Pentadecanoic | 0.01 ± 0.00 fg | 0.01 ± 0.01 fg | 0.01 ± 0.01 fg | 0.01 ± 0.00 fg | 0.02 ± 0.01 fg | 0.01 ± 0.00 fg | 0.01 ± 0.00 fg |
| C16:0 | Palmitic | 14.77 ± 0.80 c | 13.64 ± 0.10 c | 13.40 ± 0.19 c | 13.34 ± 0.07 c | 15.68 ± 1.69 c | 14.01 ± 0.19 c | 13.51 ± 0.30 c |
| C16:1 | Palmitoleic | 0.10 ± 0.01 if | 0.08 ± 0.01 if | 0.08 ± 0.01 if | 0.09 ± 0.01 if | 0.12 ± 0.02 if | 0.12 ± 0.02 if | 0.10 ± 0.02 if |
| C17:0 | Heptadecanoic | 0.13 ± 0.01 hi | 0.11 ± 0.00 hi | 0.13 ± 0.01 hi | 0.14 ± 0.00 hi | 0.17 ± 0.04 hi | 0.15 ± 0.02 hi | 0.14 ± 0.02 hi |
| C17:1 | cis-Heptadecanoic | 0.05 ± 0.01 if | 0.04 ± 0.01 if | 0.05 ± 0.01 if | 0.05 ± 0.00 if | 0.06 ± 0.01 if | 0.06 ± 0.01 if | 0.05 ± 0.01 if |
| C18:0 | Stearic | 7.55 ± 0.64 e | 7.51 ± 0.56 e | 7.42 ± 0.39 e | 7.68 ± 0.02 e | 9.73 ± 1.63 e | 8.16 ± 0.63 e | 8.40 ± 0.71 e |
| C18:1n9t | Oleic trans | 0.02 ± 0.00 fg | ND | 0.01 ± 0.00 fg | 0.02 ± 0.00 fg | 0.02 ± 0.00 fg | 0.02 ± 0.01 fg | 0.01 ± 0.00fg |
| C18:1n9c | Oleic | 28.03 ± 1.19 b | 25.93 ± 0.28 b | 24.96 ± 0.03 b | 25.98 ± 0.06 b | 28.61 ± 2.31 b | 25.42 ± 0.88 b | 26.16 ± 1.01 b |
| C18:2n6t | Linoleic trans | 0.04 ± 0.02 if | 0.04 ± 0.01 if | 0.05 ± 0.00 if | 0.05 ± 0.00 if | 0.07 ± 0.01 if | 0.06 ± 0.01 if | 0.06 ± 0.02 if |
| C18:2n6c | Linoleic | 38.42 ± 4.13 a | 39.86 ± 1.80 a | 40.61 ± 1.38 a | 38.60 ± 0.06 a | 36.59 ± 1.48 a | 37.60 ± 1.32 a | 37.59 ± 1.43 a |
| C20:0 | Arachidic | 0.03 ± 0.01 f | 0.01 ± 0.00 f | 0.02 ± 0.00 f | 0.02 ± 0.00 f | 0.05 ± 0.02 f | 0.03 ± 0.01 f | 0.02 ± 0.01 f |
| C18:3n3c | α-Linolenic | 8.57 ± 0.80 d | 10.63 ± 0.47 d | 9.83 ± 0.39d | 10.37 ± 0.02 d | 11.12 ± 1.47 d | 10.74 ± 0.42 d | 9.87 ± 0.56 d |
| C18:3n6c | γ-Linolenic | 0.70 ± 0.11 f | 0.77 ± 0.08 f | 0.90 ± 0.10 f | 0.84 ± 0.02 f | 1.27 ± 0.21 f | 1.02 ± 0.23 f | 1.04 ± 0.21 f |
| C20:1n9c | Gondoic | 0.25 ± 0.05 hi | 0.21 ± 0.03 hi | 0.27 ± 0.03 hi | 0.33 ± 0.01 hi | 0.39 ± 0.10 hi | 0.31 ± 0.06 hi | 0.33 ± 0.06 hi |
| C21:0 | Heneicosanoic | 0.01 ± 0.00 f | 0.02 ± 0.00 f | 0.04 ± 0.01 f | 0.04 ± 0.00 f | 0.05 ± 0.02 f | 0.04 ± 0.01 f | 0.04 ± 0.01 f |
| C20:2 | Eicosadienoic | 0.02 ± 0.01 f | 0.03 ± 0.01 f | 0.04 ± 0.01 f | 0.04 ± 0.00 f | 0.05 ± 0.02 f | 0.04 ± 0.01 f | 0.04 ± 0.01 f |
| C20:3n3c | Eicosatrienoic | 0.02 ± 0.01 gh | ND | 0.62 ± 0.06 gh | 0.69 ± 0.02 gh | 0.81 ± 0.27 gh | 0.63 ± 0.15 gh | 0.77 ± 0.16 gh |
| C22:1n9c | Erucic | 0.45 ± 0.13 fg | 0.40 ± 0.10 fg | 0.61 ± 0.06 fg | 0.63 ± 0.02 fg | 0.89 ± 0.26 fg | 0.65 ± 0.15 fg | 0.81 ± 0.16 fg |
| C20:3 | Eicosatrienoic | 0.46 ± 0.14 fg | 0.41 ± 0.10 fg | 0.63 ± 0.06 fg | 0.69 ± 0.02 fg | 0.81 ± 0.26 fg | 0.63 ± 0.15 fg | 0.78 ± 0.15 fg |
| C22:2 | Docosadienoic | ND | 0.01 ± 0.00 fg | 0.02 ± 0.01 fg | 0.03 ± 0.01 fg | 0.04 ± 0.02 fg | 0.02 ± 0.01 fg | 0.04 ± 0.01 fg |
| C20:5n3c | Eicopentaenoic | 0.08 ± 0.01 if | 0.07 ± 0.03 if | 0.15 ± 0.03 if | 0.16 ± 0.02 if | 0.12 ± 0.01 if | 0.07 ± 0.01 if | ND |
| C24:1n9c | Nervonic | 0.07 ± 0.03 if | 0.05 ± 0.01 if | 0.05 ± 0.01 if | 0.06 ± 0.00 if | 0.24 ± 0.07 if | 0.07 ± 0.01 if | 0.11 ± 0.11 if |
| SFA | 22.77 ± 1.59 | 21.50 ± 0.70 | 21.17 ± 0.60 | 21.37 ± 0.08 | 25.91 ± 3.42 | 22.61 ± 0.90 | 22.30 ± 1.07 | |
| USFA | 76.72 ± 6.52 | 78.04 ± 2.80 | 78.14 ± 2.09 | 77.85 ± 0.22 | 80.15 ± 6.31 | 76.66 ± 3.31 | 76.81 ± 3.62 | |
| MUFA | 28.49 ± 1.29 | 26.31 ± 0.33 | 25.40 ± 0.08 | 26.50 ± 0.07 | 29.41 ± 2.50 | 25.97 ± 0.98 | 26.74 ± 1.10 | |
| PUFA | 48.23 ± 5.23 | 51.73 ± 2.47 | 52.74 ± 2.01 | 51.36 ± 0.14 | 50.74 ± 3.81 | 50.69 ± 2.33 | 50.08 ± 2.53 | |
| Omega-6 | 38.42 ± 4.13 | 39.86 ± 1.80 | 40.61 ± 1.38 | 38.60 ± 0.06 | 36.59 ± 1.48 | 37.60 ± 1.32 | 37.59 ± 1.43 | |
| Omega-3 | 8.65 ± 0.8 | 10.70 ± 0.50 | 9.97 ± 0.41 | 10.52 ± 0.03 | 11.24 ± 1.59 | 10.8. ± 0.48 | 9.87 ± 0.56 | |
| PUFA/SFA | 2.12 | 2.41 | 2.49 | 2.40 | 1.96 | 2.24 | 2.25 | |
| Omega-6/omega-3 | 4.44 | 3.73 | 4.07 | 3.67 | 3.26 | 3.48 | 3.81 | |
| Control | Biohumus | Tumat | Manure | Bioecohum | Agroflorin | HansePlant | |
|---|---|---|---|---|---|---|---|
| Control | 0 | 33 | 45 | 46.9 | 98.2 | 121 | 145 |
| Biohumus | *** | 0 | 14 | 16.1 | 66.6 | 90 | 114 |
| Tumat | *** | *** | 0 | 3.7 | 54.9 | 78 | 102 |
| Manure | *** | *** | *** | 0 | 52.9 | 76 | 100 |
| Bioecohum | ** | *** | *** | *** | 0 | 23 | 48 |
| Agroflorin | ** | ** | ** | ** | *** | 0 | 26 |
| HansePlant | * | ** | ** | ** | *** | *** | 0 |
| Control | Bioecohum | HansePlant | Manure | Agroflorin | Biohumus | Tumat | |
|---|---|---|---|---|---|---|---|
| Control | 0 | 4.93 | 5.00 | 5.27 | 5.94 | 7.33 | 8.00 |
| Bioecohum | ** | 0 | 3.20 | 3.18 | 4.71 | 6.35 | 4.74 |
| HansePlant | ** | *** | 0 | 2.10 | 4.37 | 4.31 | 4.53 |
| Manure | ** | *** | *** | 0 | 3.20 | 3.31 | 3.73 |
| Agroflorin | ** | ** | *** | *** | 0 | 3.22 | 3.0 |
| Biohumus | ** | ** | ** | ** | *** | 0 | 2.97 |
| Tumat | * | ** | ** | ** | ** | *** | 0 |
| Moisture | Fat | Protein | Fiber | Starch | SFA | MUFA | PUFA | Omega-6 | Omega-3 | PUFA/SFA | Omega-6/Omega-3 | |
|---|---|---|---|---|---|---|---|---|---|---|---|---|
| Moisture | 1.00 | 0.34 | 0.10 | 0.12 | −0.12 | 0.44 | 0.29 | −0.52 | −0.35 | −0.47 | −0.50 | 0.02 |
| Fat | * | 1.00 | 0.74 | 0.53 | −0.59 | −0.26 | 0.21 | 0.05 | 0.09 | 0.12 | 0.19 | −0.14 |
| Protein | * | ** | 1.00 | 0.62 | −0.94 | −0.45 | 0.55 | −0.13 | −0.04 | −0.26 | 0.21 | 0.43 |
| Fiber | * | ** | ** | 1.00 | −0.59 | −0.47 | 0.04 | 0.17 | 0.31 | −0.29 | 0.38 | 0.30 |
| Starch | * | ** | *** | ** | 1.00 | 0.22 | −0.68 | 0.37 | 0.26 | 0.41 | 0.04 | −0.56 |
| SFA | * | * | ** | ** | * | 1.00 | 0.29 | −0.74 | −0.77 | −0.05 | −0.95 | −0.23 |
| MUFA | * | * | ** | * | ** | * | 1.00 | −0.84 | −0.82 | −0.28 | −0.58 | 0.26 |
| PUFA | ** | * | * | * | * | ** | *** | 1.00 | 0.96 | 0.40 | 0.92 | −0.20 |
| Omega-6 | * | * | * | * | ** | *** | *** | *** | 1.00 | 0.13 | 0.92 | 0.02 |
| Omega-3 | ** | * | * | * | * | * | * | ** | * | 1.00 | 0.21 | −0.87 |
| PUFA/SFA | ** | * | * | * | * | *** | ** | *** | *** | * | 1.00 | 0.05 |
| Omega-6/ omega-3 | * | * | * | * | ** | * | * | * | * | *** | * | 1.00 |
| Moisture | Fat | Protein | Fiber | Starch | SFA | MUFA | PUFA | Omega-6 | Omega-3 | PUFA/SFA | Omega-6/Omega-3 | |
|---|---|---|---|---|---|---|---|---|---|---|---|---|
| Moisture | 1.00 | −0.72 | −0.77 | −0.80 | 0.20 | 0.07 | 0.03 | −0.49 | −0.54 | 0.01 | −0.26 | −0.21 |
| Fat | ** | 1.00 | 0.53 | 0.77 | 0.13 | −0.41 | −0.45 | 0.48 | 0.63 | −0.29 | 0.52 | 0.44 |
| Protein | *** | ** | 1.00 | 0.64 | −0.21 | −0.42 | −0.28 | 0.66 | 0.78 | 0.05 | 0.61 | 0.21 |
| Fibre | *** | *** | ** | 1.00 | −0.48 | −0.12 | −0.25 | 0.69 | 0.36 | 0.23 | 0.37 | −0.09 |
| Starch | * | * | * | ** | 1.00 | −0.29 | −0.29 | −0.20 | 0.35 | −0.46 | 0.14 | 0.51 |
| SFA | * | ** | ** | * | * | 1.00 | 0.85 | −0.36 | −0.79 | 0.33 | −0.93 | −0.49 |
| MUFA | * | ** | * | * | * | *** | 1.00 | −0.63 | −0.66 | −0.06 | −0.91 | −0.10 |
| PUFA | ** | ** | ** | ** | * | * | ** | 1.00 | 0.55 | 0.59 | 0.67 | −0.36 |
| Omega-6 | ** | ** | *** | * | * | *** | ** | ** | 1.00 | −0.26 | 0.85 | 0.53 |
| Omega-3 | * | * | * | * | ** | * | * | ** | * | 1.00 | −0.04 | −0.95 |
| PUFA/SFA | * | ** | ** | * | * | *** | *** | ** | *** | * | 1.00 | 0.26 |
| omega-6/ omega-3 | * | * | * | * | ** | * | * | * | ** | *** | * | 1.00 |
Disclaimer/Publisher’s Note: The statements, opinions and data contained in all publications are solely those of the individual author(s) and contributor(s) and not of MDPI and/or the editor(s). MDPI and/or the editor(s) disclaim responsibility for any injury to people or property resulting from any ideas, methods, instructions or products referred to in the content. |
© 2023 by the authors. Licensee MDPI, Basel, Switzerland. This article is an open access article distributed under the terms and conditions of the Creative Commons Attribution (CC BY) license (https://creativecommons.org/licenses/by/4.0/).
Share and Cite
Toishimanov, M.; Suleimenova, Z.; Myrzabayeva, N.; Dossimova, Z.; Shokan, A.; Kenenbayev, S.; Yessenbayeva, G.; Serikbayeva, A. Effects of Organic Fertilizers on the Quality, Yield, and Fatty Acids of Maize and Soybean in Southeast Kazakhstan. Sustainability 2024, 16, 162. https://doi.org/10.3390/su16010162
Toishimanov M, Suleimenova Z, Myrzabayeva N, Dossimova Z, Shokan A, Kenenbayev S, Yessenbayeva G, Serikbayeva A. Effects of Organic Fertilizers on the Quality, Yield, and Fatty Acids of Maize and Soybean in Southeast Kazakhstan. Sustainability. 2024; 16(1):162. https://doi.org/10.3390/su16010162
Chicago/Turabian StyleToishimanov, Maxat, Zhulduz Suleimenova, Nurgul Myrzabayeva, Zhanna Dossimova, Aksholpan Shokan, Serik Kenenbayev, Gulvira Yessenbayeva, and Assiya Serikbayeva. 2024. "Effects of Organic Fertilizers on the Quality, Yield, and Fatty Acids of Maize and Soybean in Southeast Kazakhstan" Sustainability 16, no. 1: 162. https://doi.org/10.3390/su16010162