Abstract
This study explores the interaction between the emission trading system and the Sustainable Development Goals. Using an empirical analysis of a sample of European installations covered by the Emission Trading System from 2016 to 2021, we assessed how the system internalized the costs of carbon emissions across economic sectors and analyzed its impact on achieving the Sustainable Development Goals. The results revealed that while the increased efficiency of the emissions trading system had positive effects on environmental taxation and the reduction in economic losses due to climate change, challenges persist in natural resource use and energy dependence. This study offers new insight into the carbon ability pricing policies to properly allocate environmental costs. This study highlights the importance of integrating complementary policy instruments to strengthen effectiveness, given the link between the selected sustainable development and circular economy variables. The results provide stakeholders and policymakers with essential information for optimizing environmental policies and developing integrated approaches. If well implemented, such policies can effectively contribute to the fight against climate change and promote sustainable development by reducing social and environmental costs.
1. Introduction
In today’s technological, economic, and environmental transformations, the link between climate policies, sustainable development, and the circular economy is of paramount importance. Within the internationally shared and institutionally defined 2030 Agenda goals, the need for effective environmental policies [1] and robust governance [2] to internalize the environmental costs of economic activities has emerged. Carbon markets and mechanisms are deemed to play a remarkable role; their growth has been remarkable over the last decade. Carbon taxes and emissions trading systems (ETSs) reach has expanded significantly, with the share of global emissions covered increasing from 7% in 2013 to 23% in 2022. This growth trajectory is expected to continue as jurisdictions introduce new carbon pricing instruments and expand their scope.
Carbon pricing is a market approach that provides an economic signal to emitters by allowing them to decide through rational strategic decision logic based on opportunity costs whether to invest in projects to reduce emissions or delay the investment by continuing to emit and paying for excess emissions. If well defined, carbon pricing can be a valuable policy tool for flexibly achieving environmental goals and minimizing costs to society by being an incentive for investment in clean technologies, which is why it plays an essential role in formulating effective climate mitigation strategies [3,4].
This article analyzes the effects of environmental policy and its potential role in achieving the Sustainable Development Goals (SDGs). The European ETS, a well-known example fully integrated into the ecosystem of European environmental policy, was chosen as a reference [5], and a set of SDG-related variables was selected to test the link.
How effectively the ETS integrates the costs of carbon emissions is an important critical dimension [6]. In this regard, a recent study showed a gradual improvement [7] due to the various corrective actions implemented over the years to reduce the risk of carbon leakage. This phenomenon implies that emission reductions within the EU could be offset by a concomitant increase in emissions, although elsewhere, due to the shift of production to places with more permissive regulations [8,9]. To prevent such negative externalities, free allocations are provided for industries exposed to the risk of relocation [10,11].
The objectives of this study were twofold: to analyze the determinants of the correct allocation of environmental responsibility and to explore the relationship between the effectiveness of the ETS system and specific SDGs, which is a prominent topic [12]. The analysis was based on data from the European database on SDGs and the circular economy and data from the EU registry for verified emissions. The empirical analyses were performed on panel data containing information from 2016 to 2021 for industrial sectors based on the European statistical classification of economic activities NACE Rev. 2 of the European Union.
This study examined the connection between the effective allocation of environmental responsibility within the ETS and the achievement of specific SDGs. Two research questions were posed: how do determinants of emissions influence the appropriate distribution of environmental responsibility, and what is the correlation between the system’s effectiveness and the SDGs it impacts?
The key findings included the need for balanced policies that consider the effects of international trade on emissions and the need to invest in clean technologies and encourage efficient production practices. In addition, the analysis showed how the ETS efficiency affects various aspects of sustainable development, including raw material consumption and the use of renewable energy sources, highlighting the complexity of the interactions between environmental policies and the SDGs.
Such findings contribute to the literature by providing new insights that are valuable to the scientific community, policymakers, and practitioners because they provide a basis for policy formulation to facilitate the transition into a green and sustainable economy by addressing the challenge of effectively balancing environmental efficiency with sustainable economic development.
This paper is organized as follows. Section 2 contains background information to properly frame the objective of this study. Section 3 refers to the research design and methods, including the definition of the variables and research questions (RQs). Section 4 summarizes the main findings discussed in Section 5, in which policy implications are also provided. The conclusions follow in Section 6.
2. Background
The European Union generates approximately 8% of global carbon emissions [13], and the European ETS is currently the world’s largest carbon market [14]. A cap is imposed on the aggregate volume of emissions that can be produced annually, and it is consistently reduced over time [15] to reduce emissions in the medium and long term. Companies that fill installations within the ETS scope can buy or sell allowances [16] that are also allocated for free based on the allocation rules.
Companies that do not receive emission allowances for free or where the allowances received are insufficient to cover their emissions must buy allowances at auctions or from other companies. Conversely, those with emission allowances above their emissions can sell them. Companies facing difficulties in reducing their emissions can reduce them by investing in efficient technologies, purchasing the necessary allowances from auctions or the market, or combining the two options [17], ensuring that emissions are reduced cost-effectively. These transactions are based on strategic decisions and aspire to converge environmental and economic objectives [18]. Firms are supposed to innovate by embracing cleaner technologies, and these innovations will culminate in an overall decrease in carbon emissions [19]. For the mechanism to be efficient, carbon pricing plays a significant role [20] because it aims to internalize the external costs of emissions and link them to their sources through a price signal [21].
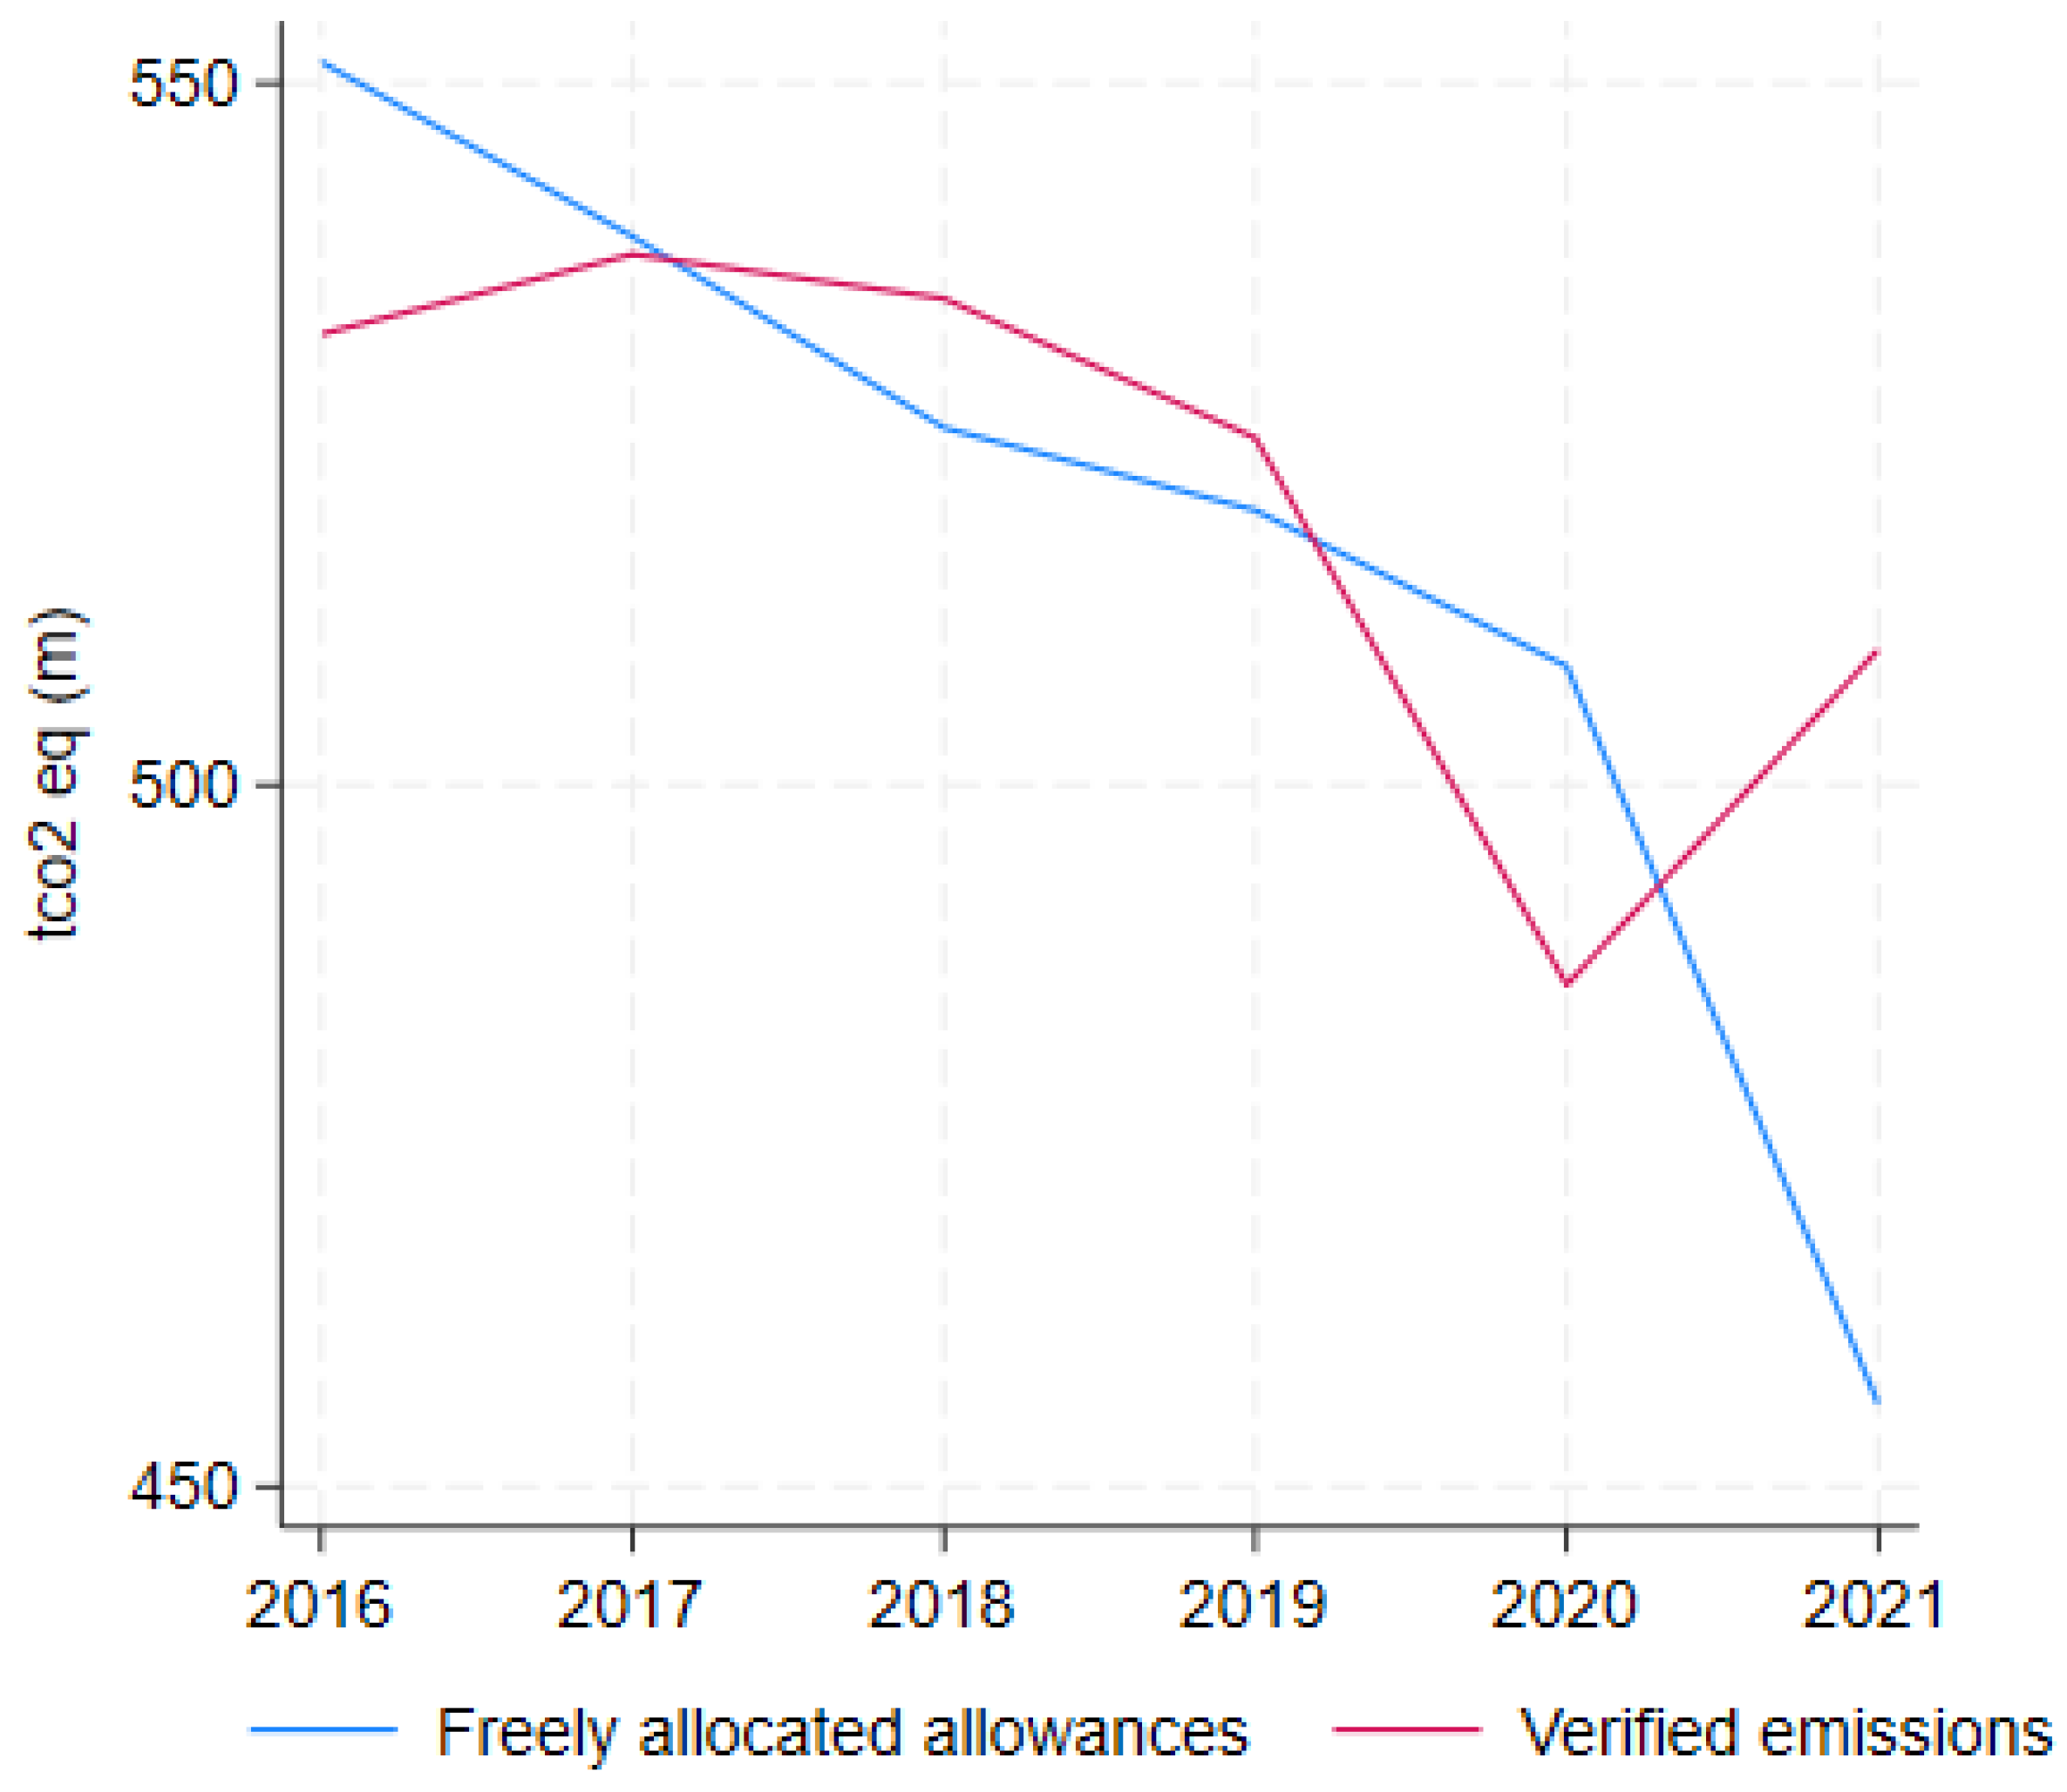
At the time of writing, the ETS covered approximately 45% of the European emissions generated by nearly 11,000 installations. Figure 1 shows the trends in the verified emissions and freely allocated allowances in European industry over the period covered by this analysis.
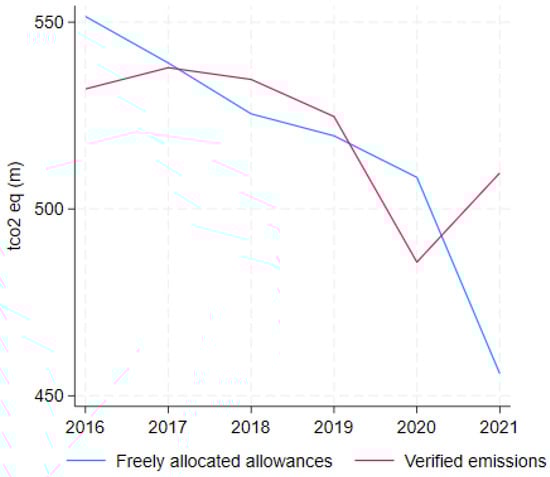
Figure 1.
Verified emissions and free allocations. Source: Our own elaboration on the ETS data viewer and [13], and all the industrial sectors covered by the ETS, except combustions.
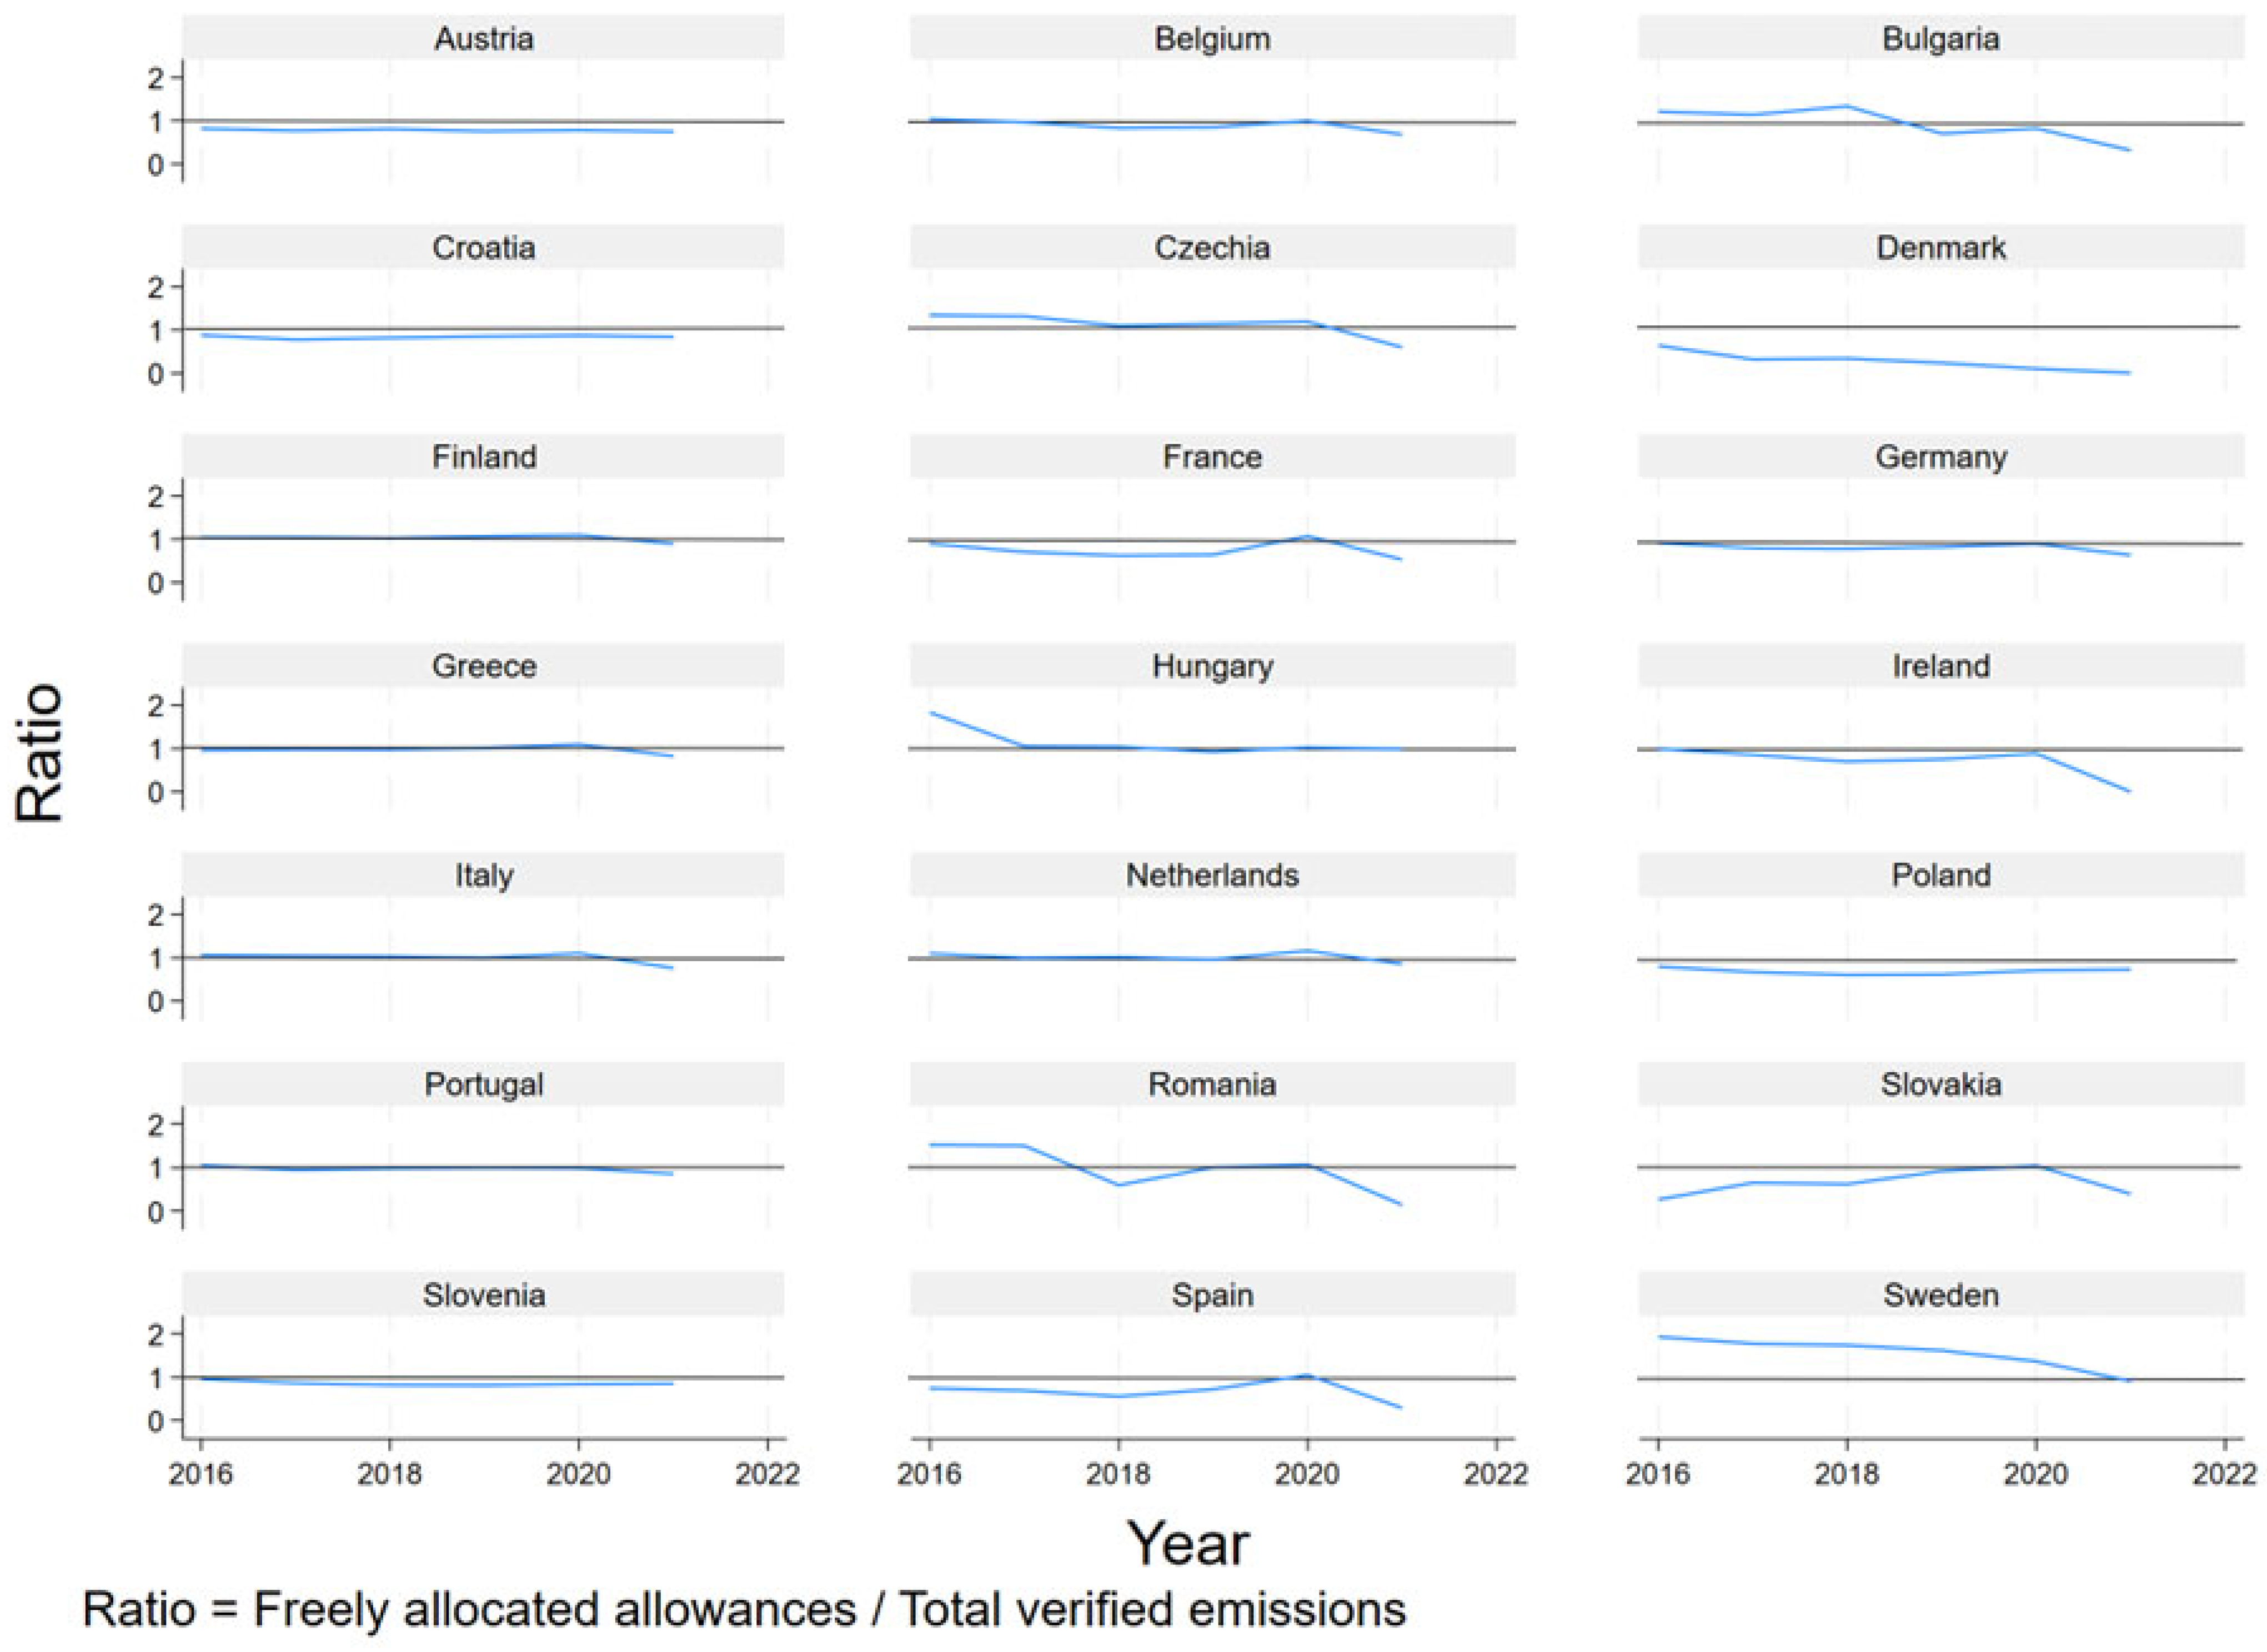
Recent regulatory and environmental policy developments have significantly impacted the system’s development prospects and goals. For example, under the European Green Deal, which has given rise to a series of market regulation measures and policies aimed at promoting sustainability in various sectors of the economy [22], the European strategy aims to reduce greenhouse gas emissions by at least 55% by 2030 [23] to achieve decarbonization by 2050. Therefore, it is evident that steps must be taken to meet the goal, as the emission reduction path should accelerate. Figure 2 shows the trends in the ratio between free allowances and verified emissions in European industry.
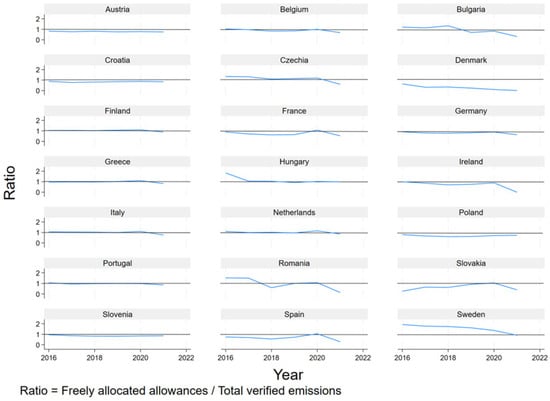
Figure 2.
Ratio between free allowances and verified emissions. Source: Our own elaboration on the ETS data viewer and [13], and all industrial sectors, except combustions.
This article discusses the link between the ETS and related SDGs. The goal was to highlight potential areas where environmental and industrial policies could focus to increase sustainability and a circular economy [24]. This was done by introducing the variables obtained from the European database on sustainable development and the circular economy into our analysis.
3. Research Design
The variables selected for the regression analysis and elasticity estimation, the research questions to be tested, and the model are described in this section. The sample contains data from the manufacturing installations aggregated by country and economic activity for the years 2016 to 2021.
3.1. Variables
The data on verified emissions and free allowances were obtained from the European ETS data viewer, and merged with other databases containing data on emissions, turnover, imports, and exports of economic sectors classified using the classification of economic activities. In addition, we added data on the SDGs to create a functional dataset for the econometric analyses to answer the RQs.
The variables used to develop the model were selected among those related to climate issues available in the EU dataset and are as follows: gap measured the difference between the total carbon emissions generated by domestic demand and verified emissions; thus, it was a measure that captured emissions not accounted for by the system. Table 1 summarized the variables used in the models: cint was the emission intensity, i.e., the ratio of carbon emissions to turnover; csh represented the percentage of sector verified emissions to total emissions and was thus a proxy for the relative size of the industry in terms of emissions; eua was the price of allocations; and open served as a measure for capturing international openness, taking into account the size of the sectoral economy. Then, cbal defined the balance between carbon imports and exports, cbali represented the balance of the interaction between carbon imports and the sectoral dimension and the interaction between carbon exports and the sectoral relative size, depen was the interaction between energy dependence and the emissions generated by domestic demand, and finally “gdpop” described the interaction between GDP and population, where “pop” is population and “year” is the year.

Table 1.
Descriptive statistics.
We explored this issue using the following approach based on a regression analysis, as formalized in Equation (1).
where is the dependent variable, are the independent variables for unit i at time t, are the coefficients to be estimated, is the unique random effect that captures unobserved influences that are constant over time for each unit, and is the error term. Therefore, Equation (2) formalized our model.
After estimating the model on the basis of Equation (1), we calculated the vector of residuals between the dependent variable and the estimate of the same variable on the basis of the model. We then used the model results to answer the RQs underlying this paper.
However, this research methodology had some limitations due to the estimations needed to align the data due to discrepancies between the European Economic Activity Nomenclature codes, the verified emissions register, and the database containing the emissions used to estimate the emissions generated by household demand. After assessing the model, we calculated a measure of effectiveness based on Equation (3).
This formula used the model residuals, i.e., the difference between the actual value of the variable gap and the predicted values, to generate an efficiency measure named X, as was commonly done [25,26]. In the second stage of the analysis, we proceeded in two ways. First, we correlated the variable X with the SDG variables, and then we calculated the elasticity of these variables concerning the X variable.
The selection of the variables was straightforward (Table 2). Environmental taxation is a prominent instrument for implementing EU energy and climate policies [27]. Similarly, there is a growing interest in climate-related economic losses following the Paris Climate Conference, which enshrined loss and damage as a permanent feature of the global climate regime [28]. Regarding the use of raw materials, many key industries require increasing quantities of raw materials [29], especially considering green transition policies along with the value added in environmental goods and services [30]. The circular material use rate is one of the leading indicators of circular economy progress [31]. The following three variables relate to energy, where the first is the final energy consumption [32], given that the factors influencing these variables fit this paper. The second variable relates to the energy import dependency [33], whereas the third is renewable energy in the final energy consumption, which has increased and has become a central target of EU countries’ climate plans [34].
Table 2.
Descriptive statistics of the sustainable development variables.
This approach is useful for identifying the possible areas of improvement for environmental policies to address climate change at the lowest cost to society and to test the linkage with the SDGs by providing valuable insights for policymakers.
3.2. Research Questions
This study investigated the connection between the proper allocation of environmental responsibility in the ETS and achieving specific SDGs. The research questions were as follows. RQ 1: How do the determinants of emissions affect the proper allocation of environmental responsibility? This RQ was based on the fact that environmental policy prevents and repairs environmental externalities while minimizing the cost to society. The idea was that the proper allocation of costs to mitigate environmental externalities from carbon emissions should be consistent with the polluter pays principle [10,11]. The hypothesis to be tested was that there is scope for improving the allocation of environmental liability so that the party responsible for the externality can bear the costs of prevention or remediation based on the actual magnitude of the externality produced. The alternative hypothesis was that cost allocation is already efficient.
RQ2: What is the relationship between the effectiveness of the system and some SDG variables that it affects? The intuition was that there is a link between ETS effectiveness, specifically in allocating costs based on the polluter pays principle, and the identified SDG variables. By answering the RQs, this paper provides an in-depth understanding of the dynamic between carbon pricing policies and sustainability, thus contributing to the existing literature and offering useful guidance for the formulation of more effective environmental policies.
4. Results
In this section, we report the results of the first stage of the analysis, i.e., the model results formalized in Equation (1), and the second stage of the study, in which the model result was used to test the linkage with the SDGs. The results of Equation (2) using a linear panel model with random effects are summarized in Table 3. The econometric analysis provided a detailed overview of the relationship between the economic and environmental variables and ETS effectiveness. Specifically, model 1 analyzed 1132 observations, which were grouped into 236 different entities (id), from 1460 initial non-aggregated data extrapolated from the union registry of the ETS. The model explained a high percentage of the observed variance of the gap being the variables included in the model indicative of the factors affecting the gap, as also confirmed by the Wald value (6164.88) with p-value (Prob > = 0.000). Analyzing the regression coefficients provided crucial insights into how the different factors influenced the carbon emission gap. The disparity between the intragroup and individual variances suggested that the between-group variance was higher than the within-group variance, indicating that a substantial portion of the total variance could be attributed to group differences.
Table 3.
Regression analysis.
On the basis of the assumption that the greater the supply of free allowances to installations in a given sector, the more significant the reduction in the gap, allocations may have mitigated the cost of emissions for ETS-covered installations.
It was observed that an increase in the energy intensity in a sector was correlated with a decrease in the carbon gap, which suggested that industries with a higher energy intensity fell more effectively under ETS accounting, as opposed to those with a lower energy intensity. Thus, the monitoring mechanism appeared to be more effective in energy-intensive sectors. An increase in the relative size of an industry was associated with a reduction in the gap. This indicated that the sectors with a more significant impact on total emissions also had a smaller relative gap. The combination of the first two variables highlighted how well the mechanism worked.
The higher the price of allowances, the wider the gap, indicating that higher carbon prices may not directly translate into reduced emissions without proper control mechanisms. Below, we considered three variables related to international trade.
An increase in a sector’s international openness corresponded to an increase in the gap, suggesting that industries more exposed to global trade may be subject to competition and environmental dumping practices, negatively affecting the accuracy of emissions monitoring. An increase in the net balance between carbon imports and exports was also associated with an increase in the gap. The sectors that import more carbon than they export were a critical issue.
The increase in the interaction between carbon imports and the sectoral size was related to a decrease in the gap, highlighting that the sectors with more significant imports and a greater sectoral size showed a smaller discrepancy in the emissions balance than smaller sectors. Similarly, it was observed that higher levels of energy dependence corresponded to a greater gap, which was consistent with what was found on the import of emissions; that is, imports from countries with a less clean energy mix than European countries had a negative impact on the accuracy of the system. The results presented in Table 3 confirm the hypothesis behind RQ1 and provide insights for policymakers. To check the robustness of the model, an extended version was developed, as shown in model 2 in Table 3, containing additional exogenous variables.
In the second stage of the analysis, we focused on the link between the efficiency of the ETS mechanism and the key variables of sustainable development. Table 4 presents the correlations between these variables, including those derived from the model expressed in Equation (1).
Table 4.
Correlations between the SDG variables and the proxy for ETS efficiency.
To estimate the elasticity of the various sustainable development variables concerning the efficiency of the ETS mechanism, we proceeded by regressing X against each variable of interest. These variables were transformed into logarithms to ensure interpretation in terms of percentage changes. This approach facilitated an understanding of the degree of sensitivity of the efficiency of carbon pricing-based climate policy to changes in the sustainable development variables. The results shown in Table 5 highlight the elasticities of the environmental and sustainable development variables concerning the ETS efficiency.
Table 5.
Elasticity.
An increase in efficiency was correlated with a decrease in environmental taxes (−0.022 *), confirming that a more efficient ETS positively affected environmental taxation. An efficient system was associated with a significant reduction in climate-related economic losses (−0.846 ***), indicating the effectiveness of the ETS for mitigating the economic impacts of climate change. However, an increase in the consumption of raw materials was observed with a more efficient ETS (0.041 ***), raising questions about the sustainable use of resources, as was marked with the environmental value added (−0.043 ***). In this case, a potential trade-off between the efficiency and growth of services aimed at decarbonization emerged. No significant relationship was observed between the ETS efficiency and the use rate of circular materials (0.002). The relationship between the final energy consumption (0.020 ***) was interesting and consistent with what was reported in Table 3, as it was with energy dependence (0.053 **). Finally, no significant relationship was found between the renewable energy sources and final consumption (−0.013). The above confirmed the hypothesis that there was a connection between the efficiency of climate policy based on carbon pricing and the SDGs.
5. Discussion
Our research sought to understand the impact of the ETS and its intersection with environmental policies and sustainable development. The results of our analysis provided critical insights into these complex relationships. Here, we discuss the implications in the context of the existing literature. Our results share some similarities with other studies that examined the implications of carbon pricing mechanisms and noted that while such tools have successfully contributed to substantial emission declines, they are also associated with undesirable phenomena regarding healthy competition [35]. As the European Court of Auditors pointed out, free allowances still account for a remarkable share of all available allowances and have not been appropriately targeted [36]. Similar to previous studies, we recognize that carbon pricing has successfully contributed to substantial emission reductions [37]. However, we also identified some challenging issues regarding jointly evaluating it with SDGs.
The results offered several important insights for designing environmental policies and regulating carbon emissions. The negative association between energy intensity and the gap may indicate that incentives to increase energy efficiency in sectors could be an effective strategy for improving monitoring accuracy and reducing carbon emissions. This implies investing in clean technologies and encouraging more energy-efficient production practices [38]. In addition, the observed negative correlation between the relative sector size and the gap indicated that the sectors with higher emissions were effectively monitored [13]. There may be value in intensifying monitoring and regulatory efforts in industries with fewer emissions, which may escape effective tracking. The increase in the gap associated with rising carbon prices was linkable to the fact that higher carbon price policies may not always effectively reduce total emissions, highlighting the need to balance carbon pricing policies with measures that limit the risk of carbon leakage [39,40], such as investment in technological innovation and international cooperation. The positive association between international openness and the gap suggested that integrating global markets can complicate efforts to reduce carbon emissions. Therefore, policies should consider the effects of international trade on emissions and explore mechanisms to mitigate the negative environmental impact of trade [41,42]. Finally, the influence of energy dependence confirmed the importance of an energy transition [43] to cleaner sources [44] and the need to support investments in green technologies. Policies promoting renewable energy use and reducing dependence on fossil fuels can help reduce the gap and achieve more ambitious climate goals, provided an appropriate level playing field is maintained.
The analysis of the relationship between ETS efficiency and sustainable development variables offers important insights into environmental policies. Reducing environmental taxes and climate-related economic losses with a more efficient ETS confirms that the system can be an effective environmental policy tool. However, the association between an increase in raw material consumption and final energy consumption poses challenges regarding sustainable resource management and reduction in overall energy use. The absence of a significant relationship between the use of circular materials and renewable energy sources suggests the need to integrate environmental policies with other measures, such as market reforms, to promote the circular economy [45] and energy transition. Finally, attention is drawn to the need for policies that balance efficiency with energy security and independence [46,47], given recent crises that have seriously undermined the resilience of the European economy.
Although this study offers valuable insights, it is important to acknowledge the limitations associated with data harmonization. While the novel finding of a direct link between the efficiency of the ETS and SDGs is noteworthy, a more comprehensive analysis should consider overlapping alternative policies to fully comprehend the impact.
This study has policy implications. Integrating environmental policies with market reforms is vital, as is the diversification of policy instruments that carefully manage overlapping [48,49]. We argue that complementary policies can achieve better results. This is consistent with previous studies, providing further support for the claim that the diversification of policy instruments can advance climate governance [50]. Regular evaluation of carbon pricing mechanisms is critical as is the integration of environmental policies with sustainable development.
6. Conclusions
This study analyzed the determinants of the correct allocation of environmental responsibility and explored the relationship between the effectiveness of the ETS system and specific SDGs. The results showed that energy intensity and the relative size of the sector in terms of emissions were crucial factors affecting the effectiveness of the ETS. It was also observed that higher allocation prices and international sector openness can negatively affect the accuracy of emission monitoring. These results suggest that targeted policies and a balanced approach are essential for improving the effectiveness of the ETS and addressing the challenges of climate change.
The link between the ETS efficiency and key sustainable development variables was also explored. The analysis revealed that a more efficient ETS could positively impact aspects such as reducing environmental taxes and climate-related economic losses. However, challenges have emerged, emphasizing the need for a holistic approach that integrates carbon pricing with sustainable development policies.
A combination of policies, including improvements in energy efficiency, targeted regulations, balanced carbon pricing policies, international trade considerations, and an energy transition to cleaner sources, is essential to effectively address the carbon emissions challenge.
Future research could comparatively analyze the effectiveness of the ETS on the SDGs in different regions, explore the potential of circular economy and resource efficiency, and assess the distributional effects on socioeconomic groups.
In addition, long-term scenarios should be developed to examine the evolution of the ETS by evaluating its potential contribution to achieving the sustainability goals through different economic and technological pathways, minimizing social and economic costs.
Author Contributions
Conceptualization, G.D.F., M.B. and U.A.; Methodology, G.D.F., M.B. and U.A.; Formal analysis, G.D.F., M.B. and U.A.; Writing—review & editing, G.D.F., M.B. and U.A. All authors have read and agreed to the published version of the manuscript.
Funding
This research received no external funding.
Institutional Review Board Statement
Not applicable.
Informed Consent Statement
Not applicable.
Data Availability Statement
The data are available upon request.
Conflicts of Interest
The authors declare no conflict of interest.
References
- Barchiesi, M.A.; Costa, R.; Di Pillo, F. The Link between the Compliance with Environmental Legislation on Separate Collection and the Municipal Solid Waste Costs. Sustainability 2022, 14, 5661. [Google Scholar] [CrossRef]
- de Perthuis, C.; Trotignon, R. Governance of CO2 Markets: Lessons from the EU ETS. Energy Policy 2014, 75, 100–106. [Google Scholar] [CrossRef]
- Hintermayer, M. A Carbon Price Floor in the Reformed EU ETS: Design Matters! Energy Policy 2020, 147, 111905. [Google Scholar] [CrossRef] [PubMed]
- Fragkos, P.; Fragkiadakis, K. Analyzing the Macro-Economic and Employment Implications of Ambitious Mitigation Pathways and Carbon Pricing. Front. Clim. 2022, 4, 785136. [Google Scholar] [CrossRef]
- Verbruggen, A.; Laes, E.; Woerdman, E. Anatomy of Emissions Trading Systems: What Is the EU ETS? Environ. Sci. Policy 2019, 98, 11–19. [Google Scholar] [CrossRef]
- Cludius, J.; de Bruyn, S.; Schumacher, K.; Vergeer, R. Ex-Post Investigation of Cost Pass-through in the EU ETS—An Analysis for Six Industry Sectors. Energy Econ. 2020, 91, 104883. [Google Scholar] [CrossRef]
- Mirzaee Ghazani, M.; Jafari, M.A. The Efficiency of CO2 Market in the Phase III EU ETS: Analyzing in the Context of a Dynamic Approach. Environ. Sci. Pollut. Res. 2021, 28, 61080–61095. [Google Scholar] [CrossRef]
- Paroussos, L.; Fragkos, P.; Capros, P.; Fragkiadakis, K. Assessment of Carbon Leakage through the Industry Channel: The EU Perspective. Technol. Forecast. Soc. Chang. 2015, 90, 204–219. [Google Scholar] [CrossRef]
- Zhong, J.; Pei, J. Beggar Thy Neighbor? On the Competitiveness and Welfare Impacts of the EU’s Proposed Carbon Border Adjustment Mechanism. Energy Policy 2022, 162, 112802. [Google Scholar] [CrossRef]
- Massenberg, J.R. Global Climate Change—Who Ought to Pay the Bill? Sustainability 2021, 13, 13393. [Google Scholar] [CrossRef]
- Davidson, M.D. How Fairness Principles in the Climate Debate Relate to Theories of Distributive Justice. Sustainability 2021, 13, 7302. [Google Scholar] [CrossRef]
- Sosa-Nunez, G. Relationship Between Emissions Trading System and the 2030 Agenda for Sustainable Development. In Towards an Emissions Trading System in Mexico: Rationale, Design and Connections with the Global Climate Agenda; Lucatello, S., Ed.; Springer International Publishing: Cham, Switzerland, 2022; pp. 285–303. ISBN 978-3-030-82759-5. [Google Scholar]
- Beccarello, M.; Di Foggia, G. Emissions Trading System: Bridging the Gap between Environmental Targets and Fair Competition. Environ. Res. Commun. 2023, 5, 085009. [Google Scholar] [CrossRef]
- Braun, M. The Evolution of Emissions Trading in the European Union—The Role of Policy Networks, Knowledge and Policy Entrepreneurs. Account. Organ. Soc. 2009, 34, 469–487. [Google Scholar] [CrossRef]
- Narassimhan, E.; Gallagher, K.S.; Koester, S.; Alejo, J.R. Carbon Pricing in Practice: A Review of Existing Emissions Trading Systems. Clim. Policy 2018, 18, 967–991. [Google Scholar] [CrossRef]
- Perino, G.; Willner, M. EU-ETS Phase IV: Allowance Prices, Design Choices and the Market Stability Reserve. Clim. Policy 2017, 17, 936–946. [Google Scholar] [CrossRef]
- Patnaik, S. Emissions Permit Allocation and Strategic Firm Behavior: Evidence from the Oil Sector in the European Union Emissions Trading Scheme. Bus. Strateg. Environ. 2020, 29, 976–995. [Google Scholar] [CrossRef]
- Verde, S.F.; Teixidó, J.; Marcantonini, C.; Labandeira, X. Free Allocation Rules in the EU Emissions Trading System: What Does the Empirical Literature Show? Clim. Policy 2019, 19, 439–452. [Google Scholar] [CrossRef]
- Schmidt, T.S.; Schneider, M.; Rogge, K.S.; Schuetz, M.J.A.; Hoffmann, V.H. The Effects of Climate Policy on the Rate and Direction of Innovation: A Survey of the EU ETS and the Electricity Sector. Environ. Innov. Soc. Trans. 2012, 2, 23–48. [Google Scholar] [CrossRef]
- Boyce, J.K. Carbon Pricing: Effectiveness and Equity. Ecol. Econ. 2018, 150, 52–61. [Google Scholar] [CrossRef]
- Di Foggia, G.; Beccarello, M.; Borgarello, M.; Bazzocchi, F.; Moscarelli, S. Market-Based Instruments to Promote Energy Efficiency: Insights from the Italian Case. Energies 2022, 15, 7574. [Google Scholar] [CrossRef]
- Beccarello, M.; Di Foggia, G. Review and Perspectives of Key Decarbonization Drivers to 2030. Energies 2023, 16, 1345. [Google Scholar] [CrossRef]
- Scheuing, H.; Kamm, J. The EU on the Road to Climate Neutrality—Is the ‘Fit for 55′ Package Fit for Purpose? Renew. Energy Law Policy Rev. 2022, 10, 4–18. [Google Scholar]
- Abad-Segura, E.; Fuente, A.B.d.l.; González-Zamar, M.-D.; Belmonte-Ureña, L.J. Effects of Circular Economy Policies on the Environment and Sustainable Growth: Worldwide Research. Sustainability 2020, 12, 5792. [Google Scholar] [CrossRef]
- Bauer, P.W. Recent Developments in the Econometric Estimation of Frontiers. J. Econom. 1990, 46, 39–56. [Google Scholar] [CrossRef]
- Fried, H.O.; Lovell, C.A.K.; Schmidt, S.S. (Eds.) The Measurement of Productive Efficiency and Productivity Growth; Oxford University Press: New York, NY, USA, 2008; ISBN 978-0-19-518352-8. [Google Scholar]
- Famulska, T.; Kaczmarzyk, J.; Grząba-Włoszek, M. Environmental Taxes in the Member States of the European Union—Trends in Energy Taxes. Energies 2022, 15, 8718. [Google Scholar] [CrossRef]
- Roberts, E.; Pelling, M. Climate Change-Related Loss and Damage: Translating the Global Policy Agenda for National Policy Processes. Clim. Dev. 2018, 10, 4–17. [Google Scholar] [CrossRef]
- Domaracka, L.; Matuskova, S.; Tausova, M.; Senova, A.; Kowal, B. Efficient Use of Critical Raw Materials for Optimal Resource Management in EU Countries. Sustainability 2022, 14, 6554. [Google Scholar] [CrossRef]
- Xue, P.; Du, J.; Liu, J.; Li, Z.; Albahooth, B.; Yang, Y. Natural Resources and Economic Perspective: Manufacturing Value Added for Europe and Central Asian Economies. Resour. Policy 2023, 86, 104132. [Google Scholar] [CrossRef]
- Busu, M.; Trica, C.L. Sustainability of Circular Economy Indicators and Their Impact on Economic Growth of the European Union. Sustainability 2019, 11, 5481. [Google Scholar] [CrossRef]
- Zaharia, A.; Diaconeasa, M.C.; Brad, L.; Lădaru, G.-R.; Ioanăș, C. Factors Influencing Energy Consumption in the Context of Sustainable Development. Sustainability 2019, 11, 4147. [Google Scholar] [CrossRef]
- Carfora, A.; Pansini, R.V.; Scandurra, G. Energy Dependence, Renewable Energy Generation and Import Demand: Are EU Countries Resilient? Renew. Energy 2022, 195, 1262–1274. [Google Scholar] [CrossRef]
- Simionescu, M.; Strielkowski, W.; Tvaronavičienė, M. Renewable Energy in Final Energy Consumption and Income in the EU-28 Countries. Energies 2020, 13, 2280. [Google Scholar] [CrossRef]
- Böning, J.; Di Nino, V.; Folger, T. Benefits and Costs of the ETS in the EU, a Lesson Learned for the CBAM Design; Working Paper; European Central Bank: Frankfurt, Germany, 2023; ISBN 978-92-899-5506-5. [Google Scholar]
- ECA. The EU’s Emissions Trading System: Free Allocation of Allowances Needed Better Targeting; European Court of Auditors: Luxembourg, 2020; ISBN 978-92-847-5050-4. [Google Scholar]
- Pietzcker, R.C.; Osorio, S.; Rodrigues, R. Tightening EU ETS Targets in Line with the European Green Deal: Impacts on the Decarbonization of the EU Power Sector. Appl. Energy 2021, 293, 116914. [Google Scholar] [CrossRef]
- Mikulčić, H.; Baleta, J.; Klemeš, J.J. Cleaner Technologies for Sustainable Development. Clean. Eng. Technol. 2022, 7, 100445. [Google Scholar] [CrossRef]
- Grebe, V. Current and Future Protection against Carbon Leakage in the European Emissions Trading System. Renew. Energy Law Policy Rev. 2023, 11, 72–78. [Google Scholar] [CrossRef]
- Jakob, M. Why Carbon Leakage Matters and What Can Be Done against It. One Earth 2021, 4, 609–614. [Google Scholar] [CrossRef]
- De Beule, F.; Dewaelheyns, N.; Schoubben, F.; Struyfs, K.; Van Hulle, C. The Influence of Environmental Regulation on the FDI Location Choice of EU ETS-Covered MNEs. J. Environ. Manag. 2022, 321, 115839. [Google Scholar] [CrossRef]
- Teixidó, J.; Verde, S.F.; Nicolli, F. The Impact of the EU Emissions Trading System on Low-Carbon Technological Change: The Empirical Evidence. Ecol. Econ. 2019, 164, 106347. [Google Scholar] [CrossRef]
- Capros, P.; Kannavou, M.; Evangelopoulou, S.; Petropoulos, A.; Siskos, P.; Tasios, N.; Zazias, G.; DeVita, A. Outlook of the EU Energy System up to 2050: The Case of Scenarios Prepared for European Commission’s “Clean Energy for All Europeans” Package Using the PRIMES Model. Energy Strateg. Rev. 2018, 22, 255–263. [Google Scholar] [CrossRef]
- Capurso, T.; Stefanizzi, M.; Torresi, M.; Camporeale, S.M. Perspective of the Role of Hydrogen in the 21st Century Energy Transition. Energy Convers. Manag. 2022, 251, 114898. [Google Scholar] [CrossRef]
- Di Foggia, G.; Beccarello, M. An Overview of Packaging Waste Models in Some European Countries. Recycling 2022, 7, 38. [Google Scholar] [CrossRef]
- Strambo, C.; Nilsson, M.; Månsson, A. Coherent or Inconsistent? Assessing Energy Security and Climate Policy Interaction within the European Union. Energy Res. Soc. Sci. 2015, 8, 1–12. [Google Scholar] [CrossRef]
- Guivarch, C.; Monjon, S. Identifying the Main Uncertainty Drivers of Energy Security in a Low-Carbon World: The Case of Europe. Energy Econ. 2017, 64, 530–541. [Google Scholar] [CrossRef]
- Schäfer, S. Decoupling the EU ETS from Subsidized Renewables and Other Demand Side Effects: Lessons from the Impact of the EU ETS on CO2 Emissions in the German Electricity Sector. Energy Policy 2019, 133, 110858. [Google Scholar] [CrossRef]
- Perino, G. New EU ETS Phase 4 Rules Temporarily Puncture Waterbed. Nat. Clim. Chang. 2018, 8, 262–264. [Google Scholar] [CrossRef]
- Oberthür, S.; von Homeyer, I. From Emissions Trading to the European Green Deal: The Evolution of the Climate Policy Mix and Climate Policy Integration in the EU. J. Eur. Public Policy 2023, 30, 445–468. [Google Scholar] [CrossRef]
Disclaimer/Publisher’s Note: The statements, opinions and data contained in all publications are solely those of the individual author(s) and contributor(s) and not of MDPI and/or the editor(s). MDPI and/or the editor(s) disclaim responsibility for any injury to people or property resulting from any ideas, methods, instructions or products referred to in the content. |
© 2023 by the authors. Licensee MDPI, Basel, Switzerland. This article is an open access article distributed under the terms and conditions of the Creative Commons Attribution (CC BY) license (https://creativecommons.org/licenses/by/4.0/).