
Probabilistic Load Flow Analysis Using Nonparametric Distribution


Abstract
:1. Introduction
2. Kernel Density Estimation with Adaptive Bandwidth (AKDE)
2.1. Kernel Density Estimation Basic Theory
2.2. Adaptive Kernel Density Estimation
3. Load Flow Based on LHS
- Set the no. of variables to n-var and the no. of samples to n-sample.
- Generate an n-sample by an n-var matrix of random numbers that are uniformly distributed between 0 and 1 using the rand function.
- Randomly shuffle the rows of the matrix using the randomperm function to obtain a random permutation of the sample indices for each variable.
- Calculate the probabilities of selecting each sample for each variable by dividing the shuffled indices by the total number of samples, subtracting a small random number to avoid repeated samples, and adding a small number to avoid zero probabilities.
- Use the inverse of the standard normal CDF (norminv) to transform the probabilities into normally distributed values.
- Scale the normal values to the desired mean and standard deviation for each variable.
- Repeat steps 3–6 for each variable to obtain the Latin hypercube sample.
- The resulting s matrix will be a Latin hypercube sample with n-sample samples and n-var variables, with each variable having a mean and standard deviation specified by Xmean and Xsd, respectively.
3.1. Case Study
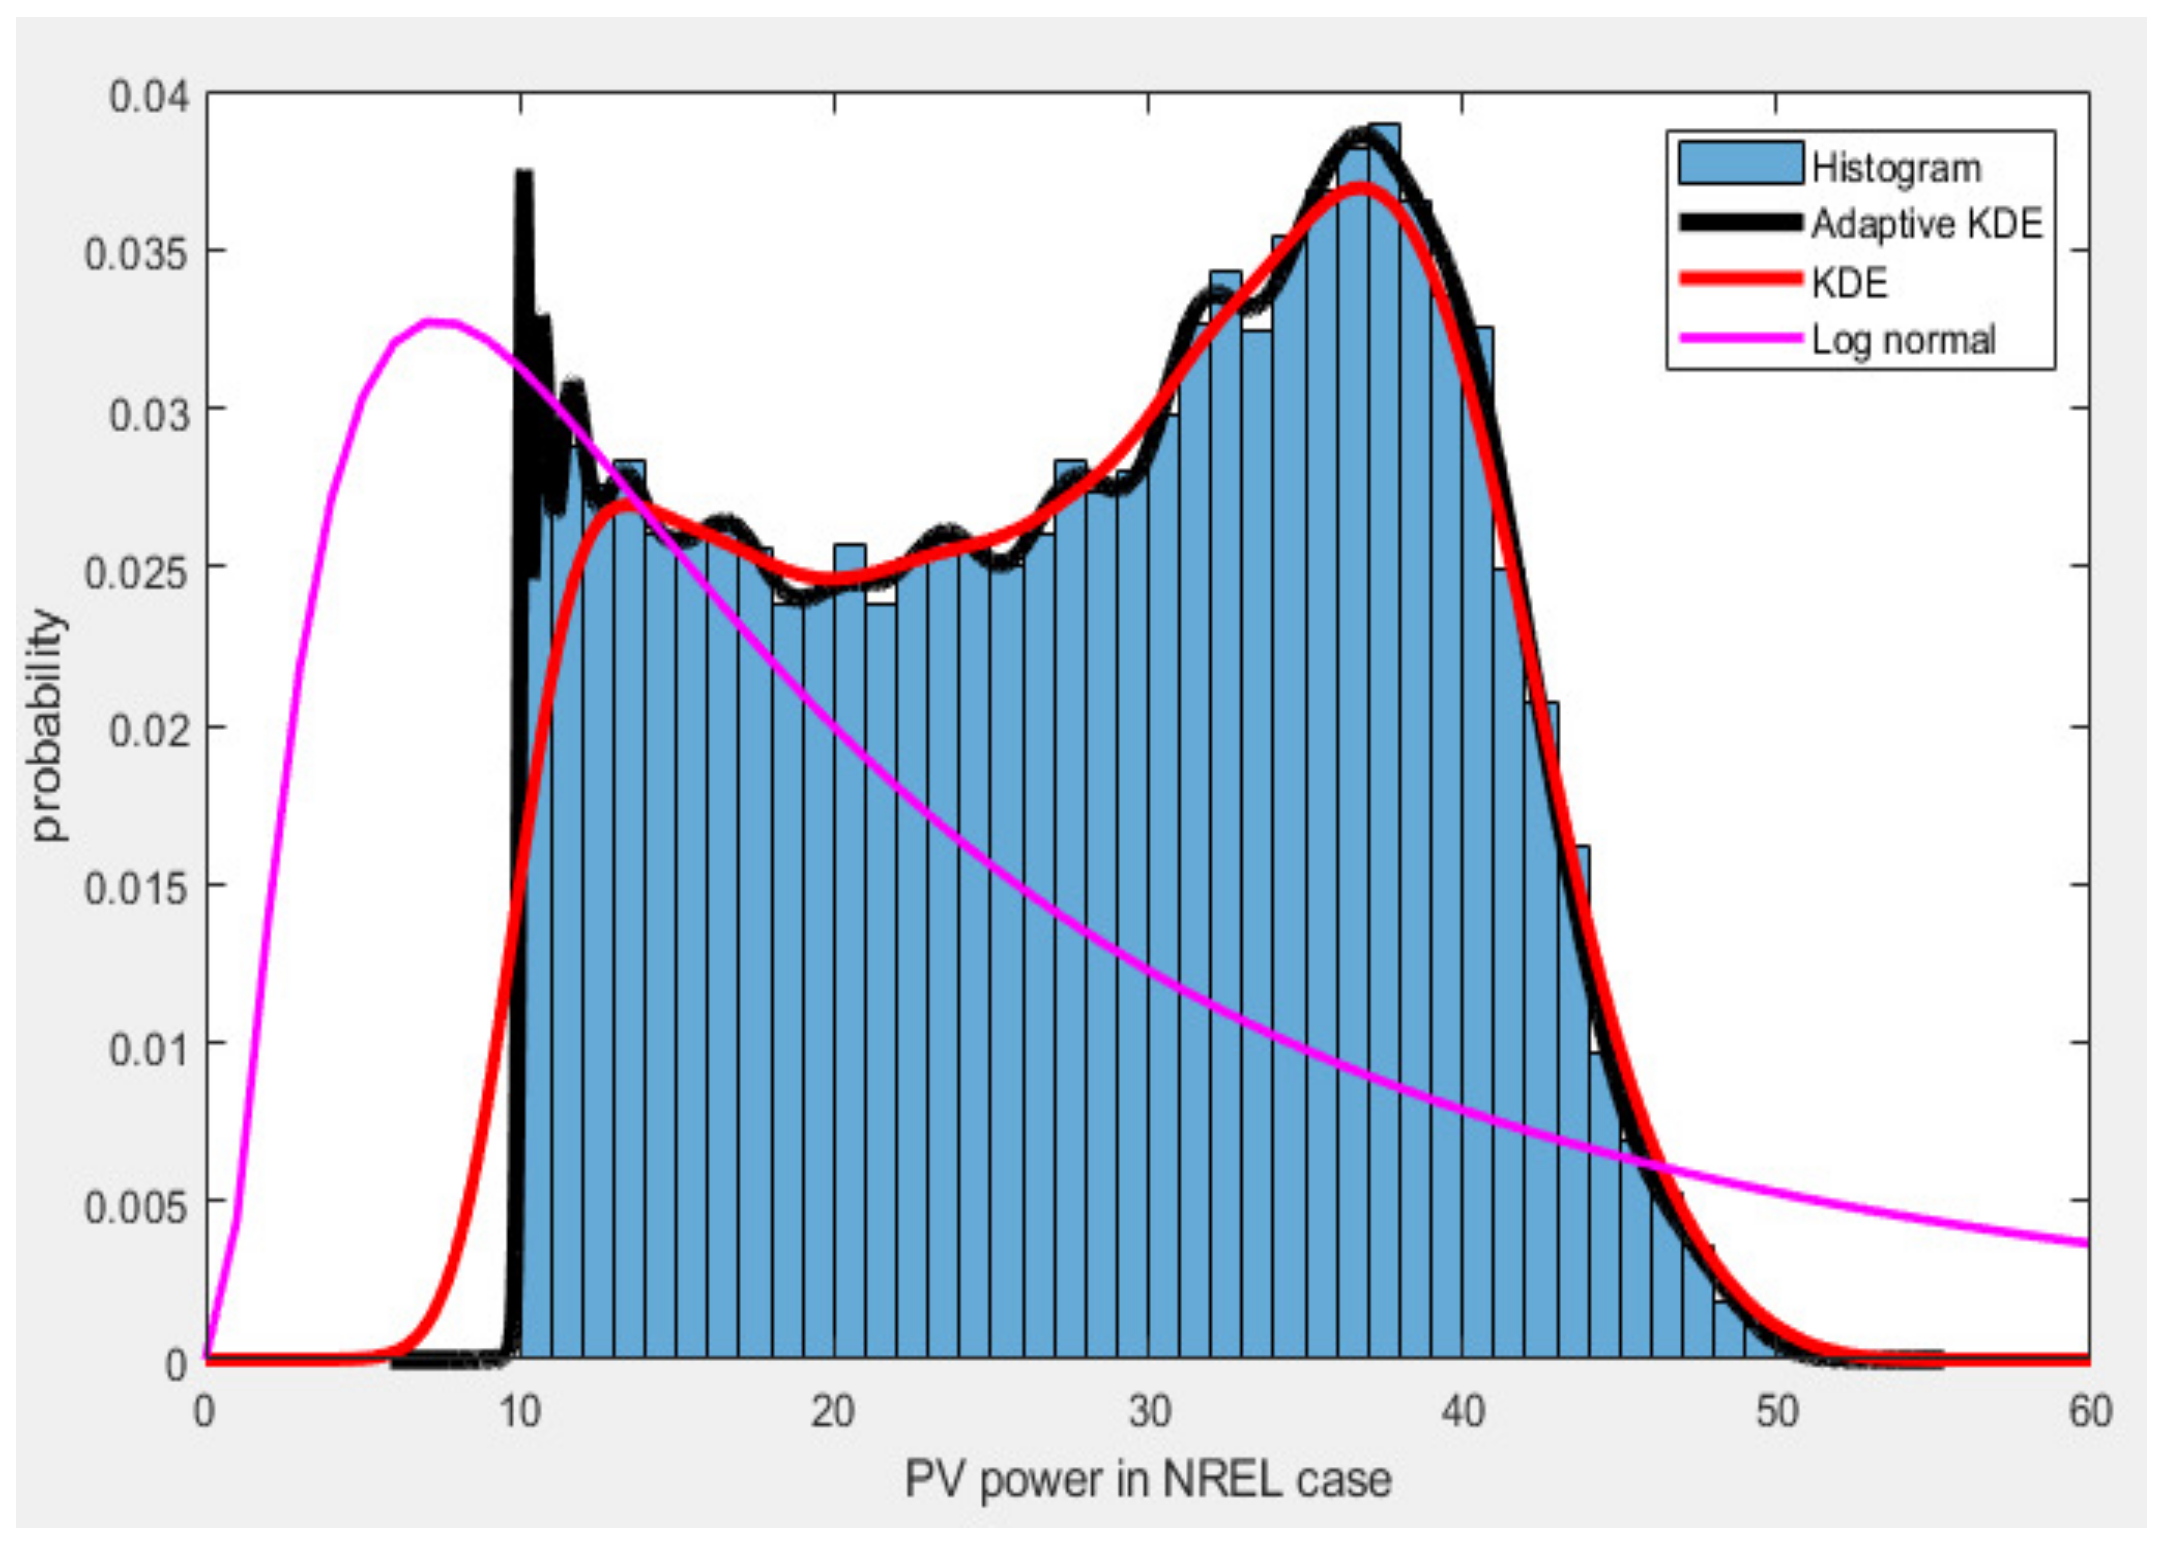
PDF Estimation
4. PLF on IEEE-14 and IEEE-118 Bus System
4.1. IEEE-14 Bus System with Modification
4.2. IEEE-118 Bus System with Modification
5. Performance Analysis of AKDE-LHS, HMC, and MCS
6. Conclusions
Author Contributions
Funding
Institutional Review Board Statement
Data Availability Statement
Conflicts of Interest
References
- Singh, V.; Moger, T.; Jena, D. Uncertainty handling techniques in power systems: A critical review. Electr. Power Syst. Res. 2022, 203, 107633. [Google Scholar] [CrossRef]
- Ehsan, A.; Yang, Q. State-of-the-art techniques for modelling of uncertainties in active distribution network planning: A review. Appl. Energy 2019, 239, 1509–1523. [Google Scholar] [CrossRef]
- Ramadhani, U.H.; Shepero, M.; Munkhammar, J.; Widén, J.; Etherden, N. Review of probabilistic load flow approaches for power distribution systems with photovoltaic generation and electric vehicle charging. Int. J. Electr. Power Energy Syst. 2020, 120, 106003. [Google Scholar] [CrossRef]
- Borkowska, B. Probabilistic load flow. IEEE Trans. Power Appar. Syst. 1974, 3, 752–759. [Google Scholar] [CrossRef]
- Bin, L.; Shahzad, M.; Bing, Q.; Ahsan, M.; Shoukat, M.U.; Khan, H.; Fahal, N.A. The probabilistic load flow analysis by considering uncertainty with correlated loads and photovoltaic generation using Copula theory. AIMS Energy 2018, 6, 414–435. [Google Scholar] [CrossRef]
- Wang, Y.; Zhang, N.; Kang, C.; Miao, M.; Shi, R.; Xia, Q. An efficient approach to power system uncertainty analysis with high-dimensional dependencies. IEEE Trans. Power Syst. 2018, 33, 2984–2994. [Google Scholar] [CrossRef]
- Abbasi, A.R. Comparison parametric and non-parametric methods in probabilistic load flow studies for power distribution networks. Electr. Eng. 2022, 104, 3943–3954. [Google Scholar] [CrossRef]
- Guo, Z.; Wei, W.; Chen, L.; Dong, Z.; Mei, S. Parametric distribution optimal power flow with variable renewable generation. IEEE Trans. Power Syst. 2021, 37, 1831–1841. [Google Scholar] [CrossRef]
- Liu, J.; Srikantha, P. Kernel Structure Design for Data-Driven Probabilistic Load Flow Studies. IEEE Trans. Smart Grid 2022, 13, 2679–2689. [Google Scholar] [CrossRef]
- Billinton, R.; Li, W. A Monte Carlo method for multi-area generation system reliability assessment. IEEE Trans. Power Syst. 1992, 7, 1487–1492. [Google Scholar] [CrossRef]
- Palahalli, H.; Maffezzoni, P.; Gruosso, G. Modeling photovoltaic generation uncertainties for monte carlo method based probabilistic load flow analysis of distribution network. In Proceedings of the 2020 55th International Universities Power Engineering Conference (UPEC), Turin, Italy, 1–4 September 2020; pp. 1–6. [Google Scholar]
- Constante-Flores, G.E.; Illindala, M.S. Data-driven probabilistic power flow analysis for a distribution system with renewable energy sources using Monte Carlo simulation. IEEE Trans. Ind. Appl. 2018, 55, 174–181. [Google Scholar] [CrossRef]
- Speagle, J.S. A conceptual introduction to Markov chain Monte Carlo methods. arXiv 2019, arXiv:1909.12313. [Google Scholar]
- Frisoni, P.; Gozzini, F.; Vidotto, F. Markov chain Monte Carlo methods for graph refinement in spinfoam cosmology. Class. Quantum Gravity 2023, 40, 105001. [Google Scholar] [CrossRef]
- Jones, G.L.; Qin, Q. Markov chain Monte Carlo in practice. Annu. Rev. Stat. Its Appl. 2022, 9, 557–578. [Google Scholar] [CrossRef]
- Li, C.; Gong, Z.; Wang, Y.; Wu, W.; Ni, S. Analytical Stochastic Power Flow for Power Systems with High Penetration of Renewable Energy. In Proceedings of the 2021 IEEE 5th Conference on Energy Internet and Energy System Integration (EI2), Taiyuan, China, 22–24 October 2021; pp. 2484–2489. [Google Scholar]
- Wang, C.; Liu, C.; Tang, F.; Liu, D.; Zhou, Y. A scenario-based analytical method for probabilistic load flow analysis. Electr. Power Syst. Res. 2020, 181, 106193. [Google Scholar] [CrossRef]
- Tao, Y.; Xu, M.; Guo, Z.; Zhang, J.; Cui, Z.; Tan, Y.; Lei, J. Time series probabilistic power flow calculation of distribution network based on nonparametric kernel density estimation. In Proceedings of the 2022 International Conference on Computers, Information Processing and Advanced Education (CIPAE), Ottawa, ON, Canada, 26–28 August 2022; pp. 16–20. [Google Scholar]
- Urquizo, J.; Calderón, C.; James, P. Using a Local Framework Combining Principal Component Regression and Monte Carlo Simulation for Uncertainty and Sensitivity Analysis of a Domestic Energy Model in Sub-City Areas. Energies 2017, 10, 1986. [Google Scholar] [CrossRef]
- Huang, Y.; Chen, S.; Chen, Z.; Hu, W.; Huang, Q. Improved probabilistic load flow method based on D-vine copulas and Latin hypercube sampling in distribution network with multiple wind generators. IET Gener. Transm. Distrib. 2020, 14, 893–899. [Google Scholar] [CrossRef]
- Aibin, L.; Wenyi, L. Reliability evaluation of distribution network with distributed generation based on latin hypercube sequential sampling. In Proceedings of the 2020 3rd International Conference on Electron Device and Mechanical Engineering (ICEDME), Suzhou, China, 1–3 May 2020; pp. 97–99. [Google Scholar]
- Deng, X.; Zhang, P.; Jin, K.; He, J.; Wang, X.; Wang, Y. Probabilistic load flow method considering large-scale wind power integration. J. Mod. Power Syst. Clean Energy 2019, 7, 813–825. [Google Scholar] [CrossRef]
- Zhang, W.; He, Y.; Yang, S. Day-ahead load probability density forecasting using monotone composite quantile regression neural network and kernel density estimation. Electr. Power Syst. Res. 2021, 201, 107551. [Google Scholar] [CrossRef]
- He, Y.; Cao, C.; Wang, S.; Fu, H. Nonparametric probabilistic load forecasting based on quantile combination in electrical power systems. Appl. Energy 2022, 322, 119507. [Google Scholar] [CrossRef]
- Nosratabadi, H.; Mohammadi, M.; Kargarian, A. Nonparametric probabilistic unbalanced power flow with adaptive kernel density estimator. IEEE Trans. Smart Grid 2018, 10, 3292–3300. [Google Scholar] [CrossRef]
- Rajan, R.; Fernandez, F.M.; Yang, Y. Primary frequency control techniques for large-scale PV-integrated power systems: A review. Renew. Sustain. Energy Rev. 2021, 144, 110998. [Google Scholar] [CrossRef]
- Parzen, E. On estimation of a probability density function and mode. Ann. Math. Stat. 1962, 33, 1065–1076. [Google Scholar] [CrossRef]
- Ye, A. Nonparametric Econometrics; Nankai University Press: Tianjin, China, 2003. [Google Scholar]
- Obtain Solar Power Data: Western State California. Available online: https://www.nrel.gov/grid/solar-power-data.html (accessed on 30 June 2023).
- Obtaining the Eastern Wind Dataset. Available online: http://www.nrel.gov/electricity/transmission/eastern_wind_dataset.html (accessed on 30 June 2023).
- Yu, H.; Chung, C.; Wong, K.; Lee, H.; Zhang, J. Probabilistic load flow evaluation with hybrid latin hypercube sampling and cholesky decomposition. IEEE Trans. Power Syst. 2009, 24, 661–667. [Google Scholar] [CrossRef]


| PV Data | Lognormal | KDE | AKDE |
|---|---|---|---|
| (%) | 285.021 | 205.066 | 160.323 |
| (%) | 99.2948 | 22.3299 | 25.1239 |
| Wind Data | |||
| (%) | 28.6995 | 26.5862 | 8.5673 |
| (%) | 320.6563 | 161.9865 | 77.0140 |
| Method | MCS | AKDE-LHS | HMC | LHS Error | HMC Error | |
|---|---|---|---|---|---|---|
| V | μ | 0.010396 | 0.010393 | 0.010402 | 0.000288 | 0.000577 |
| 0.000154 | 0.000155 | 0.000146 | 0.006493 | 0.051948 | ||
| Max. | 0.0106 | 0.0106 | 0.0106 | 0 | 0 | |
| μ | 0.103281 | 0.104723 | −0.10092 | 0.013961 | 1.977140 | |
| 0.040029 | 0.040512 | 0.040617 | 0.012066 | 0.014689 | ||
| Max. | 0 | 0 | 0 | 0 | 0 | |
| Pij | μ | 0.393562 | 0.397711 | 0.215264 | 0.010542 | 0.453036 |
| 0.010954 | 0.010584 | 0.315917 | 0.033777 | 27.84033 | ||
| Max. | 0.411965 | 0.412481 | 1.266761 | 0.001252 | 2.074923 | |
| Qij | μ | 0.00156 | 0.001587 | 0.023242 | 0.017307 | 13.89871 |
| 0.001675 | 0.001701 | 0.052302 | 0.015522 | 30.22507 | ||
| Max. | 0.005709 | 0.005723 | 0.162495 | 0.002452 | 27.46295 | |
| Method | MCS | AKDE-LHS | HMC | LHS Error | HMC Error | |
|---|---|---|---|---|---|---|
| V | μ | 1.0405 | 1.0404 | 1.0404 | 9.61076 × 10⁻⁵ | 9.61076 × 10⁻⁵ |
| 0.0124 | 0.0123 | 0.0127 | 0.008064516 | 0.024193548 | ||
| max. | 1.06 | 1.06 | 1.06 | 0 | 0 | |
| μ | 20.9045 | 18.7392 | 17.432 | 0.103580569 | 0.166112559 | |
| 8.5881 | 11.5134 | 12.7897 | 0.340622489 | 0.489235104 | ||
| max. | 37.6805 | 37.6155 | 38.3396 | 0.00172503 | 0.017491806 | |
| Pij | μ | 2.5895 | 3.8027 | 4.7794 | 0.468507434 | 0.845684495 |
| 70.5889 | 69.0376 | 67.6733 | 0.021976543 | 0.041303944 | ||
| max. | 301.459 | 300.872 | 301.249 | 0.001945869 | 0.000695285 | |
| Qij | μ | 0.3572 | 0.0684 | 0.568 | 0.808510638 | 0.590145577 |
| 16.5543 | 0.1203 | 15.7432 | 0.992733006 | 0.048996333 | ||
| max. | 80.2127 | 0.5721 | 80.2102 | 0.992867713 | 3.11671 × 10⁻⁵ | |
Disclaimer/Publisher’s Note: The statements, opinions and data contained in all publications are solely those of the individual author(s) and contributor(s) and not of MDPI and/or the editor(s). MDPI and/or the editor(s) disclaim responsibility for any injury to people or property resulting from any ideas, methods, instructions or products referred to in the content. |
© 2023 by the authors. Licensee MDPI, Basel, Switzerland. This article is an open access article distributed under the terms and conditions of the Creative Commons Attribution (CC BY) license (https://creativecommons.org/licenses/by/4.0/).
Share and Cite
Bin, L.; Abbas, R.; Shahzad, M.; Safdar, N. Probabilistic Load Flow Analysis Using Nonparametric Distribution. Sustainability 2024, 16, 240. https://doi.org/10.3390/su16010240
Bin L, Abbas R, Shahzad M, Safdar N. Probabilistic Load Flow Analysis Using Nonparametric Distribution. Sustainability. 2024; 16(1):240. https://doi.org/10.3390/su16010240
Chicago/Turabian StyleBin, Li, Rashana Abbas, Muhammad Shahzad, and Nouman Safdar. 2024. "Probabilistic Load Flow Analysis Using Nonparametric Distribution" Sustainability 16, no. 1: 240. https://doi.org/10.3390/su16010240
APA StyleBin, L., Abbas, R., Shahzad, M., & Safdar, N. (2024). Probabilistic Load Flow Analysis Using Nonparametric Distribution. Sustainability, 16(1), 240. https://doi.org/10.3390/su16010240