Abstract
Research interest in business model innovation (BMI) has increased in highly competitive environments. However, there has been a relative lack of empirical case studies on how companies have built continuous BMI for sustainable success and growth in today’s complex technology and volatile customer environments. We adopted the “BMI Customer–Resource (CR) matrix” framework by focusing on the customer and resource as the critical determinants of sustained BMI success in technology companies. The first finding of this paper is to develop and expand a conceptual framework for analyzing the sustainable growth and success of leading technology companies. By examining Google’s 14 BMs with the CR-matrix, we derived five propositions about the success conditions for sustained BMI. We compared them to existing research on Amazon.com, finding four similarities and three differences. We also made an empirical contribution that reveals that conducting BMs while appropriately exploring and leveraging new or existing customers and resources can affect a company’s sustainable success.
1. Introduction
The scope of innovation continuously expands in the current business environment with increasingly fast technological changes. Therefore, securing a sustainable competitive advantage in an uncertain business environment represents the most crucial topic of strategic management [1]. In particular, competition among existing market participants and threats from new entrants are intensifying, continually requiring innovative strategies. Therefore, the literature has often mentioned innovation as one of the strategies that a company can adopt in a market environment characterized by strong competition, rapid change, and high uncertainty [2]. Corporate innovation has been studied in various fields, focusing on the product, process, organization, technology, and market. A tendency to view overall innovation as a business model innovation (BMI) has emerged [2,3].
Based on previous research, we operationally define a business model (BM) as a model representing the tangible and intangible value that a company provides to the market or a flow of goods and profit, as well as the behavior in which values or goods in the value chain are reformed. According to this logic, BM becomes a form or framework of business. Karimi and Walter (2016) claimed that BMI involves replacing the existing BM with a new product or service [4]. Teece (2010) argued that connecting BM with a company’s business strategy, innovation, and economic theory is necessary [5]. Although every company has a BM, business innovators organize and interact with customers and suppliers in new ways through effective BMIs, thus changing the entire industry (for example, Apple) [6]. Therefore, BMI positively impacts a company’s long-term performance, and BMI is more successful than other innovation strategies [7,8].
When a company implements a BMI, it can be categorized into two types: that experienced once or twice since its inception and that attempted more frequently [4,5]. In the former case, the company has a relatively stable BM, and the environment does not change much. In contrast, in the latter case, the company must continuously build a new BM to secure its sustainable growth over a long period in the face of rapid environmental changes and competition [6]. This paper focuses on the latter case, which we call continuous BMI, that requires continuous innovations to transform BM in the rapid environmental change and is significantly improved for long-term sustainable competitiveness and the growth of the companies [9].
Traditional manufacturing-centric BM takes products as the foundation of the business and aligns the firm’s core value with creating value-added products. The emergence of innovative technologies disrupts traditional business models, breaking down rigid business boundaries and requiring evolution into new business ecosystems where different actors in the market can collaborate [10,11]. The emergence and proliferation of digital technologies, especially since the end of the 20th century, enables and sometimes forces traditional companies to innovate in new ways by reorganizing internal resources and capabilities and increasing connectivity between entire industries, including suppliers and complementaries [12,13,14]. The continuity and sustainability of BMI are even more important for digital technology companies because digital technologies change rapidly and complexly, along with uncertain and volatile customer experiences [13]. Therefore, even in the manufacturing-centric BM era, continuous BMI enabled companies to sustain competitiveness in the business ecosystem. Still, in the digital era, the magnitude and complexity of business environment change further emphasize the importance of continuous BMI for the sustainable growth of companies [15].
BMI is becoming increasingly important in corporate strategy, but it is still unclear how BMI strategies can be successfully implemented in real-world industrial settings. Therefore, there is a need for empirical research on how companies deploy BMI in complex and rapidly changing environments. Jung and Lee (2021) proposed the BMI CR-matrix, which categorizes four groups from customer and resource perspectives [16]. In a volatile and uncertain environment, leading technology companies strive to innovate their BMs to expand existing customers or acquire new ones [13]. They focus on leveraging internal resources or acquiring external resources to support new technology-based BMs for sustainable success [17]. Therefore, this paper applied the BMI CR-matrix as a conceptual framework to analyze the sustainable growth of leading digital technology companies. We also conducted a case study on Google LLC via the lens of the BMI CR-matrix. This leading digital technology company has been conducting continuous BMIs since its founding in 1998, launching new BMs continuously over the past 25 years and growing into a global leader in internet-related businesses.
This paper is organized as follows. Section 2 summarizes extant research on BMI and BMI typology. Section 3 introduces the research methodology, case studies, and content analysis of case documents. Section 4 introduces the research framework of the BMI CR-matrix. Section 5 describes an empirical case study by applying the BMI CR-matrix to 14 BMs of Google and drawing five propositions and the similarities and differences between Google and Amazon.com. Finally, Section 6 summarizes the contribution, presents its implications, and discusses its limitations along with directions for future research.
2. Theoretical Background
2.1. Business Model Innovation
Companies have recognized innovation as a mainstream strategy and used various innovations. However, there has been increasing criticism of the effectiveness of innovation due to the high R&D investment, along with market uncertainty. The literature has argued that technological innovation for some products or services no longer guarantees sustainable business success. Thus, companies must combine product development with a good BM, like Apple’s iPod and iTunes [18]. As competition intensifies and globalization progresses, continuous and sustainable BMI becomes more important than good static BMs [19].
Research related to BMI examines the definition or elements of BMI [20]. For instant, BMI has been defined as the reorganization of the components of the BM [21], the reconfiguration of the current BM [20], the creation of a new BM [22], and the method by which companies create new values [8]. Furthermore, BMI represents a company’s response to the changes required in the sources of value creation, and gives the company the right opportunities [23].
Companies can create new customer value through BMI. For example, BMI can create value by innovating in an existing market with an existing product by leveraging existing resources and capabilities [8]. Moreover, BMI can help companies occupy the forefront of emerging technologies, laying the groundwork for long-term sustainable competitive advantage [24]. BMI can also help companies obtain new market resources and find new growth engines [25]. Although companies commercialize new ideas or technologies through BMs, certain BMI obstacles exist, such as conflicts with existing assets or current BMs. Organizational management is needed to lead processes or change successfully to overcome the obstacles [26]. Furthermore, when digital technologies bring new market opportunities with uncertain obstacles, they are often unfamiliar to existing companies and customers. Therefore, it is challenging for companies to overcome uncertainty while simultaneously achieving survival and growth through BMI in the high-tech area [27].
As BM innovators have higher profits than product, service, market, and process innovators [19], BMI is becoming more important due to competition and globalization. Therefore, we insist that BMI is key to companies’ long-term success. However, most executives have only considered disruptive changes and have little idea how to articulate the current BM and innovate continuously in the desired direction [19]. Research continues to explore the importance of BMI and the need for its application in sustainable business management amidst rapid technological changes with uncertain customer environments [28]. As competition intensifies and globalizes, continuous BMI becomes increasingly critical to companies and faces technical and marketing challenges [19]. In particular, aligning new opportunities for technology-based companies to capture new markets is part of BMI and critical to transforming sustainable value creation [17].
2.2. BMI Typology
Many studies have classified BMI using specific criteria and examined characteristics according to BMI types. A company can discover commonalities or differences through typologies from the various BMIs. Then, they find a more effective way to execute BMI. Verhoeven and Johnson (2017) studied the BMI portfolio strategy [23]. They suggested that strategic plans for BMI could be categorized into four types based on “user/market” and “product”. Foss and Saebi (2017) proposed that BMI should be divided into four types based on “novelty” and “scope” [28]. Taran et al. (2015) explained the three-dimensional BMI type based on three axes: “radicality”, “complexity”, and “reach” [19]. The BMI Map of Floren and Agostini (2015) classifies Dell, Ryanair, Bayer, and Amazon.com into four types according to their “structures” and “activity levels” [4]. However, most BMI typology studies are not based on sufficient business cases. Thus, they cannot provide valid implications for BMI strategy in real-world business management.
Increasing research has recognized the importance and effectiveness of BMI [28,29]. Although BMI is crucial for corporate growth and long-term viability, BMI research has yet to become a mature field, unlike technological or product innovation. Also, there is a lack of sufficient empirical studies on this topic [30]. Therefore, there is a need for more BMI studies using empirical business cases [4]. This paper is in the same line of research as these critiques [19,21], suggesting that companies with increasing competition and volatile environments should embrace BMI as an essential corporate strategy to gain competitive advantage and achieve continuous and sustainable growth.
3. Methodology
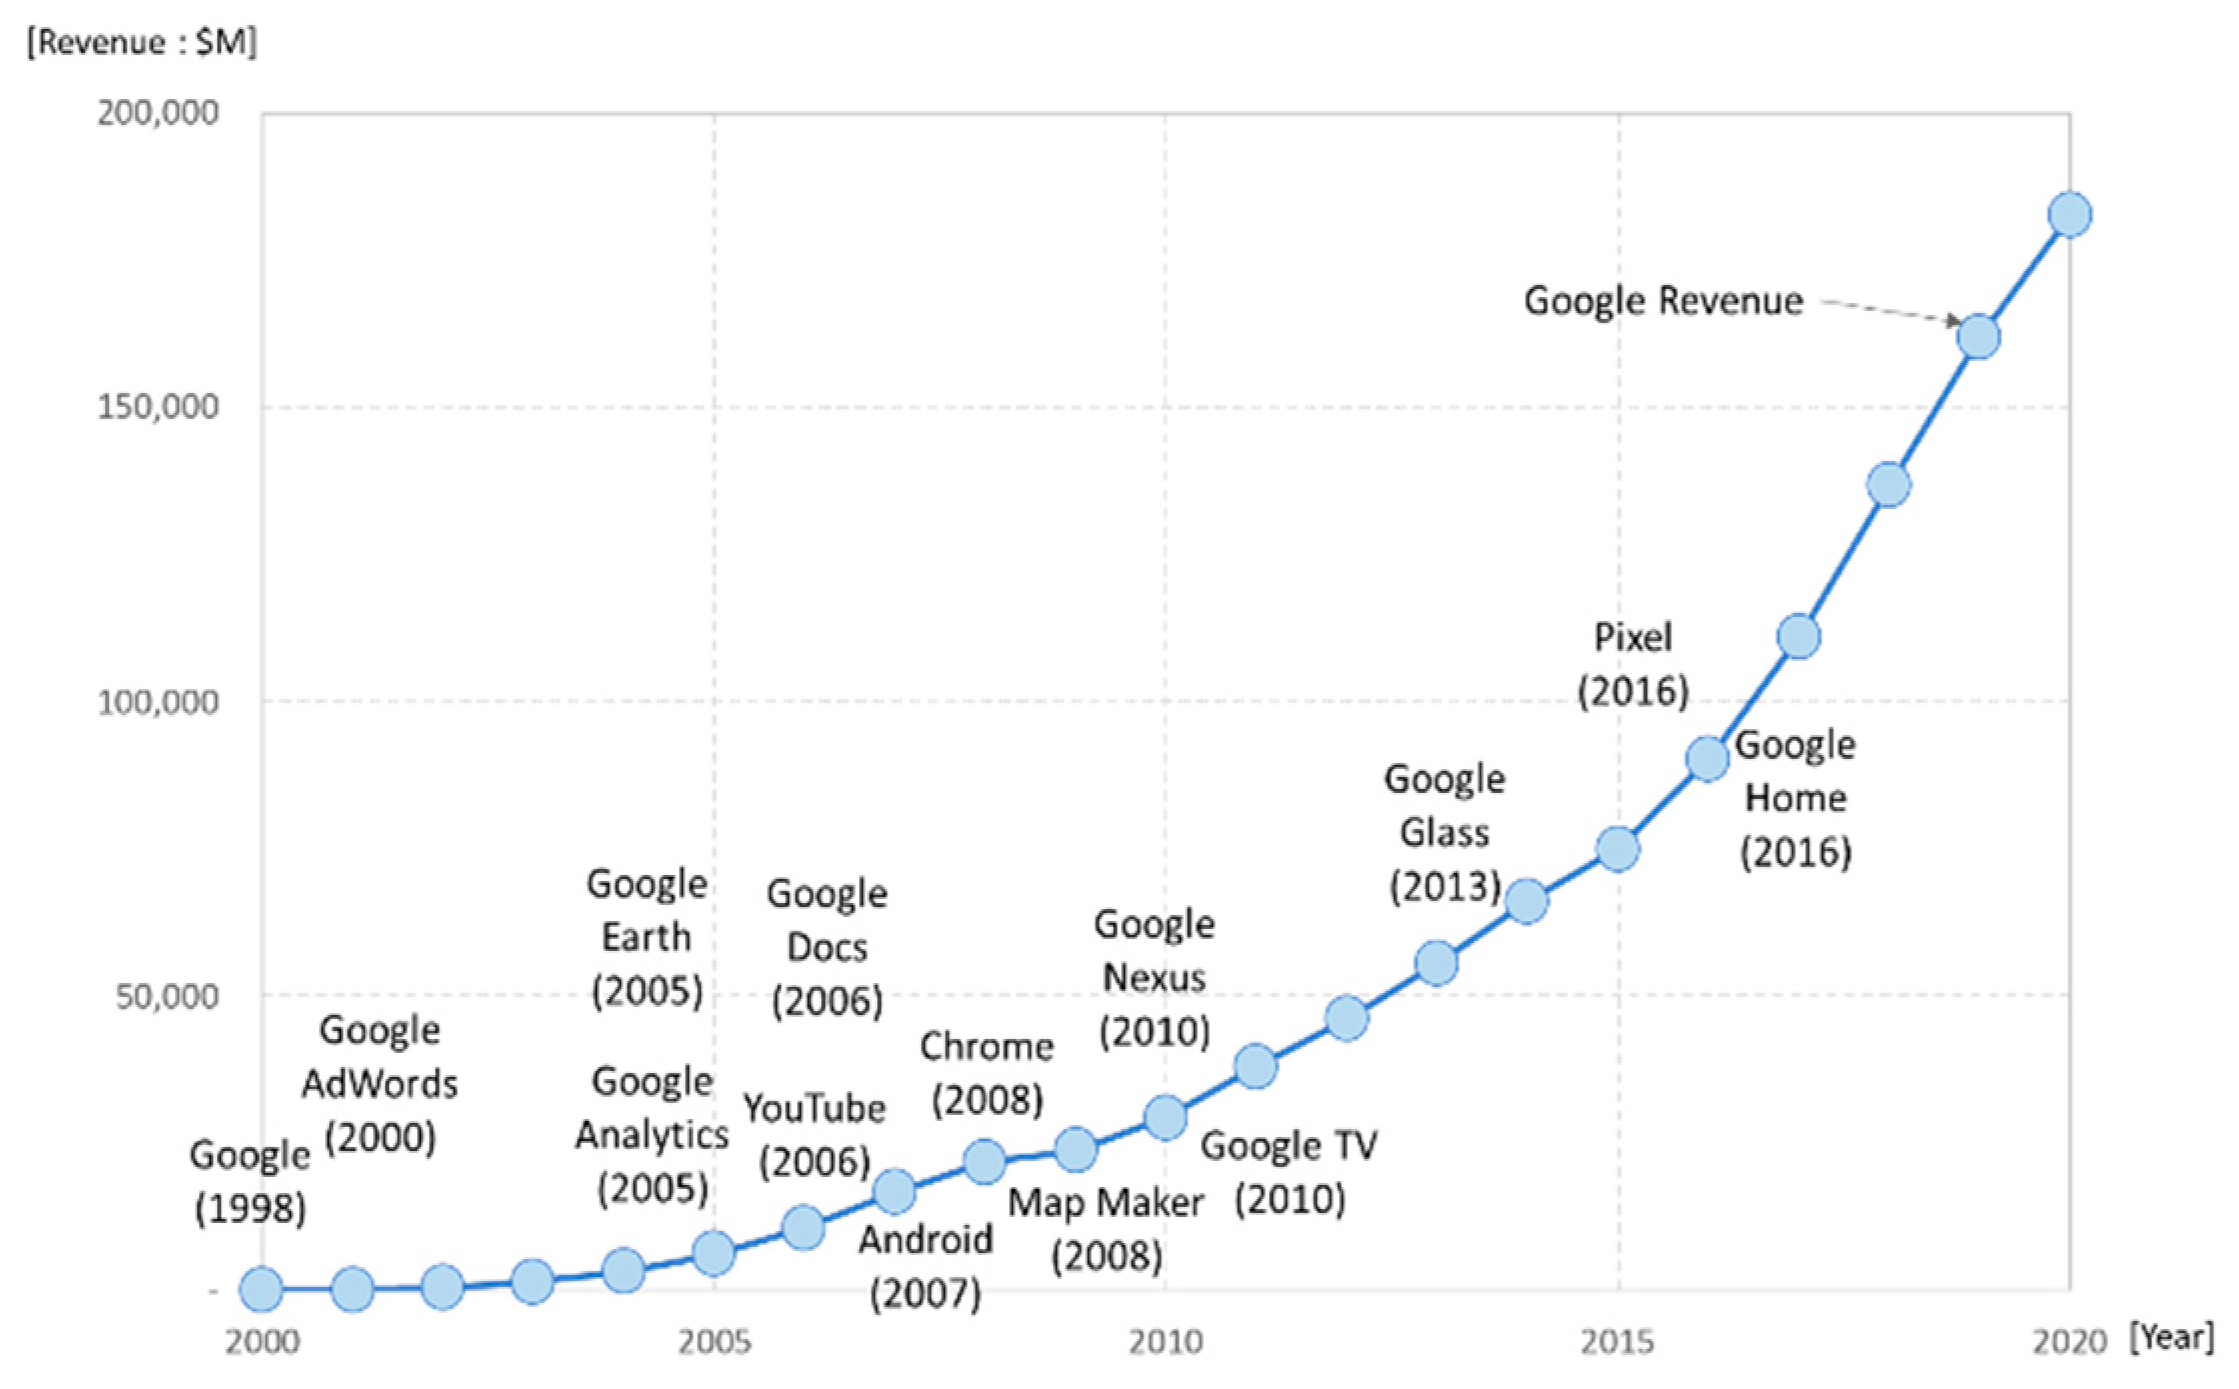
The research procedure is shown in Figure 1. Jung and Lee (2021) proposed the BMI CR-matrix as a strategic tool, analyzed 14 BMs of Amazon.com, and drew empirical propositions by observing the characteristics of each BM. Since this paper adopted the BMI CR-matrix research framework proposed by Jung and Lee (2021), in [Procedure 1] of Figure 1, we critically reviewed 64 research papers focusing on the BM and BMI of high-tech companies. This paper selected Google to conduct case studies, as shown in [Procedure 2], since it is a leading innovative technology company that has carried out many types of BMI in a highly competitive environment over the past 25 years. We then conducted a literature review of documents listed in Appendix A to find Google’s BMI cases. In [Procedure 3], we conducted a qualitative content analysis of documents on Google’s innovative BMs, using the name of the 14 Google BMs in Table 1 as search terms to collect relevant articles, magazines, media news, etc. and determine whether each BM was a new or existing BM from a customer/resource perspective and whether the outcome of the BMI was a success or failure. The results are listed in Appendix A. During the content analysis process, we cross-validated by checking the inter-coder reliability of two researchers. We investigated the features of Google BMI, put forward five propositions, and identified similarities and differences between Google and Amazon.com in [Procedure 4].
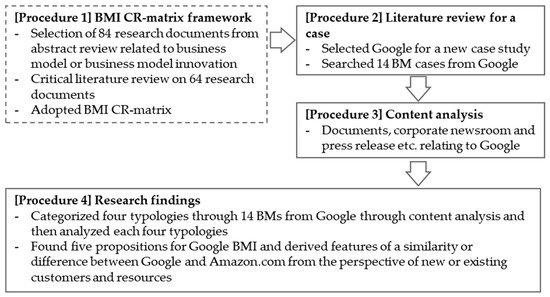
Figure 1.
Research procedure.

Table 1.
Google’s business models.
The content analysis in [Procedure 3] is a quantitative and qualitative research methodology that makes repetitive and valid inferences from text data. A content analysis could be biased due to the analysis of documents from limited databases created in the past [31]; recently, however, researchers have widely used content analysis for the quantitative analysis of the number of repetitions of specific words in mass media (such as newspapers and magazines), and for qualitative analysis wherein a document is deeply scrutinized and reinterpreted [31]. This paper applied a qualitative content analysis, as shown in [Procedure 3], to collect and analyze journals and articles related to Google. Moreover, this qualitative content analysis enabled an in-depth analysis of the context regarding the company’s capabilities and resources for executing a BMI and its results.
4. Research Framework: BMI CR-Matrix
This section details the BMI CR-matrix framework [16] and related studies for this paper. We analyzed the characteristics of technology-based businesses to reinterpret the emphasis of the BMI CR-matrix. Ansoff (1958) argued that a company should continue to grow and change, and suggested four strategies for the company’s “products” and “markets”, whether existing or new [32]. Verhoeven and Johnson (2017) proposed a BMI portfolio strategy based on changing the products and markets of Ansoff’s growth matrix to “product” and “user/market” [23]. They claimed that there is a need for continuous BM change and improvement, and that BMI value creation is required with a new BM [23]. This point helps scholars understand BMI, and managers implement BMI by suggesting strategic plans according to four categories when a company establishes a BMI portfolio strategy.
Jung and Lee (2021) applied “customer” and “resource” instead of the product and user/market used in Verhoeven and Johnson’s framework [16]. The BMI CR-matrix’s classification criteria and analysis perspective are described as follows. One axis, customer, is from the point of view of organizational management for sustainable business. Today’s organizational management must keep the benefits of technologies in a business environment that is dramatically changing and create new values via disruptive digital technologies to respond to specific and segmented customers [33]. The “user” in the BMI portfolio strategy generally refers to a customer located at the top of the value chain of business-to-consumer (B2C). However, user is not a suitable term for business-to-business (B2B). Thus, using the term, the user is limited in covering all business customers. Also, “market”, another term from Verhoeven and Johnson’s framework, is too broad as it refers to a business environment, which includes customers, competitors, and partners. On the other hand, those who buy products or services, whether in B2C or B2B markets, can be collectively referred to as customers [34]. Furthermore, customers are the top element of the value chain and the direct source of realizing corporate value.
The importance of “customer” has been the subject of BMI discussions in various studies. For example, Sjodin et al. (2020) argued that the effectiveness of BMI depends on three steps: defining value proposition, designing and leveraging value delivery, and collaborating with customers [35]. They also argued that customers are central to the business model framework [35]. Achieving organizational management focused on customer revenue creation through BMI can change a company’s BM [36,37]. Collaboration or value creation with customers produces more diverse effects than collaboration with suppliers or other companies [25]. In particular, customers are closely related to value creation and capture of BMs [37]. New BMs significantly impact performance by influencing the customers’ perceptions of the company’s and organization’s activities for sustainable business [30]. In recent years, the digital environment has facilitated interactions between customers and the exchange of information among various market participants. Customer segmentation and consumer personalization are naturally linked [38], requiring digital companies to radically change how they deal with customers [27]. Therefore, technology-based BMs further emphasize that companies must closely consider customer needs in a rapidly changing and complex environment [37]. Therefore, to study the sustainability and continuous growth of technology-based companies, we adopted the BMI CR-matrix, which emphasizes “customers” as one axis.
Meanwhile, “product”, another axis from Verhoeven and Johnson’s framework, results from corporate activity. A product combines ideas, production methods, and performance levels from the company’s technologies and capabilities [39]. However, we claimed that resource is more helpful than product when conducting technology-based BMI, since the product is the output of BMI, but the resource is a source for BMI. For example, technology, one of the most important resources in the high-tech era, is required in the current business environment, with its rapid technology change and uncertain market situations. Other resources, such as intellectual rights and innovation capability, also contribute to securing advanced technology in the market [40]. Resource then is one of the critical sources to fulfilling a company’s business innovation and competitive advantage in the digital era.
According to the resource-based view, a company’s competitive advantage is determined by its resources [41]. Thus, resource differences within a company could explain differences in competitiveness within its industry [42]. Furthermore, resource-based competitiveness is sustainable, meaning that if strategic resources are effectively distributed within a company, these differences can form the basis of a company’s sustainable competitive advantage [1]. Efficient resource utilization is also important for conducting BMI because companies have limited resources [43]. The new BM resulting from BMI can be measured by the performance achieved by effectively utilizing resources [36]. Resources are among the drivers of changes and development in BM [44], and play an important role in value creation that needs to be innovated when conducting BMI [45]. Therefore, resources have been viewed as the main actors in creating and executing BMI value, a company’s unique competitive advantage. In addition, digital technology companies need to have strategic flexibility regarding resources to adapt to the changing external environment to overcome crises and survive [41]. The BMI CR-matrix adopted resources as another axis [16]. Therefore, this paper reaffirms the validity of adopting the BMI CR matrix as a research framework emphasizing resources and customers as the most important BMI considerations.
The BMI CR-matrix has two axes, customer and resource, which can be classified into existing or new. For the first axis, BMI is characterized by accessing new customer groups or expanding existing customer bases [46]. As a starting point for continuous and sustainable growth through BMI, it targets the unmet needs of existing or new customers [47]. Companies must change their business activities for new customers to manage BMI successfully [48]. Organizational management to catch new or existing customers is required for business sustainability.
For the second axis, since a company has resource constraints, it must perform different BMI strategies [43]. How resources should be allocated, and sustainable competitiveness could be secured if the resource already exists [28]. Otherwise, new resources require strategic approaches such as developing internal investments or utilizing external resources such as M&A, partnerships, and open innovation [1,28,34]. If a company formulates new technology and develops innovative products, the management should know the nature of resource investment and the resulting performance impact on business sustainability [49]. When conducting BMI, the preparation and execution strategy differs depending on whether resources or customers are secured. BMI attempts to create value by driving resources, thus affecting a company’s performance [37]. BMI leads technology and innovation for sustainable growth.
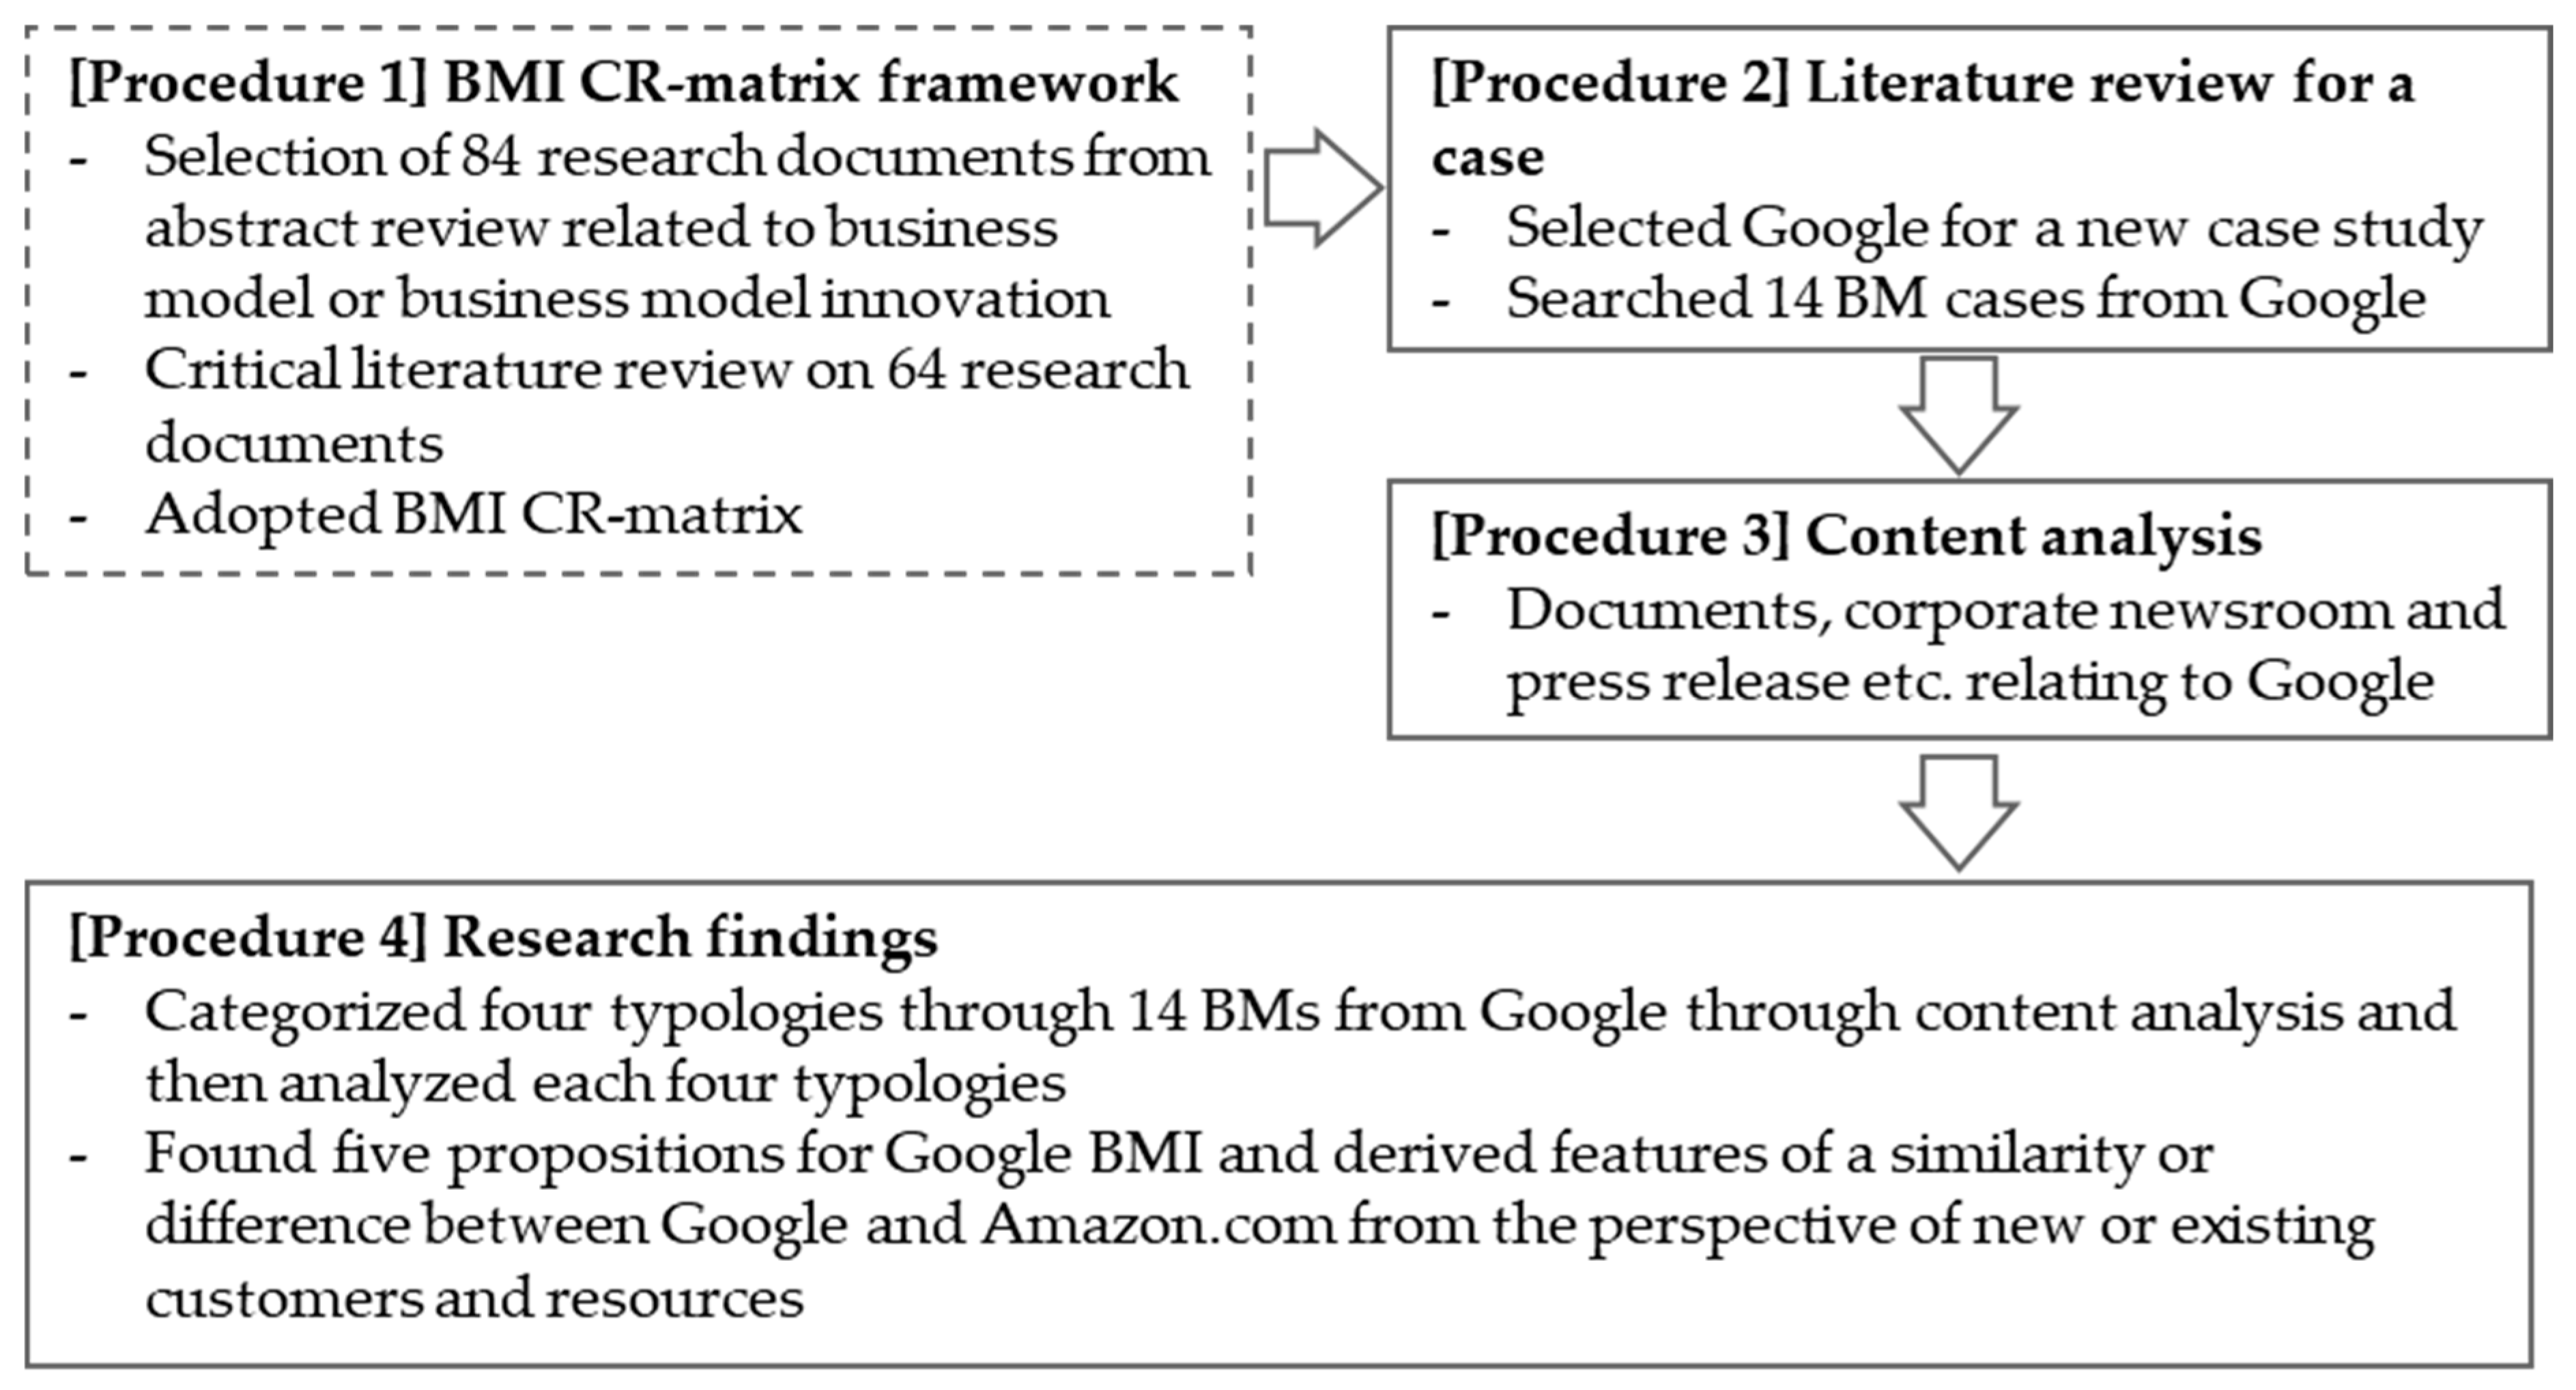
As shown in Figure 2, the BMI CR-matrix classifies BMIs into four groups (EC-ER, EC-NR, NC-ER, and NC-NR) based on whether customers and resources have already been secured or need to be acquired, where EC-NR stands for BMIs based on existing customers (EC) and new resources (NR).
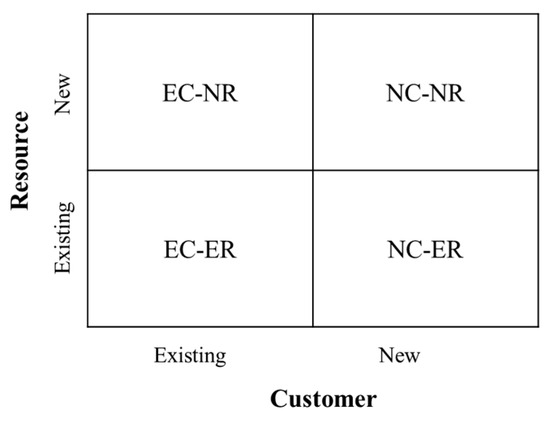
Figure 2.
BMI CR-matrix.
5. Case Study
We conducted two case studies: an investigation of Google’s BMI characteristics and a comparative study with Amazon.com, which was conducted earlier. BMI research must learn how two leading global companies in today’s digital technology-based businesses have achieved sustainable success through continuous BMI. Google and Amazon.com have continuously innovated their BMs since their founding in 1998 and 1994, respectively, in the U.S. The reason for comparing these two companies is that they have similar environmental factors that affect their BMI, such as market conditions and social situations.
5.1. Google
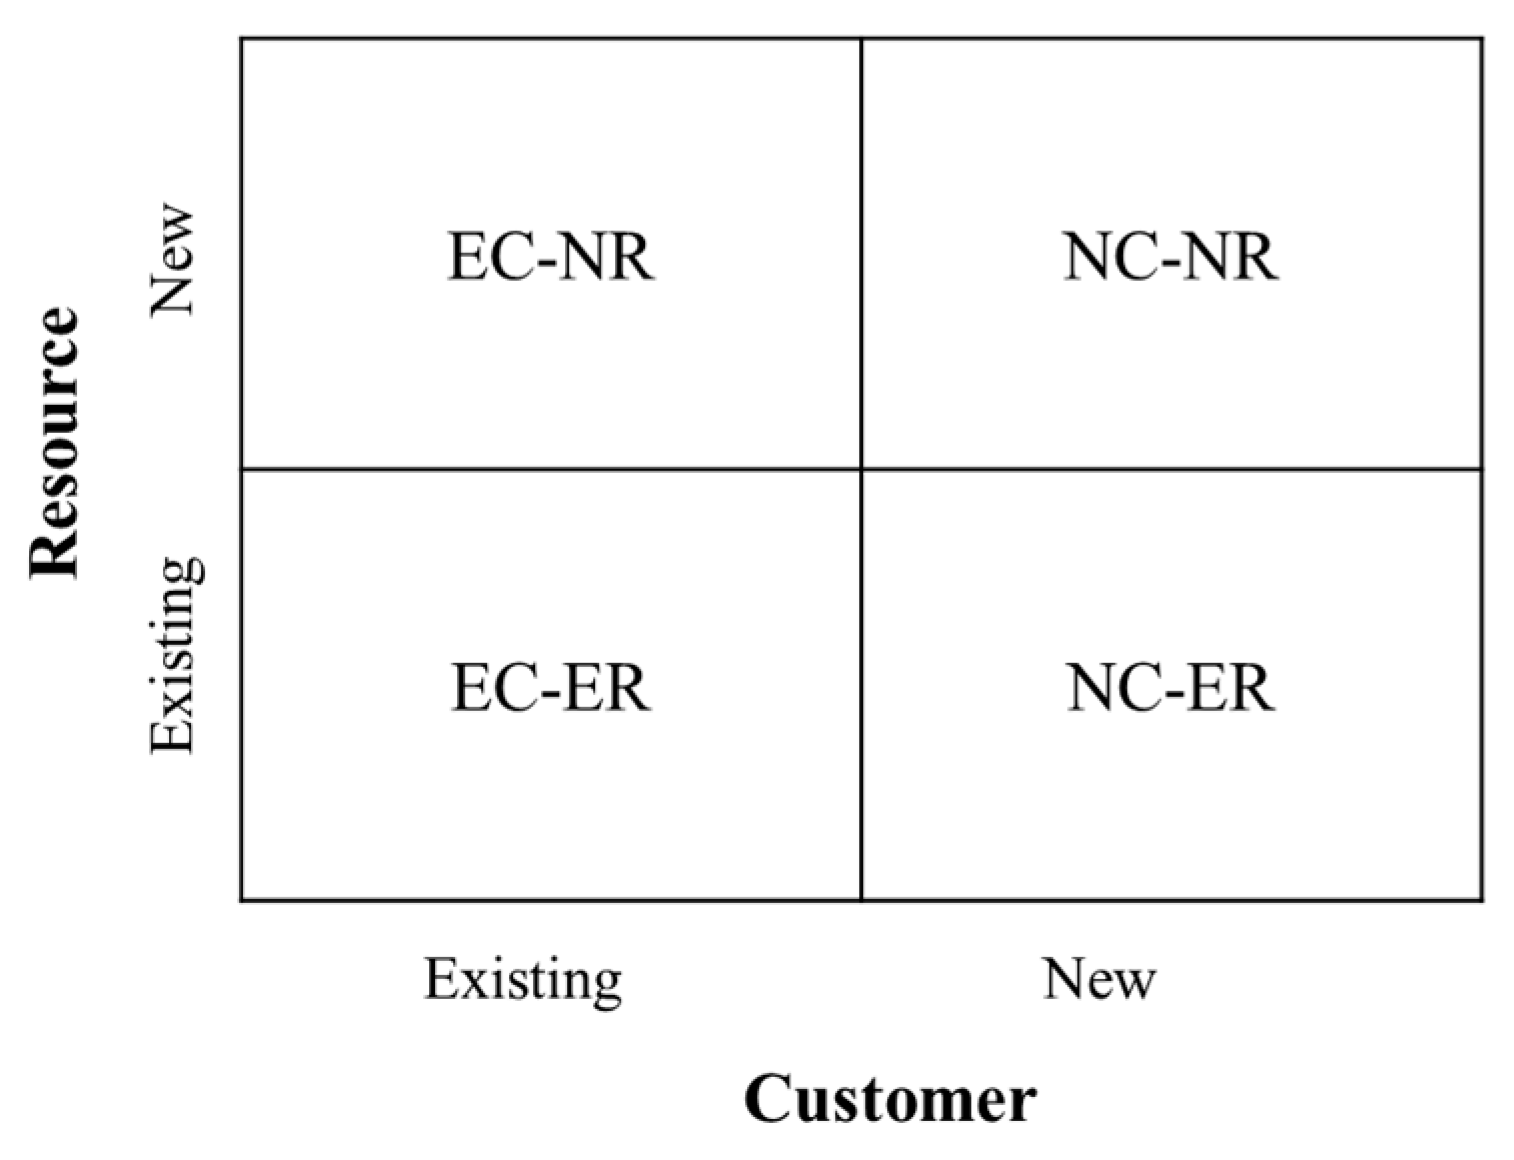
Google LLC was established in 1998 as a provider of Internet search services. It recorded sales of about USD 182.5 billion in 2020 and ranked fourth in global brand rankings in 2021 [50]. It has achieved continuous and sustainable growth since 2000, as shown in Figure 3. In 2000, it had a USD 15 million operating profit deficit with USD 19 million in sales. However, it grew 1500 times over the next ten years to USD 29.3 billion in 2010, and nearly 4.8 times from 2011 to 2020 [51]. Google, arguably the most successful example of an innovative digital technology company, has achieved sustainable growth by introducing a variety of new BMs through continuous BMI, as shown in Figure 1.
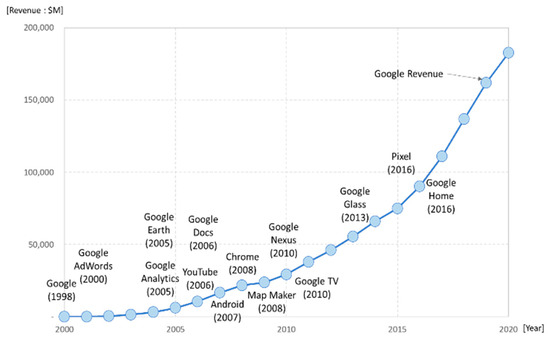
Figure 3.
Revenue and BMs of Google.
In the literature, Google has mainly been investigated in specific BMs, such as Google Earth Engine, as an example of creative corporate culture [52] or compared to other technology companies such as Apple, Amazon.com, and Facebook [53]. Previous studies have focused on the technological innovation of the system as an e-commerce company [54]. There are relatively few studies on BMs or BMIs within Google. Thus, this paper examined the characteristics of Google’s BMIs from Google’s annual reports, related websites, and extant research articles in academic journals. The 14 new product or service BMs derived from BMIs conducted by Google at the enterprise or business unit level analyzed in this paper are shown in Table 1. In the selection process, we only targeted BMs released before 2017 because this was expected to leave enough time to determine whether each BM could contribute to corporate sustainable performance. Some discontinued BMs were also selected because the scope of this paper might be limited to successful BMs when only currently operating BMs were chosen.
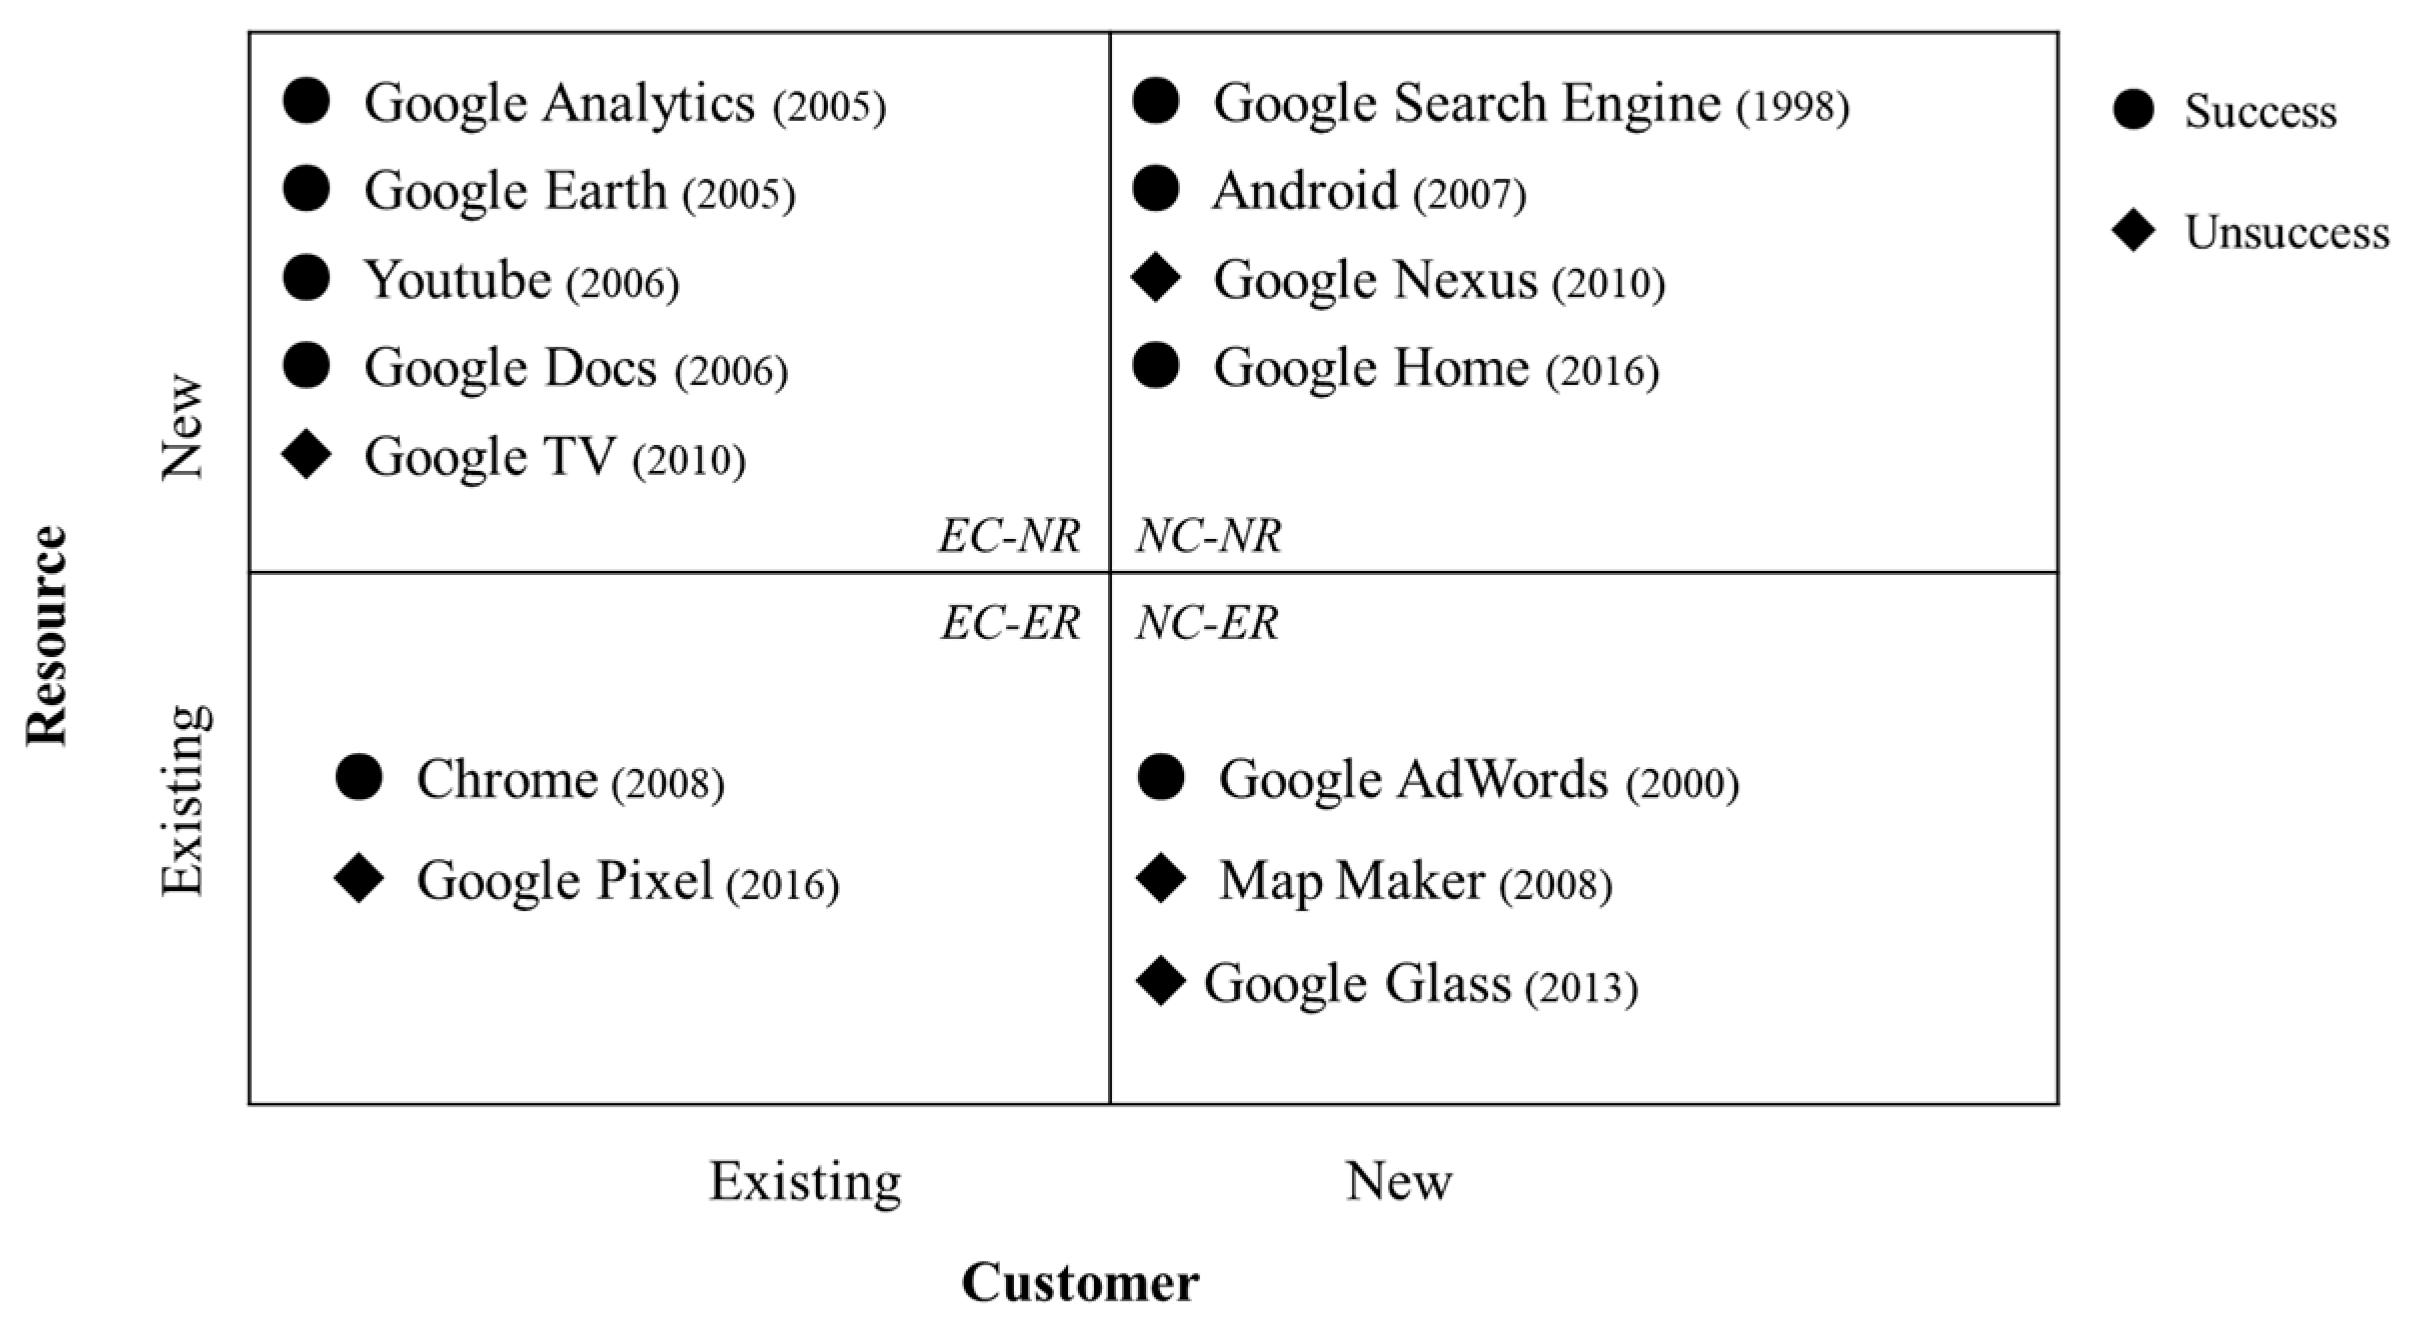
As schematized in Figure 4, Google’s new products and services, which were the results of the BMI, were analyzed through content analysis based on the document data presented in Appendix A. Each BM was plotted in the BMI CR-matrix with a judgment of success or failure. To achieve sustainable competitiveness and growth for the corresponding Google business unit, we judged success only whether a new BM from a BMI contributed to its financial performance, improved customer satisfaction, created meaningful new assets, or achieved measurable growth [55]. Our success/failure judgment was based on our content analysis documents: academic articles, media reports, and company documents. For example, Google AdWords was judged as a success based on the contents of “Online Advertising Pioneer” and “Tremendous Success” in the content analysis results. The content analysis results of each Google BM are summarized in Table 2.

Figure 4.
Google’s BMI CR-matrix.
Table 2.
Google business model innovation: content analysis from the perspectives of customer, resource, and result.
5.2. BMI CR-Matrix for Google
In this section, five propositions are derived. In each proposition, we discuss how each BMI developed from customer and resource perspectives and whether it successfully used the BMI CR-matrix framework. The five propositions can be used to get significance on creating a successful BMI by utilizing customers or resources in running a digital company over a long-term period.
5.2.1. BMI Leveraging New Resources at Google: NR Groups
Proposition 1.
Google has many BMIs based on new resources utilizing mergers and acquisitions (M&As) with a relatively high success rate
This proposition investigated BMIs in new resource groups (EC-NR and NC-NR). Resources, which comprise essential roles in value creation [45], serve as driving forces of BMI for the high-tech industry [44]. Nine out of the fourteen BMIs were found in EC-NR and NC-NR groups. The success rate of BMI with new resources (seven out of nine cases) was better than that of BMI using existing resources (two out of five cases). We also found that when Google needed new resources, it secured most of them through mergers and acquisitions. The only exception was Google TV, for which Google partnered with other companies.
Of the four BMs, Google Search Engine, Android, Google Nexus, and Google Home, in the NC-NR group, all were considered successful except for Google Nexus. Google Search Engine was the first BM in 1998. It had to exploit the partnership’s resources since Google had few existing resources at the start-up stage. For the other BMIs in this NC-NR group, Google secured all necessary capabilities through M&A. The EC-NR group had five BMs: Google Analytics, Google Earth, YouTube, Google Docs, and Google TV. Of them, only Google TV was unsuccessful. Google TV exploited outsourced partners’ resources instead of utilizing M&As. A BMI using new resources for existing customers is the most vigorous BMI and is recorded as Google’s best success rate.
Through this proposition regarding BMIs based on new resources, we conclude that Google has attempted many BMIs based on new resources for new high-tech products or services, most of which utilize M&A. In two exceptional cases, it introduced partnerships for outsourcing resources.
5.2.2. BMI Exploiting Existing Resources at Google: ER Group
Proposition 2.
Google has a relatively small number of BMIs with existing resources, with its success depending on how effectively it utilizes existing resources.
In the literature, existing resources can be leveraged to achieve success if they provide clear advantages for competition and values to customers [56,57]. Google has five BMs based on existing resources, with two targeting existing customers (EC-ER) and three targeting new customers (NC-ER). However, only two cases succeeded, while three did not.
Chrome is currently the most commonly used web browser worldwide, providing value as free software. It has successfully attracted existing Google Search Engine customers. Google Pixel was released in 2016 by combining the hardware technology already owned by Google. Google continues to release Pixel products aimed at existing customers who are highly loyal to Google. However, its sales performance is still low due to customers’ preference for competing products such as Apple iPhones and Samsung Galaxy phones.
Google AdWords, released in 2000, was an online advertising program implemented on top of an open-source database engine. It was recognized as a pioneer in online advertising as a BM that targeted advertisers’ new customers rather than existing Google search services. Meanwhile, Map Maker, released in 2008 and discontinued in 2017, allowed users to upload map information in areas where map services were unavailable from the government, such as India and Korea. It suspended service to targeted customers in a limited market. Google Glass, a wearable device adopting new technology developed by the Google X team in 2013, was another unsuccessful case. Google Glass failed to expand the market using existing resources. Thus, Google discontinued it in 2017 and moved it to an enterprise solution.
BMI with existing resources showed a success rate of less than half. This low success rate means that BMI would be difficult to succeed if a new BM for a technology-oriented product or service cannot effectively utilize existing resources. On the other hand, BMI will succeed if it effectively provides value using existing resources such as Chrome and Google AdWords.
5.2.3. BMI for New Customers at Google: NC Groups
Proposition 3.
Google’s new customer-based BMI has provided various results, with its success depending on how well it creates the right value for its new customers.
The success rate targeting new customers was slightly greater than half of the seven cases investigated in the NC-ER and NC-NR groups; Google Search Engine, Android, Google Home, and Google AdWords succeeded, while Google Nexus, Map Maker, and Google Glass did not. Google Search Engine made a loss in profit from its establishment until 2001 when Eric Schmidt, who had been hired as the new CEO, introduced a new service, advertising, as a new revenue model, and turned a profit. Android occupied 67.5% of the smartphone OS market in 2021 by freely opening for mobile device developers. After the introduction of Android, Google has expanded its customers from web users to more expandible mobile customers. Google Search Engine and Android were new customer-based BMIs. The service was provided free of charge by securing other revenue models. Google Home is a voice-recognition smart speaker. It was launched for new customers by securing resources through the acquisitions of Nest and Dropcam in 2014. Google Home’s sales remain strong at second place in the market, behind Amazon.com’s Echo. Finally, Google AdWords made advertising services more affordable by allowing new customers to pay for click-based advertising.
On the other hand, Google Nexus attempted to expand its business in hardware such as smartphones and tablet PCs. Although it was released on consignment with Taiwanese manufacturer HTC, it failed to bring the customers of Apple’s iPhone and other Android-based mobile phones to Google Nexus. Google Glass is a brand of smart glasses with the most innovative technologies of that time. It attracted some early adopters. However, it did not succeed in expanding beyond early adopters.
The performance in the NC-ER and NC-NR groups showed different results according to the BMI cases. Generally speaking, Google achieved successful BMIs by changing its revenue model, securing a different profit model, or providing free services to new customers. However, its BMIs failed when it could not create value for new customers.
5.2.4. BMI for Existing Customers at Google: EC Groups
Proposition 4.
Google’s BMIs based on existing customers led to successful results unless it started too late.
The literature has stated that the success of targeting existing customers is evident in customer-based benefits that are secured by the network or lock-in effects [58]. Therefore, leveraging existing customers when performing new BMI is generally safe and effective. Among the fourteen BMs examined, Google targeted seven BMs to existing customers. The number of BMs was the same as that of new customers. However, compared to the success of four out of seven BMs targeting new customers, five out of seven targeting existing customers succeeded. There was no significant difference in the success rate.
The five successful BMs among seven BMs targeting existing customers are analyzed as follows. Google Analytics primarily targeted AdWords’ existing customers of Google’s online advertising platform successfully. Google Earth aimed to provide free guidance for existing customers exploiting Google’s search engine. YouTube allows existing customers to develop and share content and provide a wider customer experience [59]. Google Docs introduced office products with an online document editing function to existing customers. At launch, Google announced that Google Docs targeted value creation for online-ready institutions. It then successfully expanded to personal customers. Lastly, Chrome was a freeware web browser that attracted existing customers using Google’s search engine.
Among the seven BMs targeting existing customers, two BMs were unsuccessful. First, Google TV tried to expand its app service using new resources and targeting existing customers, which had previously been solely implemented on the Web. However, the result was unsuccessful because it was not easy to penetrate the already competitive market. On the other hand, Google Pixel was a mobile product using existing resources directly after discontinuing the Google Nexus in 2013. Google Pixel was also unsuccessful because of its strong incumbent competitors, Apple, Samsung, and Chinese fast followers, who already dominated the market.
From this proposition, we concluded that Google’s BMI could not succeed if the incumbent competitors could defend their existing customers. Companies can successfully change and operate BM through a learning approach by focusing on and iterating on a specific business model, which can enhance organizational capabilities [43]. Furthermore, a company conducting BM with its existing customer base must provide them with new experiences and value to be successful. For example, at the right time, Google provided new experiences to its existing search engine customers through Google Earth and YouTube services and increased value to online advertisers acquired through Google AdWords by extending Google Analytics.
5.2.5. Dynamic Aspects of the BMI CR-Matrix at Google
Proposition 5.
With changes in the business environment, BMI experienced by Google continues to affect future BMI changes and performance.
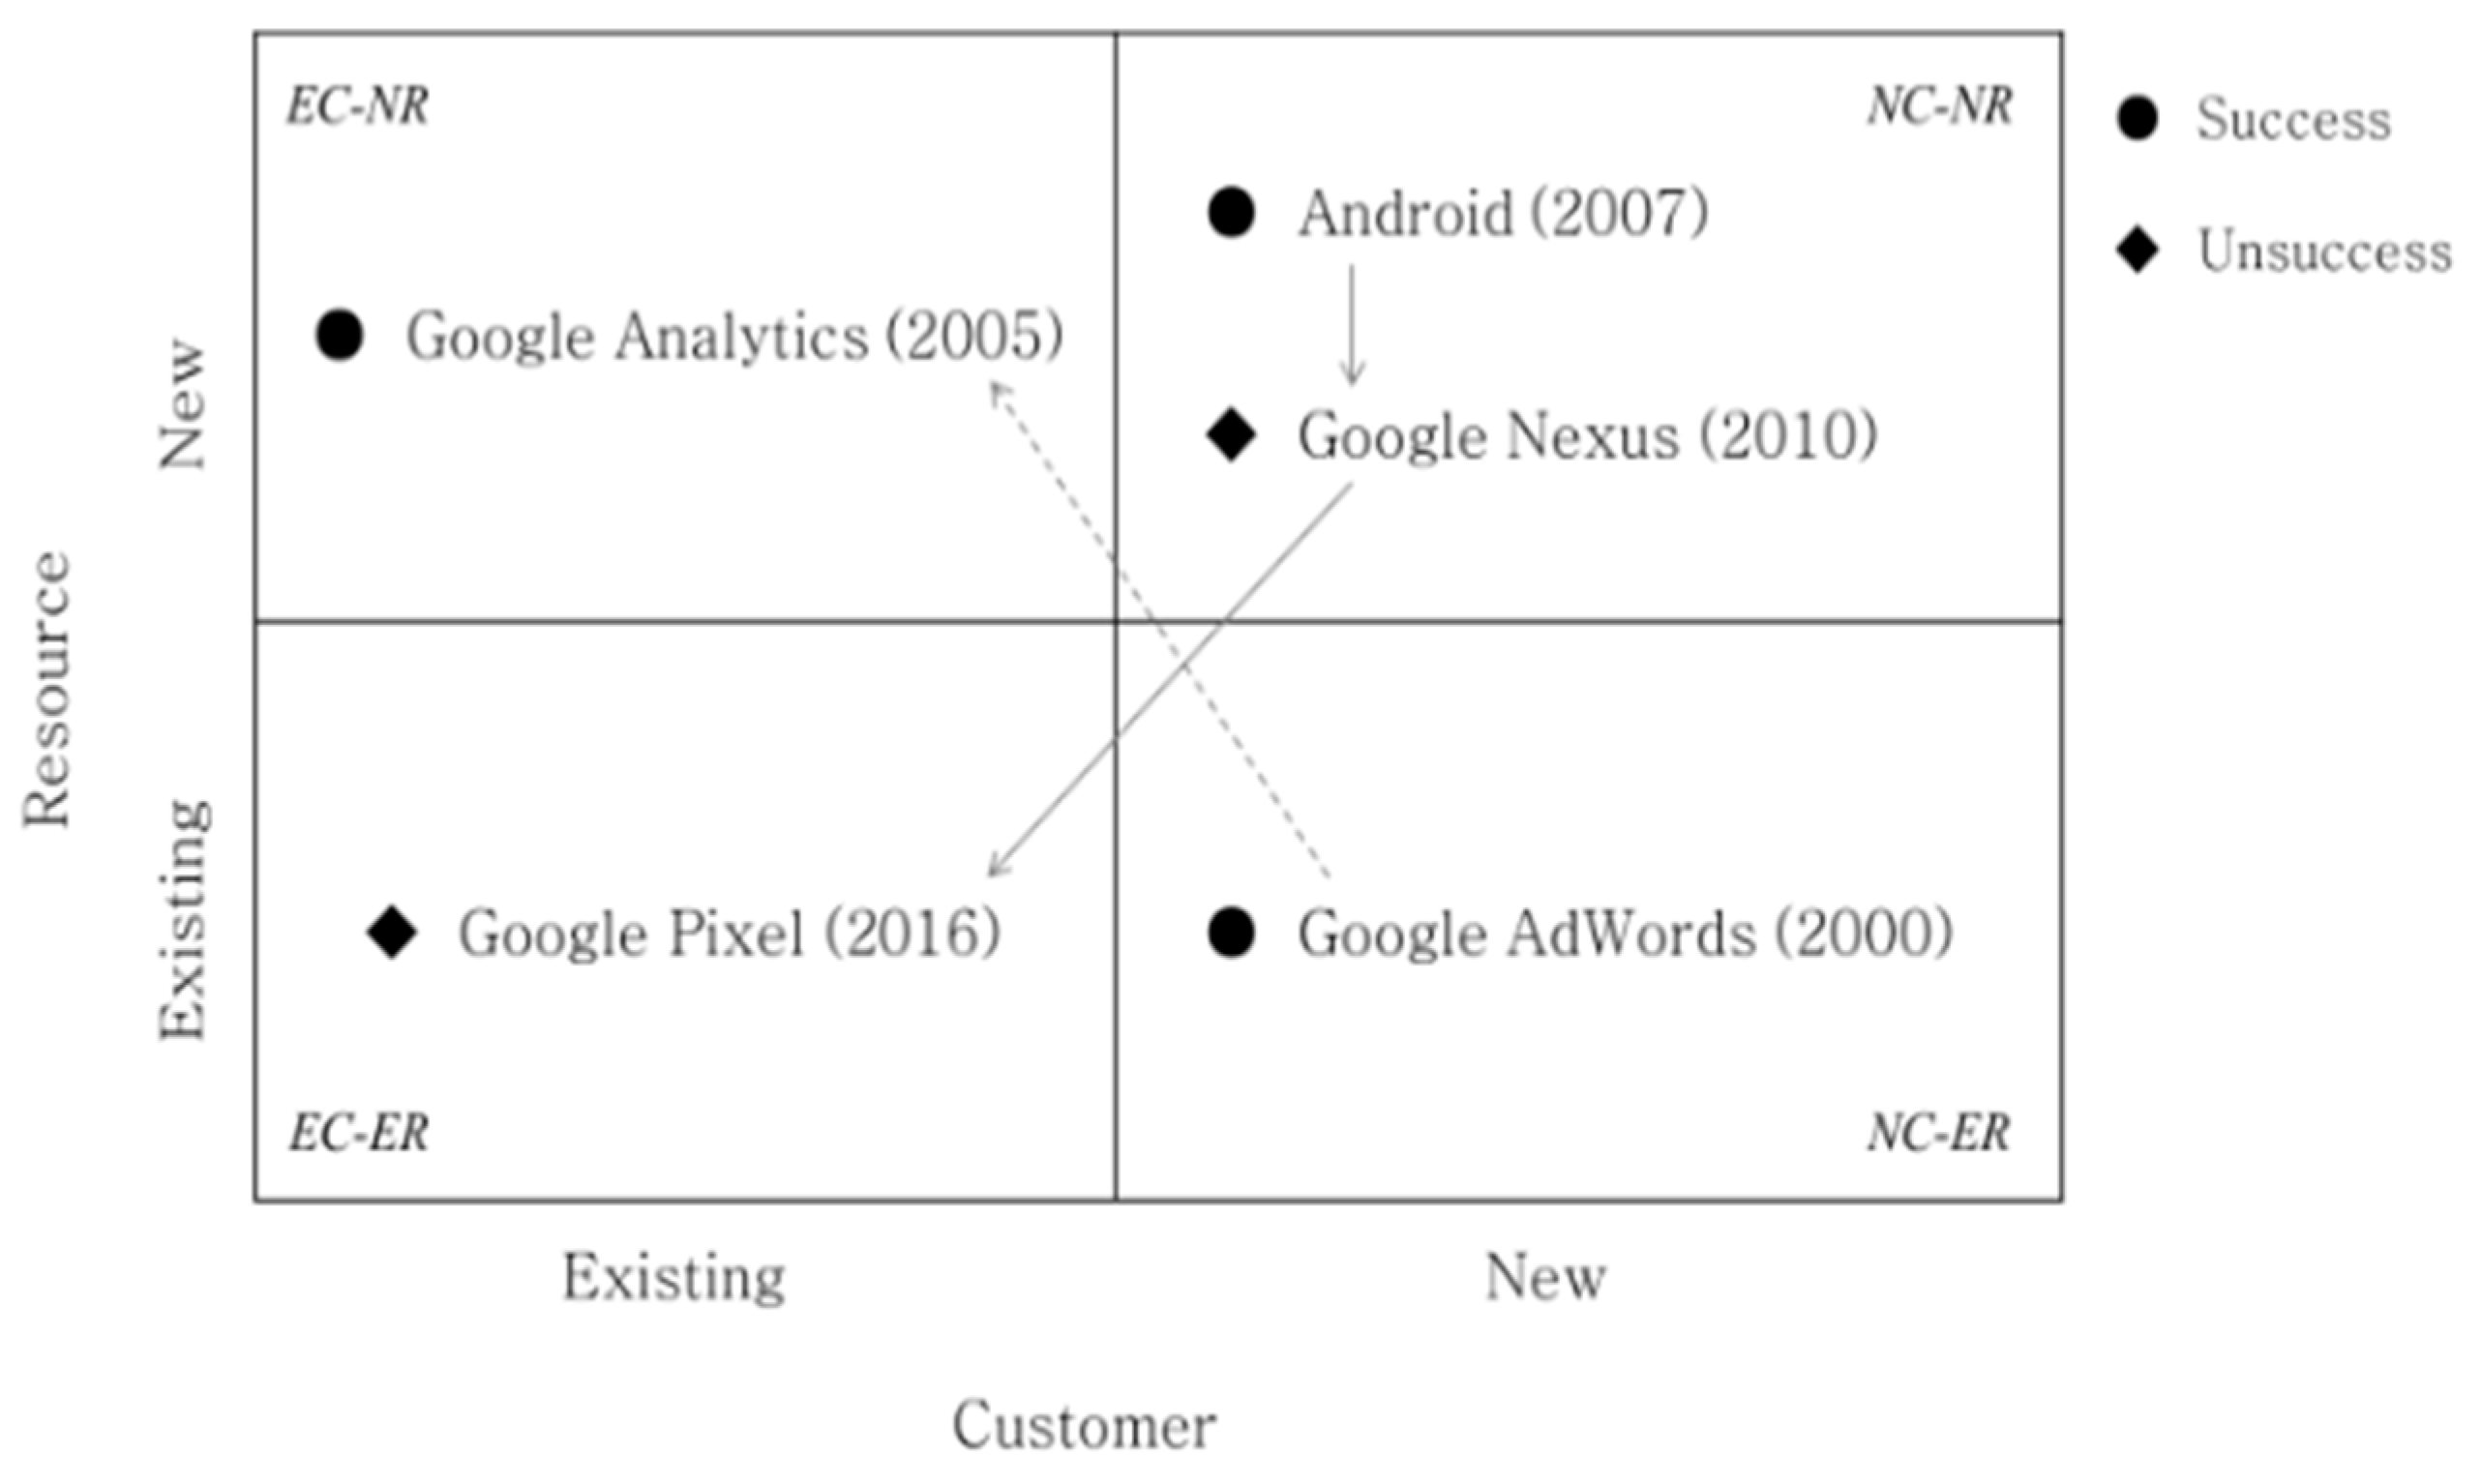
Until now, Google’s BMI has been examined from a cross-sectional perspective. However, this section will look at the dynamic aspects of the BMI CR-matrix. Google pursued sustainable growth as a BMI that responds to change, as shown in Figure 5, by moving the position of BM in the BMI CR-matrix according to environmental changes. Moving BM’s position here involves changing the combination of customers and resources, evolving to catch market demands. Concerning the dynamic perspective, the BMI typology moved within the BMI CR-matrix over time since new customers became existing customers, and new resources changed into existing ones as time went by.

Figure 5.
BMI Dynamics of Google.
This proposition shows that the BMI typology utilizes strategic moves considering previous capabilities and shortcomings. Android (2007) is a mobile operating system acquired by Google. Google attempted to extend its BM to smartphone hardware by launching a new phone called Google Nexus (2010) based on Android BM. Google Pixel (2016) was launched six years later based on Google Nexus. Looking at this from the BMI CR-matrix perspective, Google Pixel (2016), which originated in the EC-ER group, exploited resources secured for Google Nexus (2010) in the NC-NR group. Google Nexus and Google Pixel were developed by combining Android OS and hardware technology, even though the hardware business in Google’s performance was unsuccessful.
For a successful strategic movement example, in the EC-NR group, Google Analytics (2005) targeted new customers from existing Google AdWords (2000) customers in the NC-ER group. Google AdWords is a service program for online advertisers. Its users could use the web analysis service under their existing accounts through Google Analytics, released in November 2005. As a result, as of 2021, Google Analytics has a successful market share for traffic analysis tools of 56.7%. Strategic BMI dynamics demonstrate Google’s continuous efforts to integrate products and services based on a combination of sustainable resources and customers.
5.3. Comparison of BMI CR-Matrices for Google and Amazon.com
This section will analyze the similarities and differences between Google and Amazon.com through the BMI CR-matrix. These two companies have taken continuous and sustainable competitiveness in the current business environment, such as volatility, uncertainty, complexity, and ambiguity [60]. Both are now leaders among digital technology companies. Further, their establishment periods (Amazon.com in 1994 and Google in 1998) were similar to when dot.com companies were activated and digital transformation began. Therefore, their similarities and differences were investigated from the BMI CR-matrix perspective to find the characteristics and implications of BMI conducted by two representative digital technology companies.
5.3.1. Similarities between Google and Amazon.com in the BMI CR-Matrix
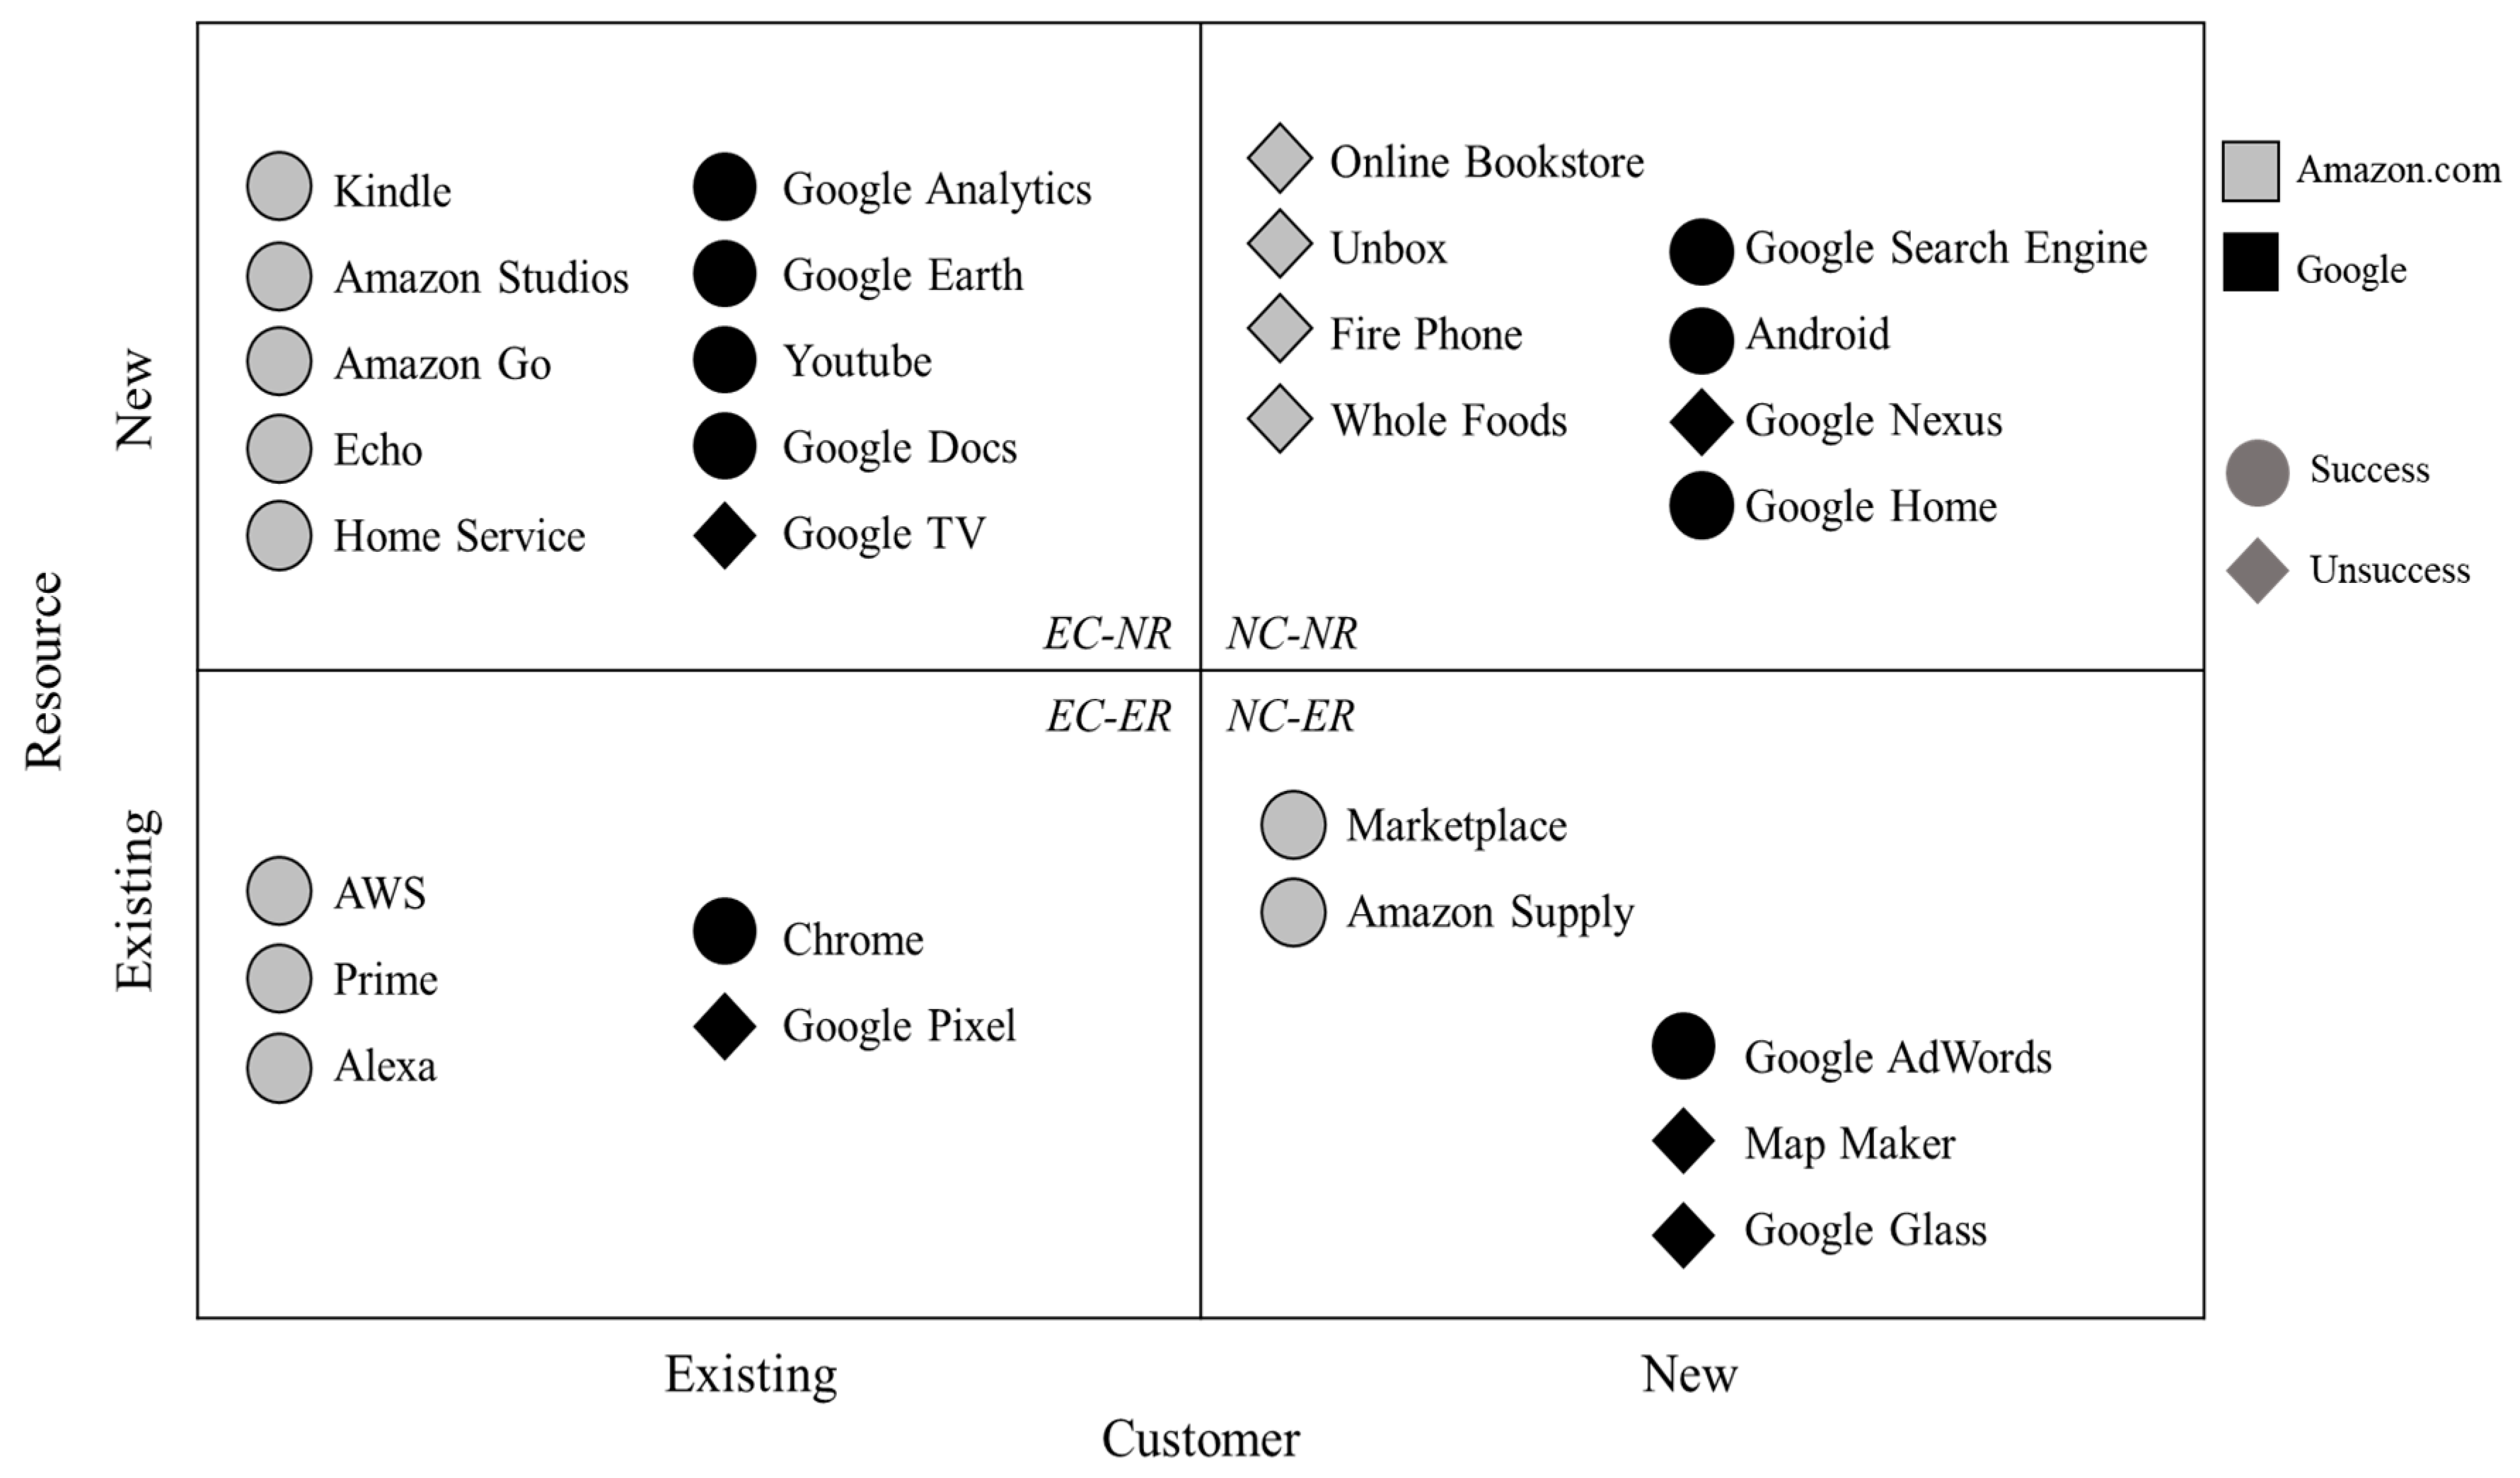
We presented 14 BMs of Google. Jung and Lee (2021) also presented 14 BMs of Amazon.com [16]. Figure 6 shows the 28 BMs of Google and Amazon.com which keep sustainable growth in today’s environment in the BMI CR-matrix. We identified four commonalities. A closer look at each of these similarities is as follows.
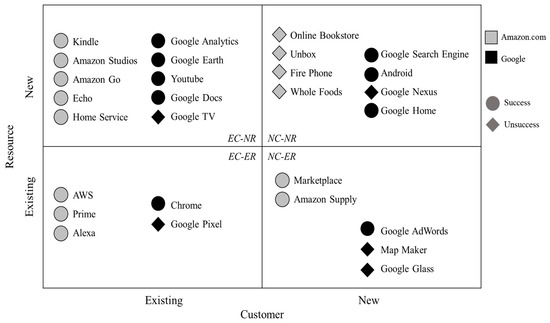
Figure 6.
BMI CR-matrix for Google and Amazon.com.
First, both Google and Amazon.com had relatively many BMIs with new resources. For example, in the case of securing new resources, Google and Amazon.com each accounted for nine (66.7%) cases out of fourteen based on new resources. Continuously securing new resources can support companies to retain sustainable business as these resources from new technology can contribute to the company’s innovative offerings. This phenomenon can be explained as follows: to lead companies to respond to rapid market changes, such as digital technology-based businesses, securing dynamic capabilities to build new resources is one of the ways to achieve a competitive advantage [61].
Second, BMI targeting existing customers showed a higher success rate than BMI targeting new customers. When looking at BM’s success stories with existing customers, Amazon.com succeeded in all eight cases, and Google succeeded in five of seven cases. On the other hand, when targeting new customers, Amazon.com succeeded in two out of six cases, while Google succeeded in four out of seven BMs. When looking at these two companies together, 13 out of 15 BMs targeting existing customers were successful, thus achieving a success rate of 86.7%. However, in the case of new customers, only 6 of 13 BMs were successful, resulting in a lower success rate of 46.2%.
Third, the most active and successful BMI among the four groups was the BMI for existing customers with new resources. Google and Amazon.com have the most active new BMs in the EC-NR group. Their success rates were better than those in the other three groups of the BMI CR-matrix. Four of the five BMs of Google and all five BMs of Amazon.com were successful. These results show that attempts to provide new value to existing customers by BMI based on new resources could positively affect corporate performance.
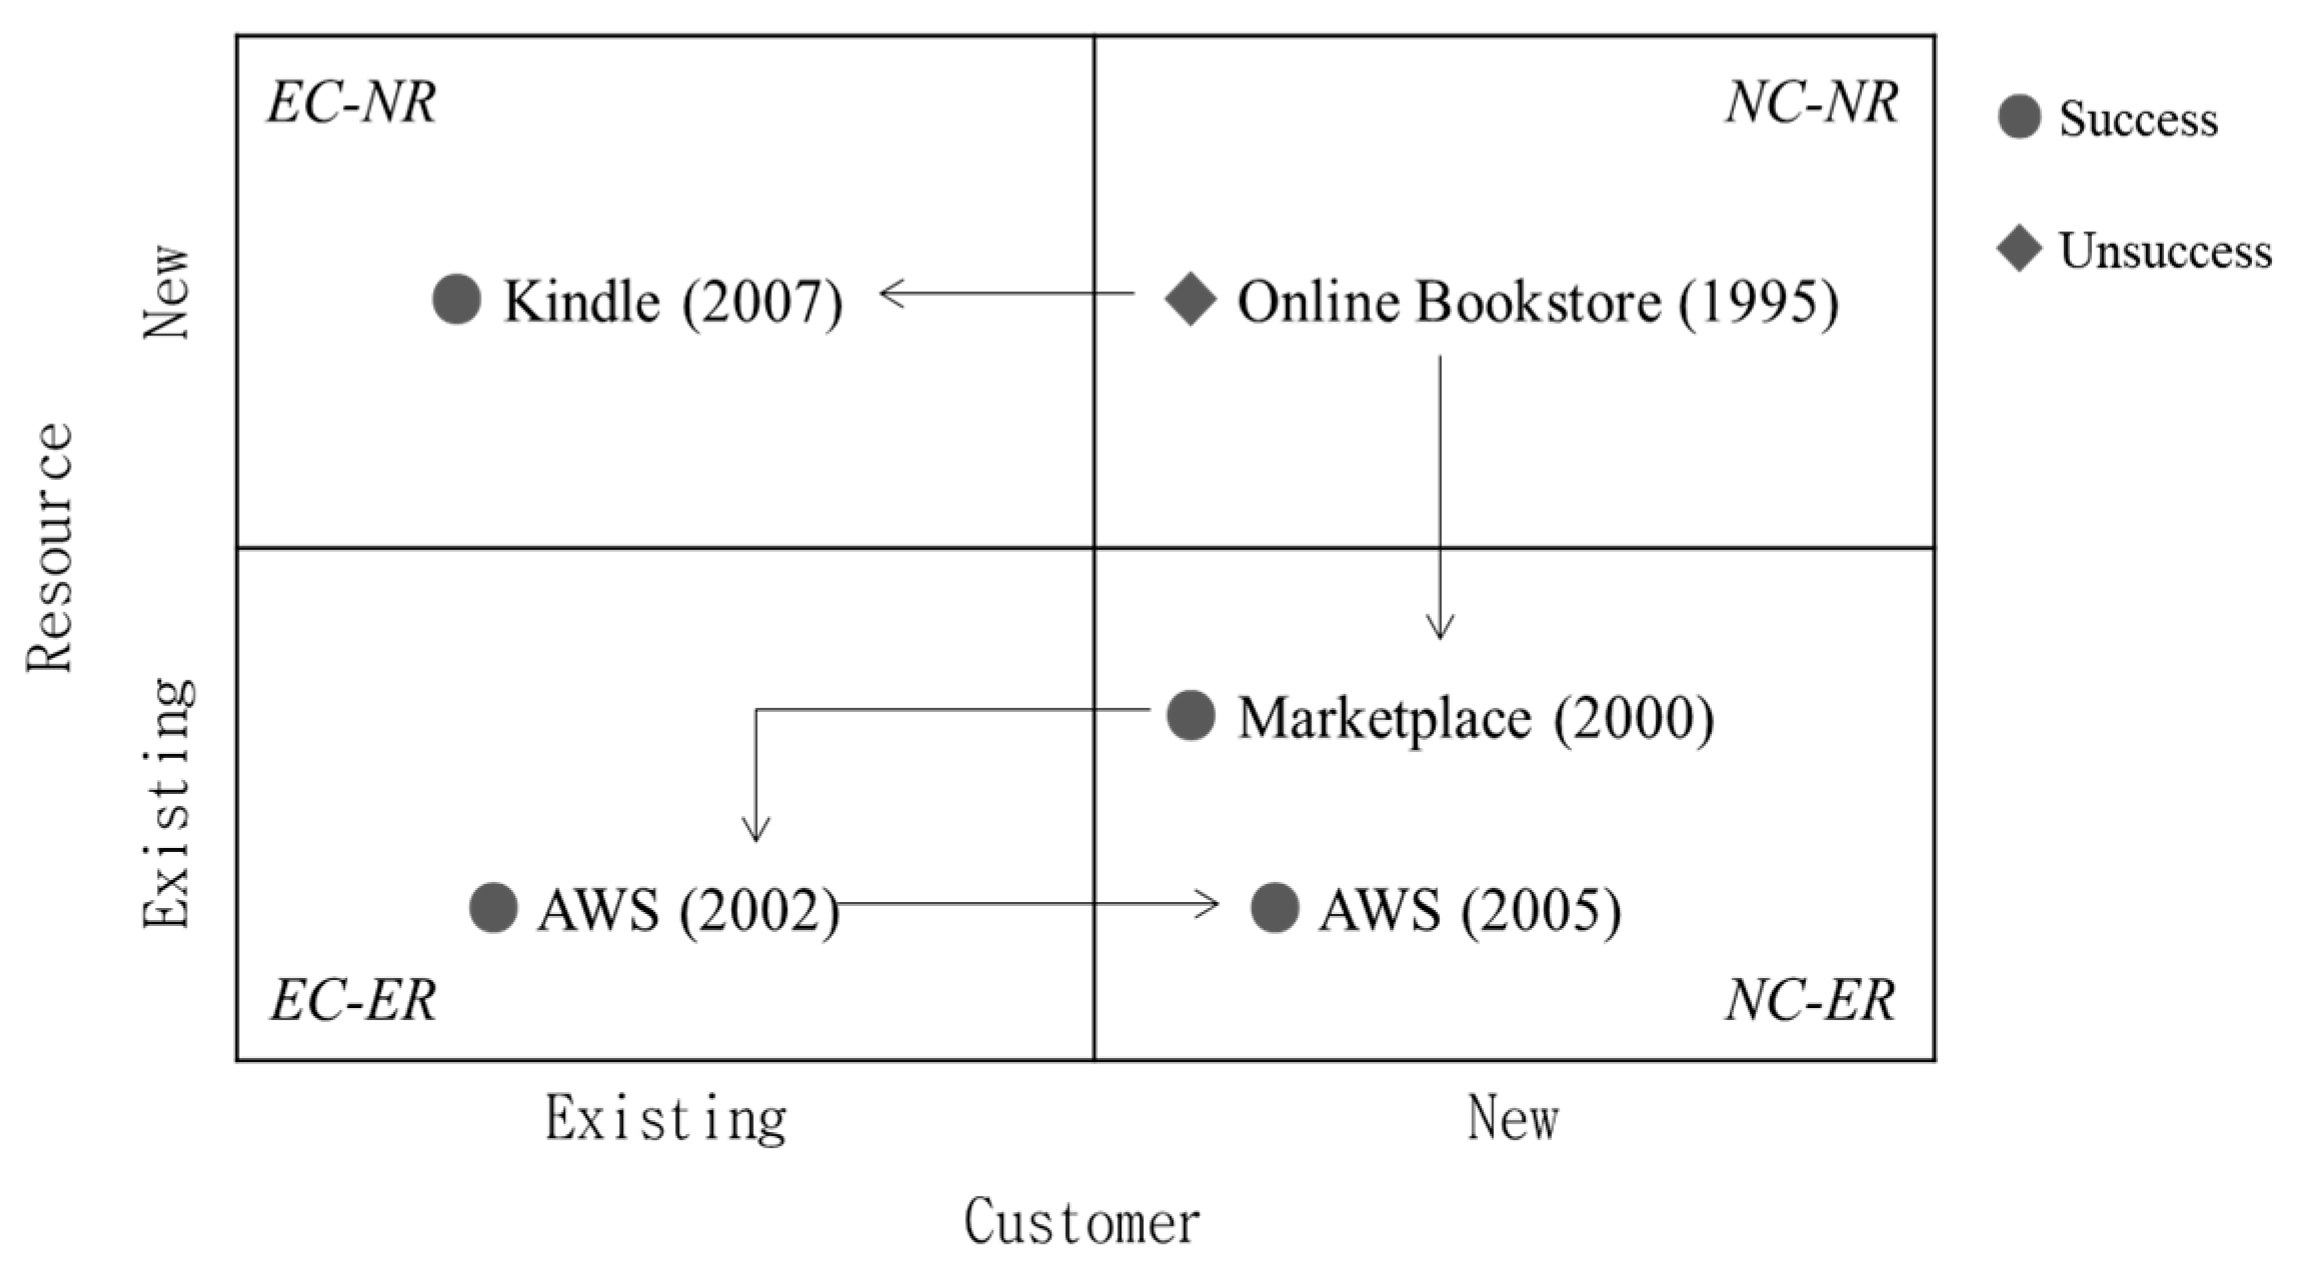
Finally, we observed a positive performance through BMI dynamics, defined as a strategic move in the BMI CR-matrix using customers or resources. For example, Google AdWords (2000) produced good results by moving from the NC-ER group to Google Analytics (2005) of the EC-NR group, which provided web analysis and advertising services for the same advertiser customers drawn in Figure 5. On the other hand, as shown in Figure 7, Amazon.com successfully moved from Online Bookstore (1995) customers in the NC-NR group to Marketplace (2000) in the NC-ER group, with existing suppliers as new customers. Utilizing the IT infrastructure, Amazon.com moved to AWS (2002) in the EC-ER group. It then moved back to AWS (2005) in the NC-ER group, which deployed cloud computing services for external general enterprises and accounted for 12% of Amazon.com sales in 2020.
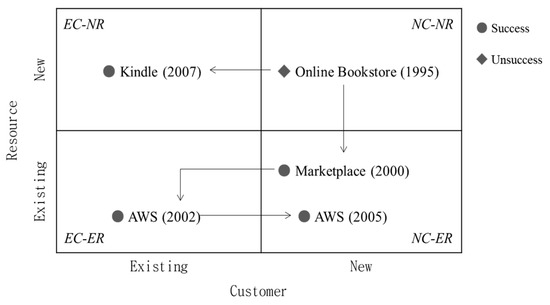
Figure 7.
BMI dynamics of Amazon.com.
5.3.2. Differences between Google and Amazon.com at BMI CR-Matrix
We identified three differences between the two BMI case studies through the BMI CR-matrix. These differences are explained below. First, using existing resources, Amazon.com succeeded in all five cases, but Google only succeeded in two of five cases. When Amazon.com used its existing resources, Marketplace and Amazon Supply moved toward expanding their customer base to new customers through innovation of the supply chain. Meanwhile, AWS and Prime provided differentiated value to existing customers by utilizing existing resources for IT infrastructure rentals and ultra-fast delivery services. However, Google did not succeed when they released the Google Pixel following Google Nexus, another unpopular hardware product. Further, they did not successfully expand their demands from limited markets such as India or Korea for Map Maker and early adopters of Google Glass. We infer that Amazon.com’s capability to combine online and offline, alongside Google’s relative lack of hardware capabilities, leads to a disparity in success when leveraging the existing resources of digital companies that need well-balanced software and hardware to achieve high efficiency [62].
Second, the BMIs of both showed different results when targeting new customers. In the NC-NR group, Amazon.com failed in all four BMs, but Google succeeded in three out of four cases: Google Search Engine, Android, and Google Home. These three BMs led to reduced customer entry barriers and switching costs from existing competitors to Google customers by suggesting a different revenue model. On the other hand, in the NC-ER group, Amazon.com succeeded in both BMIs, while Google only succeeded in one of three cases. Amazon.com’s two BMs expanded the size of the entire supply chain, reorganizing third-party providers to customers for Marketplace and reinventing the B2B e-commerce market for Amazon Supply.
Finally, both had many BMIs in which new resources were used. However, there were differences in how they secured new resources. Google Search Engine and Google TV exploited the partnership’s resources, while Google’s other seven BMs secured resources through M&A. On the other hand, Amazon.com used various resource-securing strategies such as Fire phones and Whole Foods through M&A, Kindle and Unbox through partnerships, and Amazon Go’s automatic check-out system through in-house development.
6. Discussion and Conclusions
6.1. Discussion
BMI positively affects continuous and sustainable growth for a digital technology company and survival in an uncertain and complex environment, which is the outcome and driver of innovation [60]. A company that succeeds in BMI will likely secure a continuous competitive advantage [8]. Extant studies have suggested that customers should be considered an important factor when establishing a BMI strategy because customers who consume the value created by a company are the source of revenue of a BM. According to the resource-based view, resources are drivers that create and execute BMI values. Therefore, we adopted the BMI CR-matrix framework proposed by Jung and Lee (2021) with customers and resources for the continuous and sustainable BMI success of technology companies [16].
Furthermore, this paper investigated many cases from Google and compared these cases with the extant research on Amazon.com, with the use of two digital companies improving the external validity of this work. We derived five propositions for the Google cases using the BMI CR-matrix. We focused on the phenomena of BMI instances and analyzed success conditions. We evaluated four similarities and three differences in BMIs between Google and Amazon.com to improve the external validity. Even if we researched media articles for 14 BM cases, our paper focused mainly on the qualitative method. In the future, it would benefit to redeem quantitative data.
6.2. Conclusions
This paper contributes to the development of BMI theory in two respects. First, it identified customers and resources, both existing and new, as important factors for sustaining BMI in technology companies, and examined the consequences of these factors when utilized through the case of Google. The CR-matrix framework can extend the practicality of the BMI theory by influencing the technology industry from a more empirical perspective. Second, this paper sought to advance the theory of sustainable company success by examining the secrets of sustainable growth and long-term competitive advantage from the perspective of continuous BMIs. In particular, it provided a foundation for research in the field by taking an in-depth look at the different BMI outcomes of two digital tech companies in dominant positions over a long period of time.
The BMI CR-matrix has implications for the management of technology companies in determining whether a company is based on existing or new customers and existing or new resources. For example, digital technology-based companies such as Google and Amazon.com seem unlikely to succeed in BMs that target new customers with new resources (NC-NR). Therefore, rather than focusing on short-term performance for NC-NR BMI, companies may operate new resources with a long-term perspective or lower the barriers to entry by reducing customer switching costs, as in the case of Google’s search engine or Android. In addition, since the BM success rate of new resources targeting existing customers (EC-NR) is better than other customer and resource combinations for technology-based companies, we recommend acquiring new resources to expand their markets around existing customers.
Although our study used multiple digital technology-based BM cases from Google and Amazon.com, which have maintained sustainability in a volatile environment, generalizability is still limited since the current BMI CR-matrix only examines two digital companies. However, these cases can be generalized to other digital technology industries that require complex resources, such as software and fintech industries, that target volatile customers of the digital industry. In addition, this paper had a limitation in focusing on the digital technology industry. If the analysis proceeds by applying cases of other industrial companies of the high-tech manufacturing, service, pharmaceutical, and automotive industries in the future, it would then be possible to check whether the proposition derived from this paper is still valid or should be modified. Although this paper qualitatively analyzed the BMs of a case company through existing literature and media articles, it had a further limitation in that quantitative data, such as financial data, were not sufficiently used. Therefore, it is necessary to improve the BMI CR-matrix and expand the use of cases by analyzing the effects and results based on qualitative and quantitative data in future studies.
Author Contributions
Writing—original draft, J.J.; Writing—review & editing, H.L. All authors have read and agreed to the published version of the manuscript.
Funding
This research was supported by National Research Foundation Korea (NRF) grants funded by the Ministry of Science and ICT (MSIT) of Korea, grant number 2021R1F1A1063690.
Institutional Review Board Statement
Not applicable.
Informed Consent Statement
Not applicable.
Data Availability Statement
Data are contained within the article and Appendix A.
Conflicts of Interest
The authors declare no conflicts of interest.
Appendix A. List of Content Analysis Documents for Google
| Document ID | Source |
| 1 | Park Chang-Wook (2016), “Google’s ransom exceeds Apple”, http://www.yonhapmidas.com/article/160304172142_309036, accessed on 19 February 2016 |
| 2 | Wikipedia (2021), “Google Ads”, https://ko.wikipedia.org/wiki/%EA%B5%AC%EA%B8%80_%EC%95%A0%EC%A6%88, accessed on 1 September 2021 |
| 3 | Joel House (2020), “9 Amazing Strategies to Grow Your Small Business Faster”, https://djdesignerlab.com/strategies-to-grow-small-business-faster/?utm_source=feedburner&utm_medium=feed&utm_campaign=Feed%3A+djdesignerlab+%28DJDESIGNERLAB+-+Find+All+Your+Design+Inspirations+From+This+Laboratory%29, https://ppss.kr/archives/228576, accessed on 15 October 2020 |
| 4 | Seokchan Yoon (2006), “The evolution of the online advertising model providing value”, https://news.naver.com/main/read.naver?mode=LSD&mid=sec&sid1=001&oid=009&aid=0000488248, accessed on 20 February 2006 |
| 5 | Elinor Mills (2005), “Check the effectiveness of web advertising on Google”, https://news.naver.com/main/read.naver?mode=LSD&mid=sec&sid1=105&oid=092&aid=0000006298, accessed on 15 November 2005 |
| 6 | Elinor Mills (2005), “「Google’s web analytics service」is being stopped”, https://news.naver.com/main/read.naver?mode=LSD&mid=sec&sid1=105&oid=092&aid=0000006339, accessed on 17 November 2005 |
| 7 | W3Techs (2021), “Usage statistics of traffic analysis tools for websites”, https://w3techs.com/technologies/overview/traffic_analysis, accessed on 20 November 2021 |
| 8 | Lee Tae-ho (2005), “MS·Google, Let’s fight in the sky”, https://news.naver.com/main/read.naver?mode=LSD&mid=sec&sid1=105&oid=018&aid=0000279894, accessed on 26 May 2005 |
| 9 | Stephen Shankland (2007), “Google, Reinforced mapping with the acquisition of 「Image America」”, https://zdnet.co.kr/view/?no=00000039159628&from=Mobile, accessed on 23 July 2007 |
| 10 | Rebecca Moore (2020), “Here’s to you: 15 years of Google Earth stories”, https://blog.google/products/earth/special-stories-from-15-years-of-google-earth/, accessed on 9 July 2020 |
| 11 | Kim Gye-hwan (2006), “Google acquired YouTube for $1.65 billion”, https://m.hani.co.kr/arti/international/globaleconomy/163105.html?_fr=gg, accessed on 10 October 2006 |
| 12 | Wikipedia (2021), “YouTube”, https://ko.wikipedia.org/wiki/%EC%9C%A0%ED%8A%9C%EB%B8%8C#cite_note-5, accessed on 12 November 2021 |
| 13 | Kim Ik-Hyun (2006), “Google and Microsoft in the Office market?”, https://www.inews24.com/view/227696, accessed on 11 October 2006 |
| 14 | Wikipedia (2021), “Google Docs”, https://ko.wikipedia.org/wiki/%EA%B5%AC%EA%B8%80_%EB%AC%B8%EC%84%9C%EB%8F%84%EA%B5%AC, accessed on 14 November 2021 |
| 15 | Kyung Yoon (2011), “Google Apps vs. MS Office 365, who will win?” http://www.betanews.net/article/544464, accessed on 10 July 2011 |
| 16 | Wikipedia (2021), “ Android (operating system)”, https://ko.wikipedia.org/wiki/%EC%95%88%EB%93%9C%EB%A1%9C%EC%9D%B4%EB%93%9C_(%EC%9A%B4%EC%98%81_%EC%B2%B4%EC%A0%9C), accessed on 6 November 2021 |
| 17 | Kwon Young-jeon (2014), “Korea is the world’s No. 1 Android Republic… 93.4% use it”, https://news.naver.com/main/read.naver?mode=LSD&mid=shm&sid1=105&oid=001&aid=0006711113, accessed on 21 January 2014 |
| 18 | Wikipedia (2021), “Google Chrome”, “https://ko.wikipedia.org/wiki/%EA%B5%AC%EA%B8%80_%ED%81%AC%EB%A1%AC”, accessed on 14 November 2021 |
| 19 | Statcounter (2021), “Browser Market Share Worldwide”, https://gs.statcounter.com/, accessed on 31 October 2021 |
| 20 | Jeon Ha-na (2012), “Google, Targeting Asian Mobile Market About One billion”, https://zdnet.co.kr/view/?no=20121203115021, accessed on 3 December 2012 |
| 21 | DISH Network (2010), “DISH Network’s Enhanced Google TV Solution Now Available to Subscribers for $179”, https://about.dish.com/news-releases?item=122865, accessed on 3 December 2012 |
| 22 | STRABASE (2010), “The possibility of success is still unknown due to problems with Google TV, revenue model and partnership”, https://strabase.tistory.com/957, accessed on 29 October 2021 |
| 23 | Don Reisinger (2010), “Google TV Is Failing: 10 Reasons Why”, https://www.eweek.com/cloud/google-tv-is-failing-10-reasons-why/, accessed on 29 October 2021 |
| 24 | Google (2017), “Google Map Maker has closed”, https://support.google.com/mapmaker/answer/7195127?visit_id=637729870465935796-1716997047&rd=1, accessed on 31 March 2017 |
| 25 | Dong-hwan Woo (2010), “Google, iPhone and all-out war. Unveils smartphone ‘Nexus One’”, https://www.newspim.com/news/view/20100106000281, accessed on 6 January 2010 |
| 26 | Choi Jin-bong (2010), “The reason for the sluggish sales of Google’s Nexus One, iPhone competitor”, http://www.ohmynews.com/NWS_Web/view/at_pg.aspx?CNTN_CD=A0001308770, accessed on 27 January 2010 |
| 27 | Clara Yoon (2018), “Assumptions that led to the failure of Google Glass”, https://medium.com/nyc-design/the-assumptions-that-led-to-failures-of-google-glass-8b40a07cfa1e, accessed on 29 October 2021 |
| 28 | John Dye (2016), “Google is brewing a competitor to Amazon Echo”, https://www.androidauthority.com/google-amazon-echo-competitor-682190/, accessed on 24 March 2016 |
| 29 | Choi Ji-hee (2016), “Example Case of Convergence ③ The first to break down boundaries goes far Audi”, https://www.dnews.co.kr/uhtml/view.jsp?idxno=201603011231546061527, accessed on 2 March 2016 |
| 30 | ReportLinker, “Smart Speakers Global Market Report 2022” https://finance.yahoo.com/news/smart-speakers-global-market-report-124000369.html?guccounter=1&guce_referrer=aHR0cHM6Ly93d3cuZ29vZ2xlLmNvbS8&guce_referrer_sig=AQAAAD2MoiqdmOsmtfZt7UTJ-Hu3iNU2bISOMpjVwLAGjR5NjJRZ03XsdU_gSoWRW5K2MNBY8fwW4Crk7hxCZHDWt13OD-UUWSqH2-O9SBcuQgPNsCy7qkyS7rNR4HJUHraEmfv7s-4UfFrx2vpEdIXIR3LhfWwucflYtyTgfg59mjbR, accessed on 23 March 2022 |
| 31 | Wikipedia (2021), “Google Pixel”, https://ko.wikipedia.org/wiki/%EA%B5%AC%EA%B8%80_%ED%94%BD%EC%85%80, accessed on 29 October 2021 |
| 32 | Hwang Chi-Gyu (2016), “Google wants to make their own Nexus phone” https://zdnet.co.kr/view/?no=20160202075436, accessed on 2 February 2016 |
| 33 | Wikipedia, “Google glass”, https://en.wikipedia.org/wiki/Google_Glass, accessed on 29 October 2021 |
| 34 | Joong Ang Ilbo (2018), “Google sales of 100 billion dollars… Achievement after 20 years of establishment”, https://news.koreadaily.com/2018/02/01/economy/economygeneral/5992849.html?detailWord=, accessed on 1 February 2018 |
References
- Barney, J. Firm resources and sustained competitive advantage. J. Manag. 1991, 17, 99–120. [Google Scholar] [CrossRef]
- Kline, S.J.; Rosenberg, N. An overview of innovation. In Studies on Science and the Innovation Process: Selected Works of Nathan Rosenberg; World Scientific: Singapore, 2010; pp. 173–203. [Google Scholar]
- Boer, H.; During, W.E. Innovation, what innovation? A comparison between product, process and organisational innovation. Int. J. Technol. Manag. 2001, 22, 83–107. [Google Scholar] [CrossRef]
- Florén, H.; Agostini, A. The Business model innovation map: A framework for analyzing business model innovation. In Proceedings of the 24th IAMOT Conference, Cape Town, South Africa, 8–11 June 2015. [Google Scholar]
- Sosna, M.; Trevinyo-Rodríguez, R.N.; Velamuri, S.R. Business model innovation through trial-and-error learning: The Naturhouse case. Long Range Plan. 2010, 43, 383–407. [Google Scholar] [CrossRef]
- Minatogawa, V.; Franco, M.; Rampasso, I.S.; Holgado, M.; Garrido, D.; Pinto, H.; Quadros, R. Towards systematic sustainable business model innovation: What can we learn from business model innovation. Sustainability 2022, 14, 2939. [Google Scholar] [CrossRef]
- Inigo, E.A.; Albareda, L.; Ritala, P. Business model innovation for sustainability: Exploring evolutionary and radical approaches through dynamic capabilities. Ind. Innov. 2017, 24, 515–542. [Google Scholar] [CrossRef]
- Amit, R.; Zott, C. Creating value through business model innovation. MIT Sloan Manag. Revice 2012, 53, 36–44. [Google Scholar]
- Han, M.; Jeon, J. Roadmap Incorporating Data Management Perspective for Platform Business Model Innovation. Sustainability 2023, 15, 3151. [Google Scholar] [CrossRef]
- Daradkeh, M. The nexus between business analytics capabilities and knowledge orientation in driving business model innovation: The moderating role of industry type. Informatics 2023, 10, 19. [Google Scholar] [CrossRef]
- Baden-Fuller, C.; Mangematin, V. Business models: A challenging agenda. Strateg. Organ. 2013, 11, 418–427. [Google Scholar] [CrossRef]
- Hauke-Lopes, A.; Wieczerzycki, M.; Ratajczak-Mrozek, M. Extra-industry imitation of digital platform business models. Entrep. Bus. Econ. Rev. 2022, 10, 91–105. [Google Scholar] [CrossRef]
- Bouwman, H.; Nikou, S.; Molina-Castillo, F.J.; de Reuver, M. The impact of digitalization on business models. Digit. Policy Regul. Gov. 2018, 20, 105–124. [Google Scholar] [CrossRef]
- Matarazzo, M.; Penco, L.; Profumo, G.; Quaglia, R. Digital transformation and customer value creation in Made in Italy SMEs: A dynamic capabilities perspective. J. Bus. Res. 2021, 123, 642–656. [Google Scholar] [CrossRef]
- Bitetti, L.; Gibbert, M. The ROAD to continuous business model innovation: A longitudinal study unveiling patterns of cognitive sensing dynamic capabilities. Creat. Innov. Manag. 2022, 31, 123–140. [Google Scholar] [CrossRef]
- Jung, J.; Lee, H. Customer-Resource Relationship of Business Model Innovation: Case Study for Amazon.com. J. Korea Technol. Innov. Soc. 2021, 24, 1053–1081. [Google Scholar] [CrossRef]
- Heider, A.; Gerken, M.; van Dinther, N.; Hülsbeck, M. Business model innovation through dynamic capabilities in small and medium enterprises–Evidence from the German Mittelstand. J. Bus. Res. 2021, 130, 635–645. [Google Scholar] [CrossRef]
- Teece, D.J. Business models, business strategy and innovation. Long Range Plan. 2010, 43, 172–194. [Google Scholar] [CrossRef]
- Taran, Y.; Boer, H.; Lindgren, P. A business model innovation typology. Decis. Sci. 2015, 46, 301–331. [Google Scholar] [CrossRef]
- Gebauer, H.; Haldimann, M.; Saul, C.J. Business model innovations for overcoming barriers in the base-of-the-pyramid market. Ind. Innov. 2017, 24, 543–568. [Google Scholar] [CrossRef]
- Winterhalter, S.; Weiblen, T.; Wecht, C.H.; Gassmann, O. Business model innovation processes in large corporations: Insights from BASF. J. Bus. Strategy 2017, 38, 62–75. [Google Scholar] [CrossRef]
- Massa, L.; Tucci, C.L. Business model innovation. In The Oxford Handbook of Innovation Management; OUP Oxford: Oxford, UK, 2013; Volume 20, pp. 420–441. [Google Scholar]
- Verhoeven, B.; Johnson, L.W. Business model innovation portfolio strategy for growth under product-market configurations. J. Bus. Models 2017, 5, 35–50. [Google Scholar]
- Gambardella, A.; McGahan, A.M. Business-model innovation: General purpose technologies and their implications for industry structure. Long Range Plan. 2010, 43, 262–271. [Google Scholar] [CrossRef]
- Yang, W.; Chen, X.; Zhang, L. Exploring the relationship between partner heterogeneity and business model innovation: The mediating effect of knowledge transfer. In Proceedings of the 2019 International Conference on Strategic Management (ICSM 2019), Milan, Italy, 28–31 October 2019. [Google Scholar]
- Chesbrough, H. Business model innovation: It’s not just about technology anymore. Strategy Leadersh 2007, 35, 12–17. [Google Scholar] [CrossRef]
- Gawer, A.; Cusumano, M.A. Industry platforms and ecosystem innovation. J. Prod. Innov. Manag. 2014, 31, 417–433. [Google Scholar] [CrossRef]
- Foss, N.J.; Saebi, T. Fifteen years of research on business model innovation. J. Manag. 2016, 43, 200–227. [Google Scholar] [CrossRef]
- Fallahi, S. A Process View of Business Model Innovation. Ph.D. Thesis, Chalmers University of Technology (Sweden), Gothenburg, Sweden, 2017. [Google Scholar]
- Keiningham, T.; Aksoy, L.; Bruce, H.L.; Cadet, F.; Clennell, N.; Hodgkinson, I.R.; Kearney, T. Customer experience driven business model innovation. J. Bus. Res. 2020, 116, 431–440. [Google Scholar] [CrossRef]
- Krippendorff, K. Content Analysis: An Introduction to Its Methodology; Sage: Thousand Oaks, CA, USA, 2018. [Google Scholar]
- Ansoff, H.I. A model for diversification. Manag. Sci. 1958, 4, 392–414. [Google Scholar] [CrossRef]
- Zighan, S. Disruptive Technology from an Organizational Management Perspective. In Proceedings of the 2022 International Conference on Business Analytics for Technology and Security (ICBATS), Dubai, United Arab Emirates, 16–17 February 2022; pp. 1–5. [Google Scholar]
- Pynnönen, M.; Hallikas, J.; Ritala, P. Managing customer-driven business model innovation. Int. J. Innov. Manag. 2012, 16, 1250022. [Google Scholar] [CrossRef]
- Sjödin, D.; Parida, V.; Jovanovic, M.; Visnjic, I. Value creation and value capture alignment in business model innovation: A process view on outcome-based business models. J. Prod. Innov. Manag. 2020, 37, 158–183. [Google Scholar] [CrossRef]
- Afuah, A. Business Model Innovation: Concepts, Analysis, and Cases; Routledge: Oxford, UK, 2014. [Google Scholar]
- Priem, R.L.; Wenzel, M.; Koch, J. Demand-side strategy and business models: Putting value creation for consumers center stage. Long Range Plan. 2018, 51, 22–31. [Google Scholar] [CrossRef]
- Parise, S.; Guinan, P.J.; Kafka, R. Solving the crisis of immediacy: How digital technology can transform the customer experience. Bus. Horiz. 2016, 59, 411–420. [Google Scholar] [CrossRef]
- Nasirov, S.; Li, Q.C.; Kor, Y.Y. Converting technological inventions into new products: The role of CEO human capital. J. Prod. Innov. Manag. 2021, 38, 522–547. [Google Scholar] [CrossRef]
- Cho, M.-J.; Shin, J. Identifying a combination of key resources to overcome the entry barriers in the electric vehicle market. IEEE Access 2022, 10, 60373–60386. [Google Scholar] [CrossRef]
- Kazozcu, S.B. Role of strategic flexibility in the choice of turnaround strategies: A resource based approach. Procedia-Soc. Behav. Sci. 2011, 24, 444–459. [Google Scholar] [CrossRef]
- Helfat, C.E.; Peteraf, M.A. The dynamic resource-based view: Capability lifecycles. Strateg. Manag. J. 2003, 24, 997–1010. [Google Scholar] [CrossRef]
- Andries, P.; Debackere, K. Business model innovation: Propositions on the appropriateness of different learning approaches. Creat. Innov. Manag. 2013, 22, 337–358. [Google Scholar] [CrossRef]
- Demil, B.; Lecocq, X. Business model evolution: In search of dynamic consistency. Long Range Plan. 2010, 43, 227–246. [Google Scholar] [CrossRef]
- Osterwalder, A.; Pigneur, Y. Business Model Generation: A Handbook for Visionaries, Game Changers, and Challengers; John Wiley & Sons: Hoboken, NJ, USA, 2010; Volume 1. [Google Scholar]
- Gassmann, O.; Frankenberger, K.; Sauer, R. Exploring the Field of Business Model Innovation: New Theoretical Perspectives; Springer: Berlin/Heidelberg, Germany, 2016. [Google Scholar]
- Stampfl, G. The Process of Business Model Innovation: An Empirical Exploration; Springer: Berlin/Heidelberg, Germany, 2015. [Google Scholar]
- Trimi, S.; Berbegal-Mirabent, J. Business model innovation in entrepreneurship. Int. Entrep. Manag. J. 2012, 8, 449–465. [Google Scholar] [CrossRef]
- Henard, D.H.; McFadyen, M.A. Resource dedication and new product performance: A resource-based view. J. Prod. Innov. Manag. 2012, 29, 193–204. [Google Scholar] [CrossRef]
- Interbrand. Best Global Brands. 2002–2021. Available online: https://interbrand.com/ (accessed on 15 October 2023).
- Google. Alphabet Financial Statements 2009–2021|GOOGL. Available online: https://abc.xyz/investor/ (accessed on 15 October 2023).
- Amabile, T.A.; Khaire, M. Creativity and the role of the leader. J. Manag. Train. Inst. 2008, 36, 48–51. [Google Scholar]
- Lambert, T.A. What’s behind the war on big tech? Regulation 2021, 44, 30. [Google Scholar]
- Sulova, S. A Conceptual Framework for the Technological Advancement of E-Commerce Applications. Businesses 2023, 3, 220–230. [Google Scholar] [CrossRef]
- Sarker, M.R.; Ali, S.M.; Paul, S.K.; Munim, Z.H. Measuring sustainability performance using an integrated model. Measurement 2021, 184, 109931. [Google Scholar] [CrossRef]
- Wang, Y.; Lo, H.P.; Chi, R.; Yang, Y. An integrated framework for customer value and customer-relationship-management performance: A customer-based perspective from China. Manag. Serv. Qual. Int. J. 2004, 14, 169–182. [Google Scholar] [CrossRef]
- Verhoef, P.C.; Lemon, K.N. Successful customer value management: Key lessons and emerging trends. Eur. Manag. J. 2013, 31, 1–15. [Google Scholar] [CrossRef]
- Sadighi, M.; Ghobadi, M.M.; Matikolaee, S.H.H. A conceptual model for customer lock-in effect in electronic business. In Proceedings of the 2015 12th International Conference on Information Technology-New Generations, Las Vegas, NV, USA, 13–15 April 2015; pp. 746–750. [Google Scholar]
- Chalkias, I.; Tzafilkou, K.; Karapiperis, D.; Tjortjis, C. Learning Analytics on YouTube Educational Videos: Exploring Sentiment Analysis Methods and Topic Clustering. Electronics 2023, 12, 3949. [Google Scholar] [CrossRef]
- Millar, C.C.; Groth, O.; Mahon, J.F. Management innovation in a VUCA world: Challenges and recommendations. Calif. Manag. Rev. 2018, 61, 5–14. [Google Scholar] [CrossRef]
- Paek, B.-J.; Lee, H.-S. Exploratory research on the dynamic capabilities of leading firms: Research framework building. J. Korea Acad.-Ind. Coop. Soc. 2015, 16, 8262–8273. [Google Scholar] [CrossRef]
- Lee, K.; Park, Y.; Lee, D. Measuring efficiency and ICT ecosystem impact: Hardware vs. software industry. Telecommun. Policy 2018, 42, 107–115. [Google Scholar] [CrossRef]
Disclaimer/Publisher’s Note: The statements, opinions and data contained in all publications are solely those of the individual author(s) and contributor(s) and not of MDPI and/or the editor(s). MDPI and/or the editor(s) disclaim responsibility for any injury to people or property resulting from any ideas, methods, instructions or products referred to in the content. |
© 2023 by the authors. Licensee MDPI, Basel, Switzerland. This article is an open access article distributed under the terms and conditions of the Creative Commons Attribution (CC BY) license (https://creativecommons.org/licenses/by/4.0/).