Article

Kano Model Analysis of Digital On-Farm Technologies for Climate Adaptation and Mitigation in Livestock Farming

1
Infernum, Interdisciplinary Distance Learning Program in Environmental Sciences, FernUniversität in Hagen, Universitätsstraße 33, 58097 Hagen, Germany
2
Center of Sustainability Transformation in Areas of Intensive Agriculture, University of Vechta, Driverstrasse 22, 49377 Vechta, Germany
*
Author to whom correspondence should be addressed.
Sustainability 2024, 16(1), 268; https://doi.org/10.3390/su16010268
Submission received: 22 November 2023 / Revised: 14 December 2023 / Accepted: 26 December 2023 / Published: 27 December 2023

Abstract

:
In the EU, agriculture contributes significantly to greenhouse gas (GHG) emissions. In Germany, over half of the GHG emissions from agriculture can be directly attributed to livestock farming. To combat the progressing climate change, GHG emissions must be significantly reduced. Digital solutions, particularly decision support systems (DSS), are promising tools to assist livestock farmers in achieving the globally agreed GHG reduction goals. However, there is a lack of studies addressing DSS requirements for reducing GHG emissions in livestock on the farm level. Users’ feedback on technologies can support identifying areas for enhancement and refinement. This study identifies, categorizes, and ranks fourteen DSS features aimed at supporting GHG reduction based on their impact on customer satisfaction. A quantitative online questionnaire using the Kano model surveyed livestock farmers’ satisfaction or dissatisfaction levels with these features. Results gathered from 98 responses across German federal states highlighted the significance of data authority and integrability, with their absence causing dissatisfaction. Multi-target optimization emerged as an attractive feature, positively impacting satisfaction. Connectivity and market perspective, however, appeared indifferent. The findings guide DSS developers in prioritizing attributes crucial for customer satisfaction. It also helps to focus on must-have attributes to preserve customer satisfaction and ensure successful GHG reduction implementation.

1. Introduction

Ongoing climate change is one of the greatest challenges of our time [1]. To slow down or stop the process, greenhouse gas (GHG) emissions must be significantly reduced [2]. Therefore, the European Union (EU) introduced the Farm to Fork Strategy as part of the Green Deal to address climate change and food system challenges. This initiative includes ambitious targets for 2030, reflecting the EU’s commitment to achieving carbon neutrality by 2050. Less than ten years remain to achieve the defined EU sustainability goals. One concrete action for meeting the sustainability development goals will be transforming agriculture and reducing GHG emissions from livestock farming. In addition to the energy and industry sectors in the EU, agriculture is a major source of GHG emissions, with a share of approximately 11% [3]. A total of 66% percent of GHG emissions from agriculture in Germany (about 5% of total emissions from Germany) can be directly attributed to livestock farming [2]. Globally, livestock contributes to about 14.5% of GHG emissions [4]. To achieve the climate protection goals agreed upon in the EU community (Green Deal), great hope is placed in digital approaches [5,6]. Digital technologies will play a fundamental role in addressing most environmental, economic, and social sustainability challenges in the coming years. On this topic and newly available tools, producers, policymakers, and industry will have to make important decisions.
Digital technologies have been used in agriculture for years and now contribute to quality assurance in animal welfare and food safety [7,8]. A suitable technological option is the use of decision support systems (DSS). The successful implementation of technology into sustainable agriculture is precision agriculture. The use of sensors for monitoring soil conditions, crop health, and weather patterns enables farmers to make data-driven decisions. This helps optimize irrigation, fertilization, and pesticide application, reducing unnecessary resource use and associated GHG emissions [9]. DSS could also play a crucial role in reducing GHG emissions in livestock farming through various mechanisms. DSS can provide valuable insights and recommendations to livestock producers, enabling them to make informed decisions that reduce GHG emissions. Opportunities to mitigate GHG emissions from livestock farming include enhancements in enteric fermentation through improvements in feed quality and digestibility, management of feed production, including its origin, effective manure management encompassing collection, storage, and recycling, as well as the management of animal health [10]. By optimizing feed efficiency, manure management, energy usage, and farm management practices, DSS contributes to sustainable and environmentally friendly production systems [11]. Precision feeding using data and technology to make informed decisions about feeding practices is already frequently employed in pig farming. This approach not only saves costs but also contributes to the reduction of GHG emissions associated with livestock management [12]. Unlike the monitoring of animal health, achieving GHG reduction requires data from the entire farm [13]. DSS designed to address GHG mitigation in livestock production include tools such as the Carbon Navigator [14] and the scenario analysis tool Holos [15]. Additionally, the AgRECalc tool provides general recommendations for mitigating GHG emissions [13]. DSS enables farms to make immediate decisions for reducing GHG emissions while also aligning with long-term sustainability goals. It is noteworthy to emphasize that the efficiency of the DSS as an information system relies on various factors, such as data quality, user expertise, and interfaces [16,17]. However, for a successful introduction, especially the acceptance as well as the satisfaction of the end-users is required [18]. For the introduction of new technologies, cultural factors (e.g., acceptance and opinion formation) should be considered in addition to ecological (e.g., environmental impact) and economic (e.g., financing) aspects. In agriculture, it will remain an individual decision whether and how to use digital technologies until actors in the value chain (e.g., food retailers or quality assurance systems) demand more digital data transparency or GHG mitigating standards. In this context, the digital transformation for livestock farming is progressing. Knowledge of how technologies can be used enables industry and science to proactively shape the change for sustainable livestock production and meaningfully influence variables in developing what technologies are used for.
If product requirements for technologies are identified and factors influencing customer satisfaction, potential incentives, and barriers to implementing technologies for GHG reduction can be specifically considered during development. However, few studies exist on technological opportunities and requirements for GHG reduction in livestock production. There are still research gaps regarding requirements for digital technologies to reduce GHG emissions from livestock at the farm level. Open research questions include “What requirements do digital applications need for GHG reduction in livestock production?”, “What do farmers expect from modern technologies?” or “Which product features can increase the acceptance of technologies mainly used to reduce GHG emissions?”.
The objective is to better understand the requirements and satisfaction levels of DSS for climate-friendly livestock farming at the farm level. The study involves an analysis of important DSS features and identifies the satisfaction factors relevant to livestock farmers. Livestock owners categorize product requirements based on the Kano model to be able to implement digital products in a targeted and effective manner. This exploration is crucial to guarantee satisfaction with digital technologies and to meet the requirements for effective implementation of modern GHG reduction technologies in the agricultural sector.

2. Materials and Methods

The product this quantitative investigation studies is a digital decision support system (DSS). A DSS is a computer-based program that analyzes and prepares data so that users can make decisions more easily. In this case, decisions relating to reducing GHG emissions from livestock production.

2.1. Participants

The target group of the survey is full-time farmers from Germany who run livestock farms. Included were farms with cattle, poultry, and pigs. To qualify for participation in the study, farms needed to be situated in one of Germany’s 16 federal states. Furthermore, a prerequisite for the study was that the primary agricultural business generates over 50% of its income, specifically from livestock production. Response rates for online surveys in agriculture are often very low [19]. Accordingly, chambers of agriculture associations, research institutions, companies placed in regions with a high livestock density, and print media were contacted to distribute the online survey through several channels and to reach many farms with livestock throughout Germany.

2.2. Survey Questionnaire

The online questionnaire was designed using LimeSurvey (LimeSurvey GmbH, Hamburg, Germany). The survey was open for completion from 7 March to 15 May 2023.
The questionnaire in this study was designed based on the Kano model. The Kano model classifies customer expectations and requirements into six categories, as follows: must-be (M), one-dimensional (O), attractive (A), indifferent quality (I), and reverse quality (R) [20]. Must-be (M) means that the customer will not be interested in the product if it does not have this characteristic. One-dimensional (O) means that the more this feature is offered, the more satisfied customers will be. Attractive (A) characteristics mean that customers will be satisfied if this characteristic is present but will not complain if it is not. Indifferent (I) means that the customers are not interested in this feature. Reverse (R) means that a feature may interact negatively with other relevant features. Questionable (Q) means that questions may not be understood correctly.
Participants were informed about the confidentiality of their involvement and assured that, under no circumstances would any of their personally identifiable information be gathered, disclosed, or published. The questions within the online survey were approved through an internal process in accordance with Article 30 (1) of the GDPR. The integration of a checkbox for consent to data usage, facilitated by the LimeSurvey tool, was a pivotal aspect of this procedure. All data collection forms were strictly confidential and accessible to the researcher only. A total of 14 characteristics were evaluated. Economy attributes included salary (compensation for effort or implemented measures), cost-saving (reduction of resources/working time), and market perspective (marketability of implemented measures). Useful features included work simplification (facilitation of work processes), knowledge transfer (gaining information), multi-target optimization (use of synergy effects), and traceability (understandable use and advice). Operational attributes included integrability (compatibility of devices), recognition (social appreciation), time efficiency (duration of data entry), and traceability (comprehensible use and data entry). Functional qualities included standardization (comparability through certification), data authority (authority to dispose of data), verifiability (control options for measures), and connectivity (connection via a central platform).

2.3. Evaluation of the Characteristics

Answers to the functional and dysfunctional questions were evaluated by each respondent according to the Kano evaluation table and for each characteristic. By combining the responses, product characteristics can be classified. All Kano evaluation criteria are listed in Table 1. The five categories of the model are thereby represented as letters.
The characteristics were determined by selecting the most frequently occurring classification. After categorizing the product characteristics, category strength (CS) and total strength (TS) were calculated [21]. CS was calculated as the percent difference between the highest category and the next highest category. According to the literature, the CS should be higher than 5% to show that a characteristic clearly belongs in this range. TS was calculated as the total percentage of responses in the must-be, one-dimensional, and attractive categories. The TS indicates the extent to which respondents consider a characteristic important. The value should be above 50% for a certain validity.
In addition, the coefficients of satisfaction were calculated. In contrast, a distinction is made between the coefficient of satisfaction (CS+, better) and the coefficient of dissatisfaction (CS−, worse). The CS provides the average impact of a product requirement on the satisfaction of all users or customers as the coefficient indicates how strongly a product’s characteristic impacts customer satisfaction or dissatisfaction [22]. The coefficients (CS+, CS−) values were calculated as shown below:
C S + = A + O ( A + O + M + I )
C S = O + A ( O + M + A + I ) × ( 1 )
To prove the statistical significance of assignment to a category, the Fong test was used [23]. The Fong test classifies a categorization as statistically significant if the following inequality does not apply.
a b < 1.65 × a + b × 2 n a b 2 n
(a)
The total frequency of the most frequently mentioned category;
(b)
The total frequency of the category in second place;
(c)
The total sum of the answers that are analyzed.

3. Results

3.1. Sociodemographic Characteristics of the Participants

In total, 98 German farmers from 10 federal states keeping livestock completed the online questionnaire. Among the respondents, 56.12% were involved in poultry farming (laying hens and broilers), 41.84% engaged in swine farming (fattening pigs and sows), and 51.02% were involved in cattle farming (dairy and fattening bulls). Some farms keep more than one type of species. Of all participants, males accounted for 83.67% of the participants. The average age was 41.99 ± 11.48: 57.14% were between 22 and 45 years old, and 39.80% were between 46 and 72 years old. Three participants did not state their age. Most farms (90.82%) are operated conventionally. Demographic details are shown in Table 2 below.

3.2. Evaluation of the DSS Characteristics

As shown in Table 3, out of fourteen characteristics, a total of five were classified as irrelevant (knowledge transfer, market perspective, traceability, standardization, connectivity), four as one-dimensional (cost saving, work simplification, recognition, integrability), three as must-be (salary, time efficiency, data authority), one as attractive (multi-objective optimization), one as reverse (verifiability), and none as questionable.
When participants’ responses result in similar frequencies of a characteristic’s attributes, further investigation is often necessary to determine significance. Therefore, the study first tested significance using category strength (CS) and total strength (TS) [21]. Subsequently, the sophisticated Fong test was used to test for significance (Sig.) [23]. The results are summarized in Table 4 below.

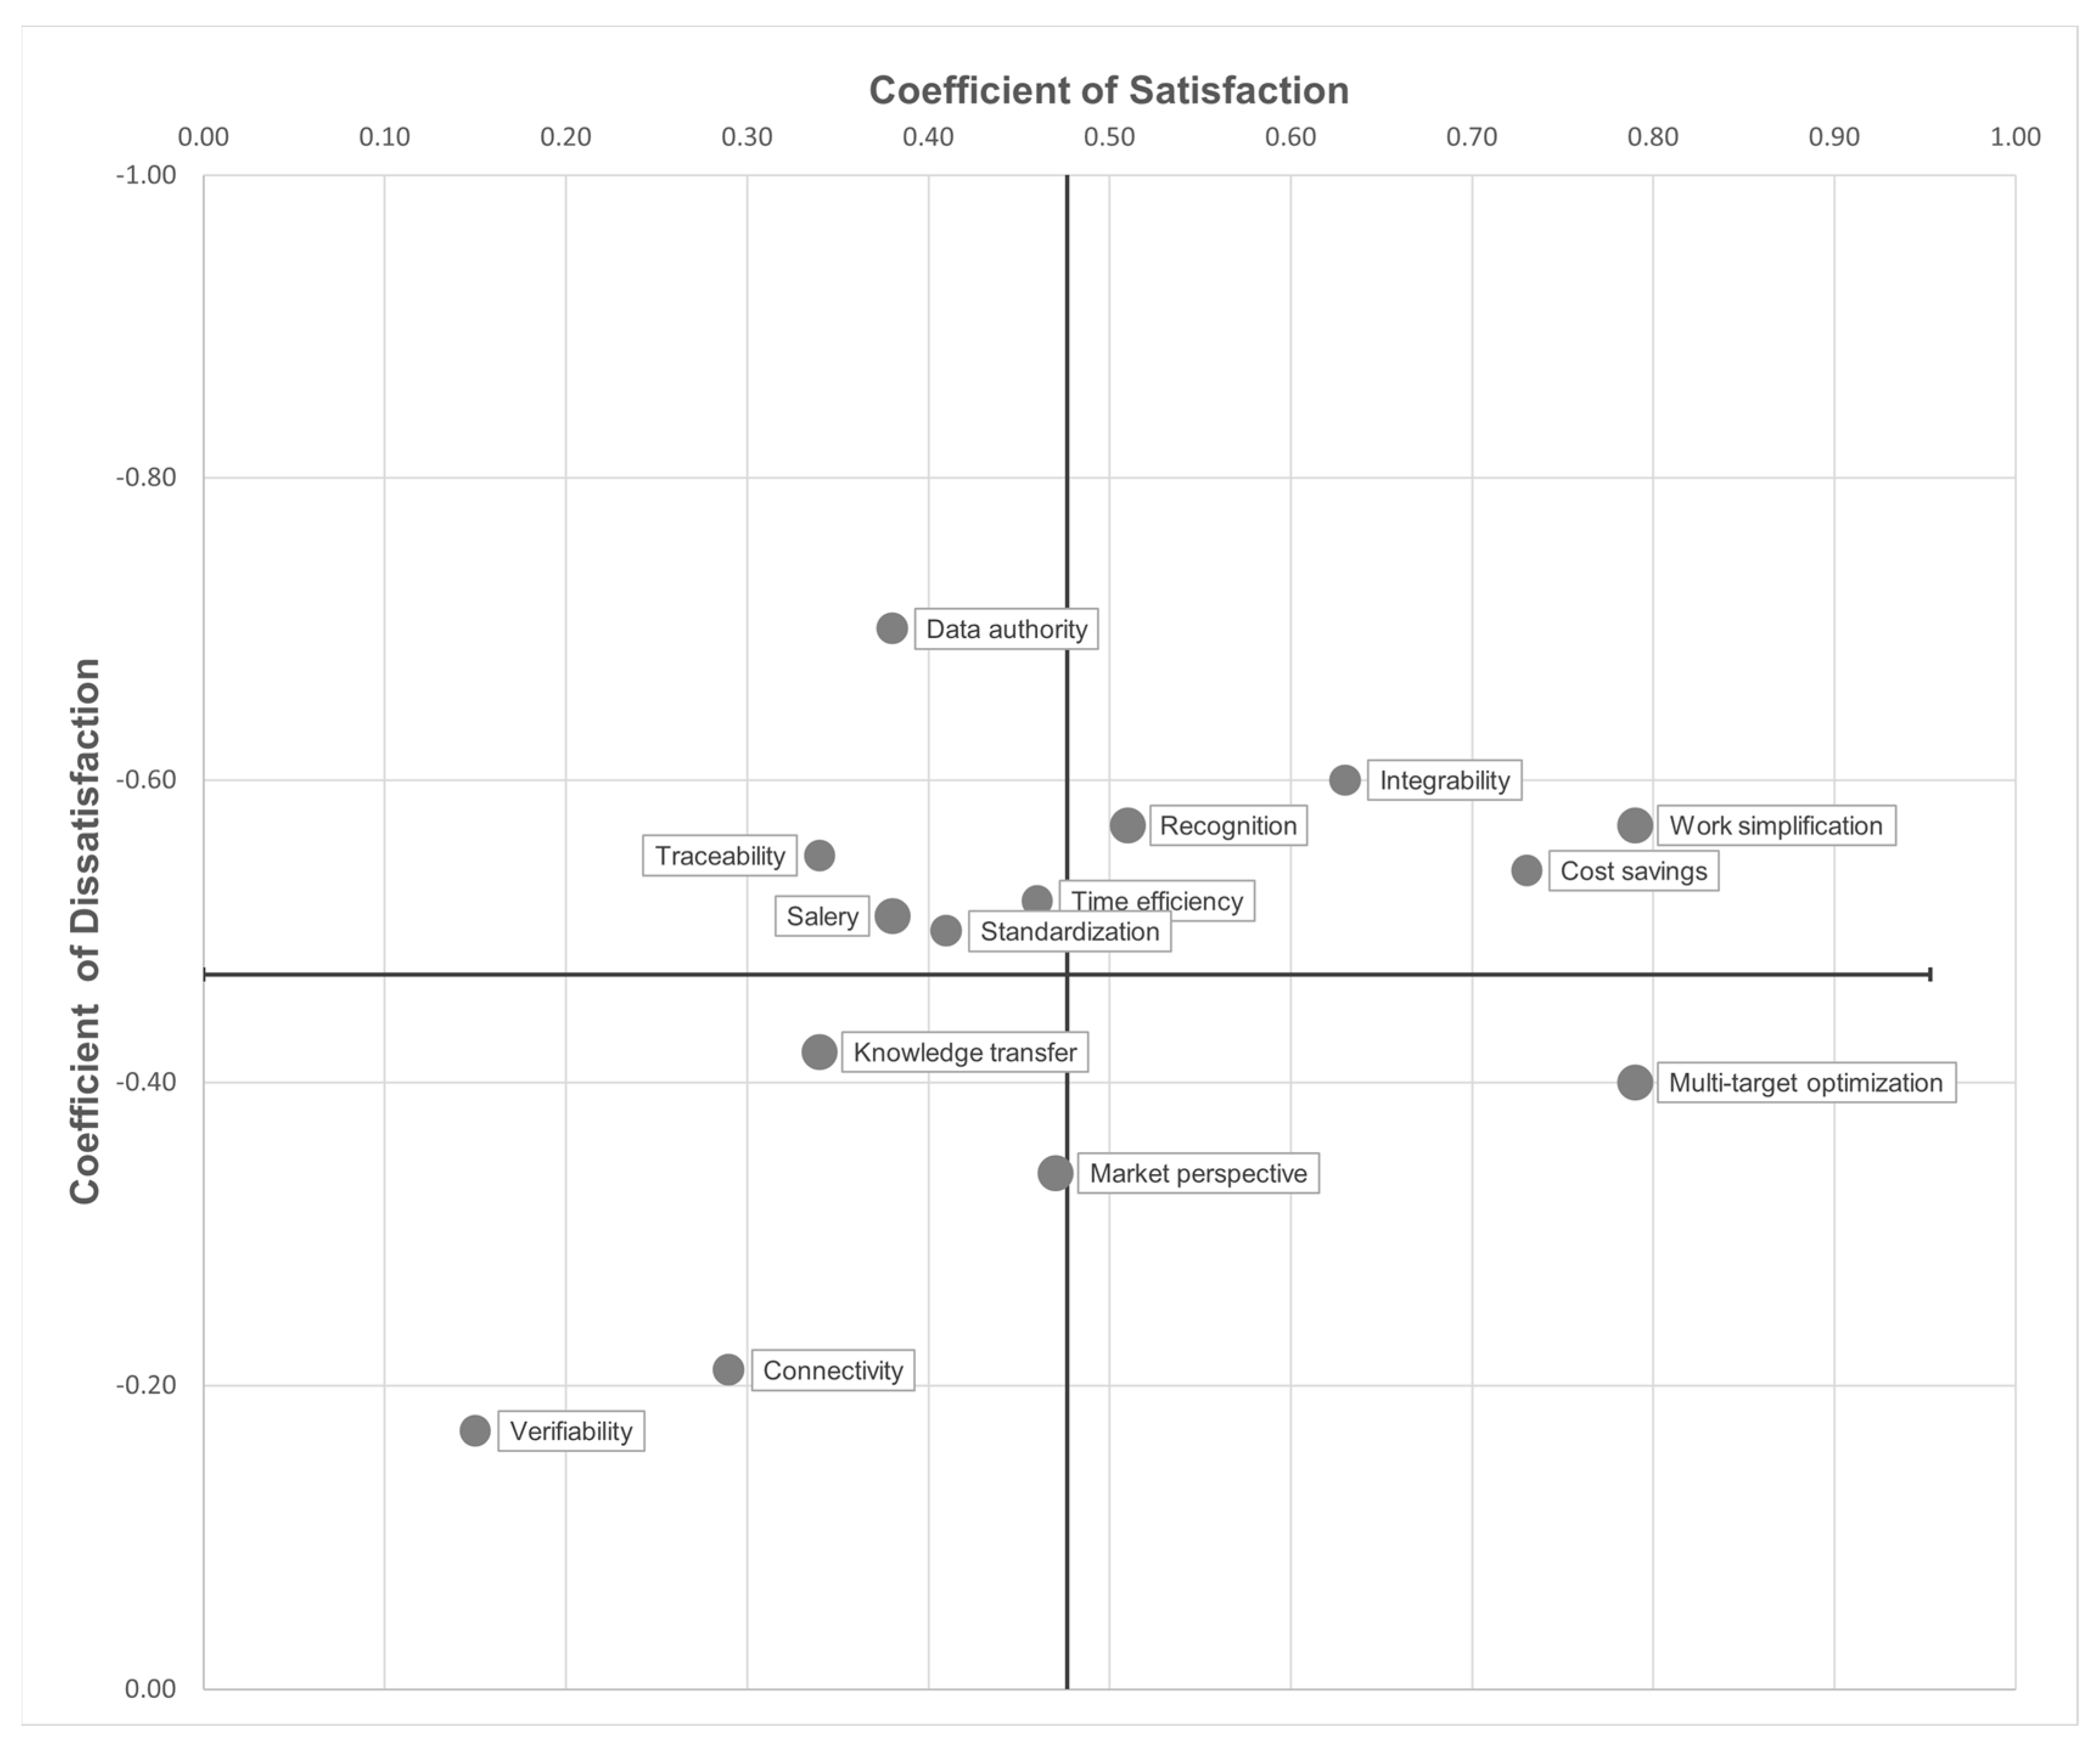
3.3. Satisfaction Coefficients

For an overview, calculated potentials of all characteristics that cause customer satisfaction or dissatisfaction were mapped as a graph (Figure 1). The position of each requirement in the two-dimensional space results from the respective coefficients of satisfaction (X-axis) and dissatisfaction (Y-axis). The dividing lines result from the corresponding mean value for all values of the coefficient. The four resulting fields can be used to represent various approaches for the surveyed animal farmers.
Requirements above the horizontal line (top right and top left) contribute to dissatisfaction, especially in the case of absence. The further away these are from the middle line, the more pronounced the dissatisfaction can be. Accordingly, must-be (top left) or one-dimensional (top right) characteristics can already be identified from this.
Requirements with an above-average effect on satisfaction are in the field at the bottom right. Multi-objective optimization, especially, can lead to satisfaction or even enthusiasm among livestock farmers and could be a differentiating feature for providers.
Finally, at the bottom left of Figure 1 are requirements that, from the perspective of livestock owners, have a below-average influence on satisfaction or dissatisfaction. According to this, knowledge transfer, connectivity, and verifiability hardly affect customer satisfaction.

4. Discussion

Livestock farming is a contributor to greenhouse gas (GHG) emissions, and consequently, livestock farms must significantly reduce their emissions. The extent of GHG emissions from a farm is often determined by specific processes carried out on the farm [24,25]. Technology plays a central role in achieving the internationally agreed ESG goals, in particular SDG goal 13 (climate action), as it offers solutions to mitigate environmental impact. Meanwhile, numerous functional digital approaches, such as decision support systems (DSS), exist for farms to optimize processes at the farm level and reduce GHG emissions [26,27]. However, the successful implementation of these technologies depends not only on their effectiveness but also heavily on user adoption and satisfaction. In addition, implementing DSS often requires users to adopt new practices and change their behavior [28]. Therefore, the effective utilization of environmental benefits from agricultural technologies depends on farmers’ acceptance and active engagement with these tools [29].
The integration of digital technologies for climate protection in animal husbandry presents several challenges, requiring a deep understanding of operational processes and adaptation to farm-specific needs. Customer perception, as measured by quality, is a subjective judgment made by users [30]. When users are satisfied with the DSS and the characteristics it provides, they are more likely to embrace and implement the recommended changes in their farming or production practices, such as adjusting feed formulations, optimizing manure management, or adopting energy-efficient technologies. Therefore, customer satisfaction is vital for the successful implementation of DSS in reducing GHG emissions. It drives user adoption, facilitates behavioral change, encourages long-term engagement, and may promote knowledge sharing within the industry. Ultimately, satisfied customers are more likely to embrace the DSS and actively contribute to achieving desired environmental and sustainability goals. Customer satisfaction feedback is, therefore, valuable for improving technologies such as DSS itself. The influence of the Kano model has thus shown an upward trend in recent years [31]. By incorporating customer feedback using the Kano model, developers and researchers could continuously improve DSS, ensuring it meets the users’ needs and expectations. This iterative process would contribute to long-term customer satisfaction and the system’s value in reducing GHG emissions. However, the Kano model is hardly ever used for agricultural questions. Only one publication has used this method for research on agricultural intelligent robot design solutions [32]. Consequently, this study primarily emphasizes identifying the essential requirements of digital approaches that significantly influence customer satisfaction and end-user usage behavior. A total of 14 key product characteristics for DSS aimed at reducing GHG emissions in livestock were evaluated using the Kano model. The DSS characteristics were categorized by farmers, revealing six attributes with a significant impact on customer satisfaction.
Basic requirements, categorized as must-be, represent fundamental attributes inherent in services or products. Users perceive these as essential features that are expected or indispensable [33]. The Kano categories adhere to a hierarchical structure based on the impact of these attributes on customer satisfaction or dissatisfaction. Must-be features impact satisfaction most, followed by one-dimensional, attractive, and irrelevant factors [34]. In the present survey, a significant feature identified by farmers is data authority, signifying their sovereignty over data. It is already known that unclear data security, especially data authority, is perceived as a barrier in agriculture [35]. However, companies face substantial challenges in addressing security issues, which are extensively debated in the media [36]. Consequently, the farmer’s demand to retain data authority is not surprising. However, the comprehensive sharing of data is a prerequisite for evaluating interventions. The potential risk of data misuse introduces legal and ethical challenges for regulatory oversight [37]. Data sharing may become particularly complicated when the perceived value is not apparent, potentially stemming from a knowledge gap regarding digitalization’s benefits and added value. Addressing this gap may necessitate the involvement of educational and training institutions. The results are relevant for political decision-makers, as the framework conditions significantly impact the adoption of digital products by farmers. Beyond facilitating widespread broadband coverage, interventions should be implemented to address and clarify data security and authority concerns. This suggestion is in line with a previous study, as it has been proven that trust along the production chain is considered important and a prerequisite for using technologies [38]. Another significant characteristic within the must-be category relates to salary (compensation for efforts) associated with the reduction of GHG emissions. In agriculture, economic performance plays a central role in the adoption of technologies or systems. Economic factors are even considered one of the main reasons for farmers to adopt ‘Smart Farming’ technologies [39]. The potentially high costs linked to the implementation of intelligent products, coupled with farmers’ limited skills and knowledge, pose a conceivable hurdle to successful integration [40]. This is particularly true for smaller farms, where technology costs per livestock unit may be higher, and the prospect of a costly acquisition could be hindering. A crucial question is whether access to the latest technologies will be limited to large and industrialized farms. This emphasizes the need to address potential barriers to adoption, especially for smaller and less economically robust farms. Another challenge will be aligning the competencies and skills of farmers with these new technologies [5]. Knowledge acquisition occurs through various methods, including engaging in field trials and pilot projects, seeking support from agricultural extension services for solutions to common challenges, and participating in governmental programs. By combining these approaches, farmers can improve their competencies and skills, facilitating a smoother adoption and adaptation to new technologies.
Nevertheless, achieving satisfaction through fulfilling must-be characteristics alone is insufficient. To compete in the market, it is also necessary to deliver quality for one-dimensional features. This is crucial because customer satisfaction increases with fulfilled performance requirements (one-dimensional) and increasing performance qualities [41]. Conversely, an insufficient offering leads to dissatisfaction. One-dimensional features exhibit a linear relationship with customer satisfaction and should be met at a minimum level [42]. This study identified integrability (compatibility of devices) as a crucial one-dimensional feature. Integrability implies seamless collaboration between different systems and is synonymous with interoperability. A few years ago, interoperability in the supply chain of the agricultural and food industry was limited [43]. Today, the implementation of digital products still faces challenges due to the lack of system integration. The issue is also seen in the healthcare sector [44]. For end-users, interoperability often relates to practical application and usability. In one study, an app’s technical suitability and practicability were analyzed as one-dimensional features [45]. That shows that interoperability is not only crucial for satisfaction but also for the effective deployment of digital solutions in animal husbandry. Hence, the establishment of industry-wide standards for data formats, communication protocols, and interfaces is crucial for seamless communication among agricultural technologies. This is essential for the effective use of DSS and plays a pivotal role in reducing GHG emissions in agriculture.
Appealing (attractive) characteristics have the potential to pleasantly surprise users and enhance their satisfaction when present. However, the absence of these features does not necessarily lead to user dissatisfaction [46]. In the pursuit of quality in products and services, attractive features play a significant role, as they are likely to increase user satisfaction without influencing dissatisfaction [47]. Therefore, the introduction of attractive features is associated with low risk. During the evaluation, multi-objective optimization (utilization of synergy effects) was identified as a crucial attractive characteristic with a satisfaction coefficient exceeding 0.7. This underscores its importance for farmers. For example, decisions regarding the application of optimal farming practices for climate protection heavily depend on economic benefits. For instance, precision feeding can save costs while simultaneously reducing GHG emissions from livestock farming [12]. There are numerous other management measures with synergy effects [48]. It is crucial to highlight that demand and supply actions can trigger diverse feedback loops, resulting in various synergies. Potential goal conflicts may also emerge when an effort to achieve positive outcomes in one aspect (demand or supply) inadvertently impedes or undermines goals in the other aspect. This highlights the importance of carefully managing and balancing actions on both sides for overall sustainability and effectiveness.
Insignificant (indifferent) features are services or characteristics that are inconsequential to users. Whether these are provided or not is therefore irrelevant to customer satisfaction or dissatisfaction [49]. In this study, two characteristics were classified as insignificant. Networking (connection through a central platform) is a feature that has no bearing on the satisfaction or dissatisfaction of livestock farmers. However, networking involves data sharing, thus making data security a crucial factor. As mentioned before, data authority is identified as a must-be feature, rendering networking unappealing in the absence of data sovereignty. Previous studies also support that unclear data protection poses a barrier for German farmers [35,37,40]. Consequently, a platform for sharing would be more appealing if robust data security measures were realized. The second indifferent characteristic identified is the market perspective (promotion of measures). However, while there are challenges in terms of costs and market dynamics, reducing GHG emissions in livestock farming also presents opportunities for market differentiation, access to premium markets, and alignment with customer preferences for sustainable products. Thus, the market perspective has been highlighted previously as a notable incentive for businesses, as the potential of labels for implementing animal welfare measures was assessed [50,51]. However, in this study, the market perspective seems to be irrelevant for farmers. This could be attributed to the fact that few farmers market their end products themselves, with only 18% of German farmers utilizing direct marketing as an additional source of income [52]. Nevertheless, the market perspective could enhance agriculture’s recognition (social appreciation). While recognition did not emerge as a statistically significant one-dimensional feature in the Fong test, the product feature exhibited a category strength of 8.2%, indicating to be a feature expected by most of the farmers. The recognition of agriculture in society seems to play a relevant role in opening new markets and the maintenance of market structures. A study on participation in animal welfare programs demonstrated that societal pressure exerts discomfort on livestock keepers [53]. It was shown that social influence from colleagues, friends, and family can shape decisions for sustainable agriculture [54]. For instance, family members play a crucial role in strategic decisions [55]. The experience of colleagues with new technologies can also influence farmers’ future adoption of technologies [56]. The importance of familiar social contacts and interaction with colleagues in successfully implementing technologies is explained by their learning processes primarily occurring on a social level [57]. Hence, social connections are of great significance. Their impact may become even more apparent in the decision-making process for adopting DSS when there is a rise in critical voices within society. This, in turn, affects the market prospects. A positive attitude society regarding livestock farming also impacts acceptance and actual behavior [58]. However, livestock farmers are not a homogeneous group regarding their attitudes. The significance of operational and sociodemographic characteristics of farmers, such as education or age, has been explored in other studies [59,60]. It has been shown that farm size influences behavioral intention and technology usage behavior [59]. Therefore, comparing farm sizes and different age groups would have been interesting. However, due to incomplete responses from participants, the analysis of this information was not feasible in the study.
Unlike other methods, the Kano model supports the ‘ex ante’ application and identifies product criteria impacting satisfaction. Thus, the model translates the ‘Voice of the Customer’ into critical quality characteristics [61]. It also provides a good understanding of customer requirements by distinguishing between must-be, one-dimensional, and attractive requirements. However, despite its advantages, the Kano model has limitations, including question ambiguity and a focus on qualitative satisfaction, neglecting manufacturer capabilities. In response to this, an analytical Kano model (A-Kano model) was developed, considering quantitative measurements [62]. The present study, however, maintained the original Kano model due to its adequacy for categorizing requirements. Statistical significance was verified using the Fong test, which has been used in several studies and is considered a reliable and valid test for significance [63,64]. It should be noted that this study’s results mainly represent a limited number of farmers, and while it was designed to be extended. The focus is on farmers in Germany using a questionnaire survey and does not, therefore, account for customer needs in other countries. While online surveys are favored for their popularity and cost-effectiveness, it is crucial to acknowledge their methodological limitations. The challenge in providing precise participant descriptions and the potential for bias in samples underscores the need for careful validation of results. Furthermore, the Kano model may face limitations related to unclear question formulation. To mitigate this concern, a pretest was conducted with farmers to ensure the clarity and understanding of the survey questions. Additionally, it’s important to recognize that the evaluation of survey features can change with evolving customer perceptions, introducing potential instability in long-term results. In addition, the study adopts a closed questionnaire method to explore customer views of DSS quality, and the exclusion of certain factors may have weakened the explanatory power. Future research should examine other characteristics affecting DSS quality to ensure the effective transformation to GHG-reduced livestock production. For a more effective quantitative comparison, it would be advantageous to incorporate a ranking system based on the overall satisfaction index, an aspect that could be considered in future studies. Another limitation is the fact that the Kano model captures customer expectations for technologies but can only partially explain the reasons for acceptance or rejection. Acceptance is expressed in a positive attitude and the willingness to use and apply it in specific situations [65]. Therefore, acceptance is a context-dependent process. Integrating the Kano model with acceptance models like the Technology Acceptance Model (TAM) or Unified Theory of Acceptance and Use of Technology (UTAUT) could help precisely explain why users accept or reject a technology [66]. This integration could lead to more targeted and successful technology developments, aligning technologies with diverse user needs by combining individual preferences with customer expectations.

5. Conclusions

Livestock farms are required to significantly mitigate GHG emissions by 2030, responding to environmental concerns and the agricultural challenges posed by climate change. The urgency of climate change suggests increased investment in technology supporting sustainable agriculture. The present study examined DSS requirements targeting reducing GHG emissions on livestock farms. The research demonstrated that the Kano model is applicable to livestock farming, providing valuable and interpretable data. None of the features were designated as questionable. Key findings include the importance of data sovereignty and financial compensation for farmers. To ensure successful DSS implementation, future efforts should focus on creating monetary incentives and ensuring data protection collaboratively between policymakers and the market. The study also emphasized the significance of multi-target optimization and the need for DSS to recognize and communicate synergies. Integrability was highlighted as a key one-dimensional criterion, while features like market perspective and networking were found to be irrelevant for farmers. If data authority becomes less challenging, the two indifferent characteristics may be categorized differently. The insights gained can inform market-oriented product development strategies and prioritize aspects crucial for user satisfaction. However, further research is needed to validate the Kano model’s applicability to other agricultural technologies globally. Early understanding of customer needs is fundamental, considering evolving trends. Regular Kano model surveys are necessary for contemporary DSS design. Future research should explore the impact of various features to ensure an effective transition to DSS for the reduction of GHG emissions. While the Kano model provides user perception insights, combining it with an acceptance model like UTAUT could offer a more complete understanding of satisfaction or dissatisfaction triggers.

Author Contributions

P.M.: data processing and validation, formal analysis, and writing the original and final draft. B.G.: conceptualization, reviewing, and supervision. All authors have read and agreed to the published version of the manuscript.

Funding

This research received no external funding.

Institutional Review Board Statement

Not applicable.

Informed Consent Statement

Not applicable.

Data Availability Statement

The data presented in this study are available upon request from the corresponding author. The data are not publicly available due to data privacy reasons on farms.

Acknowledgments

The authors thank all interview partners and farms that were involved in this investigation.

Conflicts of Interest

The authors declare no conflicts of interest.

References

  1. Transforming our World: The 2030 Agenda for Sustainable Development. United Nations (UN). A/RES/70/1. 2015. Available online: https://sustainabledevelopment.un.org/content/documents/21252030%20Agenda%20for%20Sustainable%20Development%20web.pdf (accessed on 7 September 2022).
  2. Manabe, S. Role of greenhouse gas in climate change. Tellus A Dyn. Meteorol. Oceanogr. 2015, 71, 1620078. [Google Scholar] [CrossRef]
  3. Beitrag der Landwirtschaft zu den Treibhausgas-Emissionen. Umweltbundesamt (UBA). Available online: https://www.umweltbundesamt.de/daten/land-forstwirtschaft/beitrag-der-landwirtschaft-zu-den-treibhausgas#klimagase-aus-der-viehhaltung (accessed on 7 September 2022).
  4. Gerber, P.J.; Steinfeld, H.; Henderson, B.; Mottet, A.; Opio, C.; Dijkman, J.; Falcucci, A.; Tempio, G. Scope for mitigation. In Tackling Climate Change through Livestock—A Global Assessment of Emissions and Mitigation Opportunities; Food and Agriculture Organization (FAO) of the United Nations: Rome, Italy, 2013; pp. 45–53. [Google Scholar]
  5. Walter, A.; Finger, R.; Huber, R.; Buchmann, N. Opinion: Smart farming is key to developing sustainable agriculture. Proc. Natl. Acad. Sci. USA 2017, 114, 6148–6150. [Google Scholar] [CrossRef] [PubMed]
  6. Aubert, B.A.; Schroeder, A.; Grimaudo, J. IT as enabler of sustainable farming: An empirical analysis of farmers’ adoption decision of precision agriculture technology. Decis. Support Syst. 2012, 54, 510–520. [Google Scholar] [CrossRef]
  7. Rios, H.V.; Waquil, P.D.; de Carvalho, P.S.; Norton, T. How are Information Technologies Addressing Broiler Welfare Quality? A Systematic Review Based on the Welfare Quality Assessment Sustainability. Sustainability 2020, 12, 1413. [Google Scholar] [CrossRef]
  8. Krehbiel, C. The role of new technologies in global food security: Improving animal production efficiency and minimizing impacts. Anim. Front. 2013, 3, 4–7. [Google Scholar] [CrossRef]
  9. Balafoutis, A.; Beck, B.; Fountas, S.; Vangeyte, J.; van der Wal, T.; Soto, I.; Gómez-Barbero, M.; Barnes, A.; Eory, V. Precision Agriculture Technologies Positively Contributing to GHG Emissions Mitigation, Farm Productivity and Economics. Sustainability 2017, 9, 1339. [Google Scholar] [CrossRef]
  10. Grossi, G.; Goglio, P.; Vitali, A.; Williams, A.G. Livestock and climate change: Impact of livestock on climate and mitigate strategies. Anim. Front. 2018, 9, 69–76. [Google Scholar] [CrossRef] [PubMed]
  11. Niloofar, P.; Francis, D.P.; Lazarova-Molnar, S.; Vulpe, A.; Vochin, M.-C.; Suciu, G.; Balanescu, M.; Anestis, V.; Bartzanas, T. Data-Driven Decision Support in Livestock Farming for Improved Animal Health, Welfare and Greenhouse Gas Emissions: Overview and Challenges. Comput. Electron. Agric. 2021, 190, 106406. [Google Scholar] [CrossRef]
  12. Andretta, I.; Hickmann, F.M.W.; Remus, A.; Franceschi, C.H.; Mariani, A.B.; Orso, C.; Kipper, M.; Letourneau-Montminy, M.-P.; Pomar, C. Environmental Impacts of Pig and Poultry Production: Insights from a Systematic Review. Front. Vet. Sci. 2021, 8, 750733. [Google Scholar] [CrossRef]
  13. Rotz, C.A. Symposium review: Modeling greenhouse gas emissions from dairy farms. J. Dairy Sci. 2018, 101, 6675–6690. [Google Scholar] [CrossRef]
  14. Murphy, P.; Crosson, P.; O’Brien, D.; Schulte, R. The Carbon Navigator: A Decision Support Tool to Reduce Greenhouse Gas Emissions from Livestock Production Systems. Animal 2013, 7, 427–436. [Google Scholar] [CrossRef] [PubMed]
  15. Larios, A.D.; Brar, S.K.; Ramirez, A.A.; Godbout, S.; Sandoval-Salas, F.; Palacios, J.H. Challenges in the measurement of emissions of nitrogen and methane from livestock sector. Rev. Environ. Sci. Biotechnol. 2016, 15, 285–297. [Google Scholar] [CrossRef]
  16. Fayoumi, A.G. Evaluating the Effectiveness of Decision Support System: Findings and Comparison. Int. J. Adv. Comput. Sci. Appl. 2018, 9, 195–200. [Google Scholar] [CrossRef]
  17. Petter, S.; DeLone, W.H.; McLean, E.R. Measuring information systems success: Models, dimensions, measures, and interrelationships. Eur. J. Inf. Syst. 2008, 17, 236–263. [Google Scholar] [CrossRef]
  18. Kijsanayotin, B.; Pannarunothai, S.; Speedie, S.M. Factors influencing health information technology adoption in Thailand’s community health centers; Applying the UTAUT model. Int. J. Med. Inform. 2009, 3, 404–416. [Google Scholar] [CrossRef] [PubMed]
  19. Gindele, N.; Kaps, S.; Doluschitz, R. Strukturelle Veränderungen in der Landwirtschaft—Reaktionen der landwirtschaftlichen Betriebsleiter sowie Konsequenzen für den Landwirt als Unternehmer. J. Socio-Econ. Agric. 2015, 8, 11–20. [Google Scholar]
  20. Kano, N.; Seraku, N.; Takahashi, F.; Tsuhi, S. Attractive quality and must-be quality. J. Jpn Soc. Qual. Control 1984, 14, 39–48. [Google Scholar]
  21. Lee, M.C.; Newcomb, J.F. Applying the Kano Methodology to Meet Customer Requirements: Nasa’s Microgravity Science Program. Qual. Manag. J. 1998, 4, 95–110. [Google Scholar] [CrossRef]
  22. Karpe, N.; Scharf, A. Ermittlung reevanter Determinaten der Kundenzufriedenheit mittels Kano-Modell: Dargesellt am Beispiel der Dienstleistungen von Immobilienmaklern. In Nordhäuser Hoschschultexte Betriebswirtschaft; Heft 1, Hrsg.; FH Nordhausen: Nordhausen, Germany, 2006; p. 10. [Google Scholar]
  23. Fong, D. Using the self-stated importance questionnaire to interpret Kano questionnaire results. Cent. Qual. Manag. J. 1996, 5, 21. [Google Scholar]
  24. Aarts, H.F.M.; Biewinga, E.E.; van Keulen, H. Dairy farming systems based on efficient nutrient management. Neth. J. Agric. Sci. 1992, 40, 285–299. [Google Scholar] [CrossRef]
  25. Ondersteijn, C.J.M.; Harsh, S.B.; Giesen, G.W.J.; Beldman, A.C.G. Management strategies on Dutch dairy farms to meet environmental regulations; a multi-case study. NJAS—Wageningen. J. Life Sci. 2002, 50, 47–65. [Google Scholar]
  26. Thumba, D.A.; Lazarova-Molnar, S.; Niloofar, P. Estimating Livestock Greenhouse Gas Emissions: Existing Models, Emerging Technologies and Associated Challenges. In Proceedings of the 6th International Conference on Smart and Sustainable Technologies (SpliTech), Bol and Split, Croatia, 8–11 September 2021. [Google Scholar]
  27. Thumba, D.A.; Lazarova-Molnar, S.; Niloofar, P. Comparative evaluation of data requirements and level of decision support provided by decision support tools for reducing livestock-related greenhouse gas emissions. J. Clean. Prod. 2022, 373, 133886. [Google Scholar] [CrossRef]
  28. Klein, K.J.; Sorra, J.S. The Challenge of Innovation Implementation. Acad. Manag. Rev. 1996, 21, 1055–1080. [Google Scholar] [CrossRef]
  29. Hansson, H.; Lagerkvist, C.J. Defining and measuring farmers’ attitudes to farm animal welfare. Anim. Welf. 2014, 23, 47–56. [Google Scholar] [CrossRef]
  30. Parasuraman, A.; Zeithaml, V.A.; Berry, L.L. SERVQUAL: A multiple-item scale for measuring customer perceptions of service quality. J. Retail. 1988, 64, 12–40. [Google Scholar]
  31. Luor, T.; Lu, K.-P.; Chien, K.-M.; Wu, T.-C. Contribution to quality research: A literature review of Kano’s model from 1998 to 2012. Total Qual. Manag. Bus. Excell. 2012, 26, 234–247. [Google Scholar] [CrossRef]
  32. Tang, G.; Luo, Y.-W.; Wu, W. Research on the evaluation method of agricultural intelligent robot design solutions. PLoS ONE 2023, 18, e0281554. [Google Scholar] [CrossRef] [PubMed]
  33. Kermanshachi, S.; Nipa, T.J.; Nadiri, H. Service quality assessment and enhancement using Kano model. PLoS ONE 2022, 17, e0264423. [Google Scholar] [CrossRef]
  34. Timko, M. An experiment in continuous analysis. Cent. Qual. Manag. J. 1993, 2, 17–20. [Google Scholar]
  35. Schukat, S.; Heise, H. Smart Products in Livestock Farming—An Empirical Study on the Attitudes of German Farmers. Animals 2021, 11, 1055. [Google Scholar] [CrossRef]
  36. Raimundo, R.; Rosario, A. The impact of Artifical Intelligence on Data System Security: A Literature Review. Sensors 2021, 21, 7029. [Google Scholar] [CrossRef] [PubMed]
  37. Charo, R.A. Yellow lights for emerging technologies. Science 2015, 349, 384–385. [Google Scholar] [CrossRef] [PubMed]
  38. Hallerman, E.M.; Bredlau, J.P.; Camargo, L.S.; Dagli, M.L.Z.; Karembu, M.; Ngure, G.; Romero-Aldemita, R.; Rocha-Salavarrieta, P.J.; Tizard, M.; Walton, M.; et al. Towards progressive regulatory approaches for agricultural applications of animal biotechnology. Transgenetic Res. 2022, 31, 167–199. [Google Scholar] [CrossRef]
  39. Wolfert, S.; Ge, L.; Verdouw, C.; Bogaardt, M.J. Big Data in Smart Farming—A Review. Agric. Syst. 2017, 153, 69–80. [Google Scholar] [CrossRef]
  40. Kutter, T.; Tiemann, S.; Siebert, R.; Fountas, S. The role of communication and co-operation in the adoption of precision farming. Precis. Agric. 2011, 12, 2–17. [Google Scholar] [CrossRef]
  41. Chen, W.K.; Chang, J.R.; Chen, L.S.; Hsu, R.Y. Using refined Kano model and decision trees to discover learners’ needs for teaching videos. Multimed. Tools Appl. 2022, 81, 8317–8347. [Google Scholar] [CrossRef]
  42. Sauerwein, E. Das Kano-Modell der Kundenzufriedenheit. Reliabilität und Validität Einer Methode zur Klassifizierung von Produkteigenschaften, 2000th ed.; Deutscher Universitäts-Verlag: Wiesbaden, Germany, 2000; p. 28. [Google Scholar]
  43. Serazetdinova, L.; Garratt, J.; Baylis, A.; Stergiadis, S.; Collison, M.; Davis, S. How should we turn data into decisions in AgriFood? J. Sci. Food Agric. 2019, 99, 3213–3219. [Google Scholar] [CrossRef]
  44. Li, B.; Clarke, J.; Ashrafian, H.; Darzi, A.; Neves, A.L. The Impact of Electronic Health Record Interoperability on Safety and Quality of Care in High-Income Countries: Systematic Review. J. Med. Internet Res. 2022, 24, e38144. [Google Scholar] [CrossRef]
  45. Malinka, C.; von Jan, U.; Albrecht, U.-V. Priotization of Quality Principles for Health Apps Using the Kano Model: Survey Study. JMIR mHealth uHealth 2022, 10, e26563. [Google Scholar] [CrossRef] [PubMed]
  46. Zoghi, M.; Rostami, G.; Khoshand, A.; Motalleb, F. Material selection in design for deconstruction using Kano model, fuzzy-AHP and TOPSIS methodology. Waste Manag. Res. 2022, 40, 410–419. [Google Scholar] [CrossRef]
  47. Witell, L.; Löfgren, M. Classification of quality attributes. Manag. Serv. Qual. 2007, 17, 54–73. [Google Scholar] [CrossRef]
  48. Smith, P.; Haberl, H.; Popp, A.; Erb, K.-H.; Lauk, C.; Harper, R.; Tubiello, F.; de Siqueira Pinto, H.; Jafari, M.; Shi, S.; et al. How much land-based greenhouse gas mitigation can be achieved without compromising food security and environmental goals? Glob. Chang. Biol. 2013, 19, 2285–2302. [Google Scholar] [CrossRef] [PubMed]
  49. Bella, R.L.F.; Quelhas, O.L.G.; Ferraz, F.T.; Barboza, D.V.; França, S.L.B. An initial approach to increase job satisfaction through workplace spirituality. Front. Psychol. 2021, 12, 768290. [Google Scholar] [CrossRef]
  50. Kühl, S.; Gassler, B.; Spiller, A. Labeling strategies to overcome the problem of niche markets for sustainable milk products: The example of pasture-raised milk. J. Dairy Sci. 2017, 100, 5082–5096. [Google Scholar] [CrossRef]
  51. Thompson, P.; Harris, C.; Holt, D.; Pajor, E.A. Livestock welfare product claims: The emerging social context. J. Anim. Sci. 2007, 85, 2354–2360. [Google Scholar] [CrossRef]
  52. Zusätzliche Einkommensquellen von Landwirtschaftsbetrieben. Statista. 2022. Available online: https://de.statista.com/statistik/daten/studie/1264633/umfrage/zusaetzliche-einkommensquellen-von-landwirtschaftsbetrieben-nach-art/ (accessed on 18 June 2023).
  53. Heise, H.; Theuvsen, L. Welche Tierwohlmaßnahmen sollten in einem Tierschutzprgramm umgesetzt werden? Eine Stakeholder Analyse. Ger. J. Agric. Econ. 2017, 66, 245–264. [Google Scholar]
  54. Kuczera, C. Landwirtschaftliche Handlungsentscheidungen: Sozialer Kontext und Prozess. In Der Einfluss des Sozialen Umfeldes auf Betriebliche Entscheidungen von Landwirten; Margraf Publishers: Weikersheim, Germany, 2006; pp. 9–24. [Google Scholar]
  55. Bahner, T. Landwirtschaftliche Betriebgestaltung nach persönlichen Zielen. Agrarwirtschaft 1995, 44, 343–349. [Google Scholar]
  56. Foster, A.; Rosenzweig, M.R. Learning by Doing and Learning from Others: Human Capital and Technical Change in Agriculture. J. Political Econ. 1995, 103, 1176–1209. [Google Scholar] [CrossRef]
  57. Eastwood, C.; Klerkx, L.; Ayre, M.; Dela Rue, B. Managing Socio-Ethical Challenges in the Development of Smart Farming: From a Fragmented to a Comprehensive Approach for Responsible Research and Innovation. J. Agric. Environ. Ethics 2019, 32, 741–768. [Google Scholar] [CrossRef]
  58. von Hardenberg, L.; Heise, H. German Pig Farmers’ attitudes towards animal welfare programs and their willingness to participate in these programs: An empirical study. J. Food Syst. Dyn. 2018, 9, 280–301. [Google Scholar]
  59. McBride, W.D.; Daberkow, S.G. Information and the adoption of precision farming technologies. J. Agribus. 2003, 21, 31–38. [Google Scholar]
  60. Kitchen, N.R.; Snyder, C.J.; Franzen, D.W.; Wiebold, W.J. Educational needs of precision agriculture. Precis. Agric. 2002, 3, 341–351. [Google Scholar] [CrossRef]
  61. Salah, S.; Rahim, A.; Carretero, J.A. Kano-based Six Sigma utilizing quality function deployment. Int. J. Qual. Eng. Technol. 2010, 1, 206–230. [Google Scholar] [CrossRef]
  62. Xu, X.; Sharma, P.; Shu, S.; Lin, T.-S.; Ciais, P.; Tubiello, F.; Smith, P.; Cambell, N.; Jain, A.K. Global greenhouse gas emissions from animal-based foods are twice those of plant-based foods. Nat. Food 2021, 2, 724–732. [Google Scholar] [CrossRef] [PubMed]
  63. Gimpel, H.; Kleindienst, D.; Nüske, N.; Rau, D.; Schmied, F. The upside of data privacy–delighting customers by implementing data privacy measures. Electron. Mark. 2018, 28, 437–452. [Google Scholar] [CrossRef]
  64. Zhao, M.; Dholakia, R.R. A multi-attribute model of web site interactivity and customer satisfaction: An application of the Kano model. Managing Service Quality. Int. J. 2009, 19, 286–307. [Google Scholar]
  65. Davis, F.D. Perceived Usefulness, Perceived Ease of Use, and User Acceptance of Information Technology. MIS Q. 1989, 13, 319–410. [Google Scholar] [CrossRef]
  66. Venkatesh, V.; Morris, M.G.; Davis, G.B.; Davis, F.D. User Acceptance of Information Technology: Toward a Unified View. MIS Q. 2003, 27, 425–478. [Google Scholar] [CrossRef]
Figure 1. Illustration of the satisfaction and disinfection potentials.
Sustainability 16 00268 g001
Table 1. Kano evaluation criteria.
FunctionalDysfunctional
I like it that wayIt must be that wayI am neutralI can live with itI dislike it that way
I like it that wayQAAAO
It must be that wayRIIIM
I am neutralRIIIM
I can live with itRIIIM
I dislike it that wayRRRRQ
M = Must-be, O = One-dimensional, A = Attractive, I = Indifferent, R = Reverse, Q = Questionable.
Table 2. Distribution of participants’ sociodemographic characteristics.
CharacteristicsObservation (n)Percentage (%)
Gender
Male8283.67%
Female1717.35%
Age Group
22–455657.14%
46–723939.80%
--33.06%
Kept Species *
Broiler4343.88%
Fattening Pigs3232.65%
Dairy2828.57%
Bulls2222.45%
Laying Hens1212.24%
Sows99.18%
Management
Conventional8990.82%
Mixed77.14%
Ecological22.04%
* Some farms kept more than one type of species.
Table 3. Categorizing DSS characteristics based on the Kano model.
CharacteristicsMOARIQ
Economy
Salary35.7%11.2%24.5%3.1%21.4%4.1%
Cost Savings16.3%35.7%34.7%2.0%9.2%2.0%
Market Perspective12.2%21.4%24.5%2.0%39.8%0.0%
Usefulness
Work Simplification17.3%39.8%38.9%0.0%4.1%0.0%
Knowledge Transfer28.6%10.2%21.4%5.1%32.%2.0%
Multi-target Optimization7.1%32.7%45.9%0.0%13.3.%1.0%
Recognition22.4%32.7%16.3%3.1%24.5%1.0%
Operability
Integrability21.4%36.7%24.5%2.0%14.3%1.0%
Time Efficiency28.6%21.4%23.5%3.1%35.7%0.0%
Traceability29.6%24.5%9.2%1.0%35.7%0.0%
Functionality
Standardization25.5%19.4%17.3%9.2%27.6%1.0%
Data Authority39.8%23.5%10.2%9.2%16.3%1.0%
Verifiability4.1%5.1%3.1%44.9%41.8%1.0%
Connectivity10.2%8.2%17.3%11.2%52.0%1.0%
M = Must-be, O = One-dimensional, A = Attractive, I = Indifferent, R = Reverse, Q = Questionable.
Table 4. Categories (Cat.) with strength (CS), total strength (TS), and significance (Sig.) per feature.
CharacteristicCat.CSTSCS+CS−Sig.
Economy
SalaryM11.2%71.4%0.38−0.51Yes
Cost SavingsO1.0%86.7%0.73−0.54No
Market PerspectiveI15.3%58.1%0.47−0.34Yes
Usefulness
Work SimplificationO1.0%95.9%0.79−0.57No
Knowledge TransferI4.1%60.2%0.34−0.42No
Multi-target OptimizationA13.2%85.7%0.79−0.40Yes
RecognitionO8.2%71.4%0.51−0.57No
Operability
IntegrabilityO12.2%82.6%0.63−0.60Yes
Time EfficiencyM5.1%73.5%0.46−0.52No
TraceabilityI6.1%63.3%0.34−0.55No
Functionality
StandardizationI2.1%62.2%0.41−0.50No
Data AuthorityM16.3%73.5%0.38−0.70Yes
VerifiabilityR3.1%12.3%0.15−0.17No
ConnectivityI34.7%35.7%0.29−0.21Yes
M = Must-be, O = One-dimensional, A = Attractive, I = Indifferent, R = Reverse.
Disclaimer/Publisher’s Note: The statements, opinions and data contained in all publications are solely those of the individual author(s) and contributor(s) and not of MDPI and/or the editor(s). MDPI and/or the editor(s) disclaim responsibility for any injury to people or property resulting from any ideas, methods, instructions or products referred to in the content.

