Abstract
Legume production and consumption have emerged as meeting sustainability principles. Legumes can help fight climate change, hunger, and obesity. Legumes are also a valuable dietary source of phytochemicals, whose content and composition vary depending on genotype, as well as on growing conditions, geographical origin, storage, and cooking. The health effects of legume consumption are nevertheless related to the bioaccessibility of these molecules, which is deeply affected by the cooking method. The aim of this study was to investigate the content and composition of phenolic compounds and anthocyanins present in black beans grown locally and cooked with three different methods (i.e., regular boiling, pressure-cooking, and microwave-cooking) and determine the in vitro biaccessibility. It emerged that Total Phenolic Content (TPC) and Total Anthocyanin Content (TAC) decreased significantly in all three cooked black beans. TPC loss was lowest (63%) in pressure-cooked beans and highest (77%) in boiled beans. TAC loss ranged between 93 and 98% but was not significantly different among treatments. Caffeic, t-ferulic, and sinapic acids were identified by HPLC. Cyanindin-3-O-glucoside and Peonidin-3-O-glucoside were also detected. The simulation of gastrointestinal digestion showed that phenolic compound bioaccessibility was highest when beans were boiled or pressure-cooked, while anthocyanins were mostly bioaccessible in pressure-cooked black beans.
1. Introduction
Defining the framework for sustainable production and consumption patterns (Goal No. 12 of the 2030 Agenda for Sustainable Development) [1] is central to the management of food systems, and in this context, legume production and consumption have emerged as being in line with sustainability principles.
Legumes can help fight climate change [2]. Their cultivation allows for saving fossil energy inputs and reducing mineral fertilization thanks to the crop’s ability to fix nitrogen [3,4]. They allow for the sequestration of carbon in soils [5]. They contribute to releasing less greenhouse gases (GHG) than other crops and thus allow for a reduction of GHG emissions [3,4]. They secure biodiversity and subsequently contribute to food security [3,4].
Legumes can also help fight all forms of malnutrition [6]. They play a central role in healthy and sustainable human diets for their desirable nutritional properties [4,7,8]. They are gluten-free [9,10]. Legumes are also a source of phytochemicals [11,12], which not only contribute to the color and sensory characteristics of seeds, as in cereals and pseudocereals [13,14,15], but also possess bioactive properties, including antioxidant, anti-inflammatory, hypoglycemic, hypolipidemic, and anticarcinogenic [11,16,17,18,19].
Among legumes, the common bean (Phaseolus vulgaris) is among the planet’s most widespread crops and presents remarkable variability in terms of varieties, shapes, and colors [20,21,22,23]. Borlotti beans, cannellini beans, pinto beans, navy beans, red kidney beans, and black beans are just a few examples. Black beans are kidney-shaped, sweet-flavored, and black-colored, with a small white spot. They are the legume of choice for Latin American and African countries, thanks to their high nutritive profile: they are a good source of proteins containing most essential amino acids, especially lysine, and their protein content is comparable to milk, eggs, soybeans, and meat [20]. They are also rich in polyphenols, which are mainly present in the coat of legume seeds. Anthocyanins, flavonols, phenolic acids, and proanthocyanidins are commonly studied phytochemicals in black beans [20]. However, the content and composition of phenolic compounds are very variable because of intrinsic factors (e.g., genotype), extrinsic factors (e.g., growing conditions, interaction between genotype and environment, and geographical origin), as well as factors related to processing (e.g., storage conditions and cooking methods).
Legumes are known to require long cooking times and demand high energy [24]. To meet the FAO tips for sustainable gastronomy [25], it is therefore important to understand how we can make cooking more sustainable and healthier for our planet and our health [26,27]. GHG emissions differ substantially among the different cooking methods [28]. Boiling is the least sustainable because of long cooking times and a high demand for energy; microwave-cooking reduces the emissions of greenhouse gases by 41–78% in comparison with boiling; pressure-cooking is an efficient cooking method because cooking times are considerably shortened [28].
The scope of this study was to determine the content of phenolic compounds and total anthocyanins in a local ecotype of black beans grown in the Tuscia region (Viterbo, central Italy), for which no nutritional data are currently available. Since legumes are eaten cooked, the effect of three different cooking methods (regular boiling, pressure cooking, and microwave cooking) on phytochemical content and profile was evaluated. The in vitro bioaccessibility of phenolic compounds was also determined in the cooked black beans.
2. Materials and Methods
2.1. Reagents
The ensuing chemicals and HPLC-grade reagents, n-hexane, ethanol, Folin-Ciocalteu’s reagent, sodium carbonate, potassium chloride, sodium acetate, citric acid, calcium chloride, hydrochloric acid, trichloroacetic acid, acetic acid, and acetonitrile, were acquired from Carlo Erba Reagents (Milan, Italy). The standards of the following phenolic acids (i.e., caffeic acid, catechin, chlorogenic acid, p-coumaric acid, cyanidin-3-O-glucoside, t-epicatechin, ferulic acid, gallic acid, p-hydroxybenzoic acid, malvidin, peonidin 3-O-glucoside, protocatechuic acid, rutin, sinapic acid, syringic acid, vanillic acid) and enzymes (i.e., porcine α-amylase, porcine pancreatin, porcine pepsin, and bile salts) were purchased from Extrasynthèse (Geney, France) and Sigma-Aldrich (Milan, Italy). Water purified by the Milli-Q system (Millipore Corp., Billerica, MA, USA) was used to prepare aqueous solutions for HPLC analysis.
2.2. Sampling
The black bean analyzed in this study is a local ecotype cropped in a field located in the geographical area of Tuscia (Central Italy, Viterbo province). It was sown in April 2021 and harvested in August 2021. Upon harvest, beans were immediately packed in a protective atmosphere with no damaged or broken seeds and shipped to the laboratory of the CREA Research Centre for Food and Nutrition (Rome, Italy). Upon arrival, test samples were properly treated for analysis.
2.3. Sample Preparation
Black beans were analyzed in both raw and cooked forms. In detail, an aliquot of dry beans was ground with a laboratory mill (Janke and Kunkel IKA Labortechnik, Staufen, Germany), equipped with a water-cooling system. An ASTM woven wire sieve (mesh No. 18) was used to sieve the resulting powder in order to guarantee regular granulometry. Another aliquot of dry black beans was soaked and divided into three aliquots for cooking.
2.3.1. Determination of Hydration Rate and Soaking
Before soaking, water absorption was monitored for up to 24 h to first establish the hydration rate of dry black beans. In detail, dry black beans were rinsed and soaked in distilled water (1:5 w/v) at room temperature. Water absorption was monitored every two hours. At each measurement, soaked black beans were first blotted with paper to remove excess water, then they were weighed in an analytical balance and placed again back into the soaking water.
A water absorption curve was made by plotting the kinetic increase of moisture content with time in order to identify the plateau phase of water absorption.
The water absorption was calculated according to the following equation:
where Wa is the water absorption (%), Wf is the final weight of seeds after soaking (g), and Wi is the initial weight of seeds prior to soaking (g).
2.3.2. Cooking
Three different cooking methods were investigated: regular boiling (under atmospheric pressure), pressure cooking, and microwave cooking. In all methods, optimal cooking time was determined using the tactile method: cooked beans were pressed between the forefinger and thumb with moderate pressure [29]. A bean seed was deemed cooked when it was possible to squeeze it easily [29].
Regular Boiling
The equivalent of 60 g of dry beans were boiled at atmospheric pressure for 60 min with distilled water (1:3 w/v). Boiling water was drained, and seeds were cooled down at room temperature, homogenized, frozen at −30 °C, freeze-dried, milled, and sieved with an ASTM woven wire sieve (mesh No. 18). The obtained powder was stored in a desiccator in the dark until further analysis.
Pressure Cooking
The equivalent of 60 g of dry beans was transferred into a pressure cooker with distilled water (1:3 w/v) and cooked for 25 min. When beans were pressure-boiled to the optimal cooking time, the pressure cooker was removed from the heat source, and pressure was finally released. Cooking water was drained, and cooked beans were cooled down at room temperature, homogenized, frozen at a temperature of −30 °C, and then freeze-dried for subsequent analysis. Freeze-dried samples were ground with a laboratory mill and sieved with the aforesaid ASTM woven wire sieve (mesh No. 18). Powder was kept in a desiccator, in the dark, until further analysis.
Microwave Cooking
The equivalent of 60 g of dry beans was transferred to a bowl containing distilled water (1:3 w/v), covered with cling film, and cooked in a microwave oven at 700 Watts for 35 min. Samples were drained, cooled down at room temperature, homogenized, frozen at −30 °C, and then freeze-dried for subsequent analysis.
All freeze-dried samples were ground to pass through an ASTM woven wire sieve (mesh No. 18) and kept in a desiccator until further analysis.
2.4. Determination of Phenolic Compounds
Before analysis, the ground samples were treated with n-hexane (1:5 w/v); they were blended with the solvent for a total of 5 min at room temperature and vortexed three times in 5 min [30].
After defatting, phenolic compounds were extracted from the samples and determined by spectrophotometry and chromatography.
2.4.1. Extraction of Phenolic Compounds by Ultrasounds
Phenolic compounds were extracted by an ultrasound-assisted procedure optimized by Response Surface Methodology (RSM), as reported in Melini et al. [31]. Briefly, a known amount of black bean sample was placed into a test tube and added with a known amount of GRAS solvent (ethanol:water 64:36 v/v, acidified with citric acid). The tube was transferred into an ultrasound bath (Elmasonic S 100 H, Elma Schmidbauer GmbH, Singen, Germany), working at 37 kHz and a constant temperature (40 °C). After the extraction step, the test tube was centrifuged at 7000 rpm for a total of 10 min after cooling. The supernatant was recovered. A three-step ultrasound-assisted extraction was carried out, and the three supernatants were combined for analysis.
2.4.2. Spectrophotometric Analysis
Total Phenolic Content (TPC) and Total Anthocyanins Content (TAC) were determined in an aliquot of the combined extracts previously treated with trichloroacetic acid (final concentration, 15%) to precipitate proteins [32].
Phenolic compounds were determined spectrophotometrically, as reported below.
Total Phenolic Content
Total Phenolic Content (TPC) was quantified by the Folin-Ciocalteu’s reagent (FCR) assay, as reported in the literature [33,34,35]. Briefly, an amount of the phenolic extract was transferred into a tube and added to 600 μL of water-diluted FCR (1:10). After three minutes, sodium carbonate (960 μL) was added, and the test tubes were transferred to a water bath at 50 °C for 10 min. Absorbance measurements were carried out at 760 nm against a reagent blank. Measurements were compared to a calibration curve made with gallic acid. Results are expressed as milligrams of Gallic Acid Equivalents (GAE) per 100 g of sample on a dry matter basis (mg GAE 100 g−1 dm).
Total Anthocyanin Content
Total anthocyanins were quantitated by the AOAC Official Method 2005.02 [36], as reported in Melini et al. [31]. Briefly, an aliquot (200 μL) of the extract was diluted (1:5 v/v) with a 0.025 M potassium chloride buffer, and absorbance was read at 520 nm after 20 min. Another aliquot (200 μL) was diluted (1:5 v/v) with a 0.4 M sodium acetate buffer, and its absorbance was read at 700 nm. TAC was determined by the equation specified in the AOAC Method 2005.02) [36] and in Melini et al. [31]. Results are expressed as mg of cyanidin-3-O-glucoside equivalents per 100 g of sample on a dry matter basis (mg C3GE 100 g−1 dm).
2.4.3. Chromatographic Analysis
The chromatographic analysis was performed by Varian ProStar HPLC equipment (Varian Inc., 2700 Mitchell Drive, Walnut Creek, CA, USA), provided with a photodiode array (PAD) detector, according to the method specified in Melini et al. [31]. Briefly, the extract was evaporated till dryness; the dry residue was dissolved in a mixture of methanol and water (50:50 v/v) and filtered before HPLC analysis with a 0.45 μm filter.
A reverse-phase Inertsil® ODS-3 column (250 × 4.6 mm i.d., 5 μm; CPS analitica, Milano, Italy) was used for phenolic compound separation. The elution was obtained by using water acidified with acetic acid (2.5%) (Solvent A) and acetonitrile (Solvent B). After an initial mobile phase of 95% Solvent A and 5% Solvent B, the mobile phase B percentage was increased (i) from 5% to 10% (0–3 min), (ii) from 10% to 30% (10–28 min), and (iii) from 30% to 40% (28–38 min). Finally, it was kept constant at 40% for 5 min (38–43 min) and reduced to 5% over the remaining 5 min. The course conditions were 48 min gradient elution, 40 °C temperature, and 1.0 mL/min flow rate.
Chromatograms were recorded at wavelengths of 320 and 520 nm. The identification of anthocyanins and phenolic acids was made by comparison of the retention time and UV-VIS spectra of the samples with pure reference standards eluted under the same chromatographic conditions.
2.5. Determination of Phenolic Compound In Vitro Bioaccessibility
The in vitro bioaccessibility of phenolic compounds in the samples of cooked black beans was determined by simulating human gastro-intestinal digestion, as reported by Balakrishnan and Schneider [37], with some modifications.
The in vitro gastrointestinal digestion process was performed at 37 °C for a total of 310 min: 10 min (oral phase), 120 min (gastrointestinal phase), and 180 min (intestinal phase). For each sample, the three phases of the digestion process were simulated by three separate but parallel experiments. The first experiment was thus stopped after 10 min (oral phase), the second experiment was stopped after 130 min (10 + 120 min), and the third experiment was stopped after 310 min (10 + 120 + 180 min).
Briefly, for the simulation of the oral phase, the ground cooked sample (1 g) was put in a 100 mL screw-cap Erlenmeyer flask and added to distilled water (15 mL) and 0.85% (w/v) sodium chloride solution (10 mL). The sample was incubated in a water bath shaker (Grant OLS 200) at 37 °C for 10 min. Four glass marbles were added to the flask to keep the mixing uniform during incubation. After incubation at 37 °C, porcine α-amylase (50 units/mL, EC 232-565-6), adequately diluted in 20 mM sodium phosphate buffer containing 1 mM calcium chloride, was added to the sample and incubated for 5 min. The enzymatic reaction was halted by cooling the test sample down to ice and centrifuging the resulting mixture at 3000 rpm for 20 min. The supernatant was recovered and labeled as oral phase extract.
The effect of digestion during the gastric phase was evaluated in a separate experiment, where the same steps described for the oral phase were followed by the addition of a known amount of 0.15 M hydrochloric acid to keep the pH below 2.5. The gastric phase was mimicked by adding porcine pepsin (20 mg mL−1, EC 232-629-3) diluted in 20 mM hydrochloric acid. The mixture was incubated at 37 °C for 2 h. The test flask was then cooled on ice and centrifuged at 3000 rpm for 20 min. The obtained supernatant was labeled as gastric phase extract.
In the third separate experiment, the gastro-intestinal phase was mimicked. The gastric digested extract was thus further treated by adding a known amount of bile salt (150 mg mL−1) and porcine pancreatin (18.75 mg mL−1, EC 232-468-9) dissolved in 0.15 M sodium bicarbonate. Samples were incubated for 3 h at pH 6.5. The mixture was cooled down on ice, centrifuged at 3000 rpm for 20 min, and the recovered supernatant was labeled as gastro-intestinal phase extract.
A blank (with no sample) incubated under the same conditions was used to correct any possible interference from the digestive enzymes and buffers. The digestion was replicated three times (n = 3).
2.6. Statistical Analysis
Statistical analyses were carried out using Minitab Pro 18 (Minitab Inc., State College, PA, USA) software and Microsoft® Excel® for Windows 365 (version 2311).
3. Results and Discussion
3.1. Optimization of Soaking Time
Soaking and cooking are the two fundamental steps occurring during the preparation of beans for consumption. Soaking consists of exposing seeds to water. Upon immersion in water, the hydration of the seed begins. The bean hilum is the primary entrance point to water. Then, the seed coat is hydrated from the inside through diffusion and capillary water transfer. Water entry into the beans is not allowed through the seed coats that act as barriers, unless there are prominent pores or cracks in the cuticle layer [38]. Since the size of the hilum and the properties of the seed coat (e.g., amorphous versus thick seed coat; small-seeded beans, etc.) can influence the rate of water uptake and are specific for each cultivar [39,40], it is important to assess the optimal soaking time for each ecotype.
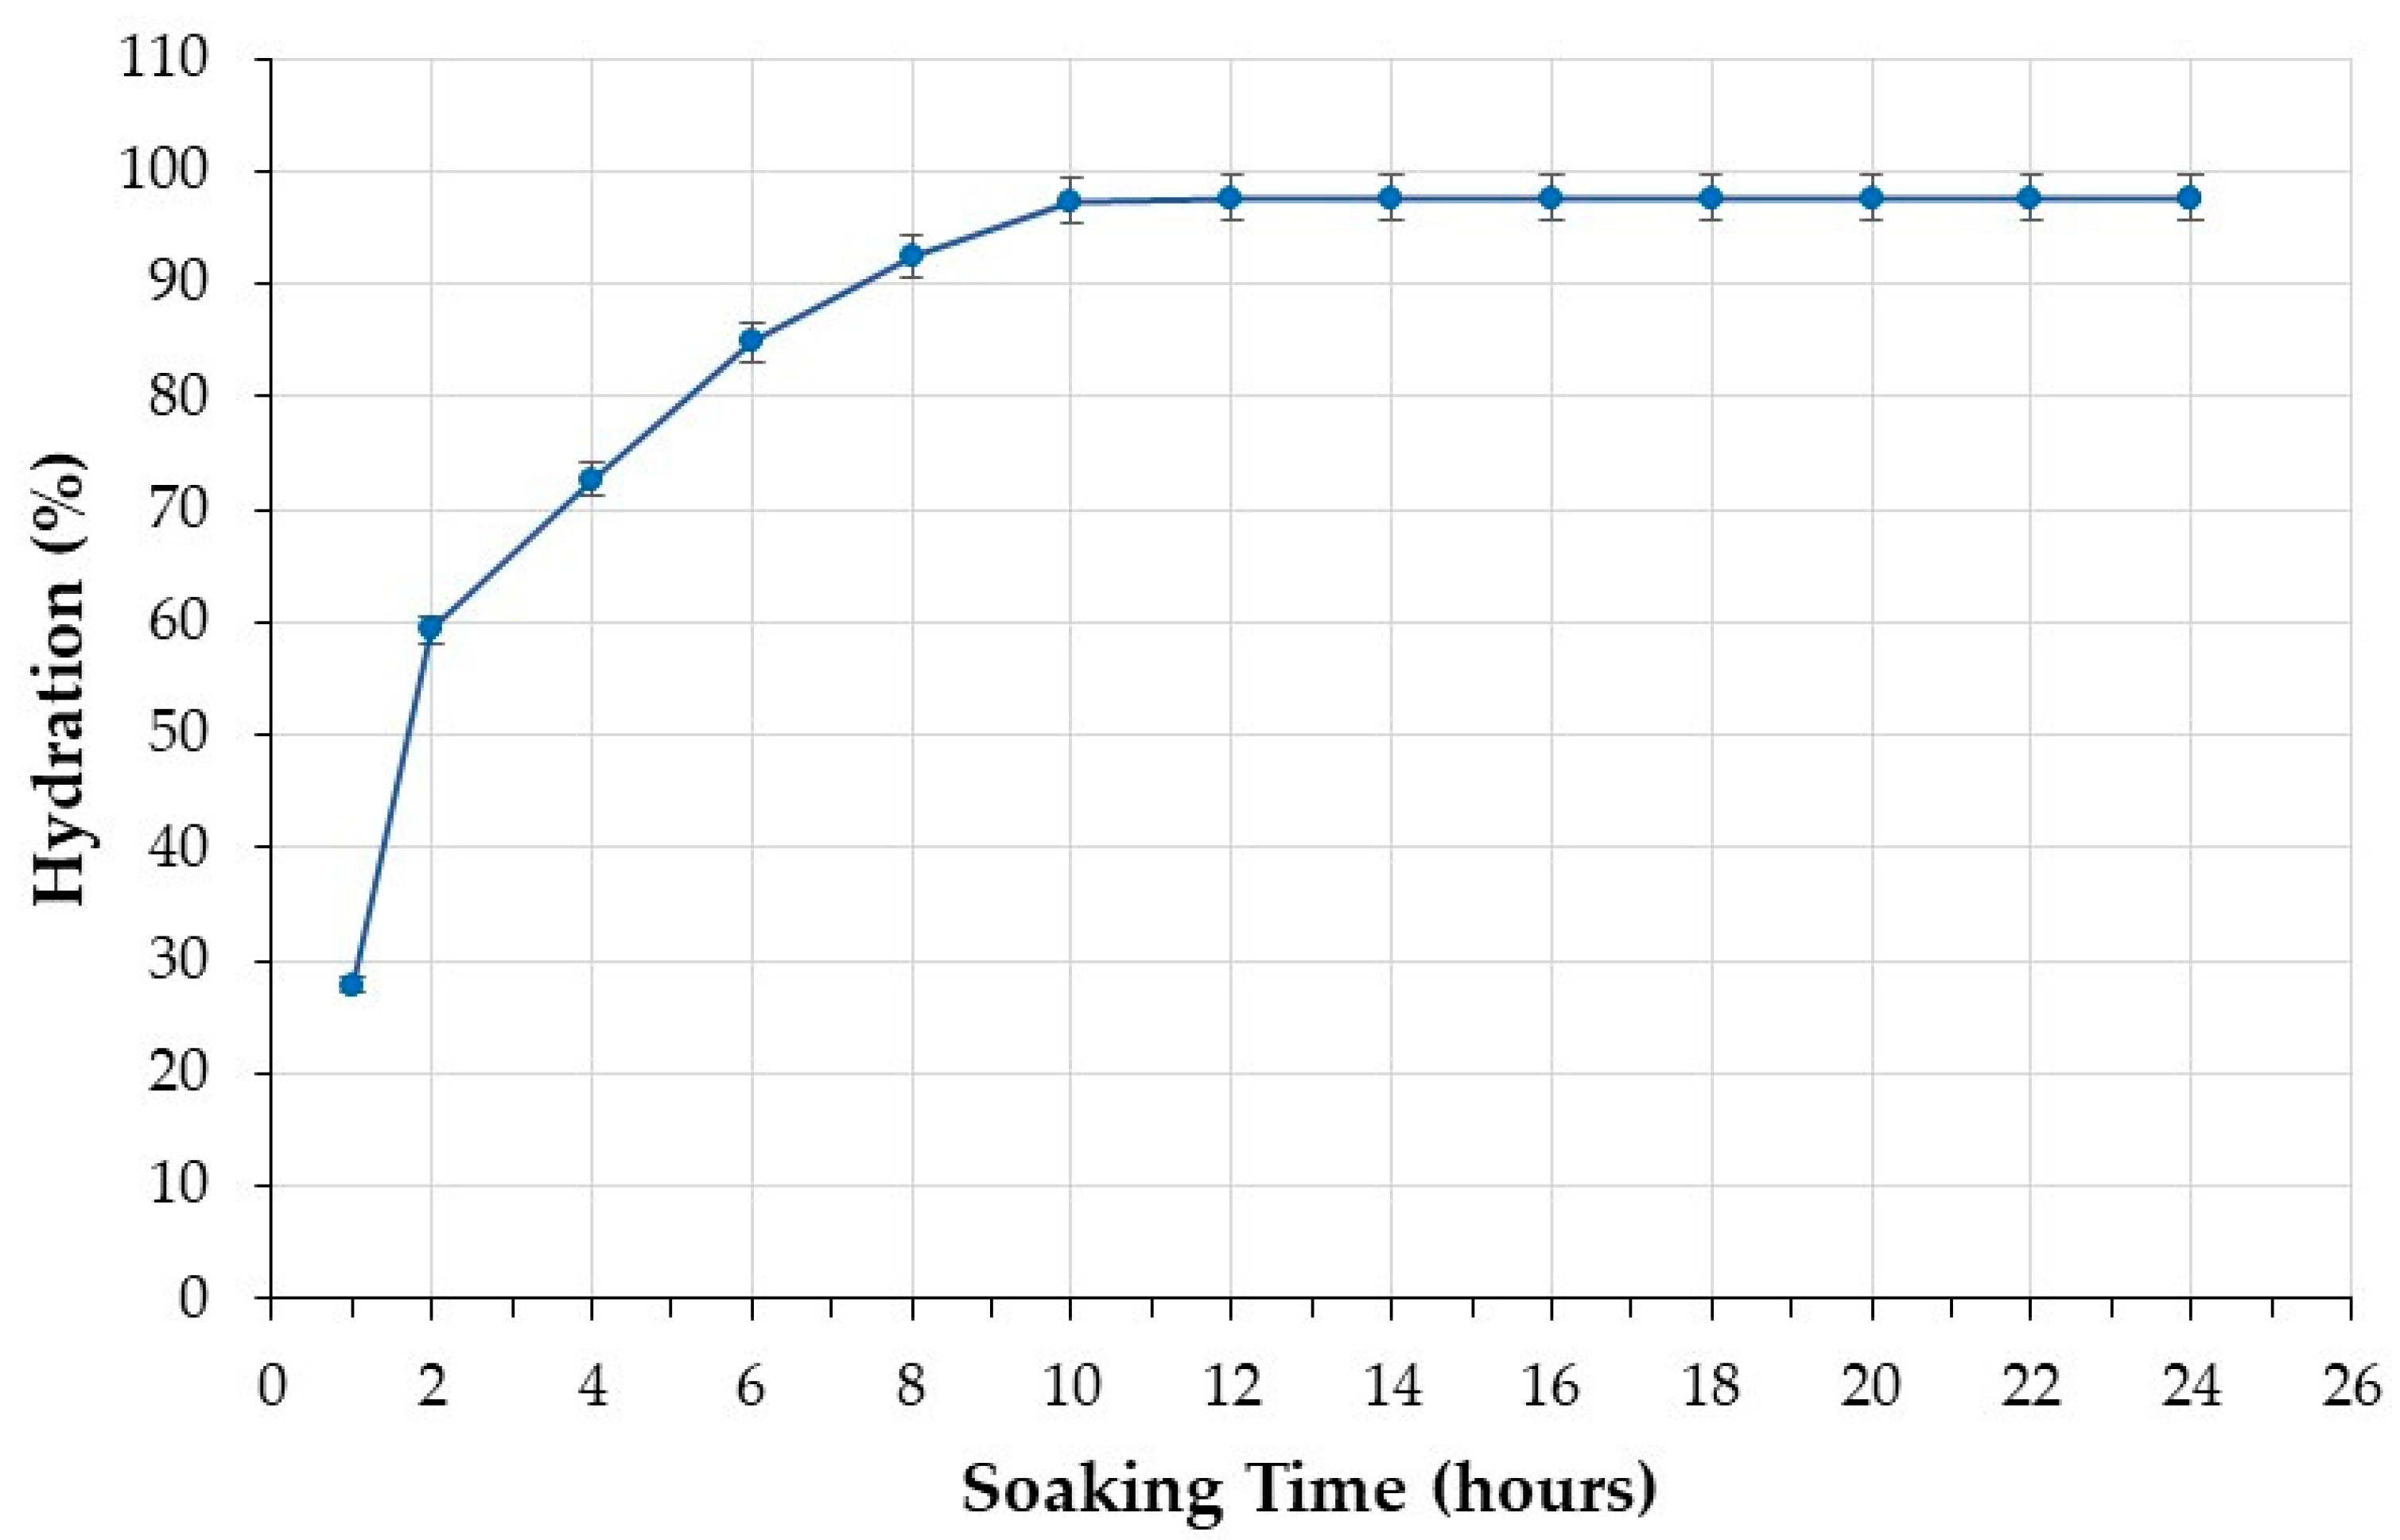
The water absorption curve of the black beans under investigation is shown in Figure 1. It is characterized by an initial phase of rapid water absorption followed by a phase in which the water uptake rate is steady until saturation. Beans reached saturation after soaking for 10 h, when water absorption reached a plateau (Figure 1). The black beans analyzed in this study were therefore soaked for 10 h before cooking.
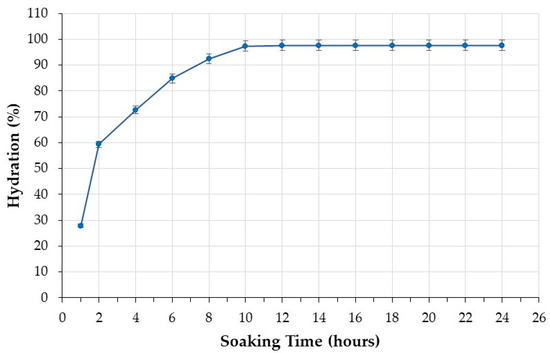
Figure 1.
Water absorption of beans during the soaking step.
The investigation of soaking time is crucial because it allows understanding when equilibrium water uptake is reached [41]. Optimal soaking decreases cooking time [38], with advantages in terms of sustainability, nutrition, and promotion of pulse consumption. The hydration promoted by soaking results in the softening of the seed coat, and this change prompts water penetration during cooking, reducing the time necessary for cooking [38]. If cooking is performed without pre-soaking, hydration and cooking are concurrent; hence, longer cooking time is necessary [42]. This requires more energy. Longer cooking times can also result in diminished nutritional quality and undermine the acceptability of pulses by consumers who prefer ready-to-cook foods.
3.2. Effect of Processing on Phenolic Content
Legumes are not eaten raw and are processed to obtain desirable textures and flavors. During cooking, nutrient and phytochemical content is often altered [43].
In the present study, the effect of processing on phenolic compounds was investigated by determining TPC and TAC after soaking and after cooking by boiling, pressure-cooking, and microwave-cooking.
HPLC analysis was also performed on black bean extracts.
3.2.1. Effect of Soaking on TPC and TAC
Soaking prior to cooking is a necessary step in bean preparation to reduce cooking time. It also decreases the content of water-soluble anti-nutritional factors such as phytates [35,44,45]. Nevertheless, hydrophilic bioactive compounds, such as phenolic compounds, may be lost during soaking due to leaching.
In this study, TPC was determined in both raw and soaked beans to define the loss of phenolic compounds. TPC was 60.14 ± 0.89 and 25.08 ± 0.82 mg GAE 100 g−1 dm in raw and soaked black beans, respectively (Figure 2). A decrease of about 58% was observed compared to dry seeds. Since soaking was performed at room temperature, it might be assumed that the loss of polyphenols was essentially due to the leaching of these compounds into the soaking water [46].
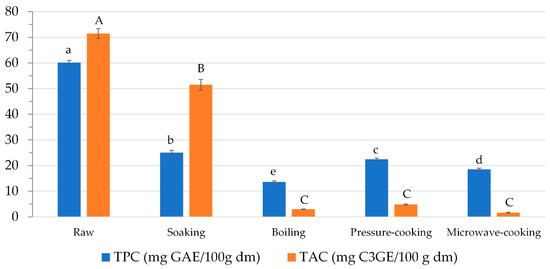
Figure 2.
Effect of soaking and cooking on the content of phenolic compounds (TPC and TAC). Data are presented as mean ± standard deviation (n = 3) and expressed on a dry matter basis (dm). Mean values with different small case/upper case letters in bars with the same color are significantly different based on p < 0.05 by analysis of variance followed by Tukey’s test.
This result is in keeping with other data reported in the literature. Mba et al., for instance, observed a decrease in polyphenol content higher than 40% in Kabulangeti cultivar beans after soaking [41]. They found that phenolic compound degradation is affected by some process parameters, such as soaking time and water temperature. Specifically, higher soaking times and water temperatures significantly increase polyphenol degradation [41].
TAC also decreased in soaked black beans (Figure 2); however, the extent of the decrease was lower than TPC. A 28% loss was observed after soaking. To the best of our knowledge, only Ravoninjatovo et al. investigated the effect of soaking on anthocyanins in black beans [47]. They observed maximum leaching of anthocyanins in soaking water after 10 h.
3.2.2. Effect of Cooking on TPC and TAC
The effect of three different cooking procedures, namely boiling, pressure-cooking, and microwave-cooking, on black bean TPC and TAC was evaluated in this study. Cooking causes, in fact, several changes in the physical characteristics and chemical composition of foods [48] and also affects the content of phytochemicals. Therefore, it is important to evaluate how each food home-processing and/or preparation can affect phenolic compound content to understand how it can influence the health benefits associated with phenol-rich food consumption.
As regards TPC, all the cooking methods determined a significant decrease (p < 0.05) compared to raw beans. Pressure-cooking determined the lowest TPC loss (63%), while boiling determined the highest (77%; Figure 2). Several factors may be responsible for the phenolic compound loss, namely temperature and time of cooking, as well as volume of cooking water. Cooking procedures that utilize a lower amount of water and/or occur in a shorter time, such as microwaving and pressure cooking, allow for better preservation of the content of phenolic compounds [49].
In this study, for instance, the same water volume was used; hence, cooking time and temperature are the two variables possibly responsible for differences in TPC among cooked samples. Black beans were pressure-cooked for 25 min, microwaved for 35 min and boiled for 60 min. Hence, the shorter the cooking time, the greater the retention of phenolic compounds. However, high-temperature treatments may also break down and depolymerize conjugated and high-molecular-weight polyphenols to lower molecular weight and more extractable phenolics, which is evidenced by an increase in detectable phenolics. Hence, the higher pressure and temperature present in the pressure cooker might have prompted the release of free phenolics from hydrolysable tannins, thus resulting in a lower loss of phenolic compounds [50].
The TPC loss observed in this study is comparable to the loss percentages observed in the literature. Ombra et al. observed a TPC loss ranging between 40 and 60% in Italian ecotype beans [51] cooked by a home pressure cooker; Garretson et al. found that cooking determined a 30–60% decrease in TPC in pigmented heirloom bean varieties boiled in water [52]; Xu and Chang reported a similar trend with a loss ranging from 53 to 79% in pressure-steamed and pressure-boiled beans, respectively [29]. As regards TPC values, the data obtained in this study were also quite comparable to the data obtained by Ombra et al. (24.06–43.66 mg GAE 100 g−1) [51], but lower than those obtained by Garretson et al. (i.e., 334–637 mg GAE 100 g−1) [52].
It is worth highlighting that pressure-cooking allows for the retention of 90% of TPC compared to soaked beans, while boiling enables the preservation of only 54% of TPC. These data emphasize that soaking affects TPC loss more than the cooking treatment itself.
Regarding anthocyanins in plant food, the content is affected by several factors, such as plant species, environment, and agronomic management [53]. In foods that necessitate a thermal treatment prior to consumption, anthocyanin content is also influenced by the cooking method [54]. For instance, when the cooking treatment requires the addition of water to the food matrix, a loss of anthocyanins might occur because they leach into water, as they are water-soluble compounds.
In this study, TAC was 4.83 ± 0.21 mg C3GE 100 g−1 dm in pressure-cooked black beans, 2.95 ± 0.11 mg C3GE 100 g−1 dm in boiled beans, and 1.63 ± 0.07 mg C3GE 100 g−1 dm in microwave-cooked beans (Figure 2). TAC loss thus ranged between 93 and 98% upon pressure-cooking and microwave-cooking, respectively, compared to raw beans (Figure 2). However, no statistical differences in TAC were observed among the cooked samples.
As regards the TAC values reported in studies available in the literature, 60 min boiling determined a 68% TAC loss in black bean seeds analyzed by Lopez-Martinez et al. [55]. Ombra et al. reported a content ranging between 0.56 and 1.05 mg C3GE 100 g−1 dm for twelve endemic ecotypes of common bean (Phaseolus vulgaris L.) from Southern Italy [51]; a higher content (83 mg C3GE 100 g−1 dm) was reported for monomeric anthocyanins determined in black beans grown and purchased in Brazil [56].
Interestingly, anthocyanins were more retained after soaking than after cooking. As a matter of fact, TAC loss was 27% after soaking, while it was greater than 90% after cooking treatments.
3.2.3. Effect of Pressure-Cooking on Phenolic Composition
The spectrophotometric determination of TPC highlighted that pressure-cooking enabled the greater quantitative preservation of phenolic compounds. An HPLC analysis was thus performed on pressure-cooked bean extracts to identify single phenolic compounds and to evaluate the effect of pressure cooking on the qualitative composition of the extract.
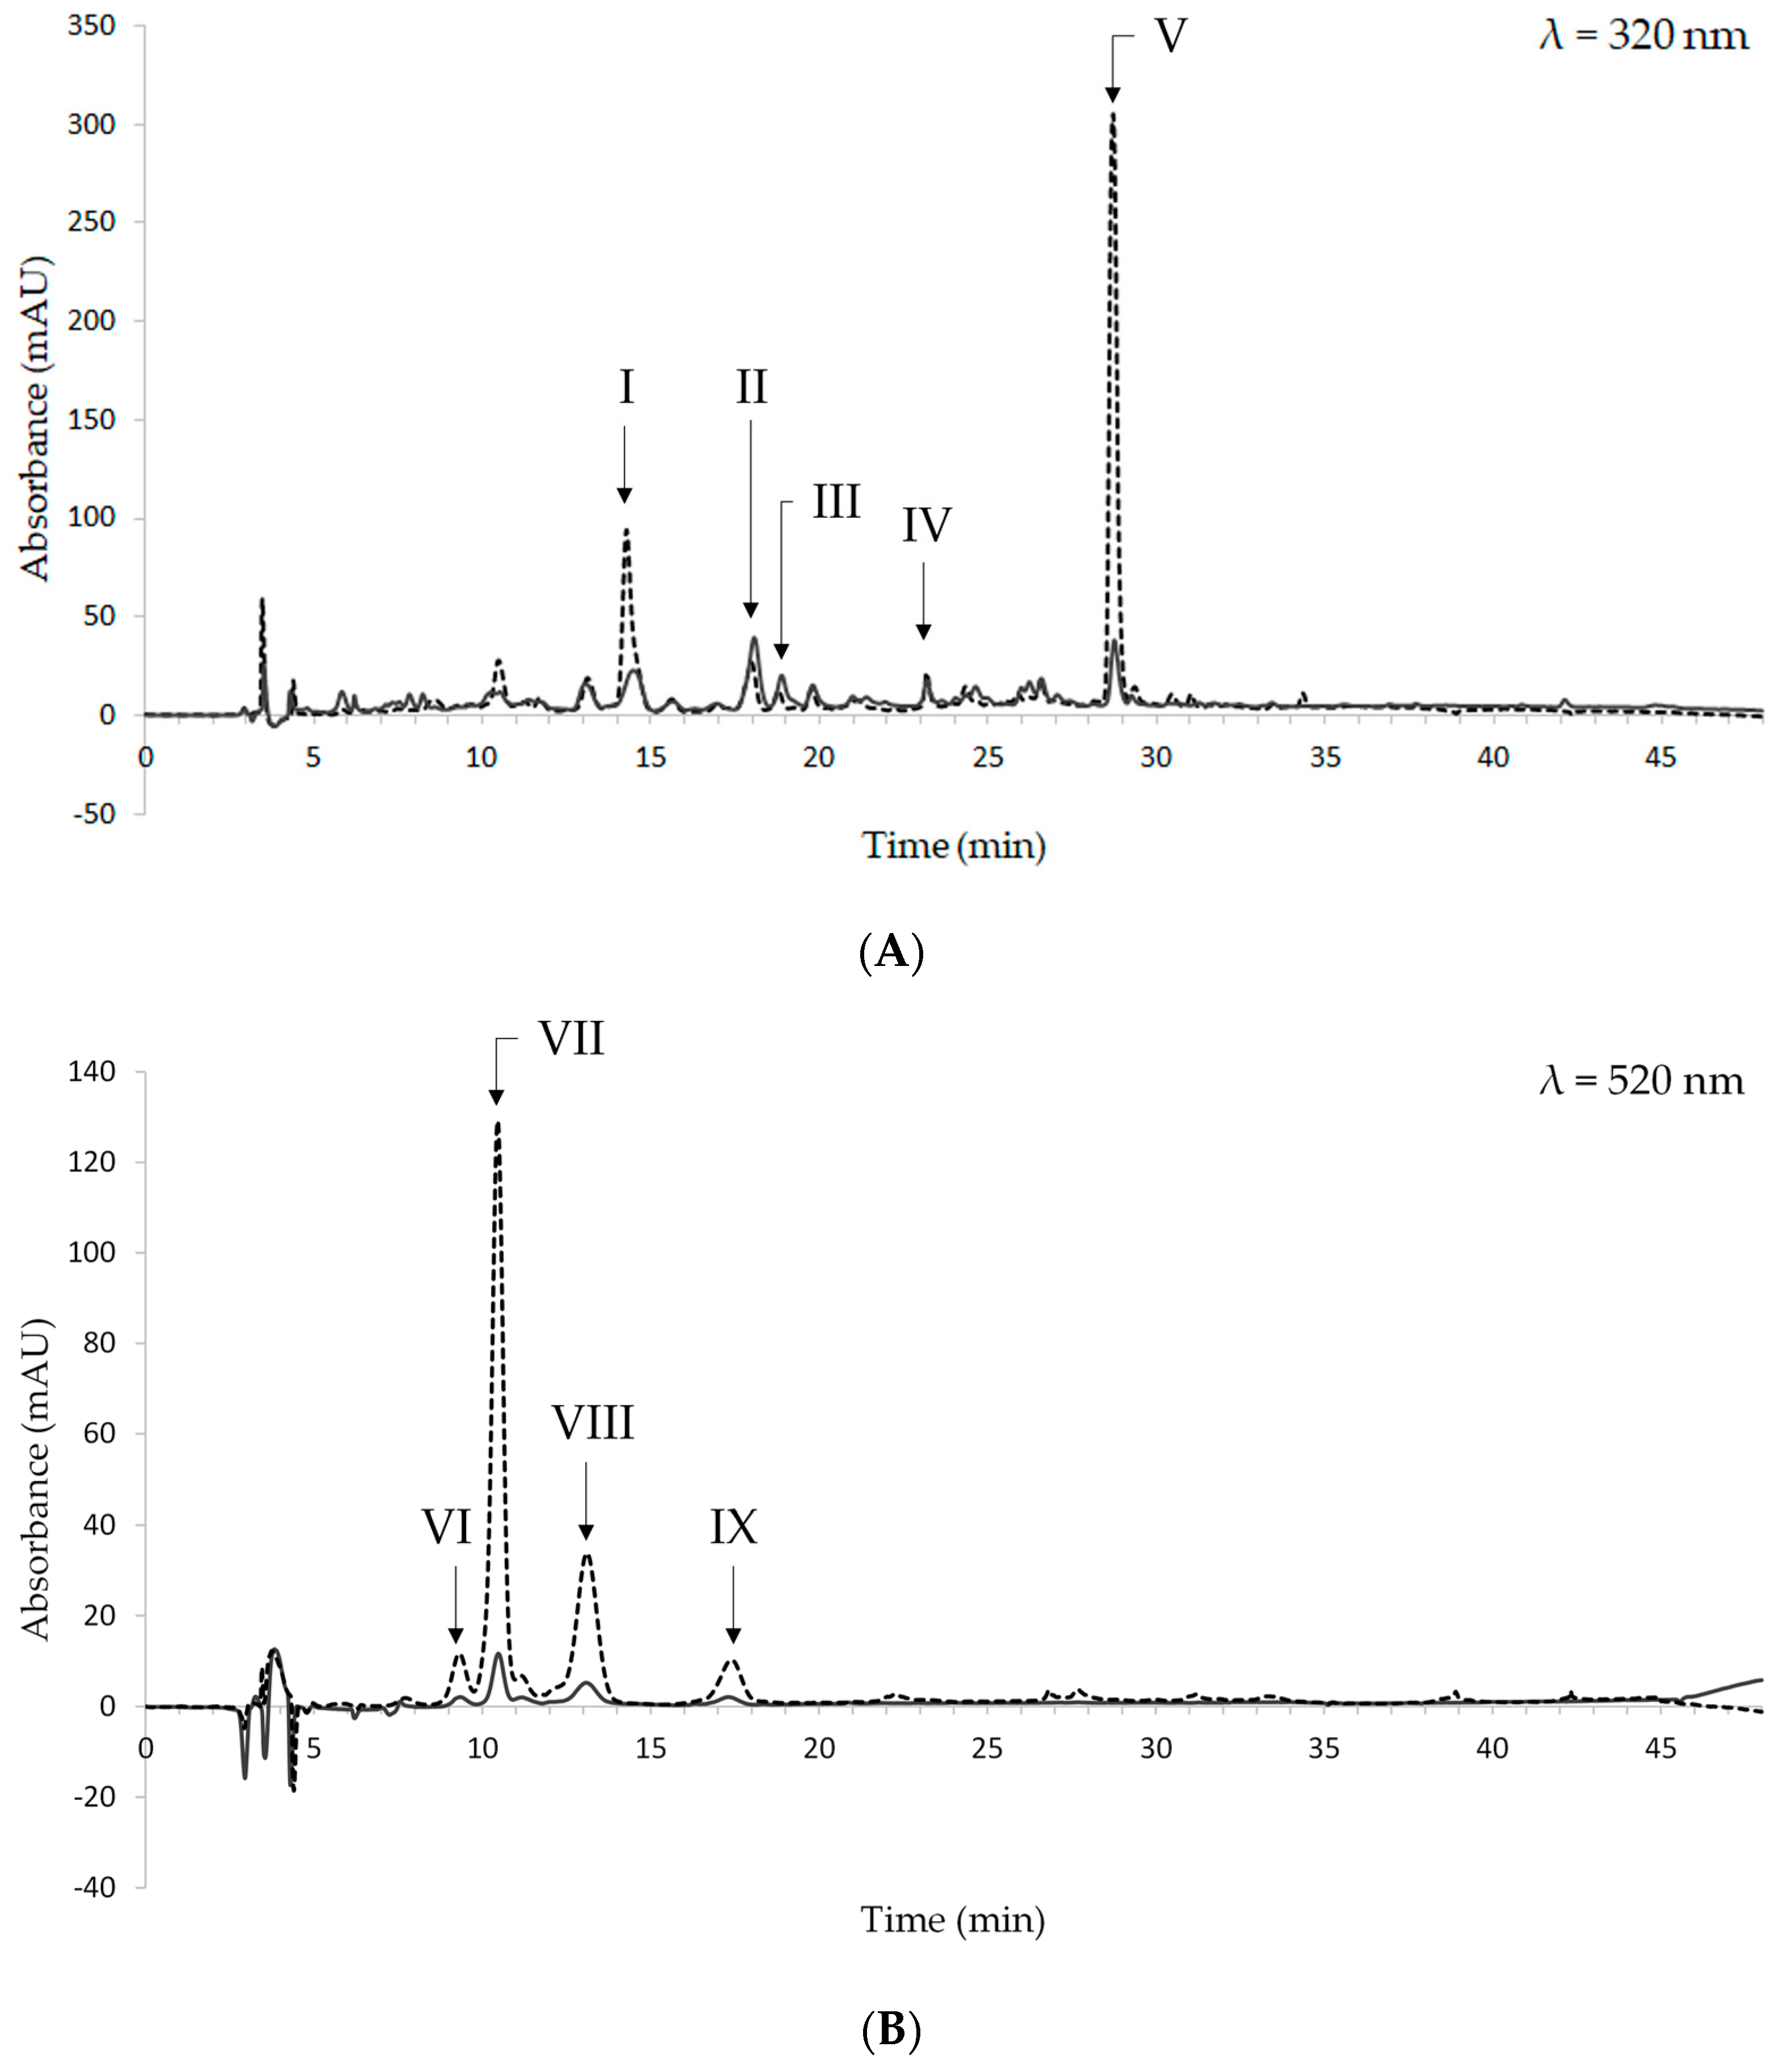
The HPLC chromatograms of a representative sample of pressure-cooked beans are shown in Figure 3. They were registered at 320 and 520 nm, which are the absorbance wavelengths of hydroxycinnamic acid derivatives and anthocyanins, respectively. The chromatogram at 260 nm was also considered to identify hydroxybenzoic acid derivatives; however, no compounds were detected at this wavelength.
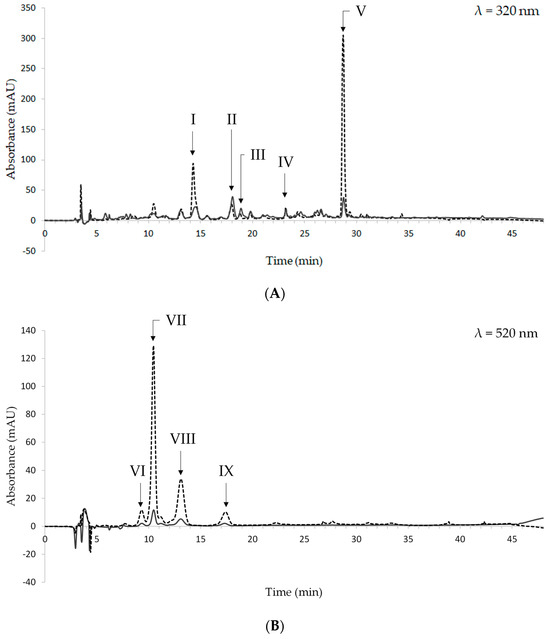
Figure 3.
Chromatograms of raw (dashed line) and pressure-cooked (solid line) black beans at 320 nm (A) and 520 nm (B). I: caffeic acid; II: t-ferulic acid; III: sinapic acid; IV: unknown flavonol I; V: unknown flavonol II; VI: unknown compound 1; VII: cyanidin-3-O-glucoside; VIII: peonidin-3-O-glucoside; IX: unknown compound 2.
Based on their UV-VIS spectra and retention time, the following hydroxycinnamic acid derivatives were identified: caffeic, t-ferulic, and sinapic acids. They were eluted at 14.27, 18.00, and 18.77 min, respectively. The peaks eluted at 23.19 and 28.68 min were tentatively identified as flavonols, based on the UV-VIS spectra thereof and data from the literature [57]. As regards anthocyanins, cyanidin-3-O-glucoside and peonidin-3-O-glucoside were found. They were eluted at 10.44 min and 13.17 min, respectively. Two additional peaks are present in the chromatograms registered at 520 nm (Figure 3B); however, it was not possible to identify them since their UV-VIS spectra did not match the spectra of the available standard compounds.
The data obtained in this study are in keeping with Giusti et al., who found ferulic acid to be the most abundant phenolic acid in boiled black beans [58]. No data are available for caffeic and sinapic acids [58]. As regards anthocyanins, cyanidin-3-O-glucoside and peonidin-3-O-glucoside were not found in Giusti et al. [58].
The overlapping of the chromatograms from pressure-cooked beans and raw beans shows that pressure-cooking does not change the qualitative composition of the extracts. As regards quantitative differences in phenolic compounds and anthocyanins, it must be underlined that the chromatograms from pressure-cooked beans were obtained from ethanolic extracts whose concentration was 10-fold higher than that of extracts from raw beans.
The comparison between the relative areas of each identified phenolic compound before and after cooking showed that the preservation ranged between 0.5% and 31.8% (Figure 4). Sinapic acid was the most retained compound, while peonidin-3-O-glucoside was the most degraded.
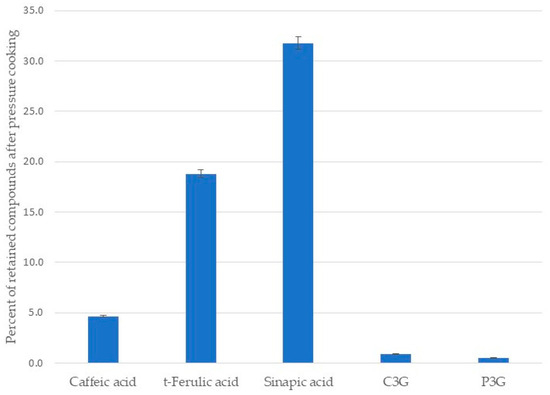
Figure 4.
Percent of retained phenolic acids and anthocyanins in black beans after pressure cooking.
Interestingly, the ratios between the compounds detected at 320 nm in raw and pressure-cooked black bean extracts show that phenolic compounds are differently affected by the cooking process (Figure 5). In raw black beans, caffeic acid was the most abundant phenolic acid (26.2%), while in pressure-cooked black beans, t-ferulic acid was the phenolic acid present in the highest percentage.
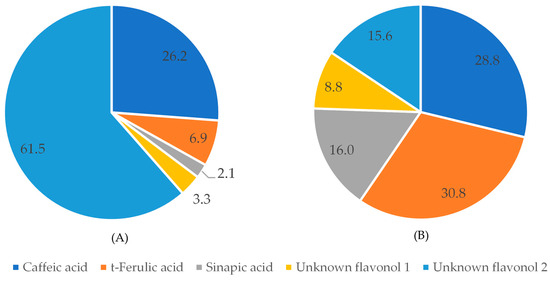
Figure 5.
Percent of compounds detected at 320 nm in black beans before (A) and after (B) pressure-cooking.
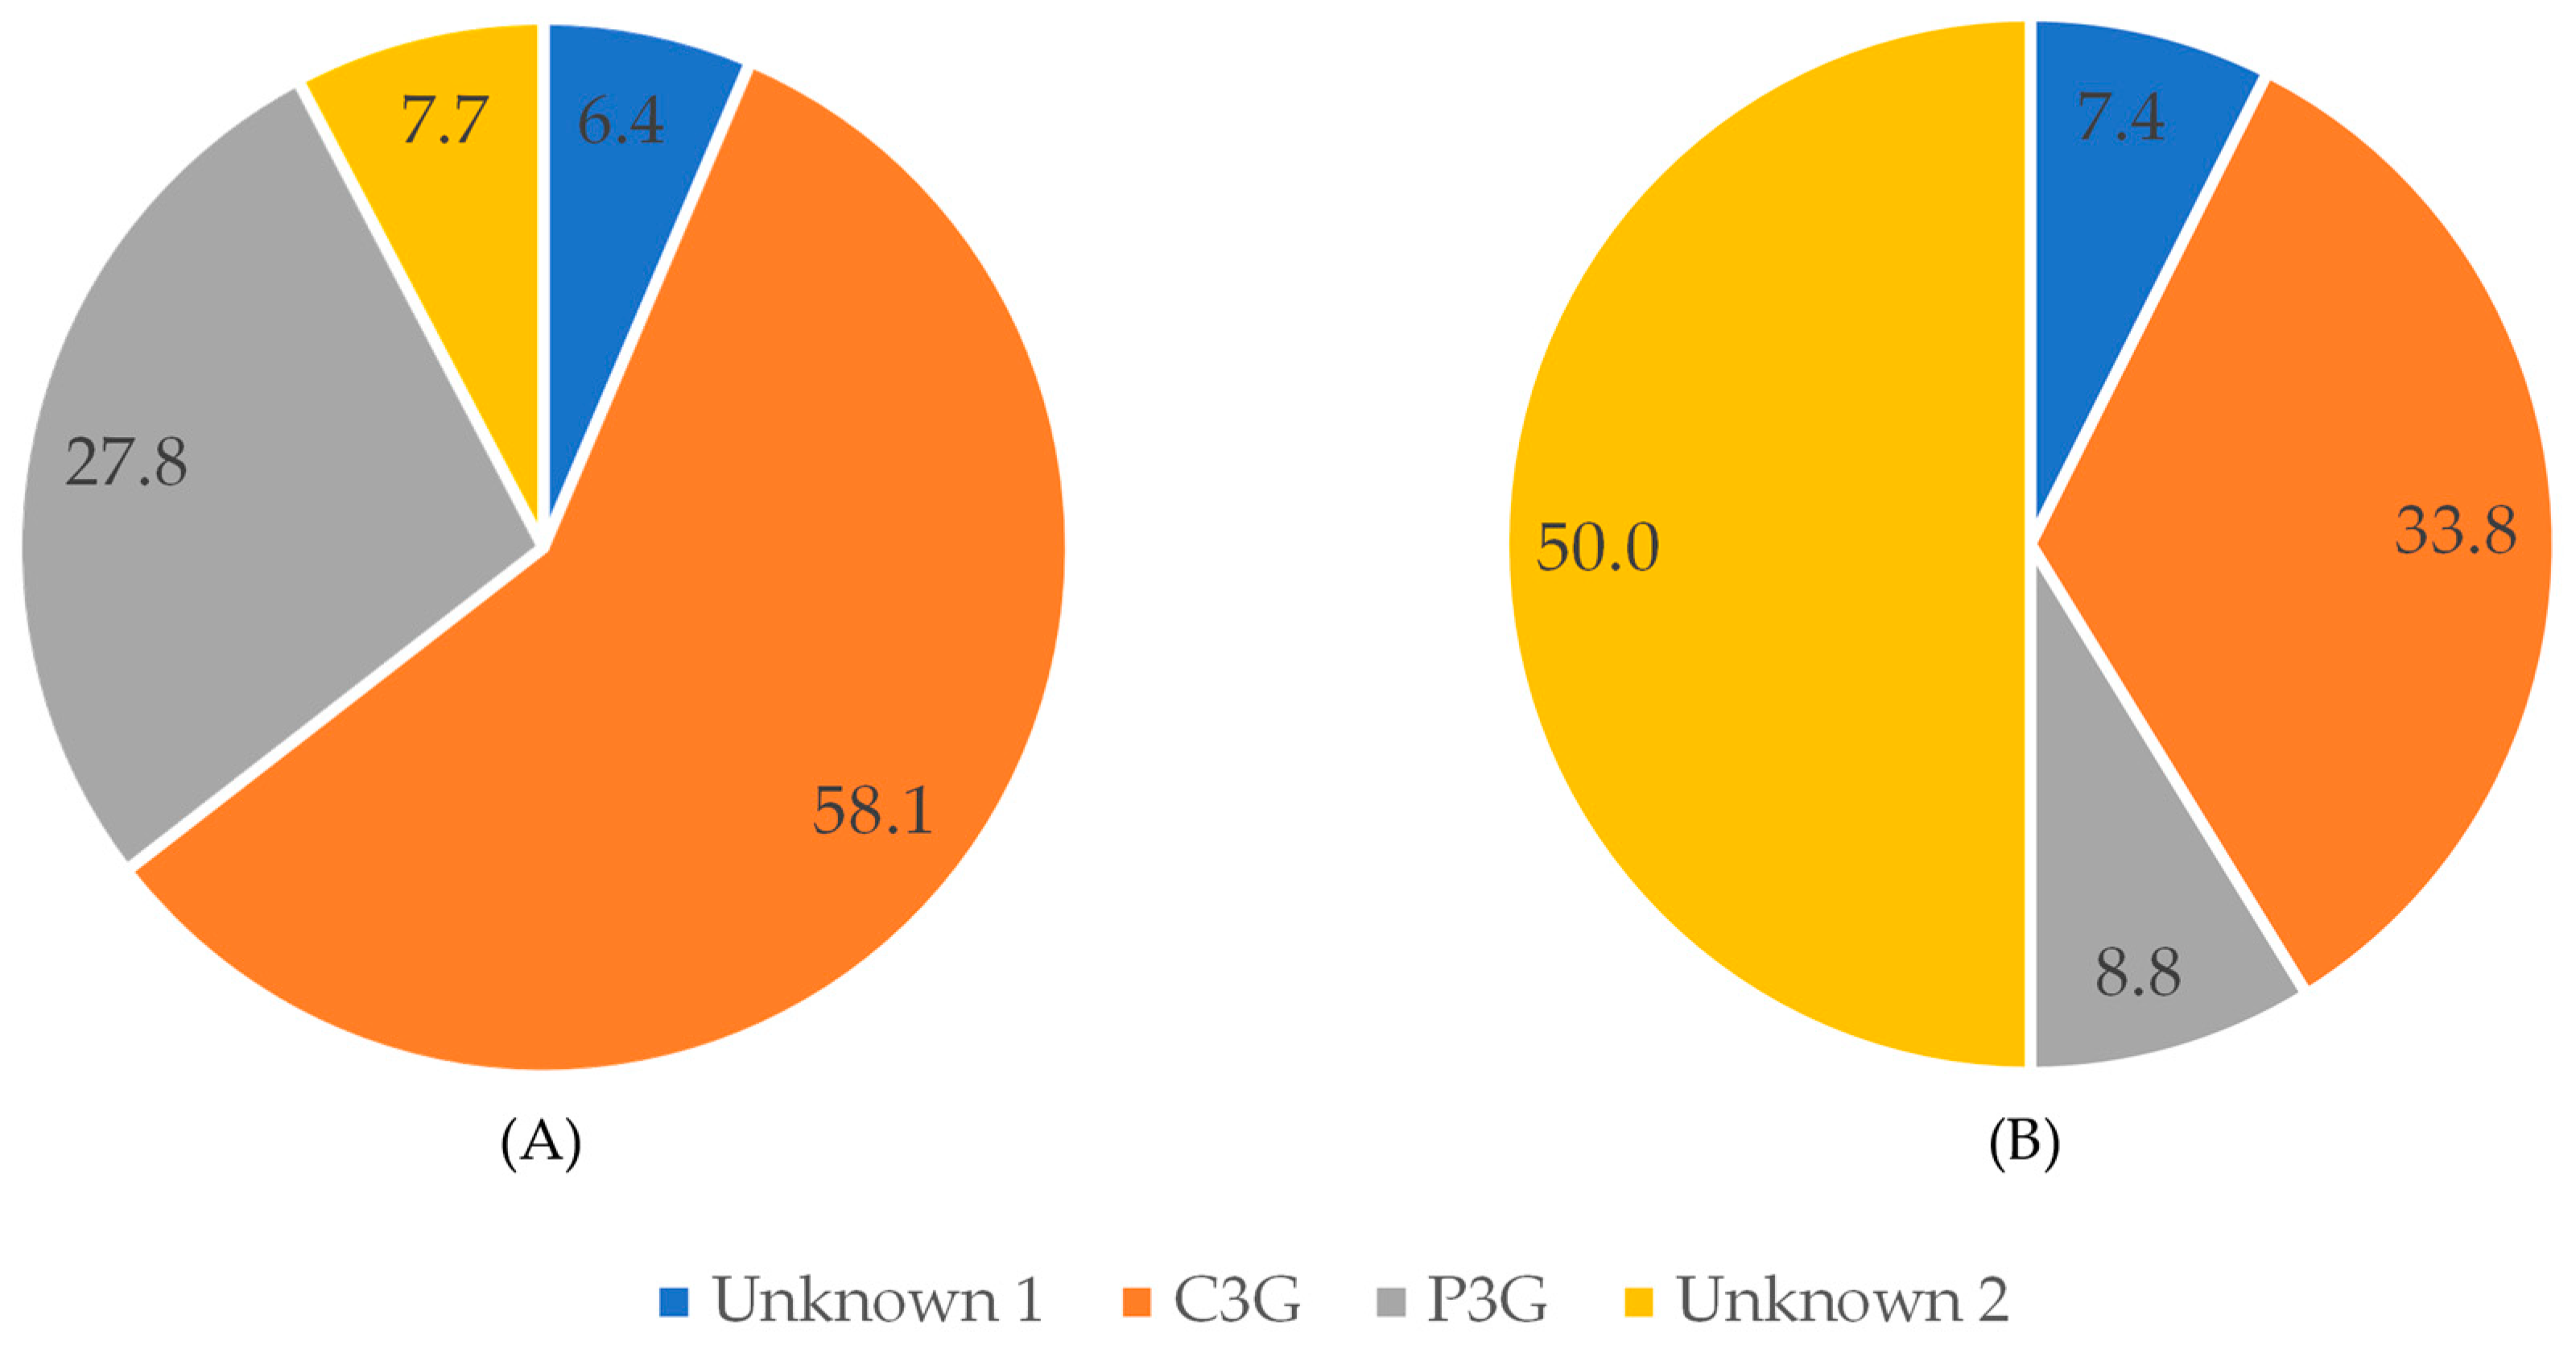
As regards anthocyanins, cyanidin-3-O-glucoside was the main compound detected at 520 nm in raw black bean, followed by P3G (Figure 6). After pressure cooking, C3G and P3G represented 33.8% and 8.8%, respectively, and their content was decreased. This was due to the fact that the unknown compounds were less affected by pressure cooking than the identified anthocyanins.
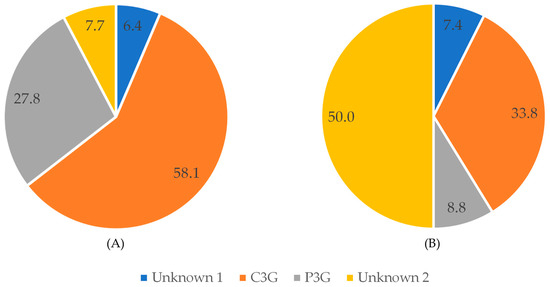
Figure 6.
Percent of compounds detected at 520 nm in black beans before (A) and after (B) pressure-cooking.
3.3. In Vitro Bioaccessibility of Phenolic Compounds in Cooked Black Beans
A food component becomes bioavailable provided that it is released from the food matrix. The degree to which a nutrient, as well as a bioactive compound, is released from the food matrix in the gastrointestinal tract and can be absorbed is therefore called bioaccessibility. The latter is impacted by factors that are related to the phenolic structure, the food matrix, and the host. Hence, the aim of this study was also to determine the effect of different cooking methods on the in vitro bioaccessibility of phenolic compounds to fully understand the contribution of black bean consumption to the health benefits associated with phenolic compound intake.
The in vitro bioaccessibility of phenolic compounds was assessed in boiled, pressure-cooked, and microwave-cooked black beans (Table 1).

Table 1.
Effect of the cooking method on the in vitro bioaccessibility of phenolic compounds (TPC and TAC).
Results showed that TPC and TAC in cooked samples after oral digestion ranged between 5.18 and 6.84 mg GAE 100 g−1 dm and between 5.29 and 6.93 mg C3G 100 g−1 dm, respectively (Table 1). The highest TPC was observed in pressure-cooked samples. As regards TAC, no significant differences were observed between pressure- and microwave-cooked samples, which showed a higher content than boiled beans.
After the gastric phase, an increase in TPC was observed, with values ranging between 15.91 and 18.64 mg GAE 100 g−1 dm (Table 1). As in vitro digestion involves hydrolysis under acidic conditions, it is likely that, upon digestion, the phenolic compounds bound to other nutrients are released. For example, in the gastric phase, seed proteins are first digested, and it might occur that some of the phenolic compounds that are bound to proteins may be released during this step [59]. Phenolic compounds released in the gastric phase may therefore be absorbed and may exert a local effect in the small intestine. A similar trend was reported by Chandrasekara and Shahidi [59]. As far as TAC is concerned, a decrease was observed after the gastric phase, in keeping with Liang and colleagues [60]. Values varied between 3.20 and 5.28 mg C3G 100 g−1 dm. The highest content was observed in pressure-cooked and microwave-cooked samples, which showed no significant (p > 0.5) differences.
A significant increase in both TPC and TAC was observed after intestinal digestion. Interestingly, the highest TPC value was observed for boiled and pressure-cooked samples. Regarding anthocyanin bioaccessibility, TAC was highest in the digested extract of pressure-cooked black beans (Table 1). These data are in contrast with the results obtained by Soriano Sancho et al. [56], who did not detect monomeric anthocyanins in digested samples of red and black beans. No further studies on anthocyanin bioaccessibility in black beans are available.
4. Conclusions
Three different cooking methods, with different GHG emissions, were applied to black beans, from the traditional boiling to the less time-consuming and energy-demanding microwave or pressure-cooking processes, and their effect on phenolics and anthocyanin content was studied.
It emerged that TPC was greatest when pressure-cooking was used, while it was the lowest when beans were boiled in water. Caffeic, t-ferulic, and sinapic acids, as well as C3G and P3G, were identified in pressure-cooked beans. Sinapic acid was the most retained phenolic compound. As far as TAC is concerned, no statistical differences were observed among the three cooking procedures, and a loss greater than 90% was observed after cooking. The in vitro bioaccessibility study confirmed that pressure cooking should be preferred to traditional boiling in water, since both phenolic acids and anthocyanins were more bioaccessible in pressure-cooked beans than in boiled beans.
Definitely, pressure-cooking emerged as the most advantageous cooking method from a nutritional point of view. In addition, it is possibly the most sustainable since it requires a shorter cooking time for optimal cooking.
Author Contributions
Conceptualization: V.M. and F.M. Formal analysis, investigation, and data curation for phenolic compound determination and in vitro digestion: V.M. and F.M. Formal analysis and investigation for cooking processes: S.L. and E.C. Data curation for cooking procedures: V.M. and S.M. Writing—original draft preparation: F.M. and V.M. Writing—review and editing: V.M., F.M., S.L., E.C. and S.M. Supervision: V.M. All authors have read and agreed to the published version of the manuscript.
Funding
This research received no external funding.
Institutional Review Board Statement
Not applicable.
Informed Consent Statement
Not applicable.
Data Availability Statement
The data presented in this study are available on request from the corresponding author.
Acknowledgments
Melini Valentina wishes to thank the firm “Perle della Tuscia” for providing the black bean sample upon harvest.
Conflicts of Interest
The authors declare no conflicts of interest.
References
- FAO. Key to Achieving the 2030 Agenda for Sustainable Development; FAO: Rome, Italy, 2016. [Google Scholar]
- Jensen, E.S.; Peoples, M.B.; Boddey, R.M.; Gresshoff, P.M.; Henrik, H.N.; Alves, B.J.R.; Morrison, M.J. Legumes for mitigation of climate change and the provision of feedstock for biofuels and biorefineries. A review. Agron. Sustain. Dev. 2011, 32, 329–364. [Google Scholar] [CrossRef]
- Stagnari, F.; Maggio, A.; Galieni, A.; Pisante, M. Multiple benefits of legumes for agriculture sustainability: An overview. Chem. Biol. Technol. Agric. 2017, 4, 2. [Google Scholar] [CrossRef]
- Cusworth, G.; Garnett, T.; Lorimer, J. Legume dreams: The contested futures of sustainable plant-based food systems in Europe. Glob. Environ. Chang. 2021, 69, 102321. [Google Scholar] [CrossRef] [PubMed]
- Kumar, S.; Meena, R.S.; Lal, R.; Singh Yadav, G.; Mitran, T.; Meena, B.L.; Dotaniya, M.L.; EL-Sabagh, A. Role of Legumes in Soil Carbon Sequestration. In Legumes for Soil Health and Sustainable Management; Springer: Singapore, 2018; pp. 109–138. [Google Scholar] [CrossRef]
- Kumar, S.; Bamboriya, S.D.; Rani, K.; Meena, R.S.; Sheoran, S.; Loyal, A.; Kumawat, A.; Jhariya, M.K. Grain legumes: A diversified diet for sustainable livelihood, food, and nutritional security. In Advances in Legumes for Sustainable Intensification; Academic Press: Cambridge, MA, USA, 2022; pp. 157–178. [Google Scholar] [CrossRef]
- Semba, R.D.; Ramsing, R.; Rahman, N.; Kraemer, K.; Bloem, M.W. Legumes as a sustainable source of protein in human diets. Glob. Food Sec. 2021, 28, 100520. [Google Scholar] [CrossRef]
- Conti, M.V.; Guzzetti, L.; Panzeri, D.; De Giuseppe, R.; Coccetti, P.; Labra, M.; Cena, H. Bioactive compounds in legumes: Implications for sustainable nutrition and health in the elderly population. Trends Food Sci. Technol. 2021, 117, 139–147. [Google Scholar] [CrossRef]
- Kaur, S.; Kumar, K.; Singh, L.; Sharanagat, V.S.; Nema, P.K.; Mishra, V.; Bhusan, B. Gluten-free grains: Importance, processing and its effect on quality of gluten-free products. Crit. Rev. Food Sci. Nutr. 2022, 1–28. [Google Scholar] [CrossRef] [PubMed]
- Foschia, M.; Horstmann, S.W.; Arendt, E.K.; Zannini, E. Legumes as Functional Ingredients in Gluten-Free Bakery and Pasta Products. Annu. Rev. Food Sci. Technol. 2017, 8, 75–96. [Google Scholar] [CrossRef] [PubMed]
- Tor-Roca, A.; Garcia-Aloy, M.; Mattivi, F.; Llorach, R.; Andres-Lacueva, C.; Urpi-Sarda, M. Phytochemicals in Legumes: A Qualitative Reviewed Analysis. J. Agric. Food Chem. 2020, 68, 13486–13496. [Google Scholar] [CrossRef]
- Martín-Cabrejas, M.A. Legumes: An Overview. In Legumes: Nutritional Quality, Processing and Potential Health Benefit; The Royal Society of Chemistry: London, UK, 2019; ISBN 9781788014595. [Google Scholar]
- Melini, F.; Melini, V. Phenolic compounds in novel foods: Insights into white and pigmented quinoa. Eur. Food Res. Technol. 2022, 248, 2955–2968. [Google Scholar] [CrossRef]
- Melini, V.; Panfili, G.; Fratianni, A.; Acquistucci, R. Bioactive compounds in rice on Italian market: Pigmented varieties as a source of carotenoids, total phenolic compounds and anthocyanins, before and after cooking. Food Chem. 2019, 277, 119–127. [Google Scholar] [CrossRef]
- Melini, V.; Melini, F. Functional components and anti-nutritional factors in gluten-free grains: A focus on quinoa seeds. Foods 2021, 10, 351. [Google Scholar] [CrossRef] [PubMed]
- Juárez-Chairez, M.F.; Meza-Márquez, O.G.; Márquez-Flores, Y.K.; Jiménez-Martínez, C. Potential anti-inflammatory effects of legumes: A review. Br. J. Nutr. 2022, 128, 2158–2169. [Google Scholar] [CrossRef] [PubMed]
- Garcés-Rimón, M.; Morales, D.; Miguel-Castro, M. Potential Role of Bioactive Proteins and Peptides Derived from Legumes towards Metabolic Syndrome. Nutrients 2022, 14, 5271. [Google Scholar] [CrossRef] [PubMed]
- Geraldo, R.; Santos, C.S.; Pinto, E.; Vasconcelos, M.W. Widening the Perspectives for Legume Consumption: The Case of Bioactive Non-nutrients. Front. Plant Sci. 2022, 13, 772054. [Google Scholar] [CrossRef] [PubMed]
- Mullins, A.P.; Arjmandi, B.H. Health Benefits of Plant-Based Nutrition: Focus on Beans in Cardiometabolic Diseases. Nutrients 2021, 13, 519. [Google Scholar] [CrossRef] [PubMed]
- Meenu, M.; Chen, P.; Mradula, M.; Chang, S.K.C.; Xu, B. New insights into chemical compositions and health-promoting effects of black beans (Phaseolus vulgaris L.). Food Front. 2023, 4, 1019–1038. [Google Scholar] [CrossRef]
- Beebe, S.E.; Rao, I.M.; Devi, M.J.; Polania, J. Common beans, biodiversity, and multiple stresses: Challenges of drought resistance in tropical soils. Crop Pasture Sci. 2014, 65, 667–675. [Google Scholar] [CrossRef]
- Uebersax, M.A.; Cichy, K.A.; Gomez, F.E.; Porch, T.G.; Heitholt, J.; Osorno, J.M.; Kamfwa, K.; Snapp, S.S.; Bales, S. Dry beans (Phaseolus vulgaris L.) as a vital component of sustainable agriculture and food security—A review. Legum. Sci. 2023, 5, e155. [Google Scholar] [CrossRef]
- Chávez-Servia, J.L.; Heredia-García, E.; Mayek-Pérez, N.; Aquino-Bolaños, E.N.; Hernández-Delgado, S.; Carrillo-Rodríguez, J.C.; Gill-Langarica, H.R.; Vera-Guzmán, A.M. Diversity of Common Bean (Phaseolus vulgaris L.) Landraces and the Nutritional Value of their Grains. In Grain Legumes; InTech: Rijeka, Croatia, 2016. [Google Scholar] [CrossRef]
- Kaur, P.; Serventi, L. Introduction: Legume processing. In Upcycling Legume Water: From Wastewater to Food Ingredients; Springer Nature: Berlin/Heidelberg, Germany, 2020; pp. 1–12. [Google Scholar] [CrossRef]
- Food and Agriculture Organization of the United Nations. The Art of Cooking and What You Can Do to Make It More Sustainable. Available online: https://www.fao.org/fao-stories/article/en/c/1412071/ (accessed on 18 December 2023).
- Richardson, L.; Fernqvist, F. Transforming the Food System through Sustainable Gastronomy—How Chefs Engage with Food Democracy. J. Hunger Environ. Nutr. 2022, 1–17. [Google Scholar] [CrossRef]
- Amoah, I.; Ascione, A.; Muthanna, F.M.S.; Feraco, A.; Camajani, E.; Gorini, S.; Armani, A.; Caprio, M.; Lombardo, M. Sustainable Strategies for Increasing Legume Consumption: Culinary and Educational Approaches. Foods 2023, 12, 2265. [Google Scholar] [CrossRef]
- Frankowska, A.; Schmidt Rivera, X.; Bridle, S.; Marielle Rodrigues Galdino Kluczkovski, A.; Tereza da Silva, J.; Adriano Martins, C.; Rauber, F.; Bertazzi Levy, R.; Cook, J.; Reynolds, C. Impacts of home cooking methods and appliances on the GHG emissions of food. Nat. Food 2020, 1, 787–791. [Google Scholar] [CrossRef] [PubMed]
- Xu, B.J.; Chang, S.K.C. Total phenolic content and antioxidant properties of eclipse black beans (Phaseolus vulgaris L.) as affected by processing methods. J. Food Sci. 2008, 73, 19–28. [Google Scholar] [CrossRef] [PubMed]
- Alshikh, N.; de Camargo, A.C.; Shahidi, F. Phenolics of selected lentil cultivars: Antioxidant activities and inhibition of low-density lipoprotein and DNA damage. J. Funct. Foods 2015, 18, 1022–1038. [Google Scholar] [CrossRef]
- Melini, V.; Melini, F.; Luziatelli, F.; Ruzzi, M. Development of an Ultrasound-Assisted Extraction Procedure for the Simultaneous Determination of Anthocyanins and Phenolic Acids in Black Beans. Foods 2023, 12, 3566. [Google Scholar] [CrossRef] [PubMed]
- Novák, P.; Havlíček, V. Protein Extraction and Precipitation. In Proteomic Profiling and Analytical Chemistry. The Crossroads, 2nd ed.; Elsevier: Amsterdam, The Netherlands, 2016; pp. 51–62. [Google Scholar] [CrossRef]
- Sompong, R.; Siebenhandl-Ehn, S.; Linsberger-Martin, G.; Berghofer, E. Physicochemical and antioxidative properties of red and black rice varieties from Thailand, China and Sri Lanka. Food Chem. 2011, 124, 132–140. [Google Scholar] [CrossRef]
- Melini, V.; Melini, F. Modelling and Optimization of Ultrasound-Assisted Extraction of Phenolic Compounds from Black Quinoa by Response Surface Methodology. Molecules 2021, 26, 3616. [Google Scholar] [CrossRef] [PubMed]
- Melini, V.; Melini, F. Phytic acid and phytase. In A Centum of Valuable Plant Bioactives; Mushtaq, M., Anwar, F., Eds.; Academic Press: London, UK, 2021; pp. 681–706. ISBN 9780128229231. [Google Scholar]
- AOAC International. AOAC Official Method 2005.02 Total Monomeric Anthocyanin Pigment Content of Fruit Juices, Beverages, Natural Colorants, and Wines pH Differential Method First Action 2005. In Official Methods of Analysis of AOAC International; Oxford University Ress: Oxford, UK, 2005; Volume 88, p. 37.1.68. [Google Scholar]
- Balakrishnan, G.; Goodrich Schneider, R. Quinoa flavonoids and their bioaccessibility during in vitro gastrointestinal digestion. J. Cereal Sci. 2020, 95, 103070. [Google Scholar] [CrossRef]
- Chigwedere, C.M.; Njoroge, D.M.; Van Loey, A.M.; Hendrickx, M.E. Understanding the Relations Among the Storage, Soaking, and Cooking Behavior of Pulses: A Scientific Basis for Innovations in Sustainable Foods for the Future. Compr. Rev. Food Sci. Food Saf. 2019, 18, 1135–1165. [Google Scholar] [CrossRef]
- Perera, D.; Devkota, L.; Garnier, G.; Panozzo, J.; Dhital, S. Hard-to-cook phenomenon in common legumes: Chemistry, mechanisms and utilisation. Food Chem. 2023, 415, 135743. [Google Scholar] [CrossRef]
- Bassett, A.; Hooper, S.; Cichy, K. Genetic variability of cooking time in dry beans (Phaseolus vulgaris L.) related to seed coat thickness and the cotyledon cell wall. Food Res. Int. 2021, 141, 109886. [Google Scholar] [CrossRef]
- Mba, O.I.; Kwofie, E.M.; Ngadi, M. Kinetic modelling of polyphenol degradation during common beans soaking and cooking. Heliyon 2019, 5, e01613. [Google Scholar] [CrossRef] [PubMed]
- Wood, J.A. Evaluation of cooking time in pulses: A review. Cereal Chem. 2017, 94, 32–48. [Google Scholar] [CrossRef]
- Lobefaro, S.; Piciocchi, C.; Luisi, F.; Miraglia, L.; Romito, N.; Luneia, R.; Foti, S.; Mocini, E.; Poggiogalle, E.; Lenzi, A.; et al. Cooking techniques and nutritional quality of food: A comparison between traditional and innovative ways of cooking. Int. J. Gastron. Food Sci. 2021, 25, 100381. [Google Scholar] [CrossRef]
- Mecha, E.; Leitão, S.T.; Carbas, B.; Serra, A.T.; Moreira, P.M.; Veloso, M.M.; Gomes, R.; Figueira, M.E.; Brites, C.; Vaz Patto, M.C.; et al. Characterization of soaking process’ impact in common beans phenolic composition: Contribute from the unexplored Portuguese germplasm. Foods 2019, 8, 296. [Google Scholar] [CrossRef] [PubMed]
- Eshraq, B.; Mona, A.; Sayed, A.; Emam, A. Effect of Soaking, Cooking and Germination on Chemical Constituents and Bioactive Compounds as well as their Cytotoxic Activities of Black Bean Extracts. Nat. Prod. Chem. Res. 2016, 4, 1–7. [Google Scholar] [CrossRef]
- Nicolás-García, M.; Perucini-Avendaño, M.; Jiménez-Martínez, C.; de Perea-Flores, M.J.; Gómez-Patiño, M.B.; Arrieta-Báez, D.; Dávila-Ortiz, G. Bean phenolic compound changes during processing: Chemical interactions and identification. J. Food Sci. 2021, 86, 643–655. [Google Scholar] [CrossRef] [PubMed]
- Ravoninjatovo, M.; Ralison, C.; Servent, A.; Morel, G.; Achir, N.; Andriamazaoro, H.; Dornier, M. Effects of soaking and thermal treatment on nutritional quality of three varieties of common beans (Phaseolus vulgaris L.) from Madagascar. Legum. Sci. 2022, 4, e143. [Google Scholar] [CrossRef]
- Fabbri, A.D.T.; Crosby, G.A. A review of the impact of preparation and cooking on the nutritional quality of vegetables and legumes. Int. J. Gastron. Food Sci. 2016, 3, 2–11. [Google Scholar] [CrossRef]
- Yang, Q.Q.; Gan, R.Y.; Ge, Y.Y.; Zhang, D.; Corke, H. Polyphenols in Common Beans (Phaseolus vulgaris L.): Chemistry, Analysis, and Factors Affecting Composition. Compr. Rev. Food Sci. Food Saf. 2018, 17, 1518–1539. [Google Scholar] [CrossRef]
- Natella, F.; Belelli, F.; Ramberti, A.; Scaccini, C. Microwave and traditional cooking methods: Effect of cooking on antioxidant capacity and phenolic compounds content of seven vegetables. J. Food Biochem. 2010, 34, 796–810. [Google Scholar] [CrossRef]
- Ombra, M.N.; D’Acierno, A.; Nazzaro, F.; Riccardi, R.; Spigno, P.; Zaccardelli, M.; Pane, C.; Maione, M.; Fratianni, F. Phenolic Composition and Antioxidant and Antiproliferative Activities of the Extracts of Twelve Common Bean (Phaseolus vulgaris L.) Endemic Ecotypes of Southern Italy before and after Cooking. Oxid. Med. Cell. Longev. 2016, 2016, 1398298. [Google Scholar] [CrossRef] [PubMed]
- Garretson, L.; Marti, A. Pigmented Heirloom Beans: Nutritional and Cooking Quality Characteristics. Cereal Chem. 2017, 94, 363–368. [Google Scholar] [CrossRef]
- Cappellini, F.; Marinelli, A.; Toccaceli, M.; Tonelli, C.; Petroni, K. Anthocyanins: From Mechanisms of Regulation in Plants to Health Benefits in Foods. Front. Plant Sci. 2021, 12, 8049. [Google Scholar] [CrossRef] [PubMed]
- Patras, A.; Brunton, N.P.; O’Donnell, C.; Tiwari, B.K. Effect of thermal processing on anthocyanin stability in foods; mechanisms and kinetics of degradation. Trends Food Sci. Technol. 2010, 21, 3–11. [Google Scholar] [CrossRef]
- López-Martínez, L.X.; Leyva-López, N.; Gutiérrez-Grijalva, E.P.; Heredia, J.B. Effect of cooking and germination on bioactive compounds in pulses and their health benefits. J. Funct. Foods 2017, 38, 624–634. [Google Scholar] [CrossRef]
- Soriano Sancho, R.A.; Pavan, V.; Pastore, G.M. Effect of in vitro digestion on bioactive compounds and antioxidant activity of common bean seed coats. Food Res. Int. 2015, 76, 74–78. [Google Scholar] [CrossRef]
- Madrera, R.R.; Valles, B.S. Development and validation of ultrasound assisted extraction (UAE) and HPLC-DAD method for determination of polyphenols in dry beans (Phaseolus vulgaris). J. Food Compos. Anal. 2020, 85, 103334. [Google Scholar] [CrossRef]
- Giusti, F.; Capuano, E.; Sagratini, G.; Pellegrini, N. A comprehensive investigation of the behaviour of phenolic compounds in legumes during domestic cooking and in vitro digestion. Food Chem. 2019, 285, 458–467. [Google Scholar] [CrossRef]
- Chandrasekara, A.; Shahidi, F. Bioaccessibility and antioxidant potential of millet grain phenolics as affected by simulated in vitro digestion and microbial fermentation. J. Funct. Foods 2012, 4, 226–237. [Google Scholar] [CrossRef]
- Liang, L.; Wu, X.; Zhao, T.; Zhao, J.; Li, F.; Zou, Y.; Mao, G.; Yang, L. In vitro bioaccessibility and antioxidant activity of anthocyanins from mulberry (Morus atropurpurea Roxb.) following simulated gastro-intestinal digestion. Food Res. Int. 2012, 46, 76–82. [Google Scholar] [CrossRef]


Disclaimer/Publisher’s Note: The statements, opinions and data contained in all publications are solely those of the individual author(s) and contributor(s) and not of MDPI and/or the editor(s). MDPI and/or the editor(s) disclaim responsibility for any injury to people or property resulting from any ideas, methods, instructions or products referred to in the content. |
© 2023 by the authors. Licensee MDPI, Basel, Switzerland. This article is an open access article distributed under the terms and conditions of the Creative Commons Attribution (CC BY) license (https://creativecommons.org/licenses/by/4.0/).