
Analysis of the Potential Economic Impact of Parking Space Comprehensive Utilization on Traditional Business District


Abstract
:1. Introduction
- Question 1: Based on the survey data, what are the different customer classes, and what are the heterogeneities among EVU?
- Question 2: For the different customer classes identified above, to what extent can the combination of PSC and store marketing attract customer consumption?
- Question 3: How much can the PSC within the TBD enhance the economic vitality of surrounding shops?
2. Literature Review
2.1. BD Parking Issues
2.2. Shared Parking Economy
2.3. Shared Parking Behavior
3. Materials and Methods
- (1)
- To Leave or Not to Leave: When the shop you want to visit has no available parking spots, would you give up on shopping?
- (2)
- To Come or Not to Come: Different shared parking spots are provided at varying coupons, with corresponding compensation incentives. Which car park would you choose based on its distance and the offered incentives?
- (3)
- To Visit or Not to Visit: After parking your car, would you consider temporarily visiting nearby shops?
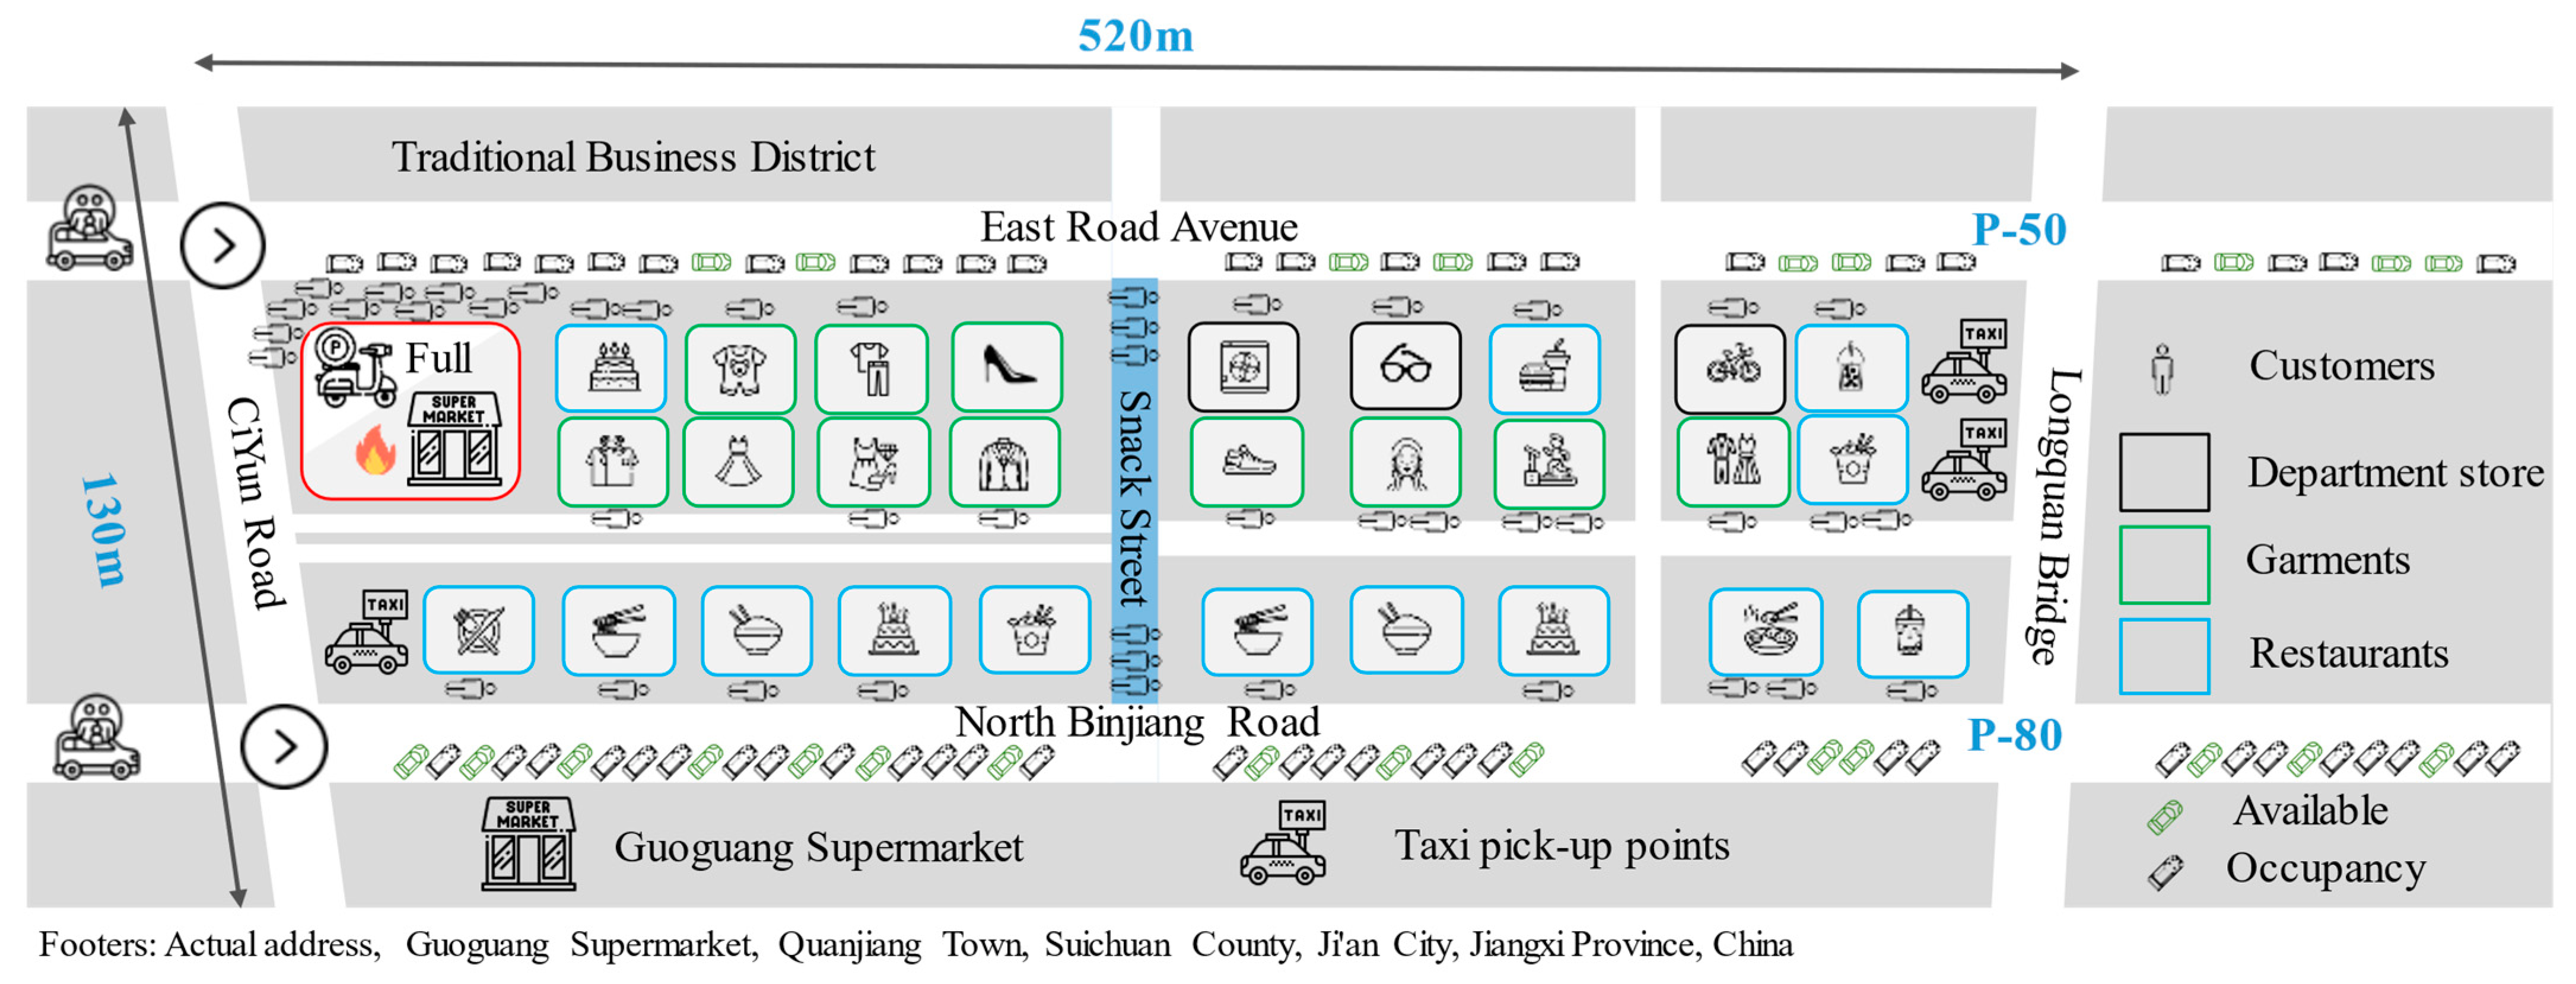
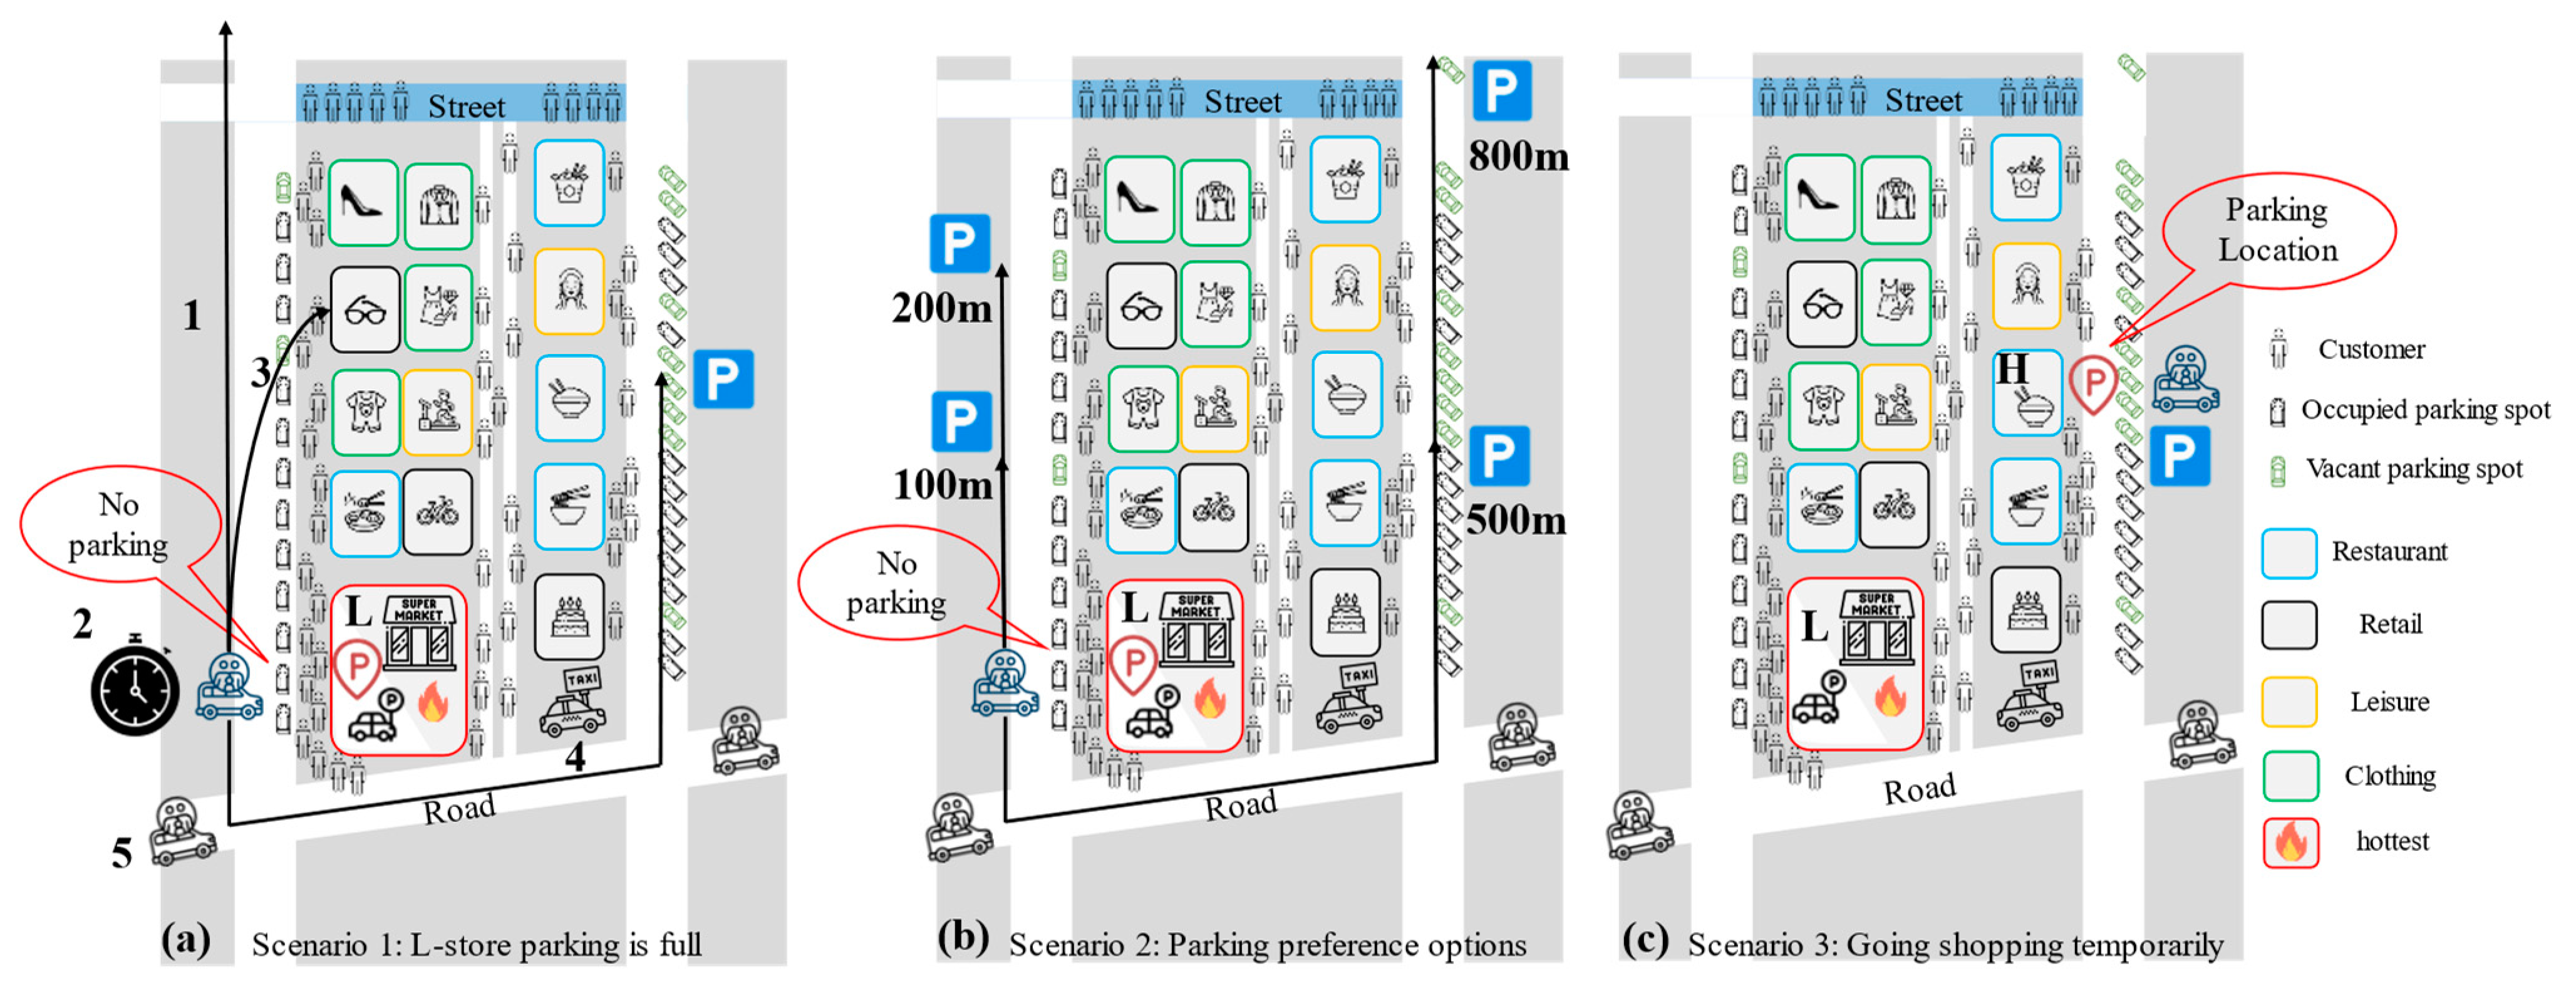
3.1. Experiment Design
- (1)
- Scenario 1: Before PSC—Leave or Not
- (2)
- Scenario 2: After PSC—Come or Not
- (3)
- Scenario 3: After PSC—Visit or Not
3.2. Data Survey
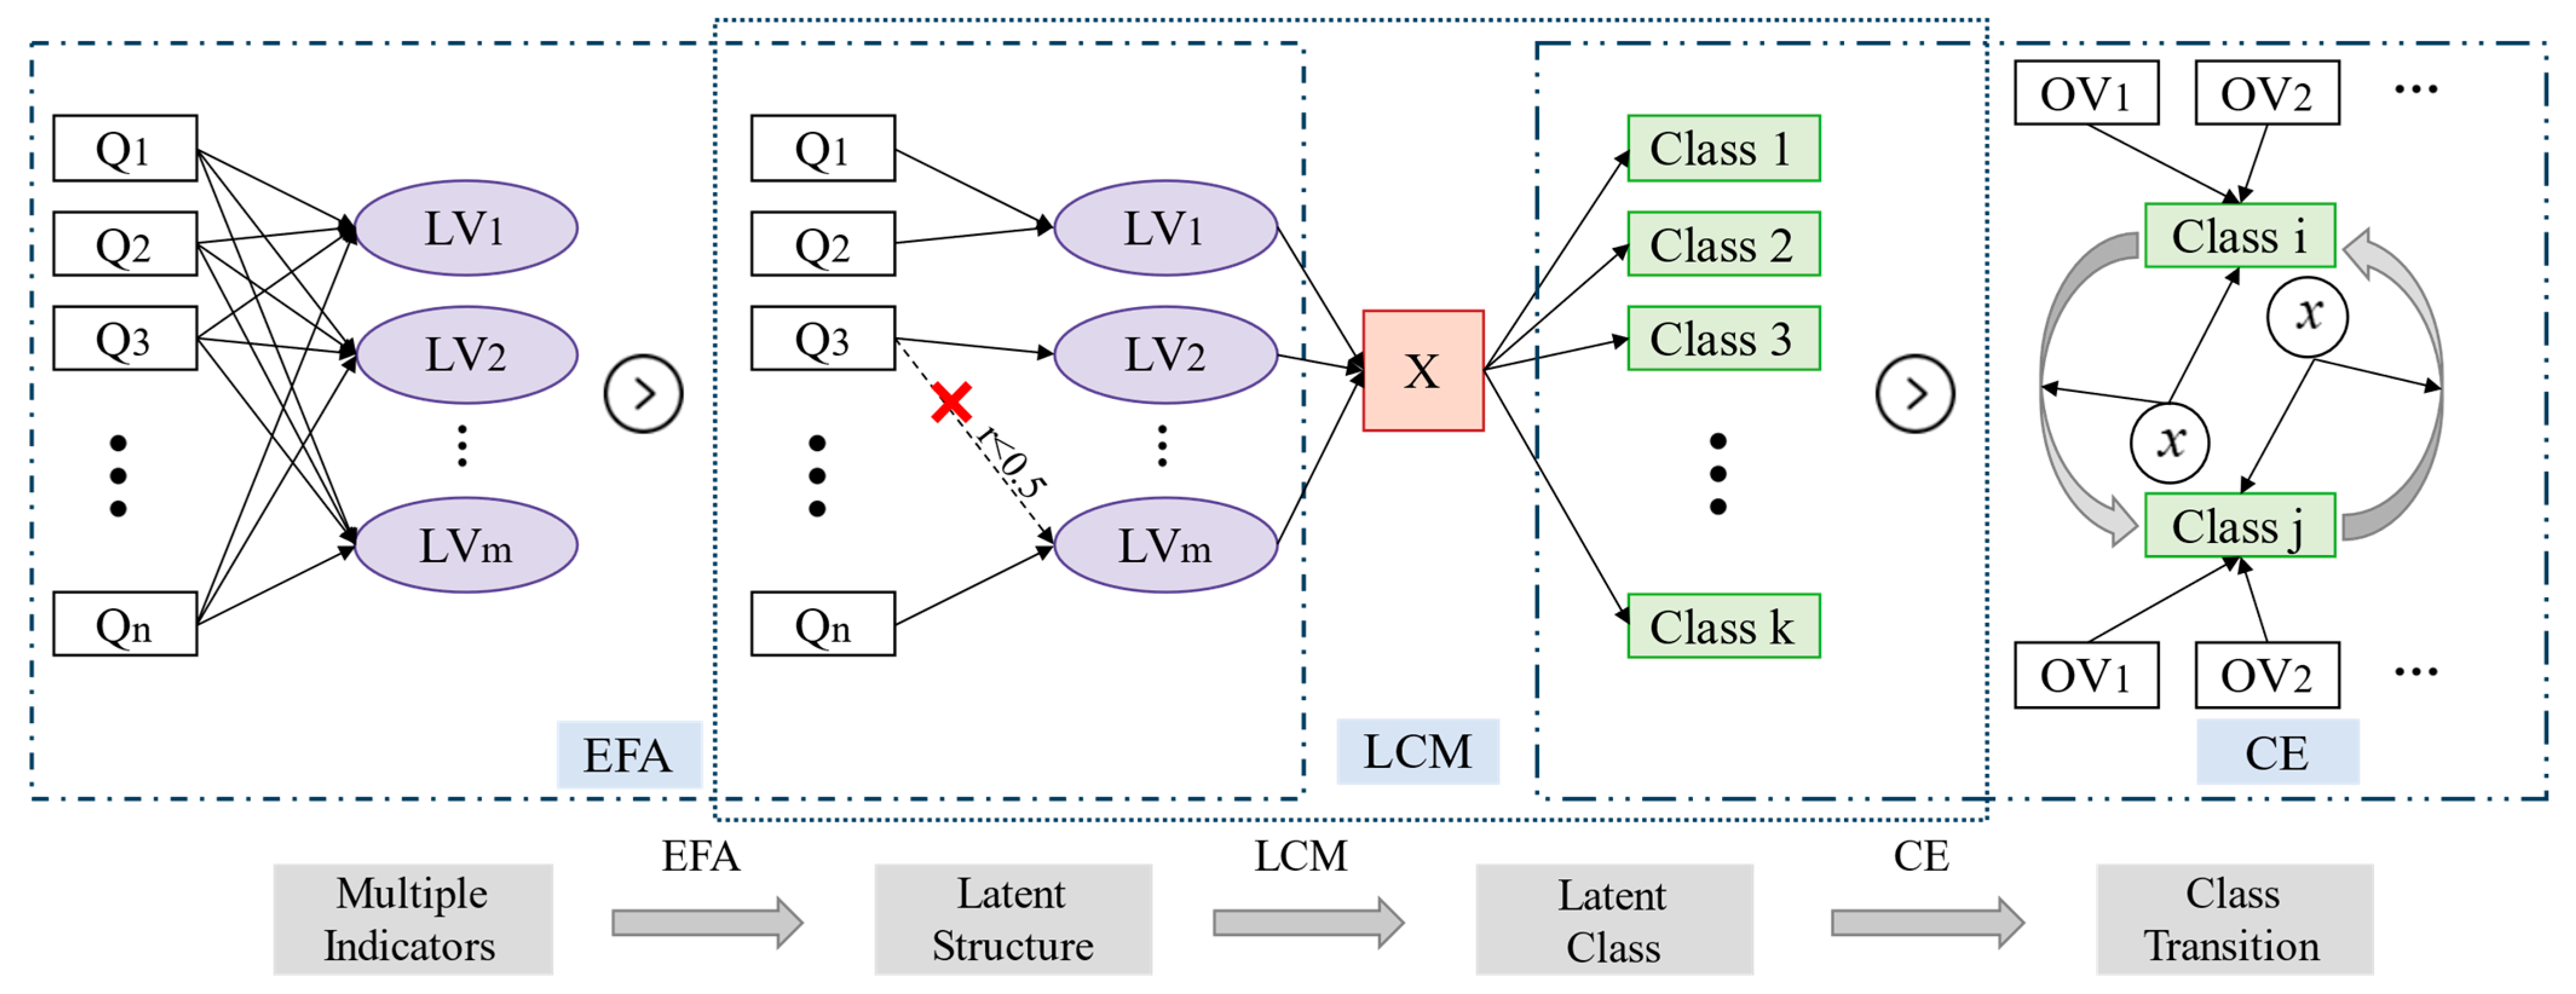
3.3. Methodology
- (1)
- EFA
- (2)
- LCM
- (3)
- CE
4. Results and Discussion
4.1. Validity Check of the Questionnaire
- (1)
- Reliability Test
- (2)
- Validity Test
- (3)
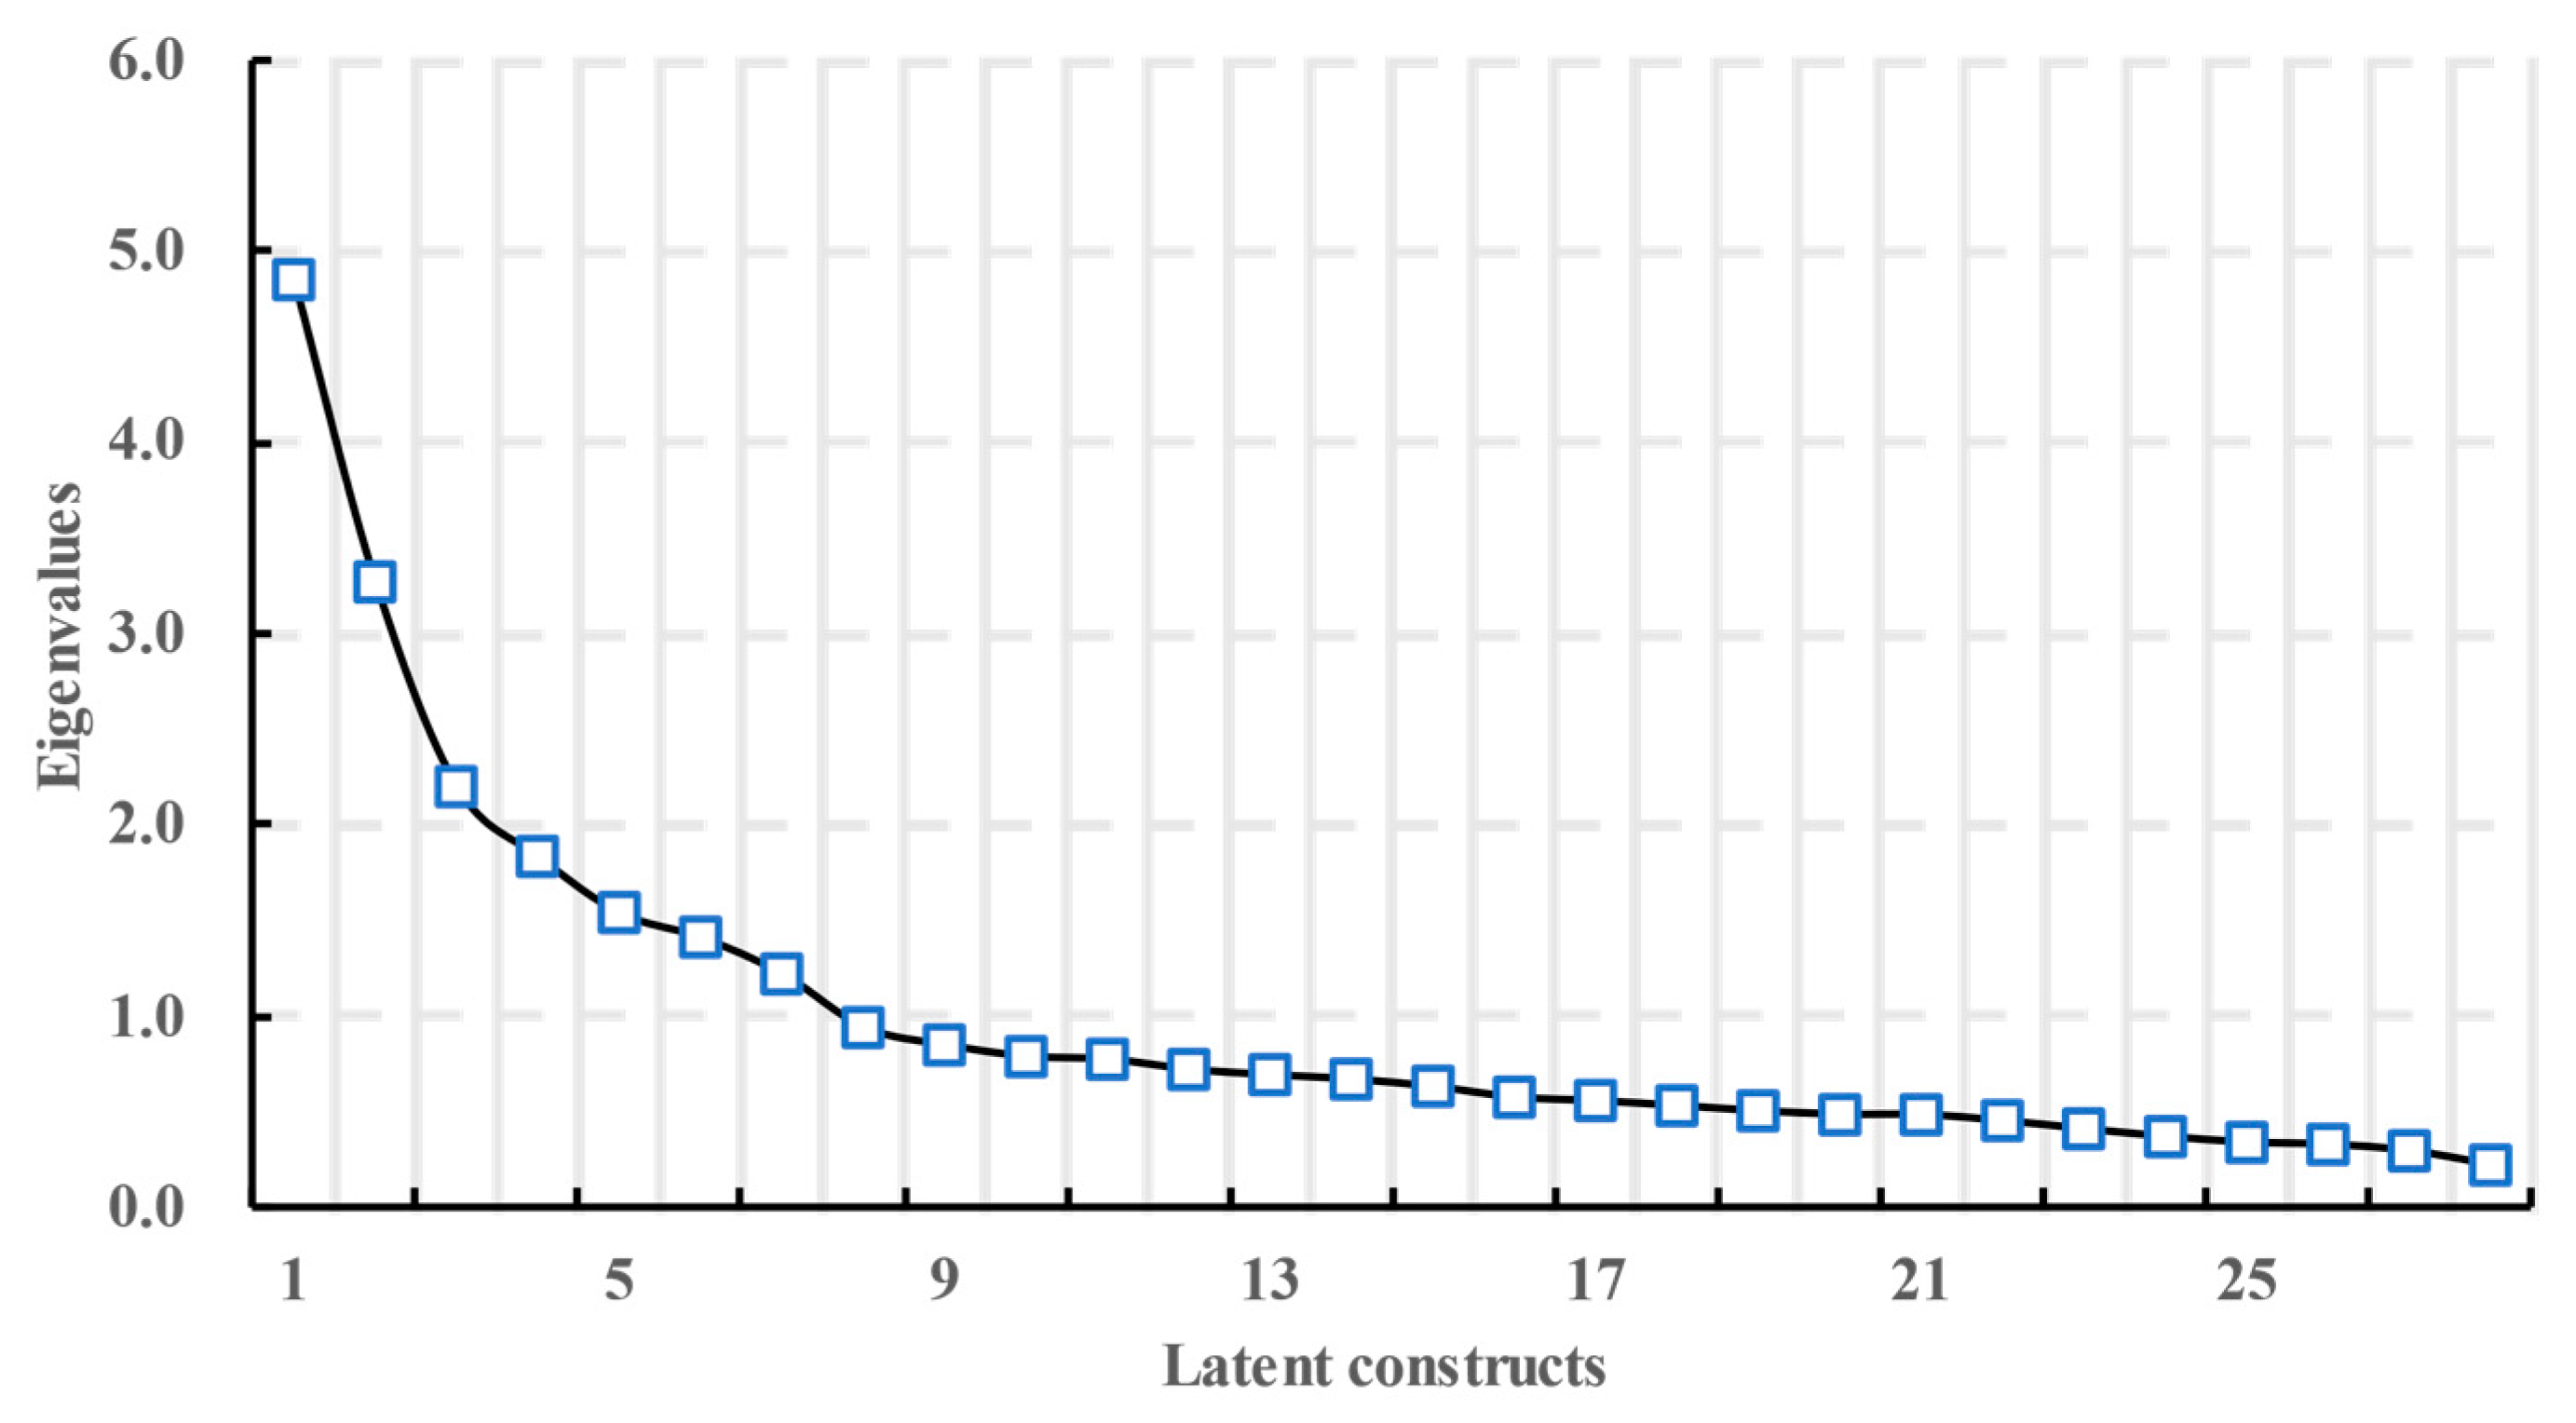
- Factor Analysis
4.2. Descriptive Statistics of the Questionnaire
- (1)
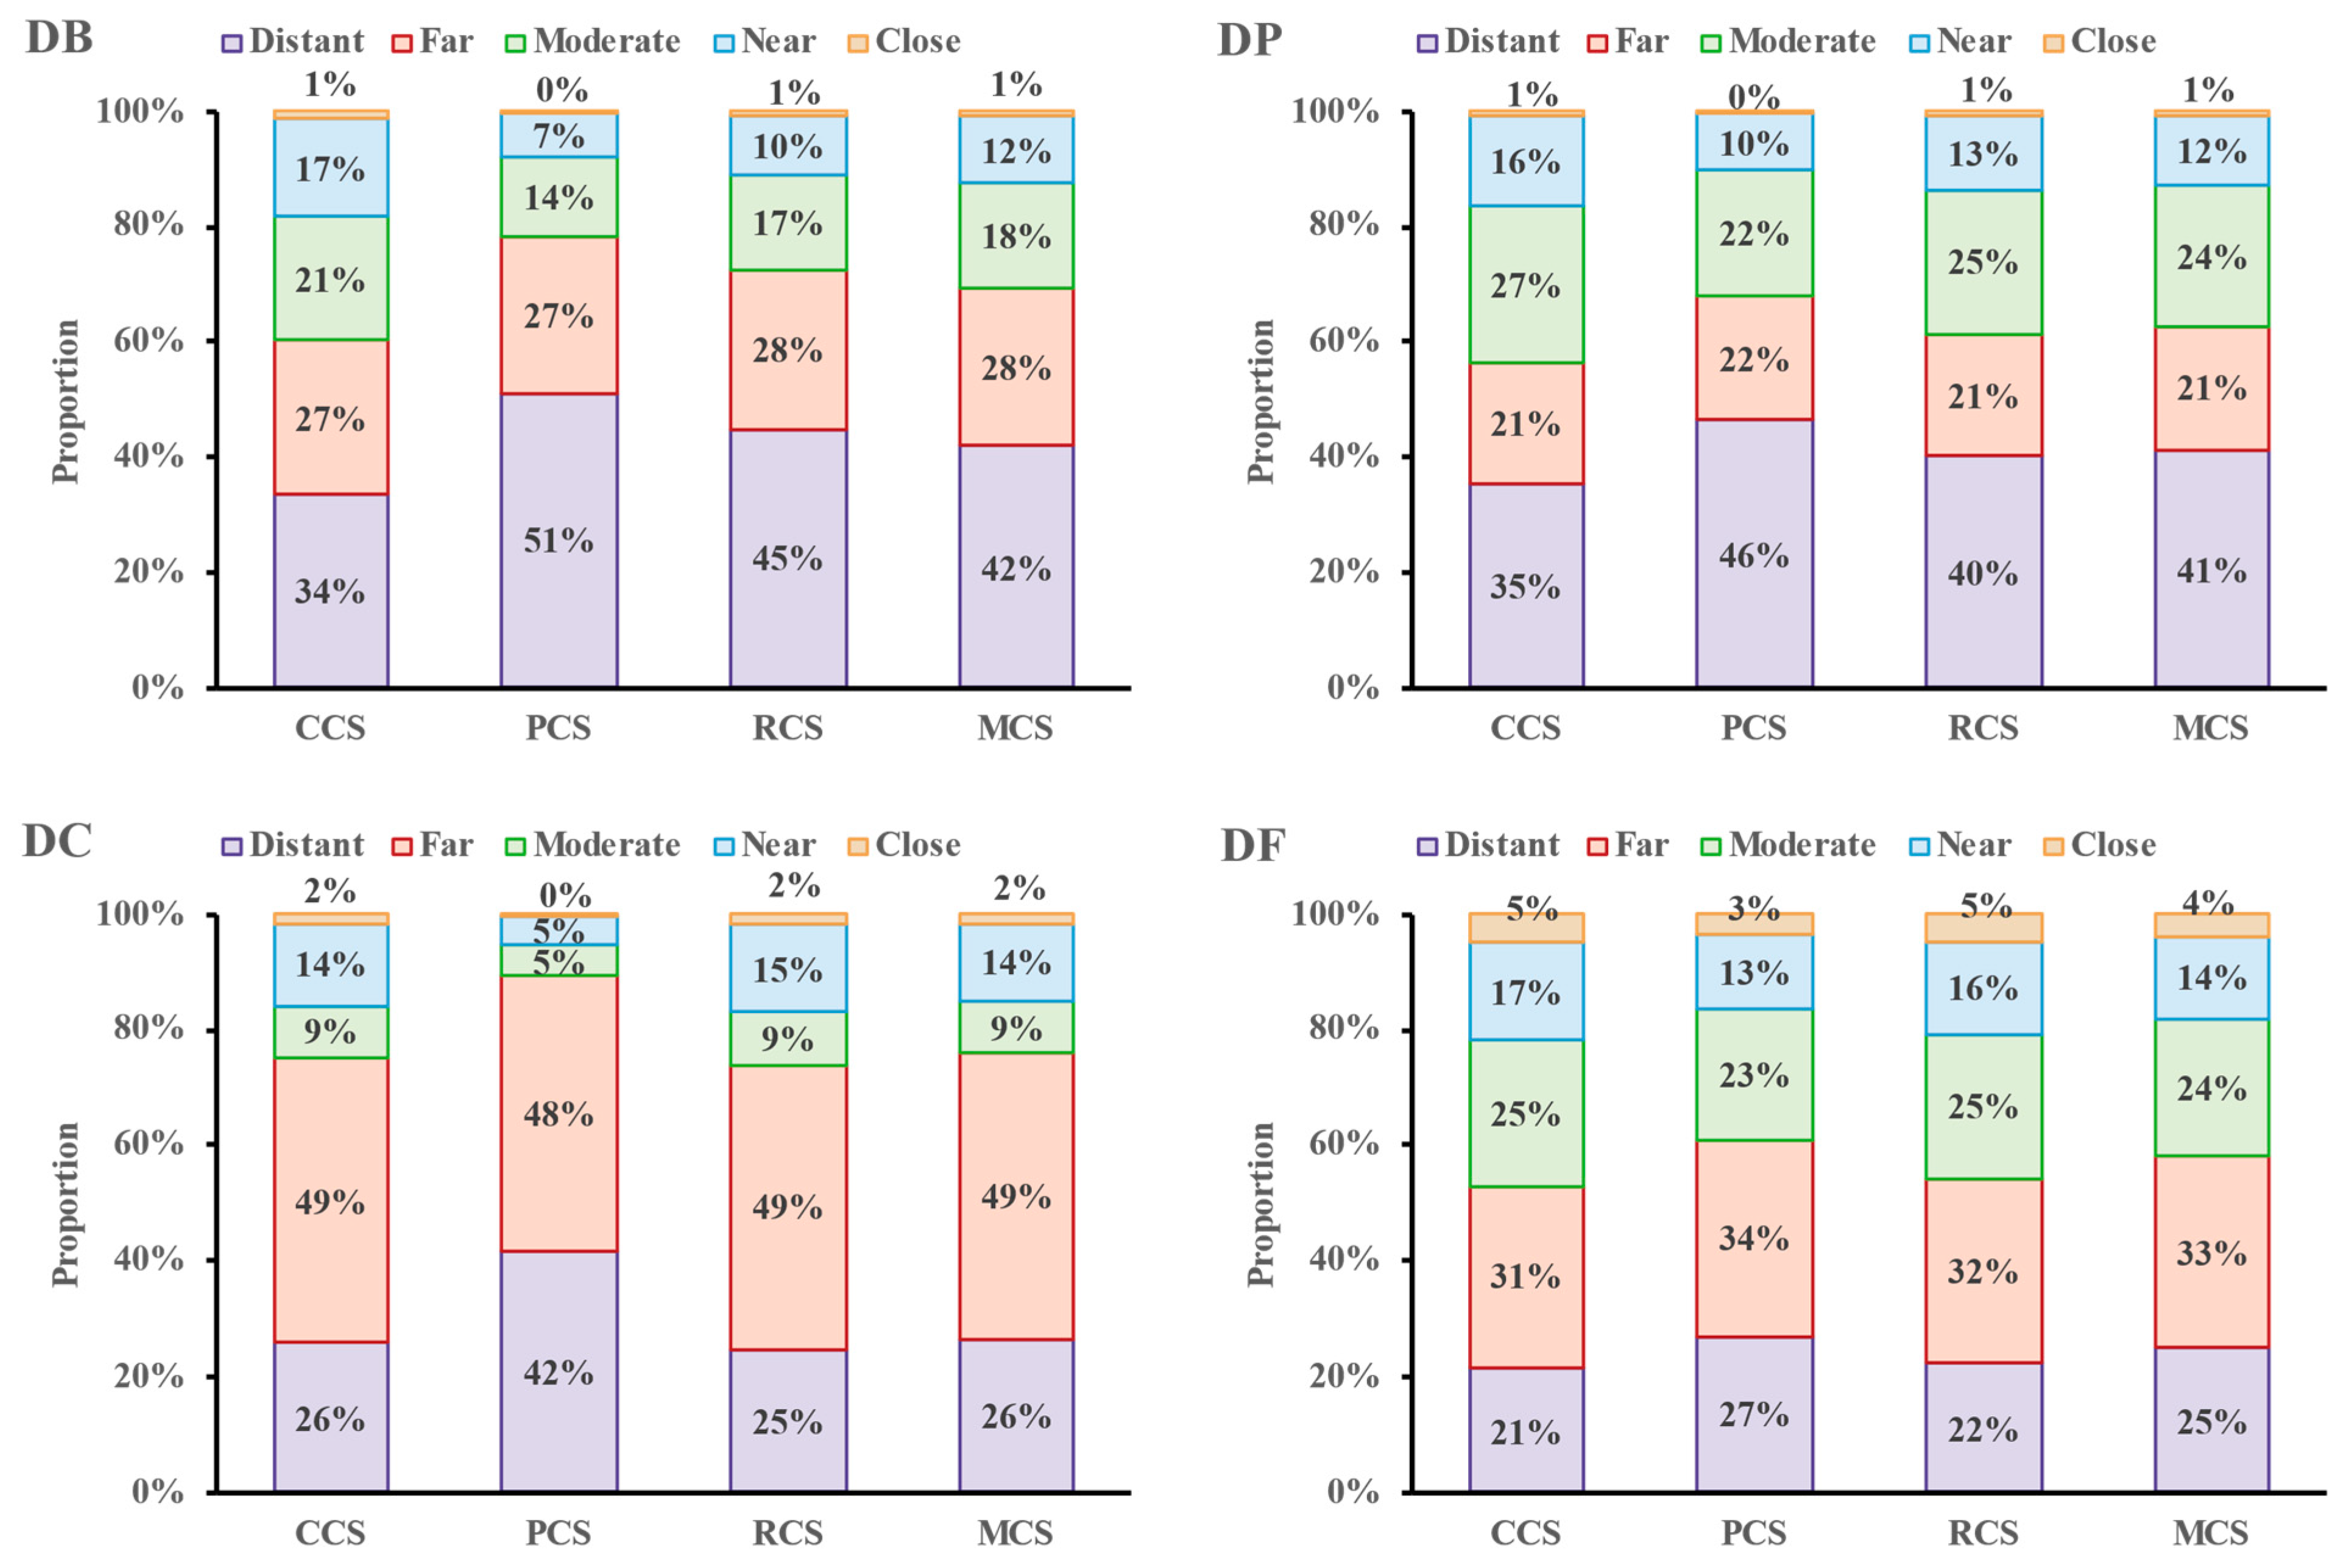
- Scene Selection Statistics (Figure 5)
- (2)
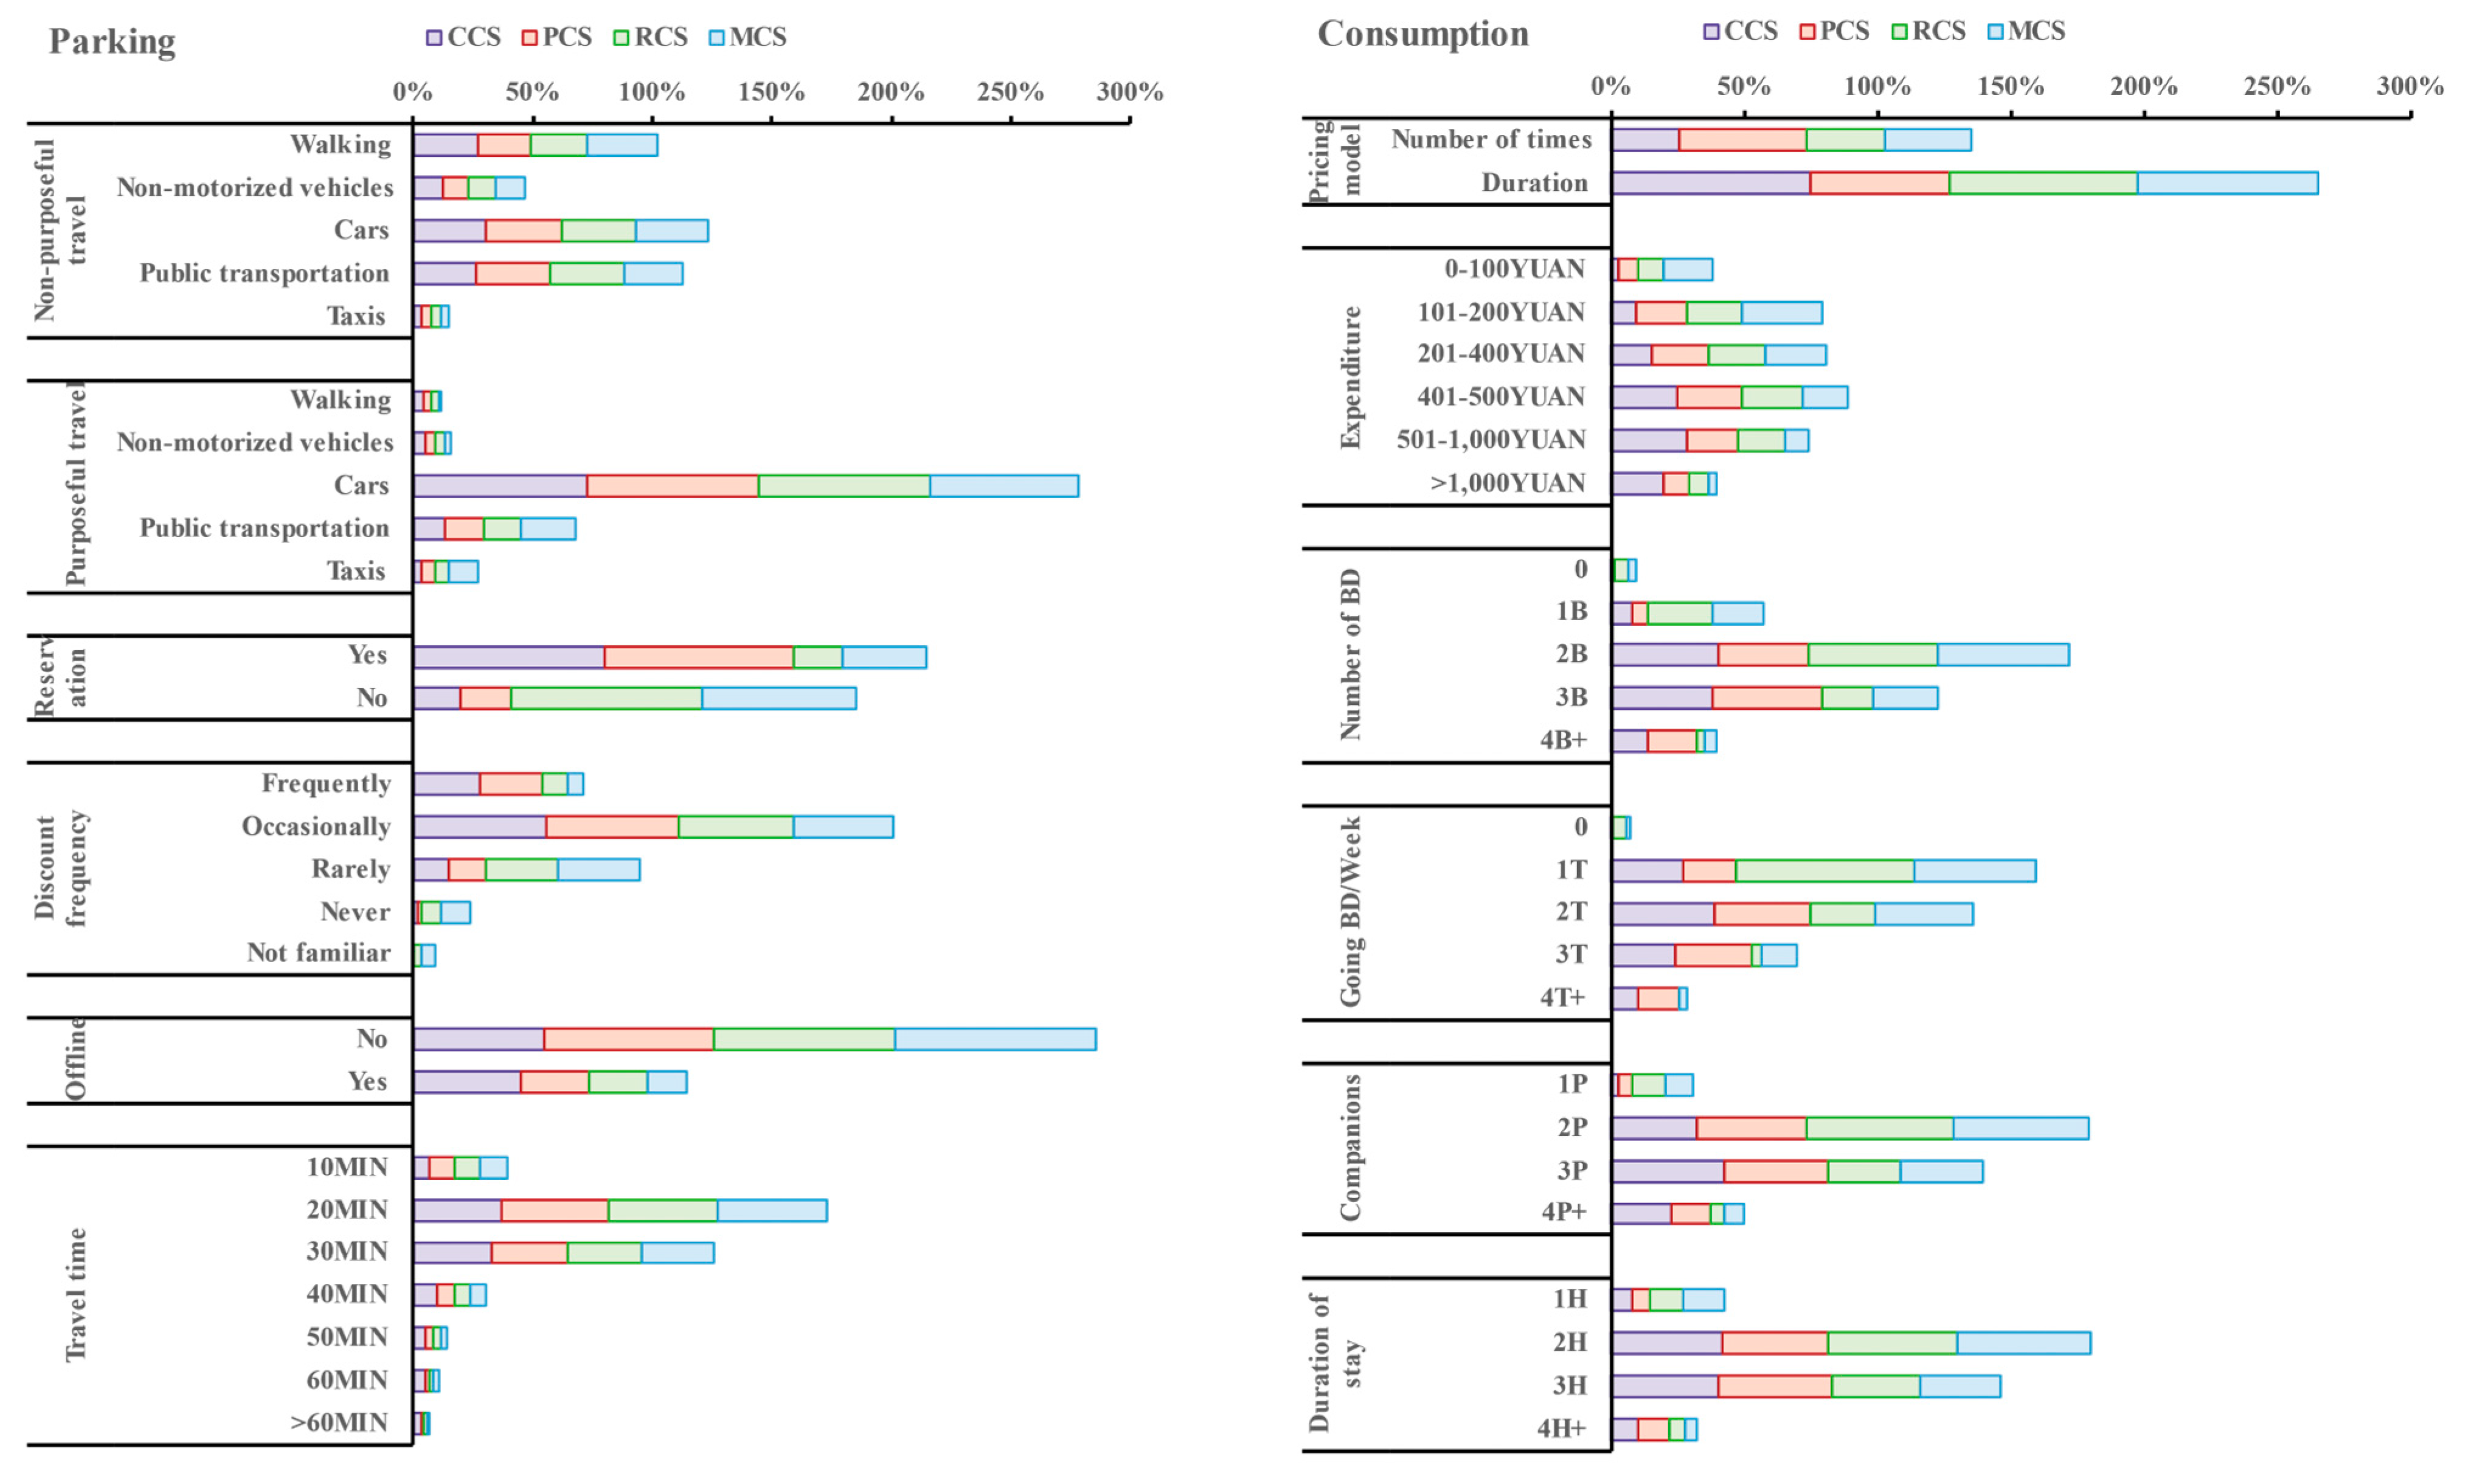
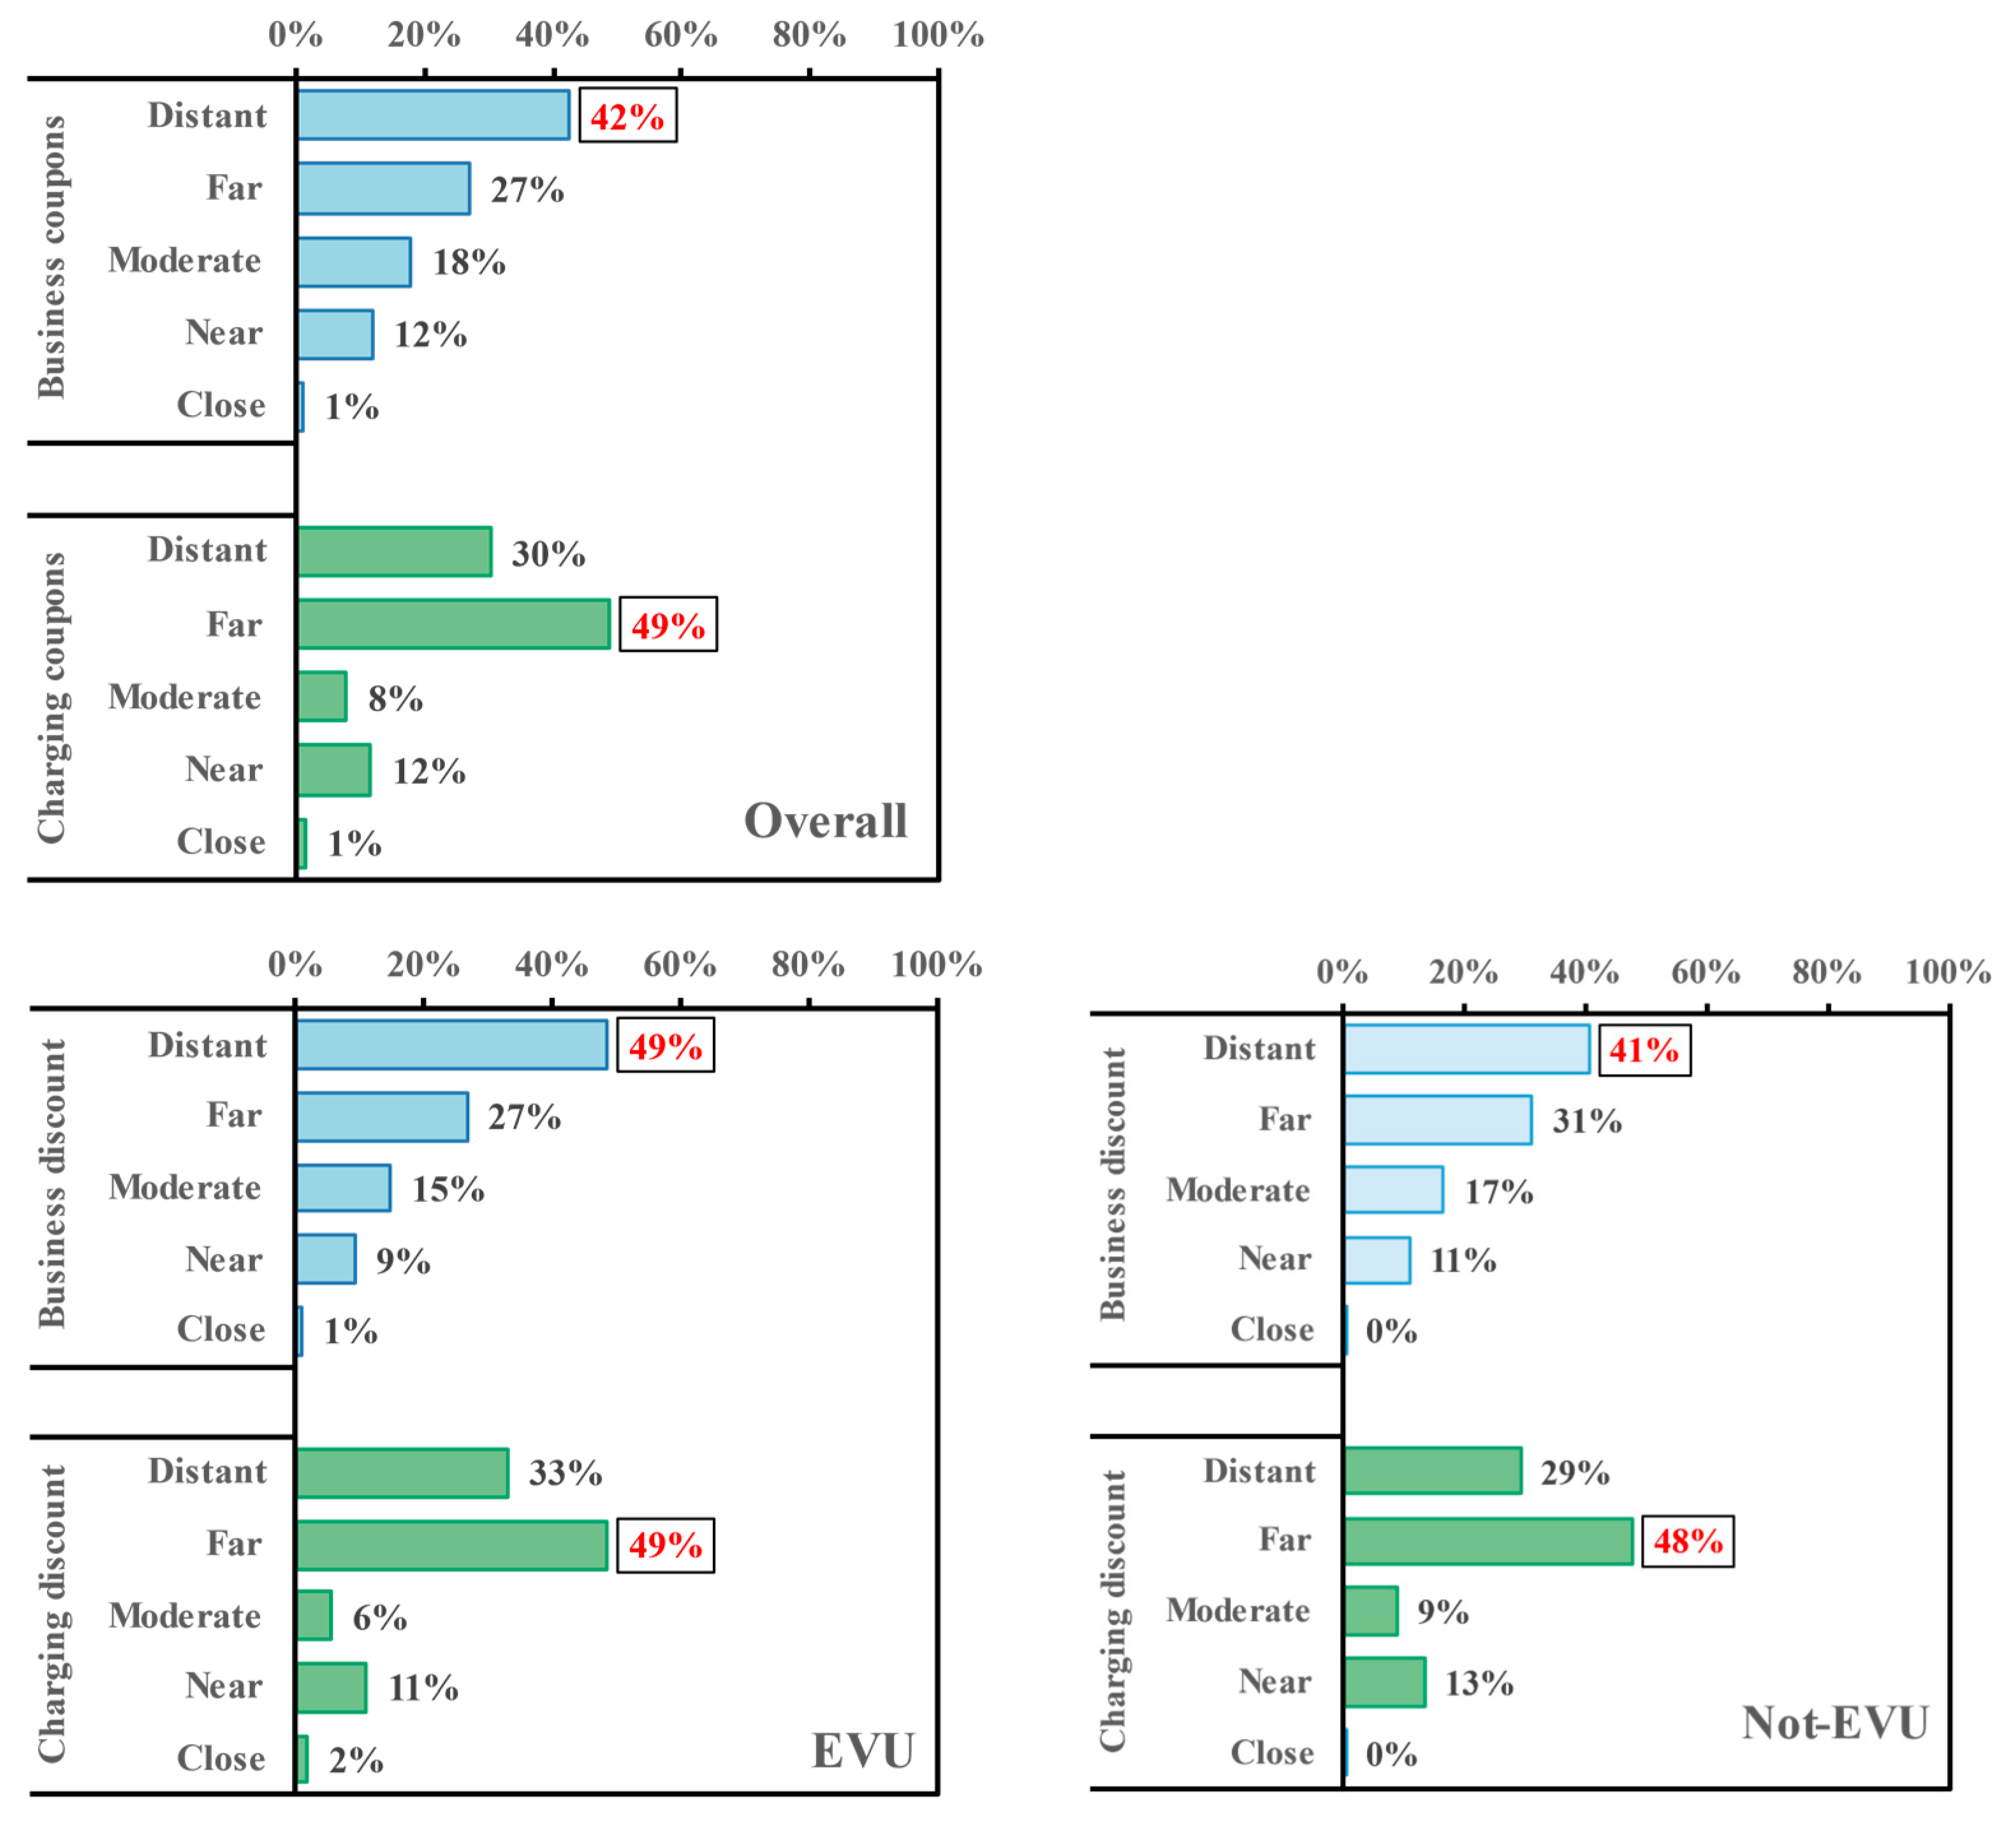
- Parking Attribute Statistics (Figure 6)
- (3)
- (4)
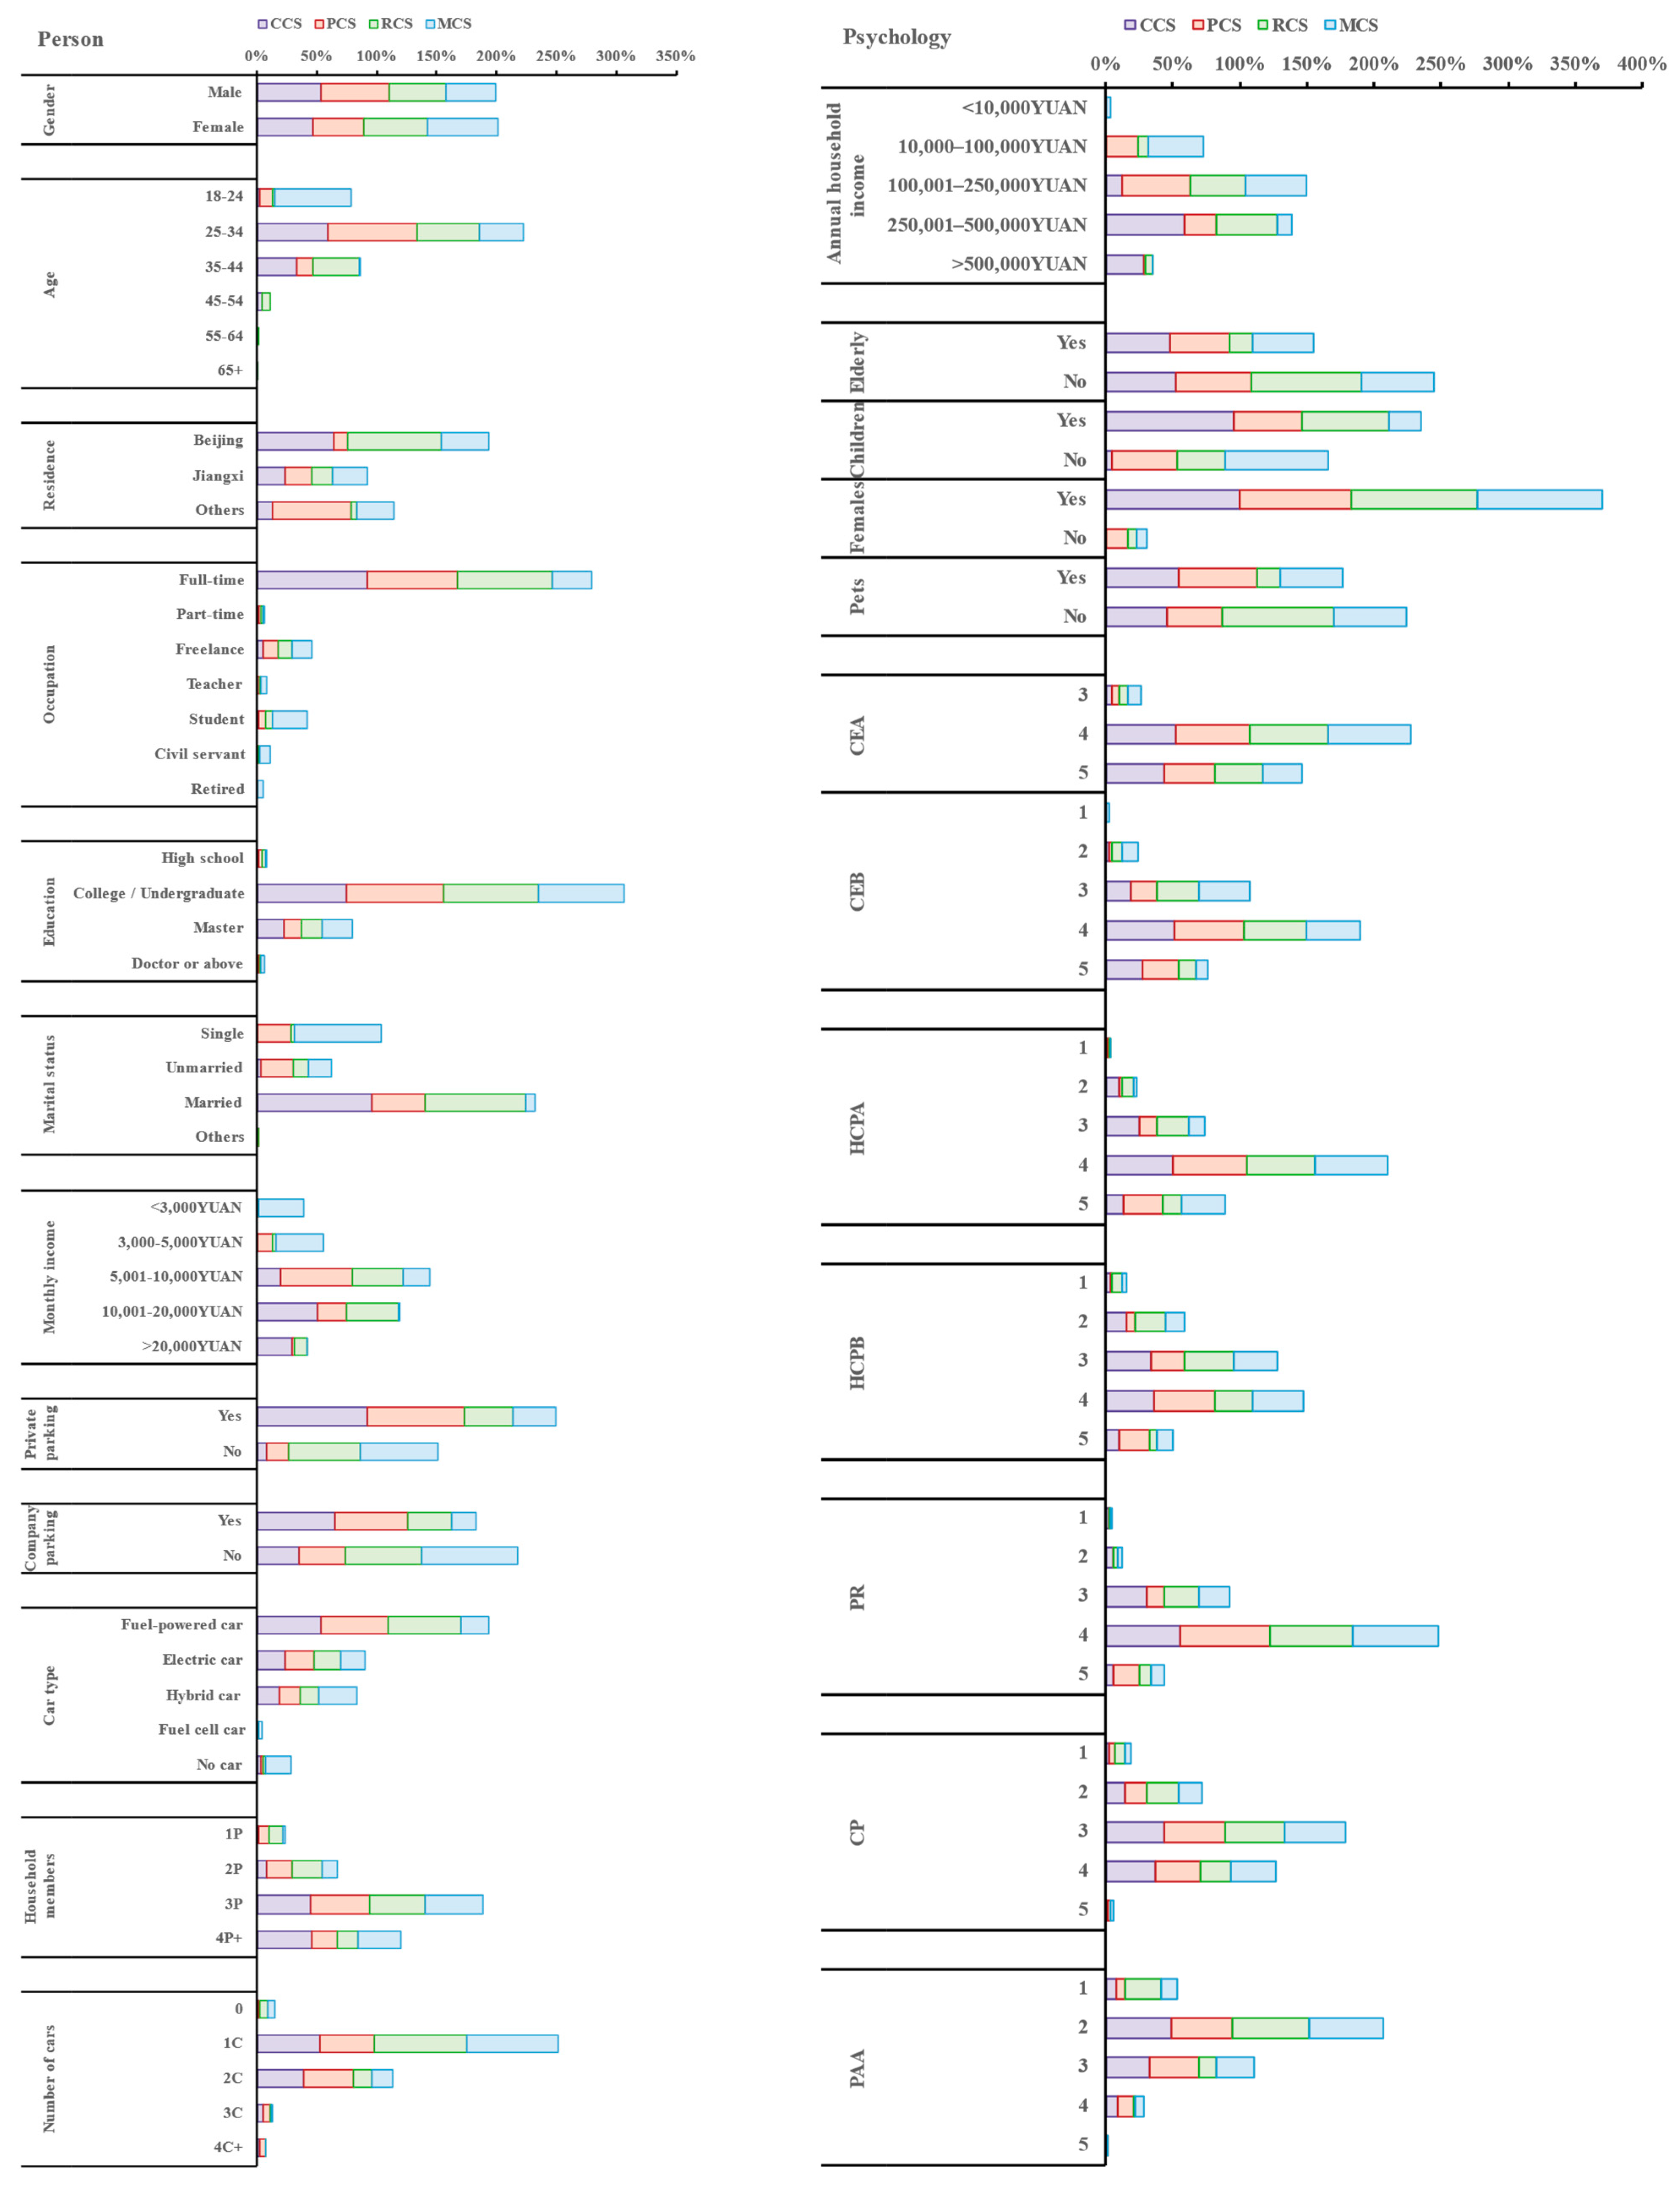
- Personal and Household Economic Statistics (Figure 9)
- (5)
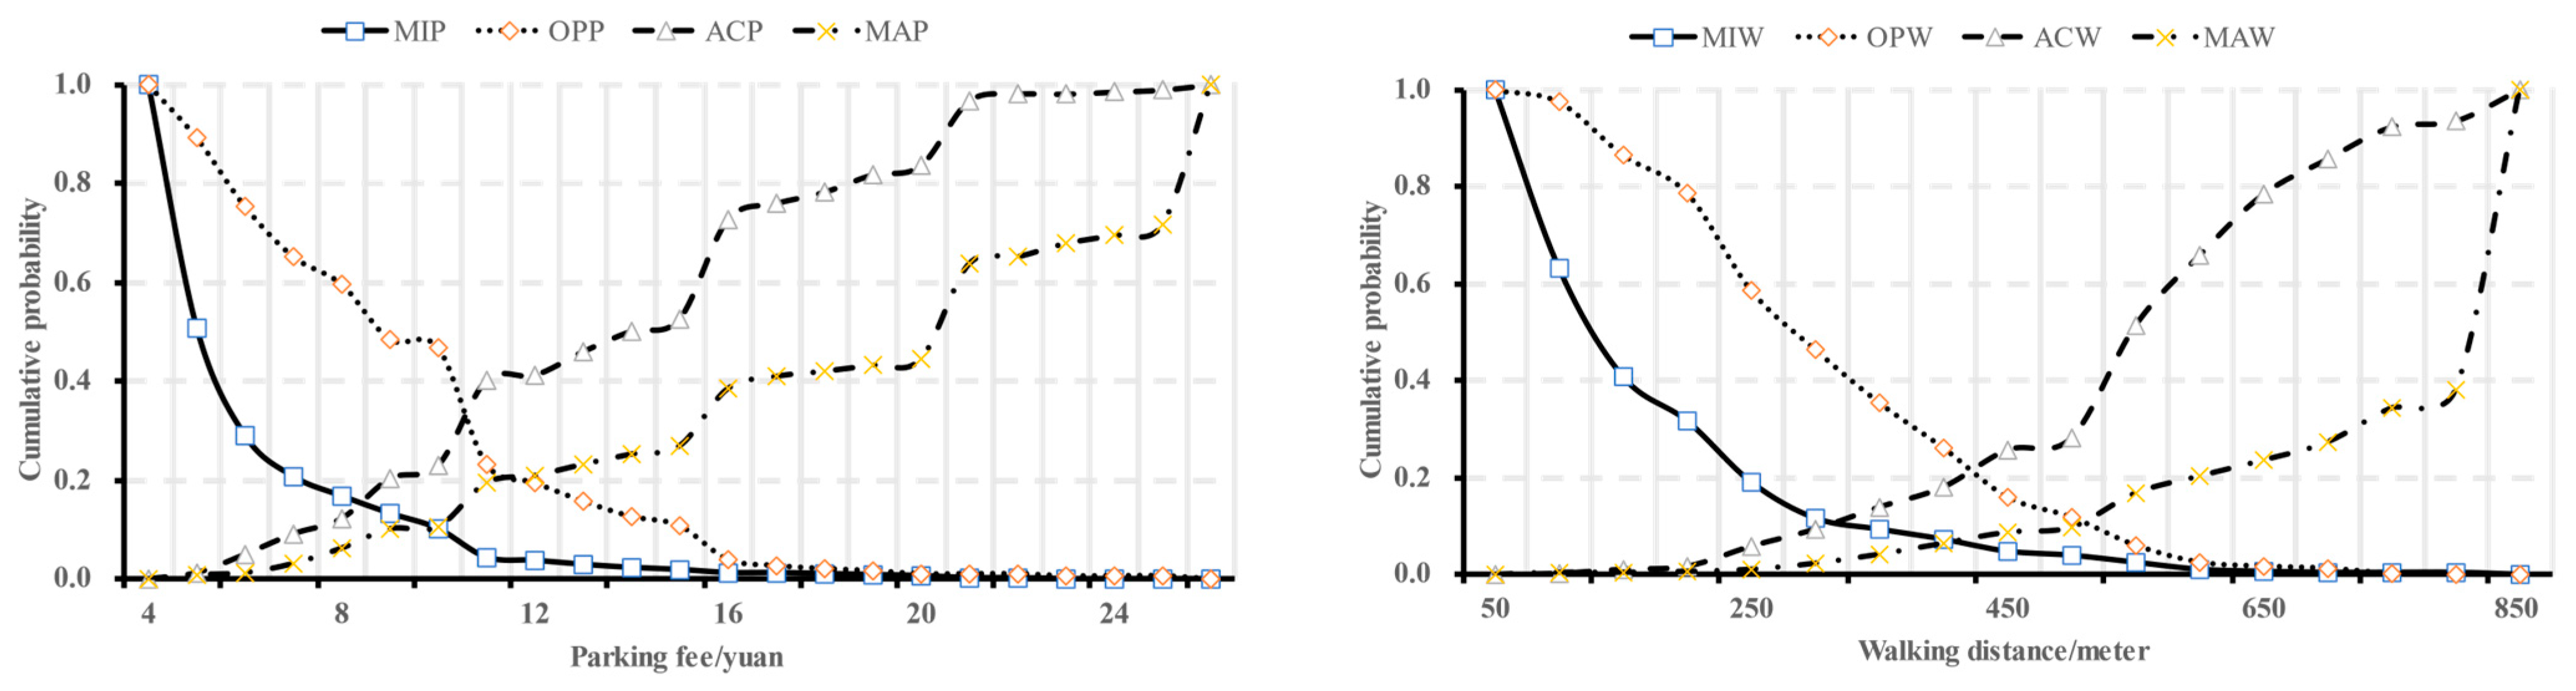
- Sensitivity of Parking Prices and Walking Distance.
4.3. Customer Class Results
- (1)
- Classification Quantity and Proportions
- (2)
- Characteristics of the Four Classes (Figure 13)
- Class 1: CCS. This class primarily consists of young to middle-aged males, mostly from Beijing, engaged in full-time jobs with high monthly incomes. They are married with children, have experience with parking reservations, and own parking spaces. Their households own 1–2 cars, and they have a high annual family income. Additionally, their consumption level mostly exceeds ¥400, and they have a higher CEB. Relatively, they prefer parking spots within a close walking distance.
- Class 2: PCS. This class mainly comprises young males, primarily from non-Beijing areas, with a college/university education and low monthly income. They have experience with parking reservations and own parking spots. Their households own 1–2 cars, and they have a low annual family income. Furthermore, their consumption level mostly ranges from ¥200 to ¥500, and they have a higher CEB, HCP, and PR. Relatively, they prefer parking spots with greater coupons.
- Class 3: RCS. This class is primarily composed of young to middle-aged females from Beijing. Most of them are married and have high monthly incomes, but they lack experience with parking reservations and do not own parking spots. Their households own one car, and they have a high annual family income. However, most of these households do not have elderly or pets. Moreover, their consumption level mostly ranges from ¥100 to ¥500, and they exhibit significant PAA. Relatively, they prefer parking spots near their destination stores.
- Class 4: MCS. This class primarily consists of young females from non-Beijing areas, including students, civil servants, and retirees, with a master’s degree. They are single with low monthly income, and have no experience with parking reservations or parking spaces. Most of their households own one car, and they have a low annual family income. Additionally, their consumption level mostly ranges from ¥100 to ¥400, and they have a higher HCPA. Relatively, they prefer parking spots with longer parking coupons.
- (3)
- EVU (Figure 14)
4.4. Covariate Analysis
- (1)
- CE (Figure 16)
- (2)
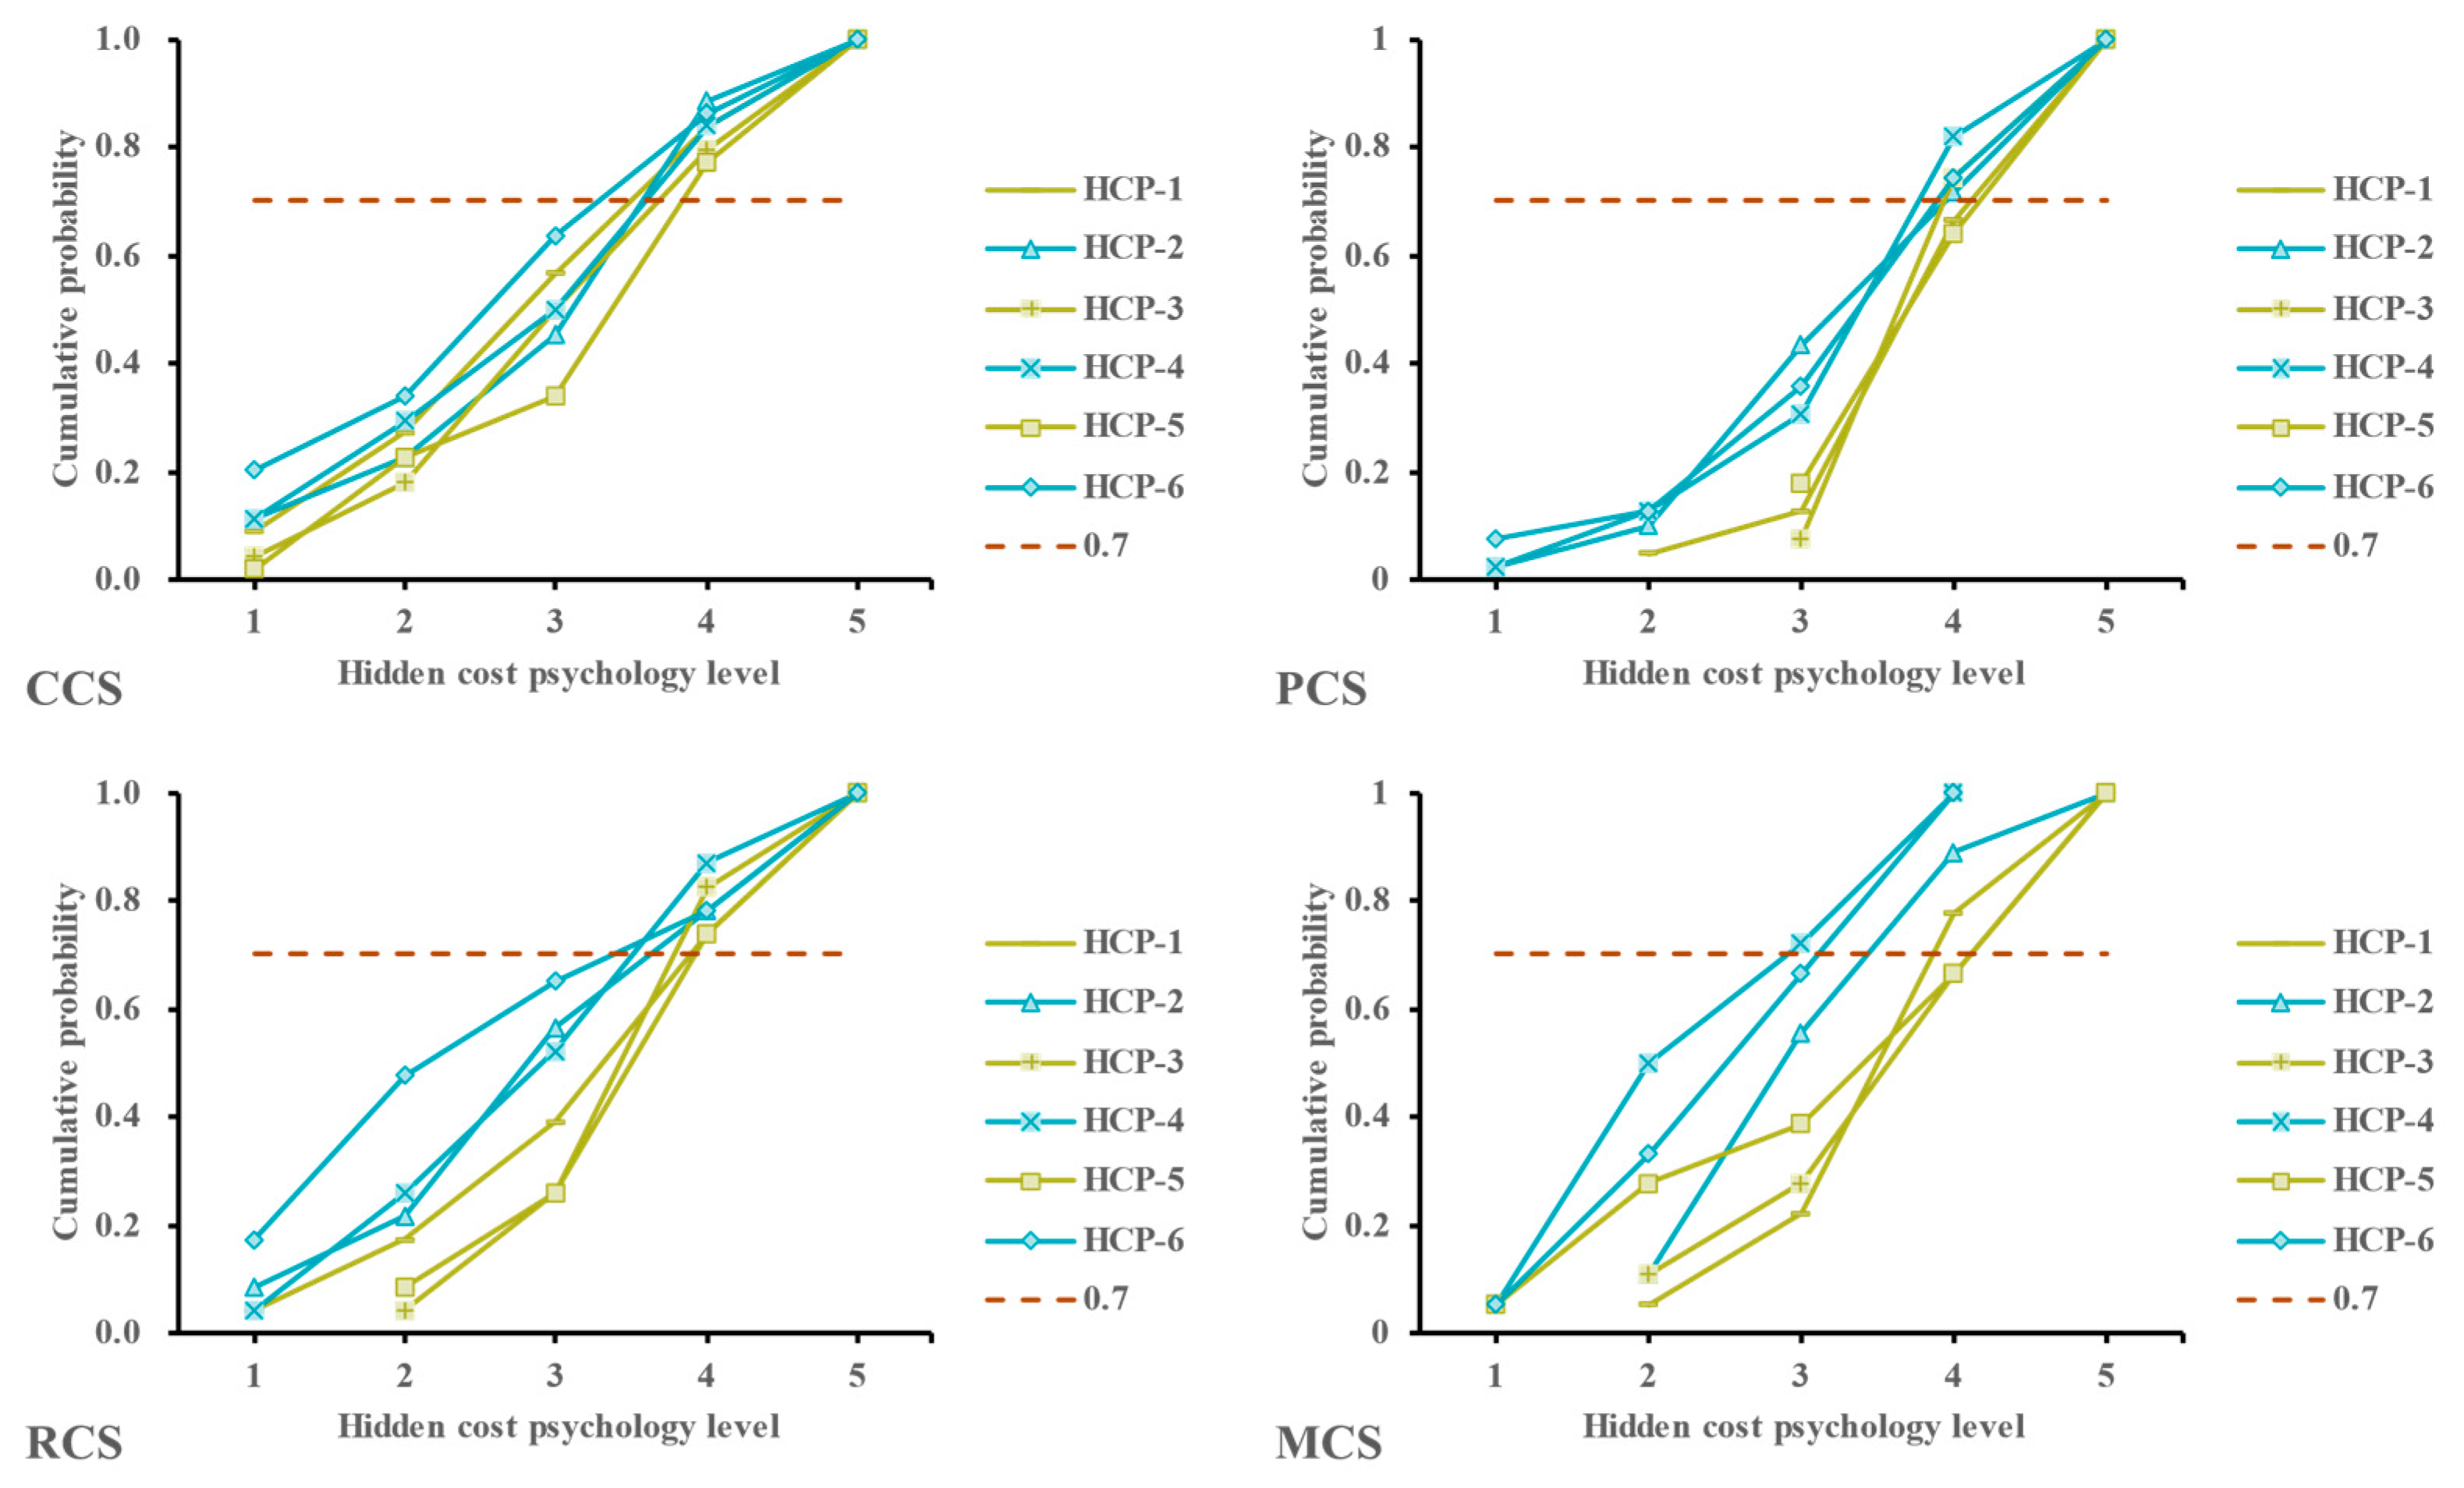
- HCP (Figure 17)
- (3)
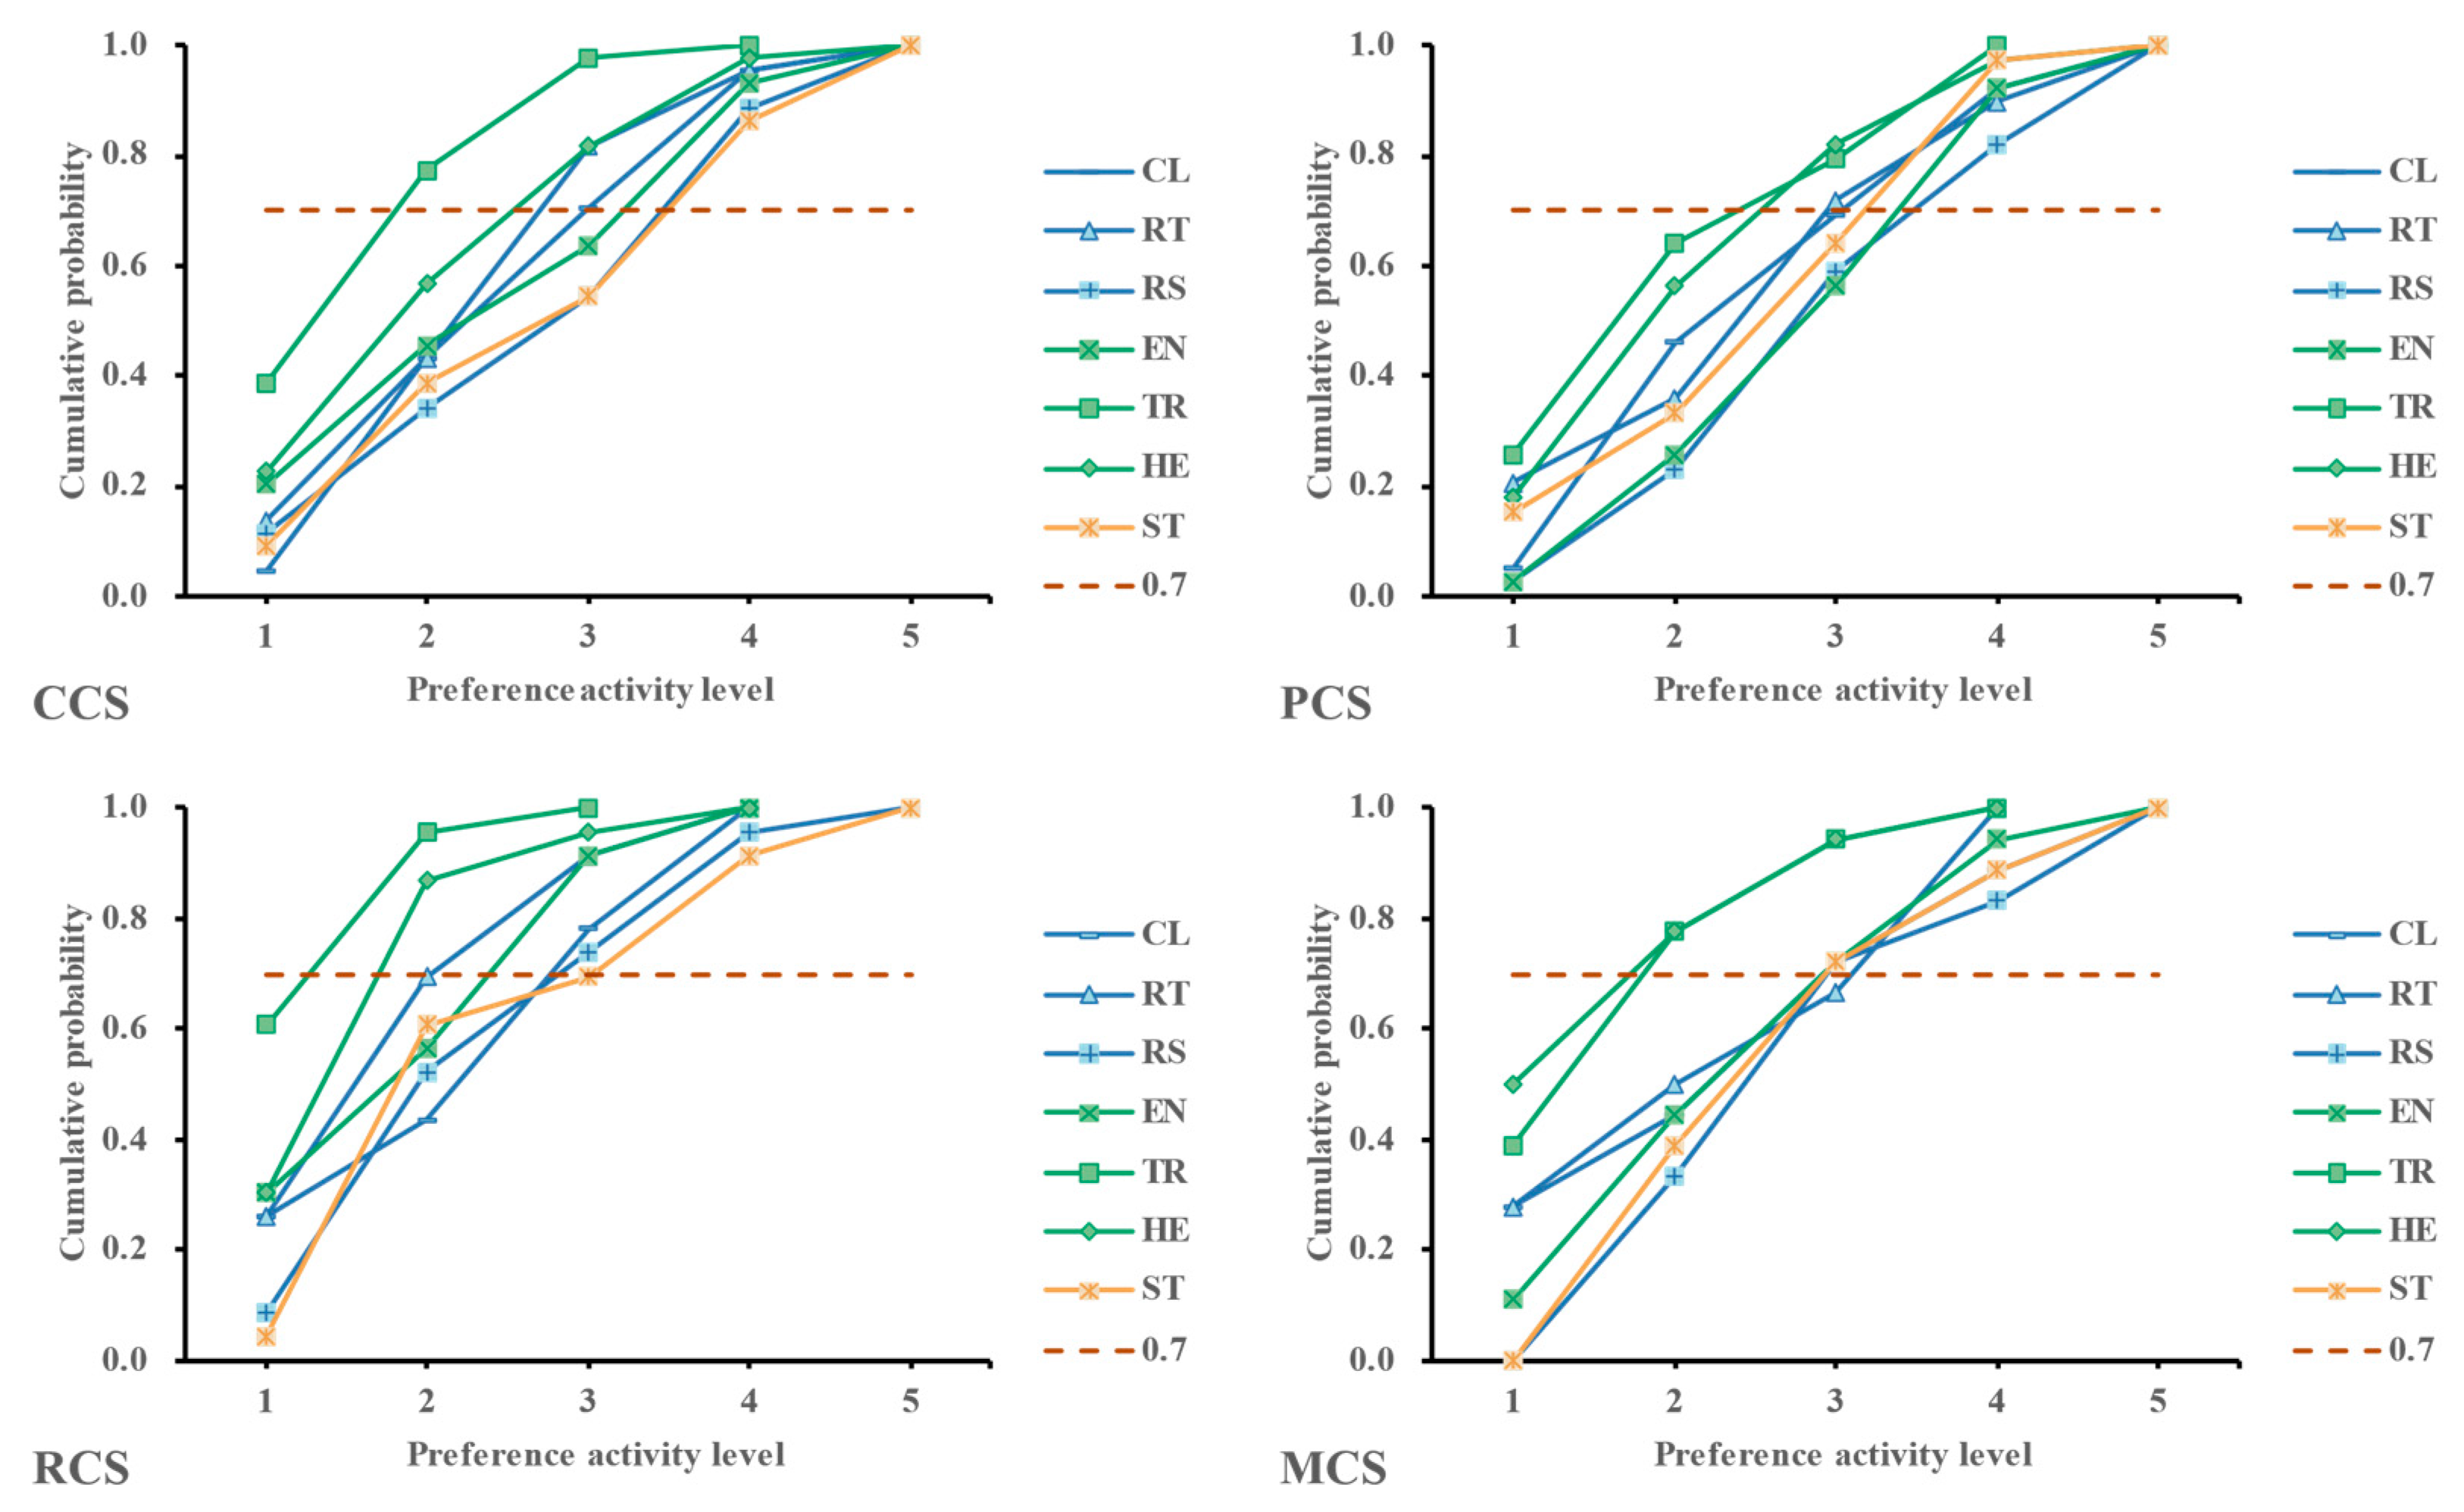
- PA (Figure 18)
- (4)
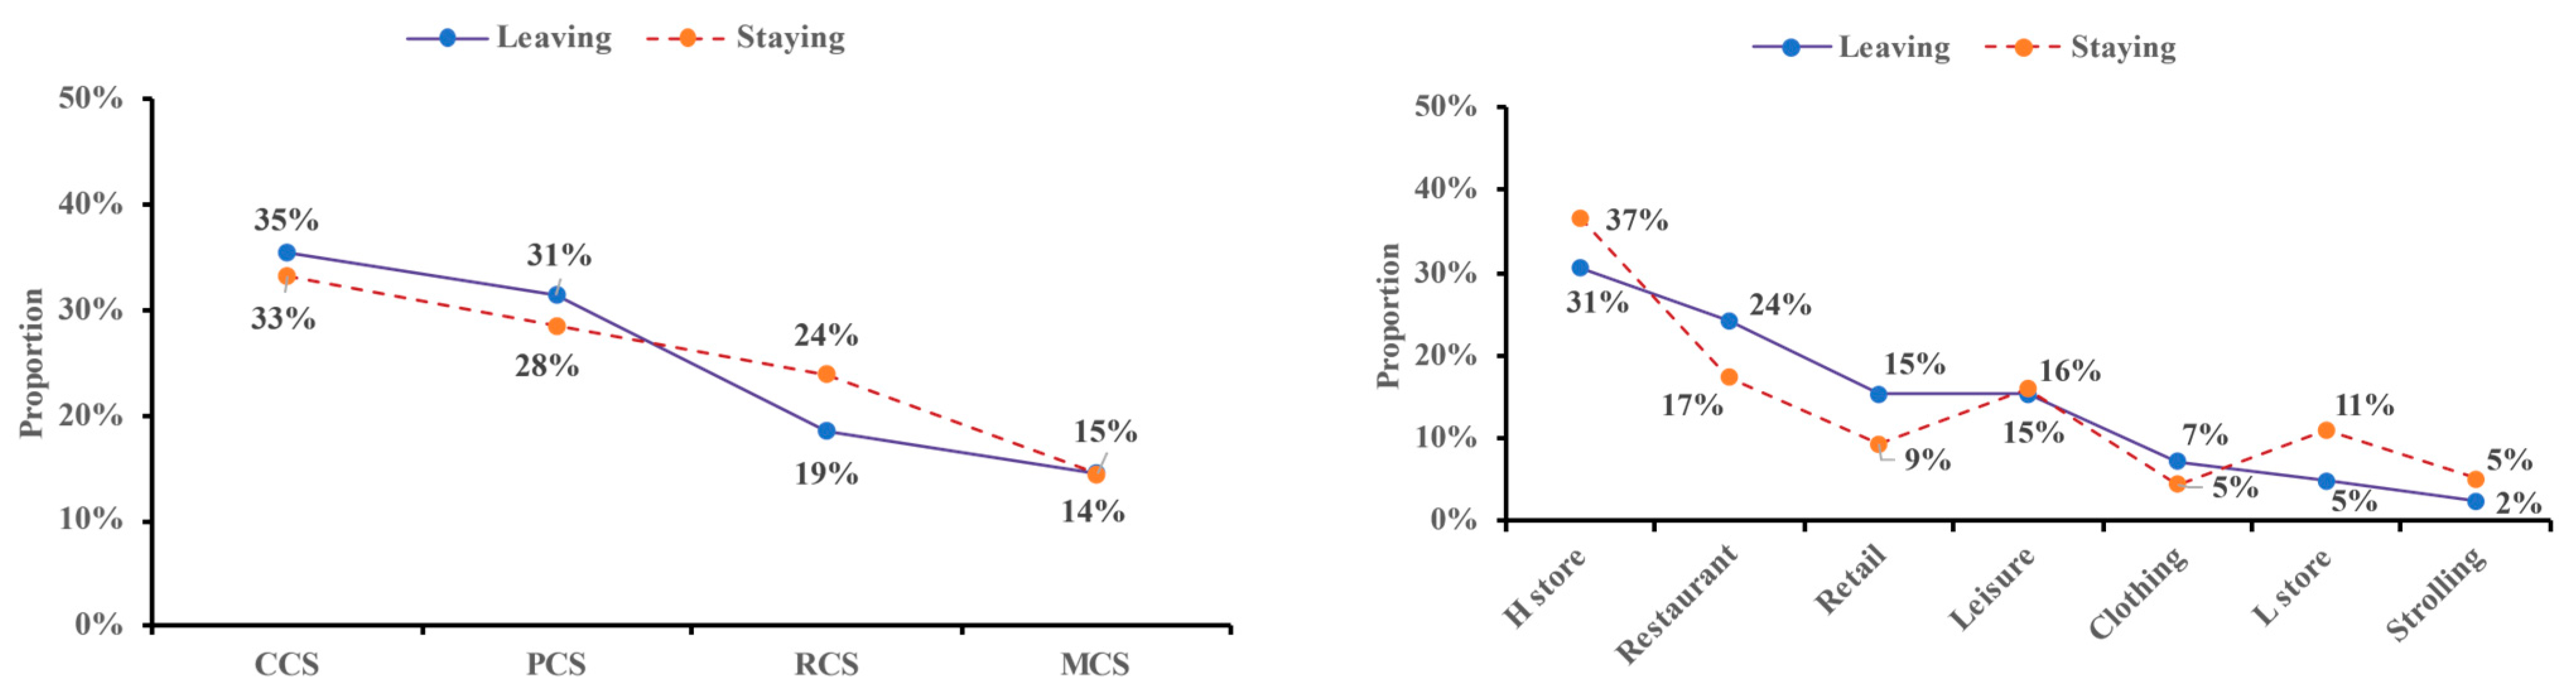
- Increased Customer Flow Revenue (Figure 19)
5. Conclusions and Recommendations
Author Contributions
Funding
Institutional Review Board Statement
Informed Consent Statement
Data Availability Statement
Acknowledgments
Conflicts of Interest
References
- Nourinejad, M.; Roorda, M.J. Parking enforcement policies for commercial vehicles. Transp. Res. Part A Policy Pract. 2017, 102, 33–50. [Google Scholar] [CrossRef]
- Ding, C.; Cao, X.Y.; Wang, Y.P. Synergistic effects of the built environment and commuting programs on commute mode choice. Transp. Res. Part A Policy Pract. 2018, 118, 104–118. [Google Scholar] [CrossRef]
- Gansterer, M.; Hartl, R.F.; Tzur, M. Transportation in the Sharing Economy. Transp. Sci. 2022, 56, 567–570. [Google Scholar] [CrossRef]
- Ji, Y.B.B.; Dong, J.C.; Lai, Z.R.; Feng, Q. Optimal allocation of shared parking spaces for hospital parkers considering parking choice behavior under bounded rationality. Transp. Lett. 2023, 15, 242–253. [Google Scholar] [CrossRef]
- Shao, C.Y.; Yang, H.; Zhang, Y.; Ke, J.T. A simple reservation and allocation model of shared parking lots. Transp. Res. Part C Emerg. Technol. 2016, 71, 303–312. [Google Scholar] [CrossRef]
- Karaliopoulos, M.; Mastakas, O.; Chai, W.K. Matching Supply and Demand in Online Parking Reservation Platforms. IEEE Trans. Intell. Transp. Syst. 2023, 24, 3182–3193. [Google Scholar] [CrossRef]
- Manville, M.; Pinski, M. The causes and consequences of curb parking management. Transp. Res. Part A Policy Pract. 2021, 152, 295–307. [Google Scholar] [CrossRef]
- Yan, Q.Q.; Feng, T.; Timmermans, H. Investigating private parking space owners’ propensity to engage in shared parking schemes under conditions of uncertainty using a hybrid random-parameter logit-cumulative prospect theoretic model. Transp. Res. Part C Emerg. Technol. 2020, 120, 102776. [Google Scholar] [CrossRef]
- Munoz, B.; Monzon, A.; Lopez, E. Transition to a cyclable city: Latent variables affecting bicycle commuting. Transp. Res. Part A Policy Pract. 2016, 84, 4–17. [Google Scholar] [CrossRef]
- Wang, A.G.; Guan, H.Z.; Guo, J.; Han, Y.; Bian, H.J. An Empirical Study on the Segmentation of Potential Users of Shared Parking Spaces considering Individual Heterogeneity. J. Adv. Transp. 2022, 2022, 2445693. [Google Scholar] [CrossRef]
- Patt, A.; Aplyn, D.; Weyrich, P.; van Vliet, O. Availability of private charging infrastructure influences readiness to buy electric cars. Transp. Res. Part A Policy Pract. 2019, 125, 1–7. [Google Scholar] [CrossRef]
- Gong, S.Q.; Ardeshiri, A.; Rashidi, T.H. Impact of government incentives on the market penetration of electric vehicles in Australia. Transport. Res. Part D Transport. Environ. 2020, 83, 102353. [Google Scholar] [CrossRef]
- Guerra, E.; Daziano, R.A. Electric vehicles and residential parking in an urban environment: Results from a stated preference experiment. Transport. Res. Part D Transport. Environ. 2020, 79, 102222. [Google Scholar] [CrossRef]
- Dave, S.M.; Joshi, G.J.; Ravinder, K.; Gore, N. Data monitoring for the assessment of on-street parking demand in CBD areas of developing countries. Transp. Res. Part A Policy Pract. 2019, 126, 152–171. [Google Scholar] [CrossRef]
- Eskandari, M.; Nookabadi, A.S. Off-street parking facility location on urban transportation network considering multiple objectives: A case study of isfahan (IRAN). Transport 2018, 33, 1067–1078. [Google Scholar] [CrossRef]
- Nourinejad, M.; Roorda, M.J. Impact of hourly parking pricing on travel demand. Transp. Res. Part A Policy Pract. 2017, 98, 28–45. [Google Scholar] [CrossRef]
- Hensher, D.A.; King, J. Parking demand and responsiveness to supply, pricing and location in the Sydney central business district. Transp. Res. Part A Policy Pract. 2001, 35, 177–196. [Google Scholar] [CrossRef]
- Huang, Z.H.; Long, J.C.; Szeto, W.Y.; Liu, H.X. Modeling and managing the morning commute problem with park-and-ride-sharing. Transp. Res. Part B Methodol. 2021, 150, 190–226. [Google Scholar] [CrossRef]
- Du, L.L.; Gong, S.Y. Stochastic Poisson game for an online decentralized and coordinated parking mechanism. Transp. Res. Part B Methodol. 2016, 87, 44–63. [Google Scholar] [CrossRef]
- Karaliopoulos, M.; Katsikopoulos, K.; Lambrinos, L. Bounded rationality can make parking search more efficient: The power of lexicographic heuristics. Transp. Res. Part B Methodol. 2017, 101, 28–50. [Google Scholar] [CrossRef]
- Xu, F.Y.; Chen, X.J.; Zhang, M.; Zhou, Y.; Cai, Y.P.; Zhou, Y.; Tang, R.X.; Wang, Y.F. A sharing economy market system for private EV parking with consideration of demand side management. Energy 2020, 190, 116321. [Google Scholar] [CrossRef]
- Xie, R.; Wei, W.; Wui, Q.W.; Ding, T.; Mei, S.W. Optimal Service Pricing and Charging Scheduling of an Electric Vehicle Sharing System. IEEE Trans. Veh. Technol. 2020, 69, 78–89. [Google Scholar] [CrossRef]
- Ardeshiri, A.; Safarighouzhdi, F.; Rashidi, T.H. Measuring willingness to pay for shared parking. Transp. Res. Part A Policy Pract. 2021, 152, 186–202. [Google Scholar] [CrossRef]
- Niu, Z.P.; Hu, X.W.; Qi, S.M.; Yang, H.H.; Wang, S.Q.; An, S. Determinants to parking mode alternatives: A model integrating technology acceptance model and satisfaction-loyalty model. Transp. Res. Part A Policy Pract. 2021, 152, 216–234. [Google Scholar] [CrossRef]
- Xiao, H.H.; Xu, M.; Gao, Z.Y. Shared parking problem: A novel truthful double auction mechanism approach. Transp. Res. Part B Methodol. 2018, 109, 40–69. [Google Scholar] [CrossRef]
- Xiao, H.H.; Xu, M.; Yang, H. Pricing strategies for shared parking management with double auction approach: Differential price vs. uniform price. Transp. Res. Part E Logist. Transp. Rev. 2020, 136, 101899. [Google Scholar] [CrossRef]
- Wang, P.-F.; Guan, H.-Z.; Liu, P.; Zhao, P.-F.; Han, Y.; Yue, H. Mechanisms of Allocation/Pricing/Revenue Distribution for Shared Parking Lots. China J. Highw. Transp. 2020, 33, 158–169, 180. [Google Scholar]
- Lu, T.W.; Yao, E.J.; Jin, F.L.; Yang, Y. Analysis of incentive policies for electric vehicle adoptions after the abolishment of purchase subsidy policy. Energy 2022, 239, 122136. [Google Scholar] [CrossRef]
- Lai, K.X.; Chen, T.; Natarajan, B. Optimal scheduling of electric vehicles car-sharing service with multitemporal and multi-task operation. Energy 2020, 204, 117929. [Google Scholar] [CrossRef]
- Xue, Y.Q.; Cheng, L.; Lin, P.; An, J.; Guan, H.Z. Parking Space Reservation Behavior of Car Travelers from the Perspective of Bounded Rationality: A Case Study of Nanchang City, China. J. Adv. Transp. 2020, 2020, 8851372. [Google Scholar] [CrossRef]
- Liu, Y.-H.; Luo, X.; Hu, J.-P. Dynamic Allocation Method for Shared Berth Considering Immediate and Reservation Demands. J. Transp. Syst. Eng. Inf. Technol. 2022, 22, 171–181. [Google Scholar] [CrossRef]
- Jiang, B.W.; Fan, Z.P. Optimal allocation of shared parking slots considering parking unpunctuality under a platform-based management approach. Transp. Res. Part E Logist. Transp. Rev. 2020, 142, 102062. [Google Scholar] [CrossRef]
- Xiao, H.H.; Xu, M. Modelling bidding behaviors in shared parking auctions considering anticipated regrets. Transp. Res. Part A Policy Pract. 2022, 161, 88–106. [Google Scholar] [CrossRef]
- Liang, J.K.; Eccarius, T.M.; Lu, C.C. Investigating factors that affect the intention to use shared parking: A case study of Taipei City. Transp. Res. Part A Policy Pract. 2019, 130, 799–812. [Google Scholar] [CrossRef]
- Zong, F.; Zeng, M.; Yu, P. A parking pricing scheme considering parking dynamics. Transportation 2023. [Google Scholar] [CrossRef]
- Wolbertus, R.; Gerzon, B. Improving Electric Vehicle Charging Station Efficiency through Pricing. J. Adv. Transp. 2018, 2018, 4831951. [Google Scholar] [CrossRef]
- Ma, T.Y.; Gerber, P.; Carpentier, S.; Klein, S. Mode choice with latent preference heterogeneity: A case study for employees of the EU institutions in Luxembourg. Transportmetrica A 2015, 11, 441–463. [Google Scholar] [CrossRef]
- El Zarwi, F.; Vij, A.; Walker, J.L. A discrete choice framework for modeling and forecasting the adoption and diffusion of new transportation services. Transp. Res. Part C Emerg. Technol. 2017, 79, 207–223. [Google Scholar] [CrossRef]
- Skyrms, B. Dynamics of Conformist Bias. Monist 2014, 88, 260–269. [Google Scholar] [CrossRef]


| Attribute | 800 m | 500 m | 300 m | 200 m | 100 m | Not Travel |
|---|---|---|---|---|---|---|
| Date | 2 levels | 2 levels | 2 levels | 2 levels | 2 levels | |
| Forms of discounts | 4 levels | 4 levels | 4 levels | 4 levels | 4 levels | |
| Degree of discounts | 2 levels | 2 levels | 2 levels | 2 levels | 2 levels |
| Economic and Social Attribute | |||
|---|---|---|---|
| Items | Options | Items | Options |
| 1. Gender | A: Male | 8. Hometown | Blank |
| B: Female | 9. Household members | A: 1 Person | |
| 2. Age | A: 18~24 | B: 2 Person | |
| B: 25~34 | C: 3 Person | ||
| C: 35~44 | D: ≥4 Person | ||
| D: 45~54 | 10. Number of cars | A: 0 | |
| E: 55~64 | B: 1 Car | ||
| F: 65+ | C: 2 Cars | ||
| 3. Residence | Blank | D: 3 Cars | |
| 4. Occupation | A: Full-time | E: ≥4 Cars | |
| B: Part-time | 11. Elderly | A: Yes | |
| C: Freelance | B: No | ||
| D: Teacher | Children | A: Yes | |
| E: Student | B: No | ||
| F: Civil servant | Females | A: Yes | |
| G: Retired | B: No | ||
| H: Others | Pets | A: Yes | |
| 5. Education | A: Middle school or below | B: No | |
| B: High school | Disabled | A: Yes | |
| C: College/Undergraduate | B: No | ||
| D: Master | 12. Annual household income/yuan | A: <10,000 | |
| E: Doctor or above | B: 10,000–100,000 | ||
| 6. Marital status | A: Single | C: 100,001–250,000 | |
| B: Unmarried | D: 250,001–500,000 | ||
| C: Married | E: >500,000 | ||
| D: Others | 13. Parking spot | A: Yes | |
| 7. Monthly income/yuan | A: <3000 | B: No | |
| B: 3000–5000 | 14. Car type | A: Fuel-powered car | |
| C: 5001–10,000 | B: Electric car | ||
| D: 10,001–20,000 | C: Hybrid car | ||
| E: >20,000 | D: Fuel cell car | ||
| E: No car | |||
| Latent Variables | Measurement Items | Options |
|---|---|---|
| 1. CE | CE-1: I would go to H shop if my friends or classmates want to go there. | 1: Strongly disagree |
| CE-2: I would go to H shop if my relatives want to go there. | 2: Disagree | |
| CE-3: I would go to H shop if I see a lot of people gathered there. | 3: Neutral | |
| CE-4: I would go to H shop if I read online recommendations for it. | 4: Agree | |
| CE-5: I would go to H shop if I have frequented it before. | 5: Strongly agree | |
| 2. PR | PR-1: I often worry about not finding parking spot. | 1: Strongly disagree |
| PR-2: I often worry about difficulty in finding parking spots. | 2: Disagree | |
| PR-3: I often worry about high parking fees. | 3: Neutral | |
| PR-4: I often worry about inconvenient parking access. | 4: Agree | |
| PR-5: I often worry about parking security. | 5: Strongly agree | |
| 3. HCP | HCP-1: When parking time is close to 1 h, I try to leave within that hour. | 1: Strongly disagree |
| HCP-2: When parking time is already over 1 h, I leave before it reaches 2 h. | 2: Disagree | |
| HCP-3: When parking time is close to 2 h, I try to leave within that time. | 3: Neutral | |
| HCP-4: When parking time is already over 2 h, I leave before it reaches 3 h. | 4: Agree | |
| HCP-5: When parking is close to 3 h, I try to leave within that time. | 5: Strongly agree | |
| HCP-6: When parking time is already over 3 h, I leave before it reaches 4 h. | ||
| 4. CP | CP-1: Small to medium-sized business district. | Rating: 0–5 |
| CP-2: Large-scale business district. | ||
| CP-3: Street-style business district. | ||
| CP-4: Integrated business district. | ||
| CP-5: Historical brand business district. | ||
| CP-6: Emerging business district. | ||
| 5. PA | PA-1 (CL): Clothing stores (clothing, jewelry...). | Rating: 0–5 |
| PA-2 (RT): Retail stores (supermarket, hardware...). | ||
| PA-3 (RS): Restaurant stores (restaurant, bubble tea...). | ||
| PA-4 (EN): Entertainment stores (cinema, KTV...). | ||
| PA-5 (TR): Training stores (dance, art...). | ||
| PA-6 (HE): Health stores (foot bath, skincare...). | ||
| PA-7 (ST): Strolling on the street (rest, leisure...). |
| Factor | 1: CP | 2: PAA | 3: PR | 4: HCPB | 5: HCPA | 6: CEA | 7: CEB |
|---|---|---|---|---|---|---|---|
| CP-4 | 0.755 | ||||||
| CP-2 | 0.720 | ||||||
| CP-6 | 0.715 | ||||||
| CP-3 | 0.687 | ||||||
| CP-5 | 0.677 | ||||||
| CP-1 | 0.657 | ||||||
| PA-5 | 0.731 | ||||||
| PA-6 | 0.719 | ||||||
| PA-4 | 0.689 | ||||||
| PA-7 | 0.614 | ||||||
| PA-2 | 0.568 | ||||||
| PA-3 | 0.531 | ||||||
| PR-2 | 0.744 | ||||||
| PR-4 | 0.739 | ||||||
| PR-1 | 0.727 | ||||||
| PR-3 | 0.577 | ||||||
| PR-5 | 0.575 | ||||||
| HCP-4 | 0.896 | ||||||
| HCP-6 | 0.812 | ||||||
| HCP-2 | 0.725 | ||||||
| HCP-1 | 0.811 | ||||||
| HCP-3 | 0.807 | ||||||
| HCP-5 | 0.672 | ||||||
| CE-2 | 0.724 | ||||||
| CE-5 | 0.675 | ||||||
| CE-1 | 0.622 | ||||||
| CE-3 | 0.797 | ||||||
| CE-4 | 0.771 |
| Class | CAIC (LL) | BIC (LL) | Npar | L2 | Df | p-Value | Class. Err. |
|---|---|---|---|---|---|---|---|
| 1-Cluster | 55,467 | 55,291 | 176 | 48,298 | 303 | 0.000 | 0.00 |
| 2-Cluster | 54,874 | 54,646 | 228 | 47,332 | 251 | 0.000 | 0.04 |
| 3-Cluster | 54,693 | 54,413 | 280 | 46,778 | 199 | 0.000 | 0.05 |
| 4-Cluster | 54,654 | 54,322 | 332 | 46,366 | 147 | 0.000 | 0.07 |
| 5-Cluster | 54,714 | 54,330 | 384 | 46,053 | 95 | 0.000 | 0.06 |
| 6-Cluster | 54,825 | 54,382 | 436 | 45,784 | 43 | 0.000 | 0.06 |
Disclaimer/Publisher’s Note: The statements, opinions and data contained in all publications are solely those of the individual author(s) and contributor(s) and not of MDPI and/or the editor(s). MDPI and/or the editor(s) disclaim responsibility for any injury to people or property resulting from any ideas, methods, instructions or products referred to in the content. |
© 2023 by the authors. Licensee MDPI, Basel, Switzerland. This article is an open access article distributed under the terms and conditions of the Creative Commons Attribution (CC BY) license (https://creativecommons.org/licenses/by/4.0/).
Share and Cite
Guo, J.; Guan, H.; Han, Y.; Xue, Y. Analysis of the Potential Economic Impact of Parking Space Comprehensive Utilization on Traditional Business District. Sustainability 2024, 16, 28. https://doi.org/10.3390/su16010028
Guo J, Guan H, Han Y, Xue Y. Analysis of the Potential Economic Impact of Parking Space Comprehensive Utilization on Traditional Business District. Sustainability. 2024; 16(1):28. https://doi.org/10.3390/su16010028
Chicago/Turabian StyleGuo, Jun, Hongzhi Guan, Yan Han, and Yunqiang Xue. 2024. "Analysis of the Potential Economic Impact of Parking Space Comprehensive Utilization on Traditional Business District" Sustainability 16, no. 1: 28. https://doi.org/10.3390/su16010028