Abstract
In many countries, depending on climatic conditions and the energy performance of buildings, the built stock is highly energy-consuming and constitutes a main source of greenhouse gas emissions. This is particularly true for Europe, where most of the existing buildings were built before 2001. For this reason, EU policies have focused on the Deep Energy Renovation Process of the residential building stock as the mainstream way for its decarbonization strategy by 2050. Based on a broad investigation of seven EU local retrofitting markets carried out within the H2020 re-MODULEES project, this paper defines a holistic methodology for understanding and facing the complexity of the renovation market and its inner constraints. Thanks to systematic surveys and the activation of stakeholders’ core groups (re-LABs), the main market barriers (cultural, social, technical, processual, and financial) were explored. Through a bottom-up clustering approach and vote analysis, a relevance classification of constraints of each pilot market and a detailed scenario of the most relevant market constraints at the European level were provided. This scalable methodology offers the baseline necessary for shaping more effective, cooperative, and tailored-made policies aimed at overcoming the current limitations to the full deployment of the Deep Energy Renovation Process (DERP) across the European markets.
1. Introduction
Facing the challenges induced by climatic changes requires implementing actions in a variety of directions. As highlighted by the UNFCCC in 2023 (United Nations Framework Convention on Climate Change), the collective progress towards achieving the long-term goal of the Paris Agreement must be rapidly accelerated in this critical climate and energy crisis [1,2]. Most of the mitigation pathways modeled for limiting global warming to 2 °C or lower by 2100 show significant difficulties for the building, industry, and transport sectors in reaching net zero CO2 emissions [3]. At the same time, “building-level energy efficiency improvements and on-site renewable energy installations have significant climate-change mitigation potential” [4]. With the European Green Deal, Europe assumed the goal of becoming the first carbon-neutral continent in the world by 2050, and to this end, a 55% emissions reduction target has been set for 2030 (compared to 1990 levels) [5]. The construction sector has a leading role in this goal, considering that it is responsible for 40% of energy consumption and 36% of CO2 emissions in the EU [6]. In addition, 85% of the existing buildings in Europe were built before 2001, and 85–95% of them will be standing in 2050 [7]. For this reason, in October 2020, the EU Commission launched the Renovation Wave for Europe, aimed at doubling the renovation rate for buildings by 2030 (from the actual 1% to 2%) and reaching EU-wide climate neutrality by 2050 [7]. The Commission Recommendation (EU) 2019/786 [8] explains that different renovation depths have been developed in the context of the EU Building Stock Observatory based on primary energy savings: (a) light (less than 30%); (b) medium (between 30% and 60%); (c) deep (over 60%). Therefore, with a Deep Energy Renovation Process (DERP), a reduction of at least 60% of primary energy saving must be achieved [8,9] by combining measures in one strategy and not involving single standard actions [10]. The recently adopted EPBD recast (Energy Performance of Buildings Directive [11] goes even further, as it describes deep energy renovation concept as “a renovation that transforms buildings into zero-emission buildings; in a first step, as a renovation that transforms buildings into nearly zero-energy buildings (…) or a renovation resulting in a reduction of at least 60% primary energy demand for worst-performing buildings for which it is technically and economically not feasible to achieve a zero-emission building standard”. Numerous scientific studies [12,13,14] concentrate on the technical aspects of building renovation for energy efficiency; with respect to this achievement, the understanding of the renovation process as a whole and the adoption of a holistic approach for its effective deployment assumes growing importance [15,16,17]. To trigger DERP, technical aspects form only a part of a more complex roadmap to higher energy efficiency [18,19,20]. Indeed, despite the potential savings obtained by combining multiple interventions on envelope and systems with RES (Renewable Energy Sources) integration, their concrete achievement often fails due to softer reasons such as a lack of knowledge regarding the cost-effectiveness of the energy-performance improvements as well as of their benefits [20]. On the other hand, successful interventions are strongly linked to the owner’s situation, including financial capacity, priorities and preferences, expected payback time, simplicity of the investment, or financial support from subsidies [21].
More generally, the important role of cut-offs due to undetected or unresolved market constraints for the full uptake of deep energy renovation markets clearly emerges. In fact, the main barriers or constraints to deep renovation can be found in the literature. For example, barriers to DERP can be associated with the fragmentation and complexity of the renovation markets [22] or analyzing specifically the Supply side and the role of the Energy Service Companies in behavioral, organizational, and institutional factors, such as “lack of technical skills”, “noninterest in energy efficiency improvements” and “nonfunctional regulation” [4]. Otherwise, investigating the Demand and the Financial sides, other hindering factors are considered: the “complexity of the works” and “lack of knowledge and expertise” for the former, and “lack of enough experience to risk an investment”, “lack of standardization”, and “difficult to monetize the benefits” for the latter. The “absence of policies” may often influence the overall benefits of an intervention, which is also beyond energy saving [19,23]. Other constraints, such as “complexity of the process”, “difficulty in understanding the energy retrofit measure”, and “mistrust in professionals” can be hindering factors for a DERP, even when financial barriers are overcome [24]. In the residential sector, specific barriers concern “non-occupant owners”, “fragmented private ownership”, “lack of awareness of the occupants about the benefits of the interventions”, “financial and political uncertainties”, and “difficulty in obtaining subsides” [25].
This short review highlights the importance of considering among the potential market constraints all the different factors that affect the performance of the deep energy retrofitting markets, including the interactions between the various stakeholders involved, from the building owners to the construction companies, the technicians and the installers, the solutions providers, the governmental agencies both at local and regional levels and, more generally, investors, analysts, and policy-makers [26,27]. Many European projects [28,29,30,31,32] have developed a wealth of technical solutions and tools aimed at boosting a massive deployment of DERPs, but one of the main barriers remains the absence of effective go-to market strategies that can capitalize on such outcomes. In [10], several European projects were analyzed, showing how they tried to fix barriers separately. Building on this, the H2020 re-MODULEES project (the Retrofitting Market Activation Platform based on the generation of standard modules for energy efficiency and clean-energy solutions) [33] specifically aims to address these limits by developing an “Energy Retrofitting Market Activation Platform” that can capitalize on the results of EU-funded projects on deep renovation. Moreover, the platform merges 45 TT/SS/AA (Tools/Services/Applications) provided by other EU-funded projects (e.g., ENERFUND tool [34], HAPPEN—MedZEBProtocol [28], Triple-A-Reno “pro design” renovation wizard [35], DRIVE-0 Circular Homes [36], etc.) and local-market best practices with the constraints to be addressed.
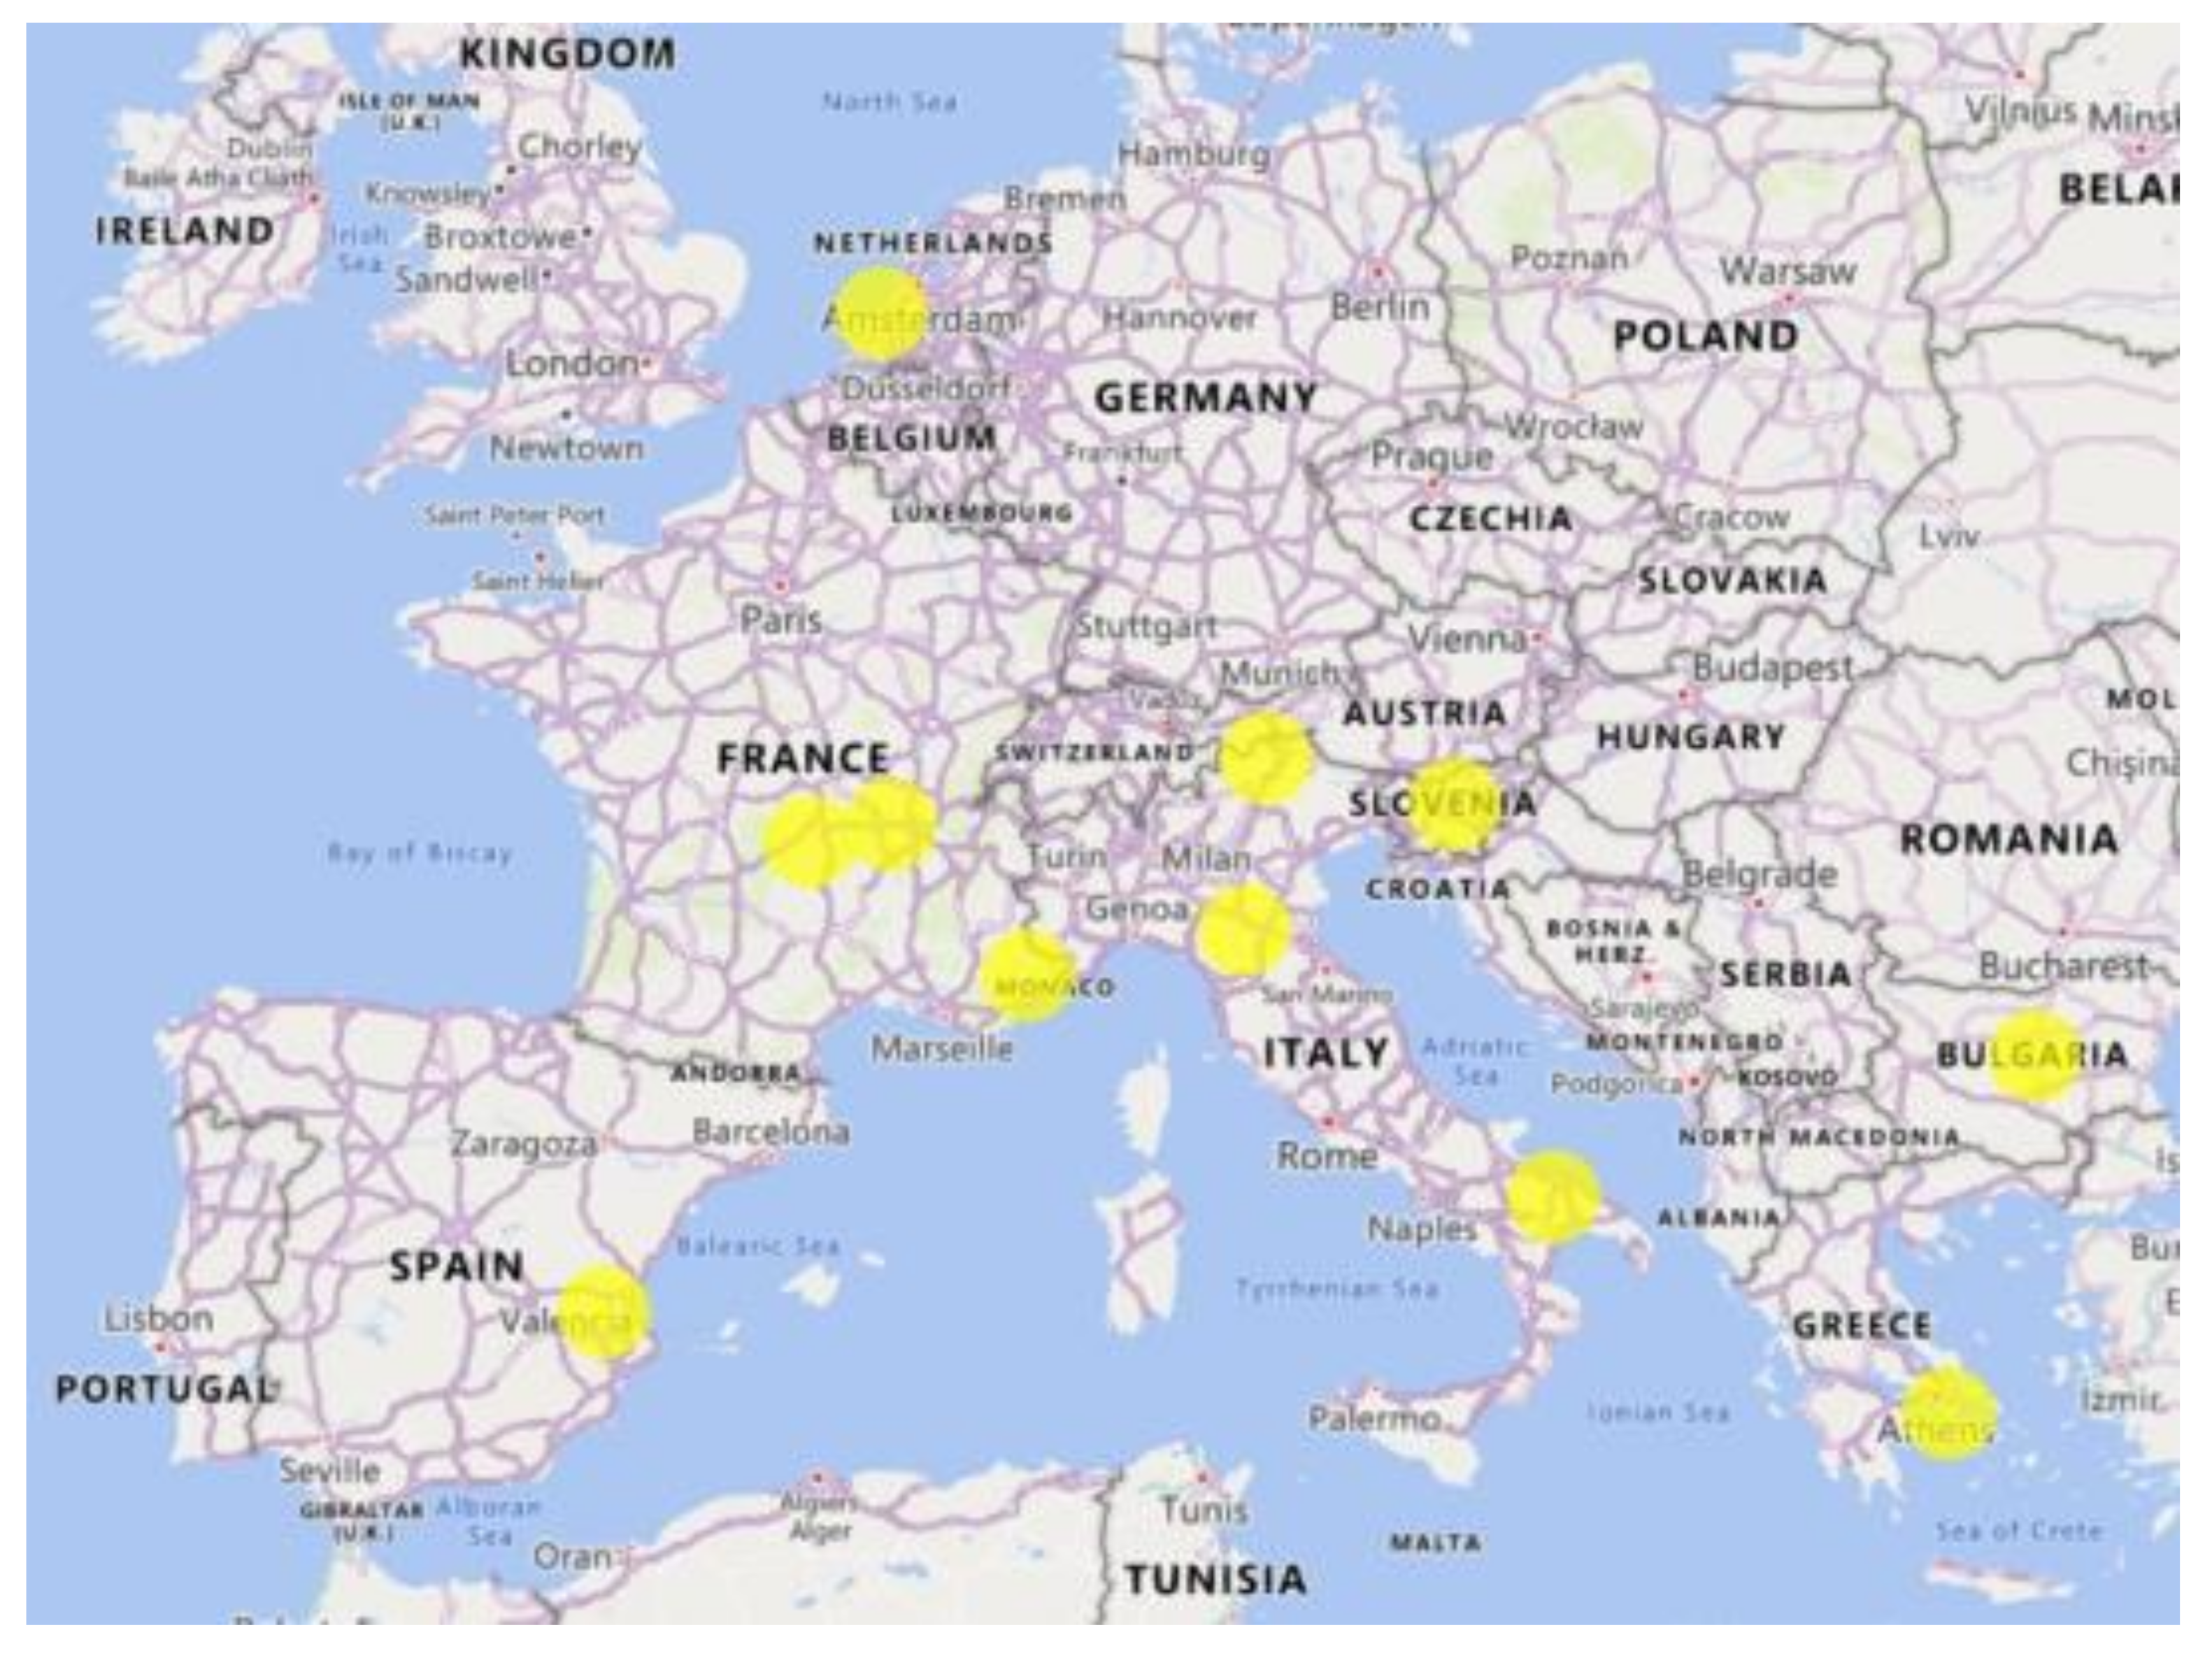
Moreover, re-MODULEES addressed “local renovation markets” representative of the wider European scenario by running pilots at a territorial scale (NUT 2/3) in which all the actors, factors, dynamics, and conditions involved in the implementation of DERPs were considered. As shown in Table 1, pilot markets from seven EU countries (Italy, Spain, Greece, France, Bulgaria, Netherlands, and Slovenia) were scouted, where renovation local advisory boards (re-LABs) were activated, composed of large-scale stakeholders (such as associations of social housing companies, building owners, municipalities, professionals, etc.) in representation of the Demand, Supply, Public, and Financial market sides. As shown in Table 1, the management of these re-LABs was entrusted to consortium pilot partners.

Table 1.
List of the RE-MODULEES pilot markets with the localization of the re-MODULEES pilot markets.
Given this framework, this paper presents the results of a survey on the most relevant constraints acting on these local pilot markets, carried out by the project consortium with the support of the correspondent renovation local advisory boards (re-LABs), and also aimed at providing the re-MODULEES platform with a categorization of the main constraints to DERP to be addressed by local actors at each step of the renovation process. In particular, the paper describes the methodology adopted for creating a deeper knowledge of the barriers affecting the exploitation of the deep energy renovation market in EU countries, as well as the stakeholder involvement process activated for nurturing a button-up approach in the data collection, analysis, clustering, and processing of the market constraints. Although this is a market pilot-based methodology, its results are not limited to the local level but are extended to the European level by providing a homogeneous classification of the most relevant constraints detected.
2. Materials and Methods
The methodology adopted, represented in Figure 1, is composed of a set of six steps conceived for properly dealing with the complexity of the renovation market:
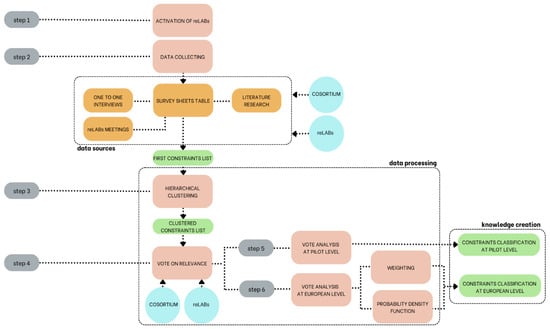
Figure 1.
Method scheme.
- Step 1—Activation of renovation local advisory boards (re-LABs) through the involvement of relevant target groups and key actors in the selected pilot markets.
- Step 2—Collection of the most relevant information concerning the main constraints acting on the DERP in each pilot market by building and sharing knowledge and by highlighting similarities and differences among the pilot markets from the social, economic, cultural, and technical points of view.
- Step 3—Hierarchical clustering, carried out by summarizing the information collected in the previous phase through a process of data cleaning and transformation, and by clustering the outcomes through a bottom-up hierarchical clustering process. This operation was carried out for each pilot and each market side. Based on the results obtained, a first comparison between sides and pilots was carried out through a preliminary data analysis.
- Step 4—Vote on relevance, carried out by means of a web-based close-ended questionnaire with a checklist [37] of all constraints collected in the previous phases, which involved the re-LABs to vote on the relevance of each constraint in each pilot market.
- Step 5—Vote analysis at the pilot level, aimed at producing a classification of the constraints for each pilot market based on the votes expressed in the previous step (Step 4).
- Step 6—Vote analysis at the European level aimed at producing a classification of the most important constraints at the European level. To this end, two methods were implemented: the former is a weighting procedure through which a European constraints list was generated (from the most to the least important), and the latter consists of a probability density function (PDF) through which the most relevant constraints were identified.
The goal of this paper is to show the most relevant constraints detected both at the pilot level and at the European level by converging the results of the two proposed methods.
Although during the activation of re-LABs and data-collecting phases (Step 1 and Step 2), the data from the three Italian (sub) pilots (Province of Bolzano, Emilia–Romagna, and Puglia Regions) were considered independently, from the data analysis phase until results (from Step 3 to Step 6), they were merged in order to provide a global Italian scenario.
2.1. Activation of Renovation Local Advisory Boards (re-LABs) (Step 1)
The activation of renovation local advisory boards (re-LABs) was pursued in different ways in each pilot market. The engagement strategies were composed of three main phases: Target Analysis, Invitation, and Onboarding. In the first stage, the consortium partners of each pilot market analyzed the prospective re-LAB members according to the specific characteristics, needs, and expectations to maximize the effectiveness of the set-up process. The engagement strategy was customized to the features of each market and stakeholder profile: first personal contact with the candidate re-LAB members was followed by an invitation letter based on standard templates dedicated to each target group (Demand, Supply, Finance, and Public sides), which were prepared using the Value Proposition Canvas. 90% of the templates consisted of a common part describing the value/utility provided and gained by the re-LABs, the context of their activity, the subjects involved, and the tasks and time required, while 10% was tailored to the specific role of each target group in each pilot market. A second direct meeting scheduled after receiving the invitation letter proved to be essential for the onboarding of the candidates in the re-LABs.
2.2. Data Collection (Step 2)
Data about pilot markets and barriers were collected using a human-based path and a data-based path, organized as follows:
- Semi-structured one-to-one interviews with re-LAB members on the most relevant issues experienced in the context of their own pilot markets and on the main DERP barriers. The main aim of these interviews was to facilitate a conversation about the respondent’s real-life experiences, and for these reasons, they were articulated by the following open-ended questions:
- To which macro category of the energy efficiency process of the built heritage do you belong (Demand, Supply, Institutional, Financial)?
- What is your experience in the field of energy efficiency of the built heritage?
- What are, in your opinion, the difficulties encountered during the energy efficiency process in your area of reference?
- What are, in your opinion, the constraints to which the actors of the energy efficiency process are subjected in your area of reference?
- Minutes of the collective discussions held during the re-LAB meetings in each pilot market about DERP and the respective barriers, which were assisted using virtual whiteboards to map the potential and critical issues of implementing building energy retrofits.
- Survey sheets dedicated to each pilot market, which were filled in by the re-MODULEES consortium partners with the involvement of re-LAB members by basing on the following sources: (i) analysis of the information developed through the two previous points; (ii) research activity carried out by partners (e.g., by surveying local, national and international literature and reference reports, databases, etc.); (iii) partners’ direct experience and expertise gained through in-field market activities or the participation to EU projects.
2.3. Hierarchical Clustering (Step 3)
Data generated in the previous step underwent a clustering process. Clustering as such generates groups of objects based on some similarities [38,39,40]. Among the available techniques in this research, agglomerative, or bottom-up, hierarchical clustering, where single objects are merged in larger clusters until specific conditions are satisfied, was adopted [15,40]. In particular, the following clusterization process was carried out for each market side:
- Pre-processing: Step 2 gave a vast amount of data. These included a long list of constraints [41] for each market, described according to local situations and backgrounds specific to each market. These data needed to be homogenized and summarized through a process of data cleaning and transformation, which consisted of merging, standardizing, de-duplicating, verifying, and exporting the initial data. To this end, a homogeneous list of constraints (level 01) was developed for each side, where all the similar constraints reported by each pilot market were annotated by a tag (short constraint name) acting as a pointer toward the original constraint descriptions provided, which together formed the raw-data cloud (level 0).
- Hierarchical clustering [38,39,40]: Similar constraints were clustered into higher-level classes until it was no longer possible to merge them unless shifting to a more generic (or hierarchically higher) class [42]. In this way, two further classes (levels 02 and 03) were added (see Section 3.3).
2.4. Vote on Relevance (Step 4)
The hierarchical clustering allowed a global list [43] of constraints for each side (Demand, Supply, Institutional, and Financial) to be available and valid for each local market. This list was submitted to each pilot market through a further questionnaire, compiled with web-based moduli, where the pilot partners with the support of re-LAB members were asked to assign a vote of relevance for each of the constraints detected in their pilot through a unipolar Likert Scale (from “0 = Unknown in the pilot market”, “1 = Low relevance”, “2= Medium relevance”, “3 = High relevance” to “4 = Very high relevance”). The questionnaire was created with a two-fold purpose:
- to submit a checklist based on all the constraints gathered during Step 2 to make pilots aware of the presence or absence of a specific constraint in their market;
- to assign a degree of relevance to each specific constraint within each specific market to understand their sensibility and urgency with respect to the local situations.
2.5. Vote Analysis at Pilot Level (Step 5)
The first data analysis allowed us to obtain a classification of the overall group of constraints for each pilot market. The constraints were ordered from the most important (constraints that received the “4” vote) to the less important (constraints with “1” vote). Constraints that received the “0” vote were not included in the pilot market lists. Furthermore, a list of the most important constraints for each pilot market was carried out, and the relationship between level 01 constraints and the related categories (level 03) was analyzed.
2.6. Vote Analysis at the European Level (Step 6)
To select a list of the most important constraints at the European level, two methods were implemented:
- Weighting procedure;
- Probability Density Function (PDF).
The weighting procedure method allowed a relevance classification of constraints to be obtained, ordered from the most important to the least important. The probability density function method considered the frequency of a vote and not only its importance. Only the combination of the weighting procedure with the probability density function allowed the selection of the most important constraints list at the European level.
2.6.1. Weighting Procedure
Thanks to the relevance ranking for all the constraints and each market side provided by all the consortium partners from seven European countries in relation to their own country pilot market with the involvement of the re-LAB members, it was possible to make a global analysis that provides an overview of how constraints are considered and felt in the European renovation market. Through a weighting procedure, the constraints of each side can be ordered from the most important to the least important. The constraint weights derive from the following Equations (1) and (2):
where is the constraint weight, is the number of constraints, and the average of the votes of each pilot to a specific constraint:
where is the number of the pilot markets and is the constraint vote.
2.6.2. Probability Density Function
A Gaussian probability density function (PDF)——[44] permits the graphical highlighting of the density of the closed-ended vote of relevance in the range “0” and “4”, as reported in Equation (3).
where X is the statistical mean of vc (vote expressed in the questionnaire from 0 to 4), and is the variance or standard deviation of vc.
Normalizing the PDF, reporting the vote options (from 0 to 4) on the horizontal axis and the PDF on the vertical one, the higher the peak of the well-known “bell-shaped curve”, the higher the probability of finding that mean value in the statistical population. Moreover, the more the bell is placed towards the right side of the graph, the higher the weight attributed to that representativeness (max is 4). Accordingly, the less dispersed distribution around the highest corresponds to the highest level of relevance for the investigated variable.
The goal is to graphically individuate the PDF, which corresponds to the most relevant constraints (C) at the European level.
2.6.3. Comparing Method Results
The results of the weighting procedure are compared with those of the probability density function to find a convergence according to the following criteria:
- Only the most important constraints by both methods are included in the most important constraint list at the European level. Among the constraints that have the same weight, only those considered most important by the distribution function method are included in the final most-important list.
- If a constraint is considered most important for the probability density function method but has a medium or low weight, it is not considered in the final list.
3. Results
This paragraph briefly presents the results obtained at each step of the defined methodology.
3.1. Activation of re-LABs Results (Step 1)
At the end of the engagement process, a total of 125 stakeholders were onboarded as re-LABs members, consisting of large-scale market actors (e.g., associations, representative organizations of final users, federations, etc.) that could also act as aggregators for each pilot market, or single and small groups of actors (e.g., owners, condominiums, etc.).
Re-LAB members were then divided into four working sub-groups, each representing a different target group, including:
- Demand side—social housing associations, associations of building owners or of building managers, representative organizations of final users and consumers on a regional level, and EU-level umbrella organizations (33 total members).
- Supply side—federations of traders and craftsmen, associations of providers of materials and technological solutions, associations of professionals, and energy managers (43 total members).
- Financial side—banks, private investors, financiers, multilateral funders and other funds, and other financial institutions (19 total members).
- Institutional side—local governments and relevant regional/national organizations, associations of municipalities, and public energy agencies (30 total members).
The description of these large-scale stakeholders involved in each re-LAB is available on the online link in the re-LAB section (https://re-modulees.eu/). Re-LABs played a pivotal role in forming sustainable networks of actors and in identifying the main needs, constraints, and drivers of the renovation processes, thanks to their role as aggregators.
3.2. Data-Collecting Results (Step 2)
Data-collecting results concern the pilot renovation markets and barriers to the renovation market producing a large number of data. In the survey sheets, after the data-collection process outlined in Section 2.2, a description of the constraints on the actors, activities, relations, and connections among the constraints in each pilot renovation market is obtained and included in 4 tables for each pilot market (total of 28 tables).
For brevity, an example of the constraint description concerning Bulgaria’s renovation market is reported in Appendix A.
3.3. Hierarchical Clustering Results (Step 3)
The clustering process led to the definition of three different levels/classes (Figure 2):
- Level 01 (constraints classes), describing the set of homogeneous constraints generated by grouping and tagging similar constraints from the raw cloud by means of short names;
- Level 02 (topics classes), describing the topic to which different constraints belong by means of specific keywords;
- Level 03 (categories classes), collecting these topics in macro-thematic areas defined by means of more abstract terms.
Concerning Level 01, each constraint received a progressive code identifying its side group: CDn—Constraint of the Demand side; CSn—Constraint of the Supply side; CFn—Constraint of the Financial side; CIn—Constraint of the Institutional side. The three-level clustered constraints for each side are reported in Table 2, Table 3, Table 4 and Table 5.
Table 2.
Clustered Constraints—Demand side.
Table 3.
Clustered Constraints—Supply side.
Table 4.
Clustered Constraints—Financial side.
Table 5.
Clustered Constraints—Institutional side.
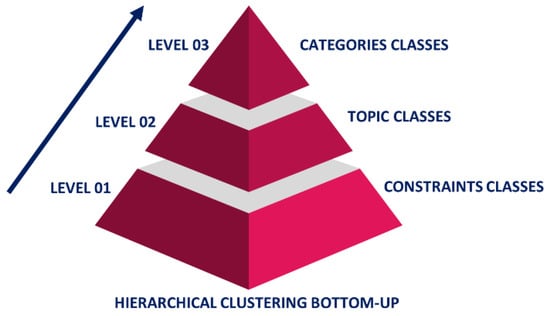
Figure 2.
Clustering Levels (Level 01–Level 02–Level 03).
Data were first processed to compare the outcomes in relation to the different levels of clustering and pilot markets.
Notably, the case of a constraint individuated as the most/least shared (see in the Demand side in Table 2 “CD3-Lack of awareness and motivation drivers” and “CD29-Opaque contracts”, respectively) does not necessarily reflect its degree of relevance since its perception across the pilot markets may greatly vary, as much as the distribution of constraints in each pilot market (and for each market side), implying that this first clustering phase still produced a vast amount of data to be analyzed more deeply. For these reasons, a further investigation was carried out by producing a global checklist made up of all constraints collected to attribute quantitative values to achieve a more rigorous comparison capacity in terms of their perceived relevance.
3.4. Vote on Relevance Results (Step 4)
The web-based questionnaire (Appendix B) sent to the consortium to collect the re-LAB members’ votes of relevance allowed the obtaining of two main results:
- to make pilots aware of the presence or absence of a specific constraint in their market;
- to understand their sensibility and urgency with respect to the local situations.
The first purpose was achieved by pilot markets by assigning a “0” vote, signaling the absence of the specific problem in that market. The submission of the global checklist allowed the pilots’ consortium experts, with the involvement of re-Lab members, to double-check and eventually report the presence of more constraints than in Step 2 since this is still an open-ended survey, which forced them to reason without any reference framework. Indeed, most pilots finally recognized the presence of almost all the listed constraints. Concerning the second aim, thanks to the involvement of re-LAB members, the attribution of votes from 0 to 4 for each constraint drives data for the analysis carried out in the next step.
3.5. Vote Analysis at Pilot Level Results (Step 5)
As reported in Appendix C, each pilot obtained a classification of the constraints from the most important (highlighted in red), which received a “4” vote to the unknown constraints (white cell) with a “0” vote. In this research, the most important constraints for each pilot market are those that received vote “4” (primary importance in red) and vote “3” (secondary importance in orange). The most important constraint lists for each pilot market are reported in Appendix D according to each side.
The distribution of the most important constraints with respect to the third level of clustering has been deepened for each pilot market (Figure 3).
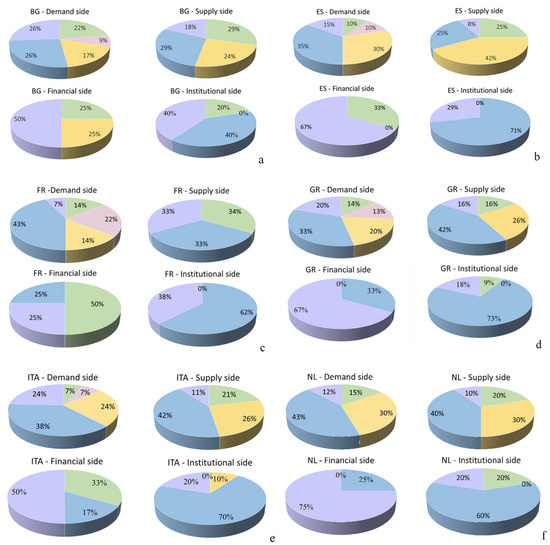
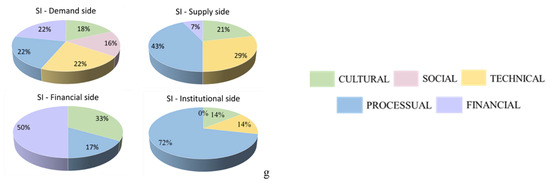
Figure 3.
Distribution of the most important constraints respect clustering Level 03 in pilot markets—(a) Bulgaria; (b) Spain; (c) France; (d) Greece; (e) Italy; (f) Netherlands; (g) Slovenia.
For the Demand side, most of the most important constraints for each pilot market belong to the processual category. Specifically, pilots from France and the Netherlands have the highest percentage (43%), followed by Italy (38%), Spain (35%), and Greece (33%). The lowest percentage of the most important constraints refers to the social category for the Demand side, except for the French pilot market, where the percentage corresponds to 22%. Bulgaria has the most relevant constraints in the case of the cultural category (22%) for the Demand side (Figure 3a), followed by Slovenia (18%, Figure 3g). The financial aspects were found important for the Demand side, especially in the following markets: Bulgaria, Italy, Slovenia, and Greece (Figure 3a,d,e,g). Technical constraints are crucial for both the Demand and Supply sides in almost all pilot markets, especially in Spain, the Netherlands, Bulgaria, Slovenia, and Greece (Figure 3a,b,d,f,g).
Additionally, for the Supply side, most of the most important constraints for each pilot market belong to the processual category (except for the Spanish pilot, where technical-based constraints are prevalent, while the lowest percentage refers to the financial category). Furthermore, on the Financial and Institutional sides, most constraints belong to the processual category, while the lowest refers to the technical and cultural category.
3.6. Vote Analysis at the European Level (Step 6)
3.6.1. Weighting Procedure Results
A weighting procedure with votes was implemented to give an idea of how market constraints are considered in the global European renovation market. The result was a list for each market side, ordered from the most important (e.g., for the Demand side CD3 “Lack of awareness and motivational drivers” and CD6 “Difficult positive decision in multifamily buildings”) to the least important constraints (e.g., for the Demand side CD36 “Concentration of highly profitable investment”). From Table 6, Table 7, Table 8 and Table 9, the list of constraints for each market side is reported (from the most to the least important). In all cases, a high degree of mingling among the different constraint categories can be noticed, pointing to a view of DERP as a complex, multi-actor, and multi-disciplinary process.
Table 6.
Constraint weighting at EU level—Demand side.
Table 7.
Constraint weighting at EU level—Supply side.
Table 8.
Constraint weighting at EU level—Financial side.
Table 9.
Constraint weighting at EU level—Institutional side.
3.6.2. Probability Density Function Results
In Figure 4a, the Demand side fully shared “CD2 Lack of information” to be the most important. A group of 11 further constraints are placed on the immediate close side: CD3, CD6, CD10, CD16, CD17, CD21, CD26, CD27, CD34, CD35, and CD37. The remaining CDs are placed on the “not relevant side” (on the left) or have a very low probability (poorly shared). The analysis of the Supply side (Figure 4b) exposes the most relevant constraint to be “CS2—Difficult to find skilled workers”, which has the right-most and highest curve, meaning that it was recognized as the most crucial aspect. In addition, three other constraints (i.e., CS1, CS16, and CS24) exposed their importance. Most of the Supply side constraints were evaluated to be in the “not relevant” zone.
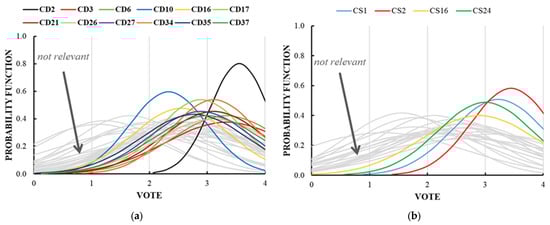
Figure 4.
Probability density function of the C-n vote result at the European level—(a) Demand side, and (b) Supply side.
The analysis of the Financial side exposed “CF6—Unwilling to invest in an innovative product” as the most relevant (Figure 5a), while the Institutional side exposed “CI6—Lack of Standard Procedure, Interpretative Ambiguity”, “CI7—Bureaucracy”, and “CI8—Too Long Procedure” (Figure 5b) as the most relevant.
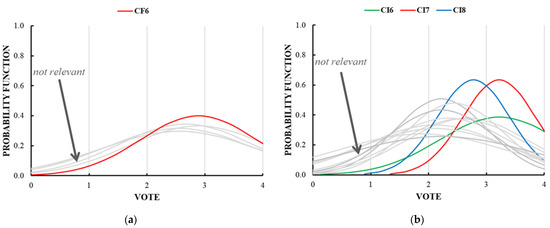
Figure 5.
Probability density function of the C-n vote result at the European level—(a) Financial side, and (b) Institutional side.
3.6.3. Most Important European Constraints List
At the European level, the combination of the two methods allows the identification of the most relevant constraints. Following the criteria described in Section 2.6, a comparison of the results shows a convergence in the case of the Demand side and the Supply side on n7 and n3 constraints, respectively; for the Financial side and Institutional side, there is a convergence on n1 and n3 constraints, respectively. The list of the most important constraints at the European level for each market side is reported in Table 10.
Table 10.
European most important constraints.
4. Discussion
The most important European constraints for the Demand side deal with cultural and process-related aspects (29%). Regarding the former, this refers to a “Lack of knowledge and understanding” and a “Lack of awareness and motivational drivers”, highlighting that many building owners and users may not be aware of the advantages and opportunities offered by building energy renovation and do not have the proper information to acknowledge the most viable technologies. This may hinder the adoption of measures for deep energy renovation of buildings. Regarding the latter, “Time-consuming process for the owner” and “Lack of clarity about the process” can be associated with the complexity of energy assessment and permit-acquisition procedures and the selection of optimal technologies. The provision of an extended temporal effort, together with a lack of clarity on the phases and procedures of the renovation process, may deter owners from running a DERP. Moreover, two more constraints from the Demand side result as the most significant at the EU level, namely “Difficult positive decisions in multifamily buildings” and “Decisional uncertainty”. The former represents an obstacle at the social level, given the complexity of managing dynamics and reconciling needs and preferences between different owners or tenants [45], which may hinder positive decision-making; the latter refers to the difficulty for owners and tenants to decide on technical aspects (e.g., related to optimal energy solutions), due to the necessity of evaluating multiple variables (e.g., individual energy consumption or specific needs of the housing unit).
The Demand side also suffers from another relevant financial barrier: “Difficult access to finance”, which refers to the difficult and limited availability of financial resources needed to run a DERP.
For the Supply side, the most relevant constraints concern cultural aspects (67%). They are “Difficult to find skilled workers” and “Lack of skilled workers” that constitute an obstacle to the effective implementation of DERP. Furthermore, these constraints pose the problem of the immediate need for further actions to correct mistakes made during construction. The way to prevent this is to enhance the provision of education and training courses with certification on working with energy-efficient technologies and building techniques [46]. In addition, the dependence on “imported materials” introduces logistical risks and potential inefficiencies in the supply chain.
For the Institutional side, the most acknowledged barriers concern process-related aspects (100%) such as “Lack of standard procedure, interpretative ambiguity”, “Bureaucracy”, and “Too long procedure”. Indeed, the absence of standardized procedures can lead to ambiguous interpretations of regulatory requirements and renovation practices that can vary from country to country or even from region to region. Regulatory fragmentation can create uncertainty and complicate the planning and execution of renovation projects. Excessive bureaucratic procedures and the extended duration of the process can be significant obstacles to building energy renovation, hampering investments in energy renovation.
For the Financial side, the most important constraint results in being “Unwilling to invest in innovative product” on the part of the financial institutions. This may undermine the implementation of advanced energy-efficient materials, technologies, and systems, which are crucial to achieving optimal building performance and reducing environmental impact. The reluctance of banks and institutional investors to invest in innovative products may stem from a perceived risk due to discontinuities of regulations and incentives [47], unfamiliarity with emerging technologies, or a conservative approach to financing.
The most important constraints at the EU level (highlighted in bold font, from Table 11, Table 12, Table 13 and Table 14) also coincide to a good extent with relevant constraints at the local level (primary importance—cells colored in red, secondary importance—cells colored in orange), allowing the inference of certain correspondence between the issues affecting the different EU markets despite their structural (e.g., cultural, technical, social, processual, financial) differences.
Table 11.
Constraints classification at EU level, most important constraints at pilot level—Demand side.
Table 12.
Constraints classification at EU level, most important constraints at pilot level—Supply side.
Table 13.
Constraints classification at EU level, most important constraints at pilot level—Financial side.
Table 14.
Constraints classification at EU level, most important constraints at pilot level—Institutional side.
5. Conclusions and Future Challenges
This paper presented an innovative pilot-markets-based methodology aimed at better understanding the main constraints to the deep energy renovation of the EU residential built stock, applied and tested in pilot territories from seven different EU countries. Thanks to the homogenization and clusterization techniques adopted, the obtained results provide clear evidence of the real dysfunctions of local retrofitting markets and highlight regional similarities and differences. Although barriers to building renovation may vary from country to country in Europe, common challenges emerged across different contexts. It is interesting to notice similarities between the most important constraints at the European level and the market ones. The most important European constraints for the Demand side deal with cultural and processual aspects (29%). Regarding the Supply side, it is concerned with cultural aspects (67%). For the Financial side, the most important constraint is “CF6-Unwilling to invest in innovative product”, and for the Institutional side, the most felt barriers are concerned with processual aspects (100%). At the pilot level, Processual constraints are the most felt in each pilot market, especially in the Demand and Institutional sides. Cultural and technical aspects better characterize the Supply side, where the lack of skills is one of the most important barriers to the renovation process.
Within this framework, the interaction between the re-LAB members resulted in an extremely valuable outcome. In most pilot markets, these large-scale actors rarely had the opportunity to gather and discuss market issues together: re-MODULEES provided a framework where they could exchange experiences and viewpoints and activate a cross-sectoral dialogue aimed at enhancing market understanding and strategy making. Moreover, because the re-LAB members are made of or connected to tens and even hundreds of smaller stakeholders, they may constitute the pivotal point for pursuing a real impact in their renovation markets. For these reasons, re-LABs can be considered to be the cornerstones of market innovation processes, with the potential to become catalysts for the development of a local integrated ecosystem able to evolve the actual renovation value chains into a “collective intelligence”, where issues and perspectives can be addressed and worked out according to collaborative and integrated approaches.
Re-LABs are meant to operate not only as technical and strategic consultancy bodies of the project but also as aggregators for a wider networking action at the local and national level, which will be turned into “phygital” (physical plus digital) one-stop shops (OSS) aimed at easing the renovation process and at speeding up the renovation rate in the pilot markets, and at fostering replication in other EU territories. Both the EU Commission [7] and several studies [48] remarked on the importance of OSS as a promising solution to solve market fragmentation issues. At the same time, these OSSs may also become the nodes of a multi-level (regional, national, EU) network of stakeholders pursuing the shared implementation of structural innovation processes of their renovation markets as the key to overcoming the current constraints affecting the full DERP uptake.
As reported in the Introduction, the re-MODULEES “Energy Retrofitting Market Activation Platform” can capitalize on the results of such EU-funded projects on deep renovation and, at the same time, serve as the digital environment of such OSS network. Moreover, the platform could be a valid support to solve the main barriers for the Demand side, which is related to the lack of awareness and motivational drivers. At the same time, the main barriers for the Supply side could be faced, e.g., helping to find skilled workers and advertising innovative solutions, products, and technologies. In general, the platform could give multi-target solutions adapting to regional climatic, building, socio-economic, and market conditions, simplifying procedures and regulations, and solving the bureaucratic barriers that characterize each side and almost every local market.
The results obtained may also enable the market innovation process based on the Theory of Constraints (ToC) [41], which proposes to tackle constraints affecting complex systems by acting selectively on each of them, according to a hierarchical order and relational thinking. Furthermore, these results could also provide references for European standardization and policy recommendations aimed at enhancing the renovation rates in EU member states, focused on overcoming market cut-offs due to undetected or unresolved constraints, which may constitute the main barriers to the full uptake of the deep energy renovation.
Finally, despite providing a consistent research body, the results of this research could be limited by its geographical outreach, as it focused only on 7 pilot markets from as many EU countries. On the one hand, these pilots were chosen according to their representativeness of different market conditions across Europe, but on the other hand, the present study could be regarded as a first step towards global European recognition of energy renovation market constraints to be carried out by extending the adoption of the methodology described above to other countries.
Author Contributions
Conceptualization, P.L. and R.M.; methodology, P.L., A.D., A.B., A.C., R.M. and G.D.A.; validation, P.L., A.D., A.B. and A.C.; formal analysis, P.L., A.D. and A.B.; investigation, P.L., A.C., R.M., G.D.A., L.L., A.D. and A.B.; data curation, A.D., A.B., A.C. and G.D.A.; writing—original draft preparation, P.L., A.D., A.B. and A.C.; writing—review and editing, P.L., A.D., A.B. and R.M.; visualization, G.D.A. and R.M.; supervision, P.L.; funding acquisition, R.M., P.L., A.C., G.D.A. and L.L. All authors have read and agreed to the published version of the manuscript.
Funding
This research was funded by the European Union’s Horizon 2020 research and innovation program, Grant Agreement ID: 955529.
Institutional Review Board Statement
Not applicable.
Informed Consent Statement
Informed consent was obtained from all subjects involved in the study.
Data Availability Statement
The data that support the findings of this study are available from the corresponding author upon reasonable request.
Acknowledgments
Thanks to the partners of the H2020 re-MODULEES project (the Retrofitting Market Activation Platform based on the generation of standard modules for energy efficiency and clean-energy solutions, re-MODULEES) and the re-LAB members from each pilot market. The partners of H2020 re-MODULEES project are Huygen Engineers and Advisors (HI&A) (Coordinator), Stichting ISSO (ISSO), Bouwhulp Group (BHG), Consiglio Nazionale Ricerche Istituto per le Tecnologie della Costruzione (CNR ITC), Certificazioni Materiali Costruzione (CERTIMAC), Accademia Europea di Bolzano (Eurac), SYMPRAXIS Team (SYMP), CENTRE FOR RENEWABLE ENERGY SOURCES AND SAVING (CRES), Instituto Valenciano Edification (IVE), Ubik Geospatial Solutions (UBIK), R2M Solutions (R2M), DOWEL Management (DOWEL), Center for Energy Efficiency (EnEffect), Institute for Innovation and Development of University of Ljubljana (IRIUL), Meta Group META, International Union of Property Owners (UIPI).
Conflicts of Interest
The authors declare no conflict of interest.
Appendix A
In Table A1, an example of constraint descriptions from survey sheet tables of Bulgaria’s pilot market is reported.
Table A1.
Bulgaria Pilot market survey sheet extract.
Table A1.
Bulgaria Pilot market survey sheet extract.
| Pilot Market: Bulgaria |
|---|
| Constraints on the Actors |
| Lack of access to quality training materials and training courses for owners, construction workers, and designers, which leads to poor quality throughout the deep retrofit value chain. |
| Not enough active communication campaigns for owners leaving them unaware of all the benefits of deep retrofitting. |
| Lack of one-stop shops where interested owners can get information, recommendations, and help for the whole retrofit process from A to Z. |
| Lack of accessible and high-quality consultations from experts due to low interest in deep retrofitting. |
| Lack of incentivizing schemes for owners and investors, such as tax reductions, interest-free loans, and VAT exemption. |
| Constraints on the Activities |
| Lack of monitoring of retrofitted projects due to lack of adequate legislation. |
| Insufficient requirements for energy characteristics due to a low understanding of energy efficiency principles and the lack of strong EE legislation. |
| Lack of ambitions for deep retrofitting due to low interest in deep retrofitting. |
| Lack of pilot projects due to low public interest, lack of incentives, and investments in deep retrofitting. |
| Small-sized construction companies and their lack of skilled personnel across the whole construction process, leading to poor quality of the retrofit projects. |
| The Bulgarian market mostly relies on grants for retrofitting buildings, which leads to a lack of alternative financial mechanisms that can attract private investments. |
| Constraints on the Relations |
| Fragmentation of the market supply chain due to the lack of one-stop shops due to the principle of the “lowest price wins”. |
| Inconsistency about future programs is preventing long-term investments in the Bulgarian market, which is price-oriented, and only grants are expected. No other financing possibilities and options are considered. |
| Ownership structure in multifamily residential buildings. |
| Low energy prices making investments in deep retrofits less attractive. |
| Projects are chosen by the “lowest-price-wins” approach due to a low understanding of the benefits of deep retrofitting. |
| Connections among the Constraints |
| The small size of construction companies and market fragmentation are closely connected because there are no established connections between all the different actors and processes in the deep retrofit value chain. |
| The lack of quality information, inconsistencies about future programs, and the lack of active communication campaigns lead to an underdeveloped culture for retrofitting and obstruct the achievement of a high percentage of deep retrofits. |
| The lack of consultations, the lack of training for deep retrofits, and the lack of monitoring lead to poor quality of execution and skepticism in the whole process. |
| The ownership structure, the insufficient requirements for the building energy characteristics, and the lack of financing and incentives lead to the rejection of homeowners to see the benefits of deep retrofits. |
| The low prices for energy and the long repayment period are the main constraints leading to limited access to financing. |
| A low understanding of the principles of energy efficiency throughout the whole value chain leads to low interest in such investments, as well as a lack of ambition and motivation for consultants, designers, workers, universities, and owners to explore deep retrofitting as a better solution. |
Appendix B
In Figure A1, an extract of the Web questionnaire sent to the consortium to collect the vote of relevance of the re-LAB member is reported.
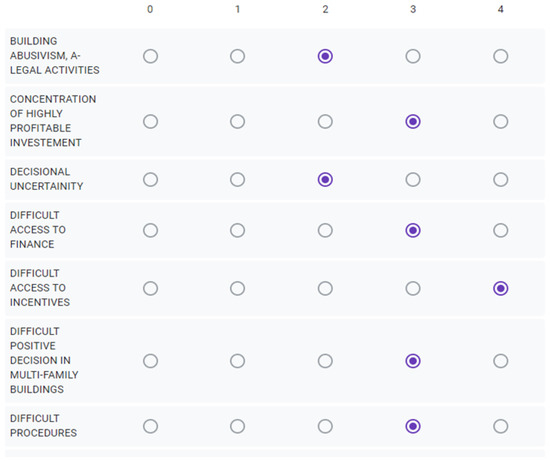
Figure A1.
Extract from the web questionnaire to collect the re-LAB member votes of relevance.
Appendix C
The constraint classification of each pilot market is reported in Figure A2 for the Demand and Supply side and in Figure A3 for the Financial and Institutional side.
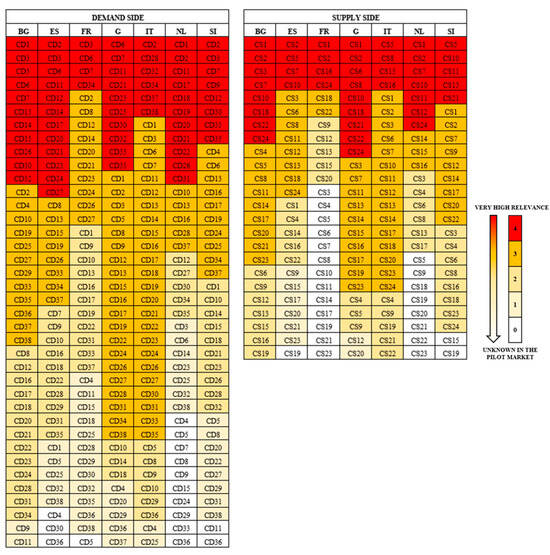
Figure A2.
Constraints classification of each pilot market—Demand and Supply side.
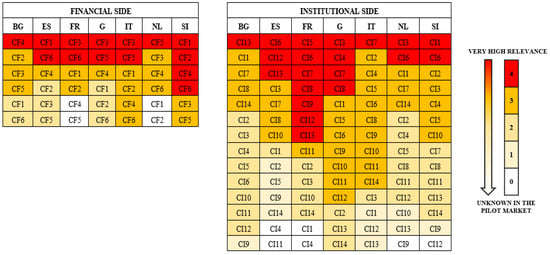
Figure A3.
Constraints classification of each pilot market—Financial and Institutional side.
Appendix D
The most important constraint lists of each pilot market for each side are reported in Figure A4, Figure A5, Figure A6, Figure A7, Figure A8, Figure A9 and Figure A10.
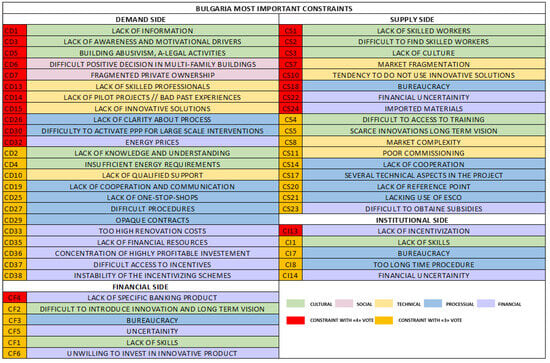
Figure A4.
Bulgaria’s most important constraints list—all sides.
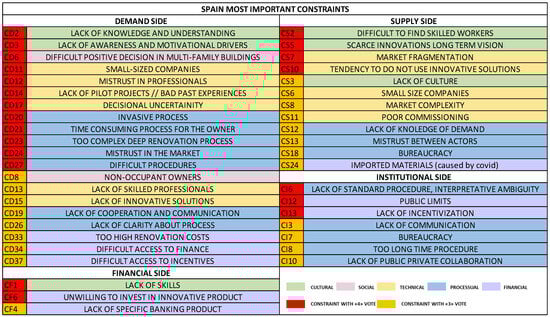
Figure A5.
Spain’s most important constraints list—all sides.
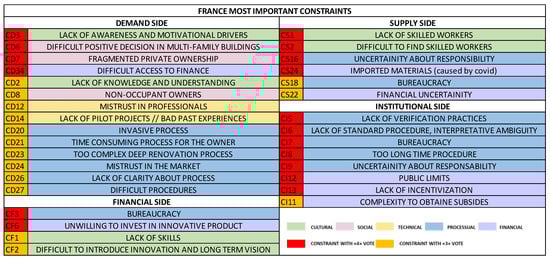
Figure A6.
France’s most important constraints list—all sides.
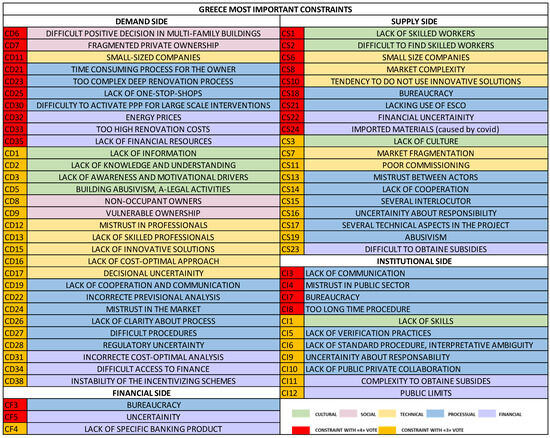
Figure A7.
Greece’s most important constraints list—all sides.
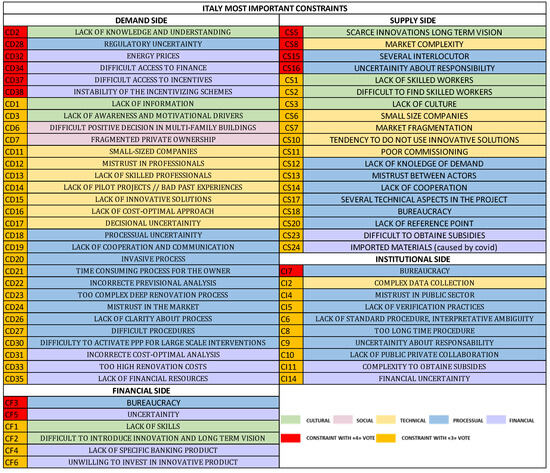
Figure A8.
Italy’s most important constraints list—all sides.
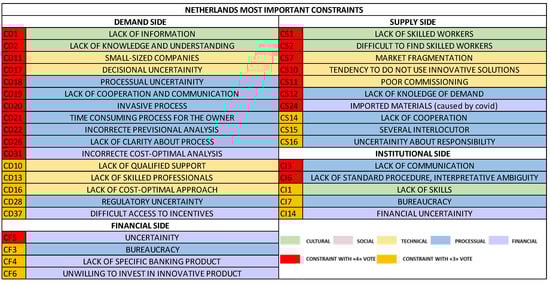
Figure A9.
The Netherlands’ most important constraints list—all sides.
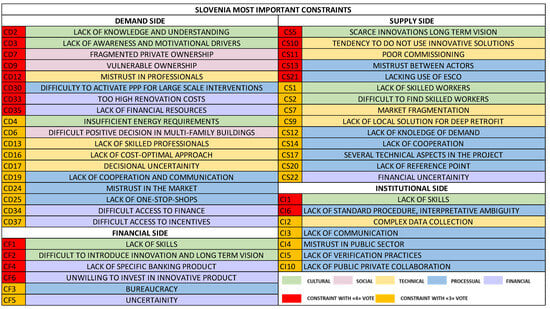
Figure A10.
Slovenia’s most important constraints list—all sides.
References
- Technical Dialogue of the First Global Stocktake. Synthesis Report by the Co-Facilitators on the Technical Dialogue | UNFCCC. Available online: https://unfccc.int/documents/631600 (accessed on 19 October 2023).
- De Oliveira, R.S.; de Oliveira, M.J.L.; Nascimento, E.G.S.; Sampaio, R.; Nascimento Filho, A.S.; Saba, H. Renewable Energy Generation Technologies for Decarbonizing Urban Vertical Buildings: A Path towards Net Zero. Sustainability 2023, 15, 3030. [Google Scholar] [CrossRef]
- AR6 Synthesis Report: Climate Change 2023—IPCC. Available online: https://www.ipcc.ch/report/sixth-assessment-report-cycle/ (accessed on 19 October 2023).
- Kangas, H.L.; Lazarevic, D.; Kivimaa, P. Technical Skills, Disinterest and Non-Functional Regulation: Barriers to Building Energy Efficiency in Finland Viewed by Energy Service Companies. Energy Policy 2018, 114, 63–76. [Google Scholar] [CrossRef]
- European Commission. Communication from the Commission to the European Parliament, the European Council, the Council, the European Economic and Social Committee and the Committee of the Regions—The European Green Deal; European Commission: Brussels, Belgium, 2019. [Google Scholar]
- European Commission. Clean Energy for All Europeans Package; European Commission: Brussels, Belgium, 2019. [Google Scholar]
- European Commission. Communication from the Commission to the European Parliament, the Council, the European Economic and Social Committee and the Committee of the Regions a Renovation Wave for Europe—Greening Our Buildings, Creating Jobs, Improving Lives COM/2020/662 Final; European Commission: Brussels, Belgium, 2020. [Google Scholar]
- European Commission. Commission Recommendation (EU) 2019/786 of 8 May 2019 on Building Renovation; European Commission: Brussels, Belgium, 2019. [Google Scholar]
- European Commission. Directive 2010/31/EU of the European Parliament and of the Council of 19 May 2010 on the Energy Performance of Buildings (Recast); European Commission: Brussels, Belgium, 2010. [Google Scholar]
- D’Oca, S.; op‘t Veld, P. People-Centred Deep Renovation Practices: From Challenges to Strategies. Tema Technol. Eng. Mater. Archit. 2018, 4, 81–91. [Google Scholar] [CrossRef]
- European Commission. Energy Performance of Buildings (Recast)—Amendments Adopted by the European Parliament on 14 March 2023 on the Proposal for a Directive of the European Parliament and of the Council on the Energy Performance of Buildings (Recast) (COM(2021)0802—C9-0469/2021—2021/0426(COD)); European Commission: Brussels, Belgium, 2023. [Google Scholar]
- Longo, F.; Cascardi, A.; Lassandro, P.; Aiello, M.A. Energy and Seismic Drawbacks of Masonry: A Unified Retrofitting Solution. J. Build. Pathol. Rehabil. 2021, 6, 31. [Google Scholar] [CrossRef]
- Belussi, L.; Barozzi, B.; Bellazzi, A.; Danza, L.; Devitofrancesco, A.; Fanciulli, C.; Ghellere, M.; Guazzi, G.; Meroni, I.; Salamone, F.; et al. A Review of Performance of Zero Energy Buildings and Energy Efficiency Solutions. J. Build. Eng. 2019, 25, 100772. [Google Scholar] [CrossRef]
- Camarasa, C.; Nägeli, C.; Ostermeyer, Y.; Klippel, M.; Botzler, S. Diffusion of Energy Efficiency Technologies in European Residential Buildings: A Bibliometric Analysis. Energy Build. 2019, 202, 109339. [Google Scholar] [CrossRef]
- Kamari, A.; Kirkegaard, P.H.; Leslie Schultz, C.P. PARADIS—A Process Integrating Tool for Rapid Generation and Evaluation of Holistic Renovation Scenarios. J. Build. Eng. 2021, 34, 101944. [Google Scholar] [CrossRef]
- Bragolusi, P.; D’Alpaos, C. The Valuation of Buildings Energy Retrofitting: A Multiple-Criteria Approach to Reconcile Cost-Benefit Trade-Offs and Energy Savings. Appl. Energy 2022, 310, 118431. [Google Scholar] [CrossRef]
- Capogrosso, R.; De Aloysio, G.; Laghi, L.; Malvezzi, R.; Menconi, E.; Padula, M.; Pecchia, F.; Cruceira, Á.R.; Salmeròn Lissén, J.M.; Scala, P.L. Deep Energy Retrofit of Residential Buildings in the Mediterranean Area: The MedZEB Approach. In Smart and Sustainable Planning for Cities and Regions; Bisello, A., Vettorato, D., Ludlow, D., Baranzelli, C., Eds.; Springer: Cham, Switzerland, 2021; pp. 29–45. [Google Scholar] [CrossRef]
- D’Oca, S.; Ferrante, A.; Veld, P.O.; Peraudeau, N.; Peters, C.; Pernetti, R.; Schippers-Trifan, O.; Decorme, R. Exploitation of Business Models for Deep Renovation. Proceedings 2019, 20, 11. [Google Scholar] [CrossRef]
- Mainali, B.; Mahapatra, K.; Pardalis, G. Strategies for Deep Renovation Market of Detached Houses. Renew. Sustain. Energy Rev. 2021, 138, 110659. [Google Scholar] [CrossRef]
- Gkatzogias, K.; Crowley, H.; Veljkovic, A.; Pohoryles, D.; Tsionis, G.; Bournas, D. Building Renovation in the EU: Scenarios and Impact Assessment | Buildings’ Renovation Makerspace; Gkatzogias, K., Tsionis, G., Eds.; Publications Office of the European Union: Luxembourg, 2022. [Google Scholar]
- Felius, L.C.; Dessen, F.; Hrynyszyn, B.D. Retrofitting towards Energy-Efficient Homes in European Cold Climates: A Review. Energy Effic. 2020, 13, 101–125. [Google Scholar] [CrossRef]
- Pardalis, G.; Mahapatra, K.; Mainali, B. Comparing Public- and Private-Driven One-Stop-Shops for Energy Renovations of Residential Buildings in Europe. J. Clean. Prod. 2022, 365, 132683. [Google Scholar] [CrossRef]
- Shnapp, S.; Paci, D.; Bertoldi, P. Untapping Multiple Benefits: Hidden Values in Environmental and Building Policies; JRC120683; Publications Office of the European Union: Luxembourg, 2020; pp. 1–103. ISBN 978-92-76-19983-0. [Google Scholar] [CrossRef]
- Murto, P.; Jalas, M.; Juntunen, J.; Hyysalo, S. Devices and Strategies: An Analysis of Managing Complexity in Energy Retrofit Projects. Renew. Sustain. Energy Rev. 2019, 114, 109294. [Google Scholar] [CrossRef]
- Labanca, N.; Suerkemper, F.; Bertoldi, P.; Irrek, W.; Duplessis, B. Energy Efficiency Services for Residential Buildings: Market Situation and Existing Potentials in the European Union. J. Clean. Prod. 2015, 109, 284–295. [Google Scholar] [CrossRef]
- Du, H.; Han, Q.; de Vries, B. Modelling Energy-Efficient Renovation Adoption and Diffusion Process for Households: A Review and a Way Forward. Sustain. Cities Soc. 2022, 77, 103560. [Google Scholar] [CrossRef]
- Mazzoli, C.; Corticelli, R.; Dragonetti, L.; Ferrante, A.; Van Oorschot, J.; Ritzen, M. Assessing and Developing Circular Deep Renovation Interventions towards Decarbonisation: The Italian Pilot Case of “Corte Palazzo” in Argelato. Sustainability 2022, 14, 13150. [Google Scholar] [CrossRef]
- Horizon2020 Happen—Welcome to the Happen Platform. Available online: https://medzeb-happen.eu/ (accessed on 21 December 2022).
- InterregCentralEurope EPC Tool. Available online: https://nzeb.thorium.software/ (accessed on 21 December 2022).
- Horinzon 2020 IBRoad Project—Individual Building Renovation Roadmaps. Available online: https://ibroad-project.eu/ (accessed on 21 December 2022).
- Tisov, A.; Kuusk, K.; Navarro Escudero, M.; Niki Assimakopoulos, M.; Papadaki, D.; Pihelo, P.; Op’T Veld, P.; Kalamees, T. Driving Decarbonisation of the EU Building Stock by Enhancing a Consumer Centred and Locally Based Circular Renovation Process. E3S Web Conf. 2020, 172, 18006. [Google Scholar] [CrossRef]
- Loga, T.; Stein, B.; Diefenbach, N. TABULA Building Typologies in 20 European Countries—Making Energy-Related Features of Residential Building Stocks Comparable. Energy Build. 2016, 132, 4–12. [Google Scholar] [CrossRef]
- Horizon 2020 Re-MODULEES Project—Flexible Building Renovation Shared Solutions. Available online: https://re-modulees.eu/ (accessed on 19 October 2023).
- H2020 Project an ENErgy Retrofit FUNDing Rating Tool—ENERFUND. Available online: https://cordis.europa.eu/project/id/695873/results (accessed on 22 December 2023).
- Attractive, Acceptable and Affordable Deep Renovation by a Consumers Orientated and Performance Evidence Based Approach | TripleA-Reno | Project | Fact Sheet | H2020 | CORDIS | European Commission. Available online: https://cordis.europa.eu/project/id/784972 (accessed on 22 December 2023).
- H2020 Project Drive 0—Driving Decarbonization of the EU Building Stock by Enhancing a Consumer Centred and Locally Based Circular Renovation Process. Available online: https://www.drive0.eu/ (accessed on 22 December 2023).
- Scriven, M. The Logic of Evaluation. In OSSA Conference Archive, 138 ed. 2007. Available online: https://scholar.uwindsor.ca/ossaarchive/OSSA7/papersandcommentaries/138 (accessed on 22 December 2023).
- Shetty, P.; Singh, S. Hierarchical Clustering: A Survey. Int. J. Appl. Res. 2021, 7, 178–181. [Google Scholar] [CrossRef]
- Saxena, A.; Prasad, M.; Gupta, A.; Bharill, N.; Patel, O.P.; Tiwari, A.; Er, M.J.; Ding, W.; Lin, C.T. A Review of Clustering Techniques and Developments. Neurocomputing 2017, 267, 664–681. [Google Scholar] [CrossRef]
- Maninderjit Kaur, S.K.G. Survey on Clustering Techniques in Data Mining for Software Engineering. Int. J. Adv. Innov. Res. 2014, 3, 238–243. [Google Scholar]
- Gupta, M.C.; Boyd, L.H. Theory of Constraints: A Theory for Operations Management. Int. J. Oper. Prod. Manag. 2008, 28, 991–1012. [Google Scholar] [CrossRef]
- Kuchaki Rafsanjani, M.; Asghari Varzaneh, Z.; Emami Chukanlo, N. A Survey of Hierarchical Clustering Algorithms. J. Math. Comput. Sci. 2012, 5, 229–240. [Google Scholar] [CrossRef]
- Scriven, M. Key Evaluation Checklist Intended for Use in Designing and Evaluating Programs, Plans, and Policies; Writing Evaluation Reports on Them; Assessing Their Evaluability; and Evaluating Evaluations of Them. 2007. Available online: https://wmich.edu/sites/default/files/attachments/u1105/2023/kec-scriven.pdf (accessed on 22 December 2023).
- Menke, W. Some Comments on Probability Theory. In Geophysical Data Analysis: Discrete Inverse Theory; Elsevier: Amsterdam, The Netherlands, 2012; pp. 15–37. [Google Scholar] [CrossRef]
- Caggiano, A.; Giuseppe, E.D.; Golić, K.; Kosorić, V.; Kosić, T.; Stamatović, S.; Vučković, V.; Kujundžić, K.K. A Platform of Critical Barriers to Socially Sustainable Residential Buildings: Experts’ Perspective. Sustainability 2023, 15, 7485. [Google Scholar] [CrossRef]
- Carlander, J.; Thollander, P. Drivers for Implementation of Energy-Efficient Technologies in Building Construction Projects—Results from a Swedish Case Study. Resour. Environ. Sustain. 2022, 10, 100078–100089. [Google Scholar] [CrossRef]
- Polzin, F.; Sanders, M. How to Finance the Transition to Low-Carbon Energy in Europe? Energy Policy 2020, 147, 111863–111879. [Google Scholar] [CrossRef]
- Bertoldi, P.; Boza-Kiss, B.; Della Valle, N.; Economidou, M. The Role of One-Stop Shops in Energy Renovation—A Comparative Analysis of OSSs Cases in Europe. Energy Build. 2021, 250, 111273–111290. [Google Scholar] [CrossRef]


Disclaimer/Publisher’s Note: The statements, opinions and data contained in all publications are solely those of the individual author(s) and contributor(s) and not of MDPI and/or the editor(s). MDPI and/or the editor(s) disclaim responsibility for any injury to people or property resulting from any ideas, methods, instructions or products referred to in the content. |
© 2023 by the authors. Licensee MDPI, Basel, Switzerland. This article is an open access article distributed under the terms and conditions of the Creative Commons Attribution (CC BY) license (https://creativecommons.org/licenses/by/4.0/).