Article

Towards Affordable Precision Irrigation: An Experimental Comparison of Weather-Based and Soil Water Potential-Based Irrigation Using Low-Cost IoT-Tensiometers on Drip Irrigated Lettuce

Mediterranean Agronomic Institute of Bari, 70010 Bari, Italy
*
Author to whom correspondence should be addressed.
Sustainability 2024, 16(1), 306; https://doi.org/10.3390/su16010306
Submission received: 1 November 2023 / Revised: 15 December 2023 / Accepted: 22 December 2023 / Published: 28 December 2023

Abstract

:
Predictive weather-based models are widely used to schedule irrigation through the estimation of crop evapotranspiration. However, perceiving real-time crop water requirements remains a challenge. This research aims at field validating and exploiting a low-cost IoT soil moisture tensiometer prototype to consequently compare weather-based irrigation to soil water moisture-based irrigation in terms of yield and crop water productivity. The prototype is based on the ESP32 microcontroller and BMP180 barometric sensor. When compared to a mechanical tensiometer, the IoT prototype proved its accuracy, registering an average R2 equal to 0.8 and an RMSE range of 4.25–7.1 kPa. In a second step, the irrigation of a Romaine lettuce field (Lactuca sativa L.) cultivated under a drip system was managed according to two different scenarios: (1) using the data feed from the IoT tensiometers, irrigation was performed to keep the soil water potential between −15 and −25 kPa; (2) using the data provided by the in-situ weather station to estimate the crop water requirements. When comparing the yield, no significant difference was registered between the two scenarios. However, the water productivity was significantly higher, registering a 36.44% increment in scenario 1. The experiment highlights the water-saving potential achievable through real-time monitoring of soil moisture conditions. Since it is a low-cost device (82.20 USD), the introduced prototype facilitates deploying and managing a fleet of sensors for soil water potential live mapping.

1. Introduction

Water is fundamental for our existence. Although it covers 71% of the planet, only 2.5% is fresh water, out of which only 1% is accessible [1]. Thus, mismanagement is a luxury that cannot be afforded. Moreover, the combination of population growth and climate change is placing additional stress on the already limited water resources, particularly in the Mediterranean region and Eurasia. This is affecting livelihoods, food security, economic development, and even social stability [2].
On a global scale, 70% of freshwater consumption is attributed to irrigated agriculture, which serves as the main cause and causality of water scarcity [3,4]. Consequently, there is a significant need to prioritize and improve on-farm irrigation management to effectively address such challenges.
Precision irrigation stands as a cornerstone for advancing agricultural sustainability. By leveraging technologies like soil moisture sensors, weather data, and automated irrigation systems, it enables farmers to deliver water precisely where and when it is needed [5]. This targeted approach conserves water resources and mitigates the strain on increasingly scarce water supplies. Furthermore, precision irrigation allows for the optimization of nutrient delivery, thus reducing excess runoff and minimizing the risk of water pollution. This practice not only enhances crop health and yields but also supports the long-term resilience of the soil, which is crucial for sustainable agriculture [6]. Overall, precision irrigation is a key strategy for promoting agricultural sustainability, ensuring that agriculture can meet the growing global demand for food while minimizing its environmental impact. Yet, the lack of affordable and dependable data monitoring systems poses a major barrier to such potential enhancements [7]. Considering the spatially variable and stochastic nature of agricultural systems, it becomes imperative to have access to cost-effective and energy-efficient data acquisition systems. Such systems could play a major role in more accurate scheduling, monitoring, and assessment of irrigation activities [8].
This research work aims to (i) field validate a low-cost prototype DIY soil moisture tensiometer and (ii) exploit its use by comparing soil moisture-based irrigation management to weather-based irrigation management in terms of yield and water productivity.

2. Materials and Methods

2.1. Irrigation Scheduling

Irrigation scheduling directly impacts water use efficiency as it involves making decisions regarding the timing and quantity of water application to the field [9]. To efficiently schedule irrigation events, one must comprehend the dynamics of the plant water continuum, which is influenced by the interaction between weather conditions, soil characteristics, and plant physiology, usually referred to as SPAC (Soil-Plant-Atmosphere-Continuum) [10]. Hence, the criteria on which irrigation scheduling approaches are based are divided into (i) weather-based scheduling, (ii) soil moisture-based scheduling, and (iii) plant status-based scheduling.
Coupled with the rapid development of solid-state sensors and cloud platform-based services, monitoring systems could be integrated into the three aforementioned approaches. In the next section, the first two main approaches and their comparisons in relation to monitoring systems will be briefly presented.
It is worth mentioning that other factors could impact the actual implementation of an irrigation schedule outside the SPAC [11], such as the water supply routine, existing irrigation infrastructure, irrigator preferences based on social behavior patterns, fertigation and leaching requirements, … etc. Yet, this study is based on on-farm irrigation events that target the full satisfaction of plant water requirements using an on-demand, supplied drip irrigation system.

2.1.1. Weather Conditions Based Scheduling

It implies estimating reference evapotranspiration (ET0) using measured weather parameters for a well-irrigated theoretical Alfalfa grass with a height of 12 cm, settled and immovable plane resistance of 70 s m−1 and an albedo of 0.23, vigorously rising, effectively watered, and entirely covering the land [12]. Several models were developed to estimate ETc. One of the most used models is the FAO 56—Penman–Monteith [12,13,14] (Equation (1)).
E T 0 = 0.408 Δ R n G + γ   900 T + 273   u 2 ( e s e a ) Δ + γ   ( 1 + 0.34 u 2 ) π r 2
where E T 0 is the reference evapotranspiration (mm day−1), R n is the net radiation at the crop surface (MJ m−2 day−1), G is the soil heat flux density (MJ m−2 day−1), T is the air temperature at 2 m height (°C), u 2 is the wind speed at 2 m height (m s−1), e s is the saturation vapor pressure (kPa), ea is the actual vapor pressure (kPa), e s e a is the saturation vapor pressure deficit (kPa), Δ is the slope vapor pressure curve (kPa °C−1), and γ is the psychrometric constant (kPa °C−1).
Once ET0 is estimated, it must be corrected using an empirical factor to represent the crop evapotranspiration ( E T c ) (mm day−1) relative to E T 0 at each growth stage (crop coefficient Kc) where:
E T c = E T 0 . K c
E T c represents the potential crop evapotranspiration, i.e., the crop water requirement. The objective of an efficient irrigation schedule based on this model is to replenish E T c as readily available water (RAW) to be taken by the plant’s effective root zone while minimizing the water losses that may occur along the distribution system. This could be represented by Equation (3) [15]:
R A W = M A D   .   θ f c θ p w p   .   D r   .   10
where MAD is the management allowed depletion (the fraction of total available water that is allowed to be depleted before the next event), θfc is volumetric water content at field capacity (cm3 · cm−3), θpwp is volumetric water content at the permanent wilting point (cm3 · cm−3), and Dr is the effective root zone depth in cm. RAW is expressed in mm.
Automated weather monitoring was one of the earliest systems to be integrated into irrigation management [16]. Currently, wireless weather stations are commercially available and equipped with sensors capable of measuring all the parameters mentioned in Equation (1) and automating ET0 calculations using variable transmission protocols.
Yet, the main uncertainty of this method stems from the agronomic inputs needed to simulate crop evapotranspiration, mainly the estimation of Kc and yield response to stresses represented by the stress coefficient Ks [17]. Estimating Kc for crops is a complicated process that requires estimating the crop’s ETc using well-irrigated lysimeters and back-calculating Kc relative to ET0 [18]. As it is not a feasible task for the majority of irrigators, Kc is usually assumed from pre-defined values that could be found in the literature for similar climatic zones and various crops [12,19,20]. Another significant challenge arises from the daily variation of Kc values, which can change as crops grow and their leaf area expands [21,22].
An additional important point to consider when scheduling irrigation based on weather conditions is the time frame of the weather data used to estimate ET0. Two main methods are found in the literature:
  • Predictive weather-based models that use a probabilistic approach to generate a representative set from historical recorded data for the targeted period consider dry years re-occurrence with a certain predefined probability. In this case, the generated schedule should be adjusted while being implemented based on daily data, especially rain fall events [23,24,25,26].
  • Near-real-time weather-based models that use short forecasting for daily estimations of ET0 to automate irrigation events accordingly [27].
In conclusion, accurate implementation of ET-based irrigation scheduling on a commercial basis can prove challenging for growers, even if a more accurate estimation of Kc is provided. The process involves retrieving daily ET0 values from a representative weather station installed in a location with certain standard specifications [28]. Such limitations drive farmers towards using publicly available ET0 coupled with predefined Kc from the literature, usually leading to overirrigation [21].

2.1.2. Soil Moisture Based Scheduling

When managing irrigation events, farmers tend to rely on experience by sensing the soil using their bare hands to judge its moisture condition based on its texture, structure, and wetness. This judgment intuition could be described scientifically by two main terms: (i) soil moisture content and (ii) soil water matric potential [29]. The first describes the amount of water stored in the soil relative to its dry mass in volumetric or gravimetric terms. The second is the energy that plant roots need to exert to draw water from the soil, or the forces exerted by the soil matrix to hold the water, usually measured by tensiometers [30]. Soil moisture condition sensors are commercially available for measuring both soil volumetric water content and soil water matrix potential. A comprehensive review of the most commonly used sensors and their working concepts can be found in [31].
Monitoring soil water potential is crucial for effective irrigation management as it provides more accurate information about the availability of water to plants and their ability to extract it from the soil. While soil water content indicates the amount of water present in the soil, regardless of the plant’s ability to access that water [32].
Soil moisture tensiometers are one of the earliest and most widely adopted devices for measuring soil water potential. They consist of a porous cup and a vacuum gauge for measuring the equivalent negative pressure or water tension in unsaturated soils [33]. Unlike soil water content sensors, tensiometers are not sensitive to variations in soil texture [34], so they do not require prior calibration to be used for determining the matric potential at the current moment. Yet, it is important to couple soil water content readings with soil water potential monitoring to avoid over-irrigation, as tensiometers are inaccurate under high tensions (−80 to −100 kPa), especially in fine-textured soils [30].
Soil water potential (SWP) could be described as follows:
ψ = ψ m + ψ o + ψ p + ψ g
where ψ (kPa) is the potential energy per unit mass, volume, or weight of water and the sub-scripts m, o, p, and g are the matric, osmotic, pressure, and gravitational potentials, respectively [35].
Irrigation scheduling based on soil water potential, typically obtained through soil moisture tensiometers, is a practical and profound approach to ensuring efficient and rational use of water resources in irrigated agriculture [36,37]. It implies defining a soil water potential threshold—or a comfortable zone—for a specific crop below which the plant begins to suffer [38]. A lot of predefined thresholds could be found in the literature for various crops [30,35,38,39,40,41,42,43,44,45,46,47,48].
Several studies reported potential improvements in water productivity when switching to soil water-based irrigation compared to other irrigation approaches [49]. However, few have compared soil water potential-based irrigation to the FAO method of estimating crop water requirements [12] or any other weather-based irrigation approach. Smajstrla and Locascio [50] Smajstrla and Locascio compared irrigation scheduling based on pan evaporation to soil water potential-based scheduling using tensiometers under tomato drip cultivation. Water productivity increased by 40 and 50% when soil water potential was kept at −10 and −15 kPa, respectively, compared to the pan-evaporation-based field. Also, in a tomato drip-irrigated field, [51] compared soil water potential-based irrigation management using two thresholds (−10 kPa and −15 kPa) to conventional farmer practices. The results showed up to 73% of potential water reduction when irrigation was based on the soil water potential with minimal impact on yield. In Green houses, Buttaro, et al. [52] reported water savings of 35% and 45% for tomato and cucumber, respectively, when setting an irrigation schedule based on tension threshold ranges of −10 to −40 kPa for tomato and −10 to −30 kPa for cucumber. Yang, et al. [53] reported an improvement of 43.1% to 50.3% in water productivity when switching to soil water potential-based irrigation management under rice cultivation, where the SWP was kept at −15 kPa.

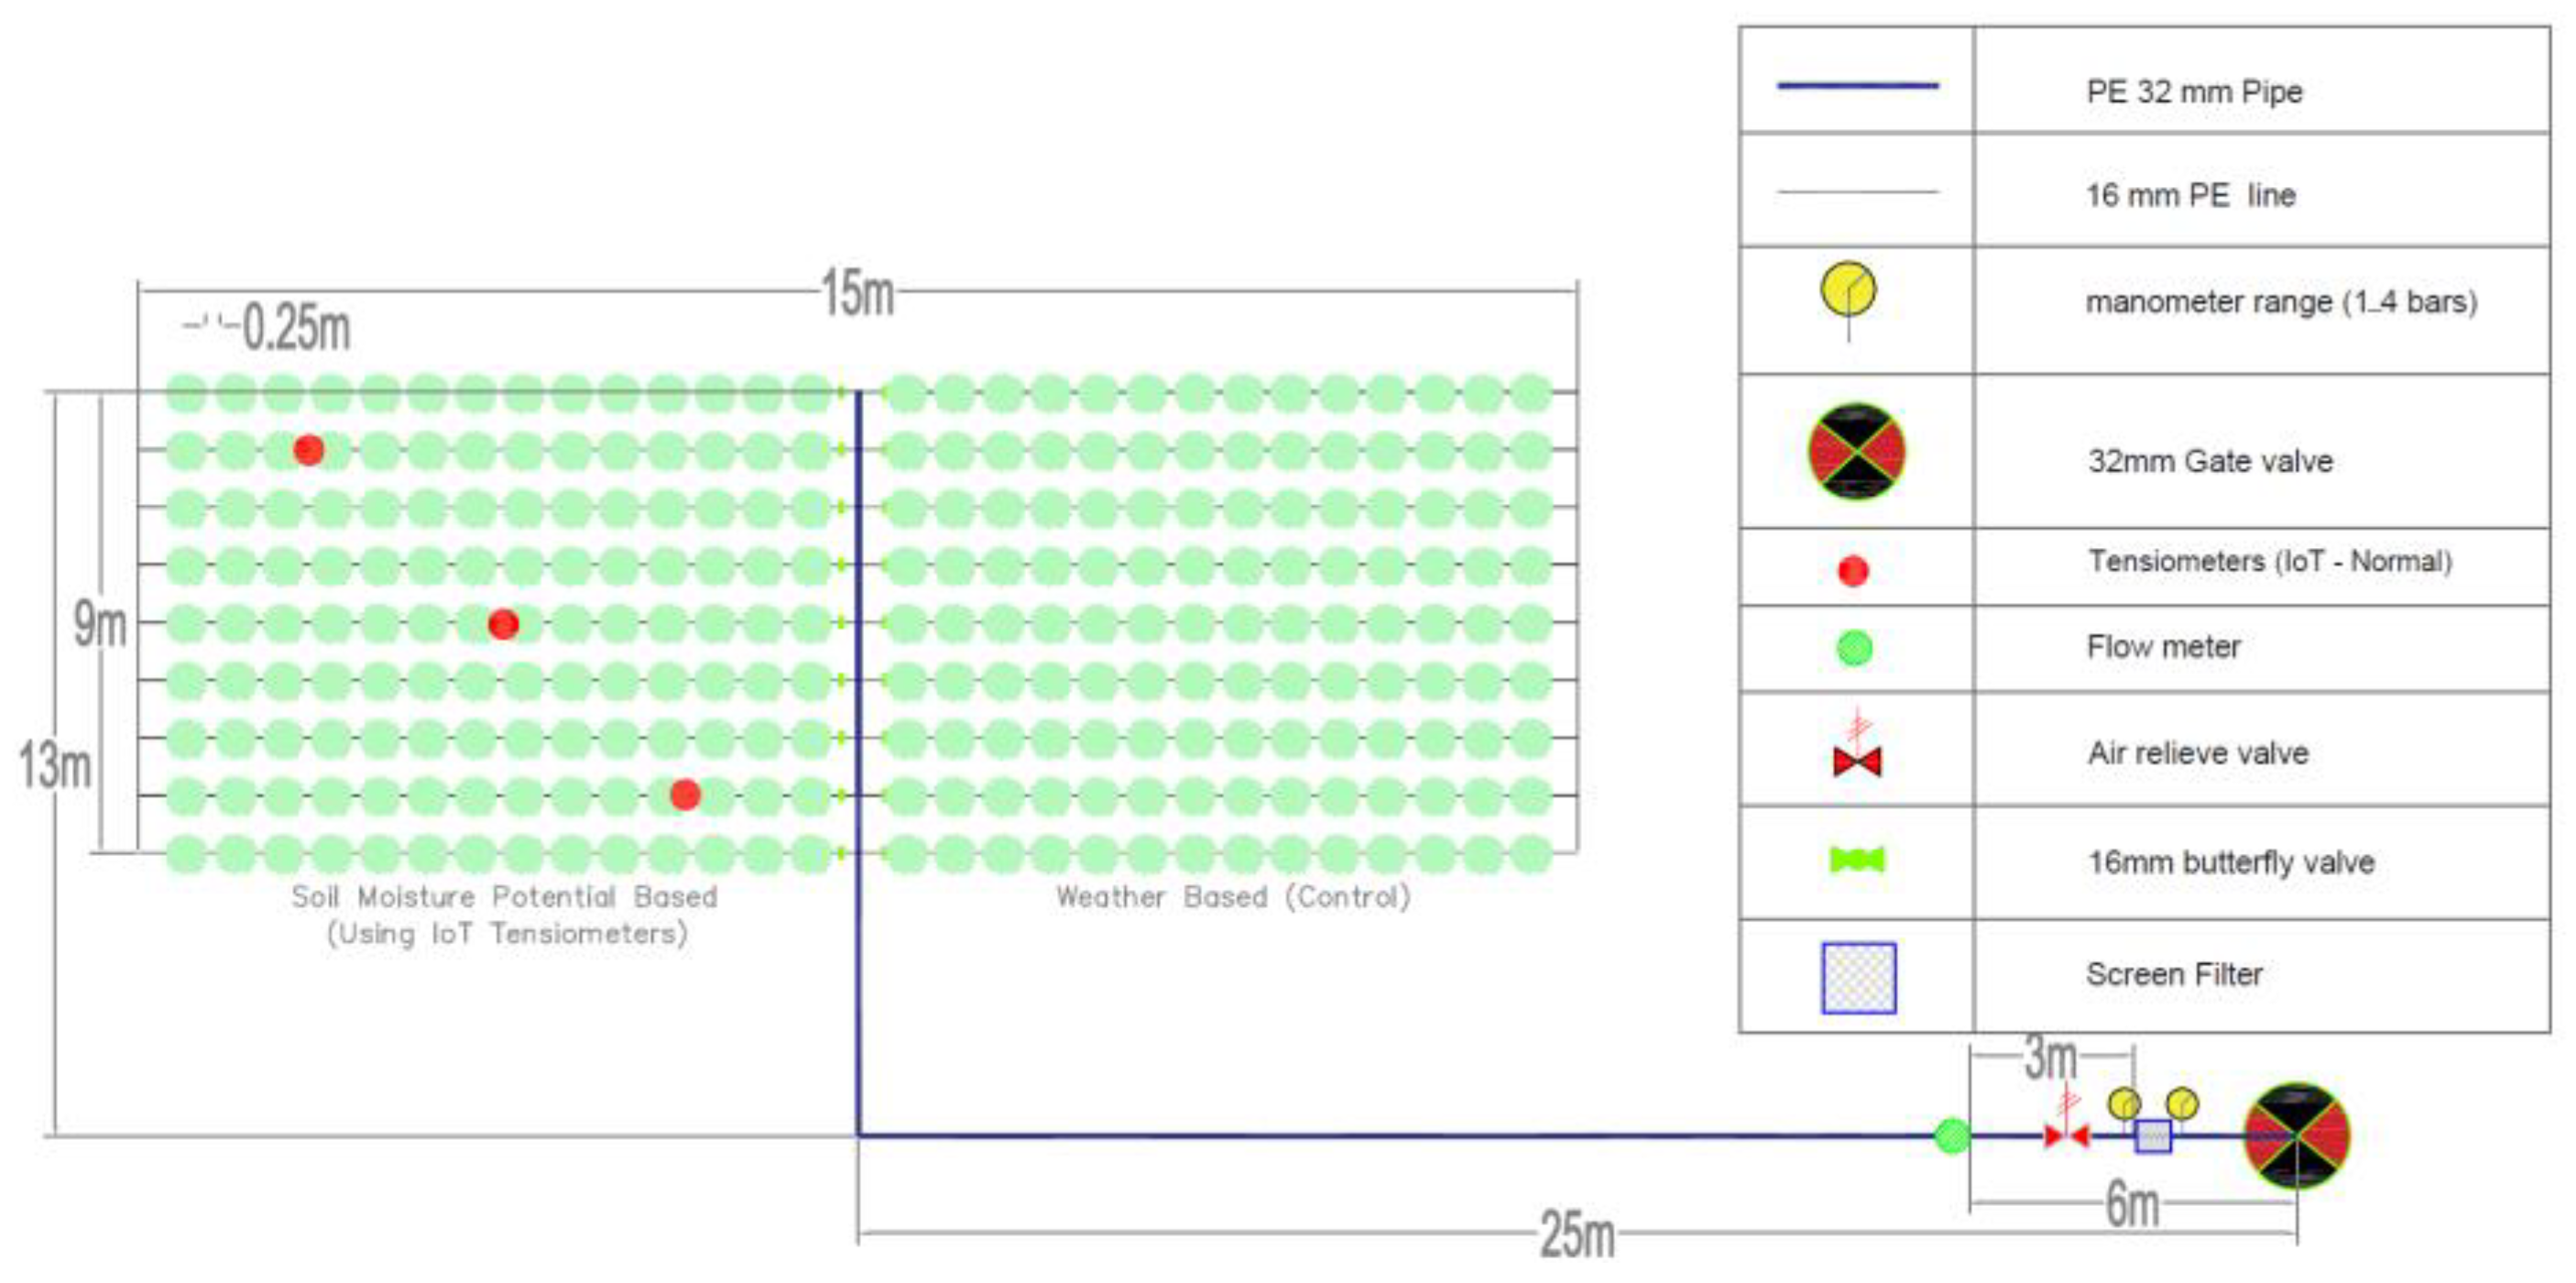
2.2. Experimental Layout

The experiment was conducted in CIHEAM Bari’s experimental field located in Valenzano, Puglia region, South of Italy (41°2′40.3872″ N, 16°53′3.8364″ E), during the period April–June 2023, under transplanted Romaine lettuce (Lactuca sativa L.).
The designed area was 15 m × 9 m divided into two plots, 7.5 m × 9 m each. Both plots were equipped with a drip irrigation system where the distance between lines was 1 m and the distance between the drippers (plants) was 0.25 m. Drippers were self-compensating with a designed flow rate of 2 L/h. All 16 mm laterals feeding the drippers were equipped with small butterfly valves to ensure precise control of each dripper line, an important design feature as the irrigation schedule will be different from one plot to the next. Figure 1 shows the experimental layout.
The first plot (Control) was irrigated according to the potential evapotranspiration derived from a weather station adjacent to the field using Penman–Monteith (Equation (1)) and adjusted using crop coefficients at variable growth stages based on FAO 56 [12] to calculate the potential crop water requirement as explained in Equation (2). Other agronomic and soil parameters are needed to simulate lettuce growth in the identified location. Table 1 summarizes all parameters used to generate the irrigation schedule, along with their sources and whether they were estimated or lab-measured. To facilitate the calculation process, Aquacrop [54] was used to generate the irrigation schedule.
Irrigation management for this plot was implemented according to the generated irrigation schedule; however, the daily gross irrigation requirement was adjusted according to the measured daily rainfall during the season to avoid over-irrigation. All amounts of water supplied to the plot during the season were recorded using the water flowmeter installed upstream of the network.
On the other hand, the second plot was irrigated on demand using the data feed from three IoT soil moisture tensiometers developed by CIHEAMs Bari digital agriculture lab [33]. They measure the soil moisture and plot it on a cloud service platform (ThingSpeak™). ThingSpeak is a cloud-based IoT analytics platform service that enables the aggregation, visualization, and analysis of real-time data streams [56]. It was integrated into the IoT prototypes to visualize the data by linking a designated channel as a client using its identification number (ID) to receive strings from the devices (IoT tensiometers) identified by their internet protocol (Ips).
The three IoT prototypes were placed diagonally in rows no. 2, 5, and 8 at 15 cm depth (Figure 1). This depth was identified according to [57], as the ceramic cup was placed at half of the expected root zone during the season. In each measuring point, another conventional tensiometer with a mechanical manometer (JET FILL 2725) was added alongside the IoT one at the same depth (Figure 2). This was carried out to validate the developed IoT prototype and ensure its reliability.
Irrigation was managed according to the soil water potential in the root zoon. The comfortable range thresholds for the Romaine lettuce were investigated in previous studies. Michael and Barry [58] recommended −15 to −25 kPa in the establish phase and −25 to −35 kPa in the post-establish phase. Within the same range, Dessureault-Rompré, et al. [59] stated that −20 to −30 kPa is the ideal range. In this study, the threshold for initiating an irrigation event was set to −25 kPa, and the threshold to consider the field well irrigated was set to −15 kPa. This range was chosen based on literature and previous experience with soil water retention curves. The feed from the three tensiometers was received daily through the ThingSpeak platform. Once any of the three tensiometer readings exceeded −25 kPa, an irrigation event was triggered. The objective is to return that tensiometer within the comfortable zone. As the feedback from the tensiometers is not instant, continuous monitoring (each two hours) of the readings of the tensiometers was required in the initial events to ensure the return to the comfortable zone. During the irrigation season, the relationship between the amount of water needed and the tensiometer reading above the triggering threshold (−25 kPa) could be established, as shown in Table 2. All amounts of water supplied to the plot were recorded using the water flowmeter installed upstream of the network.

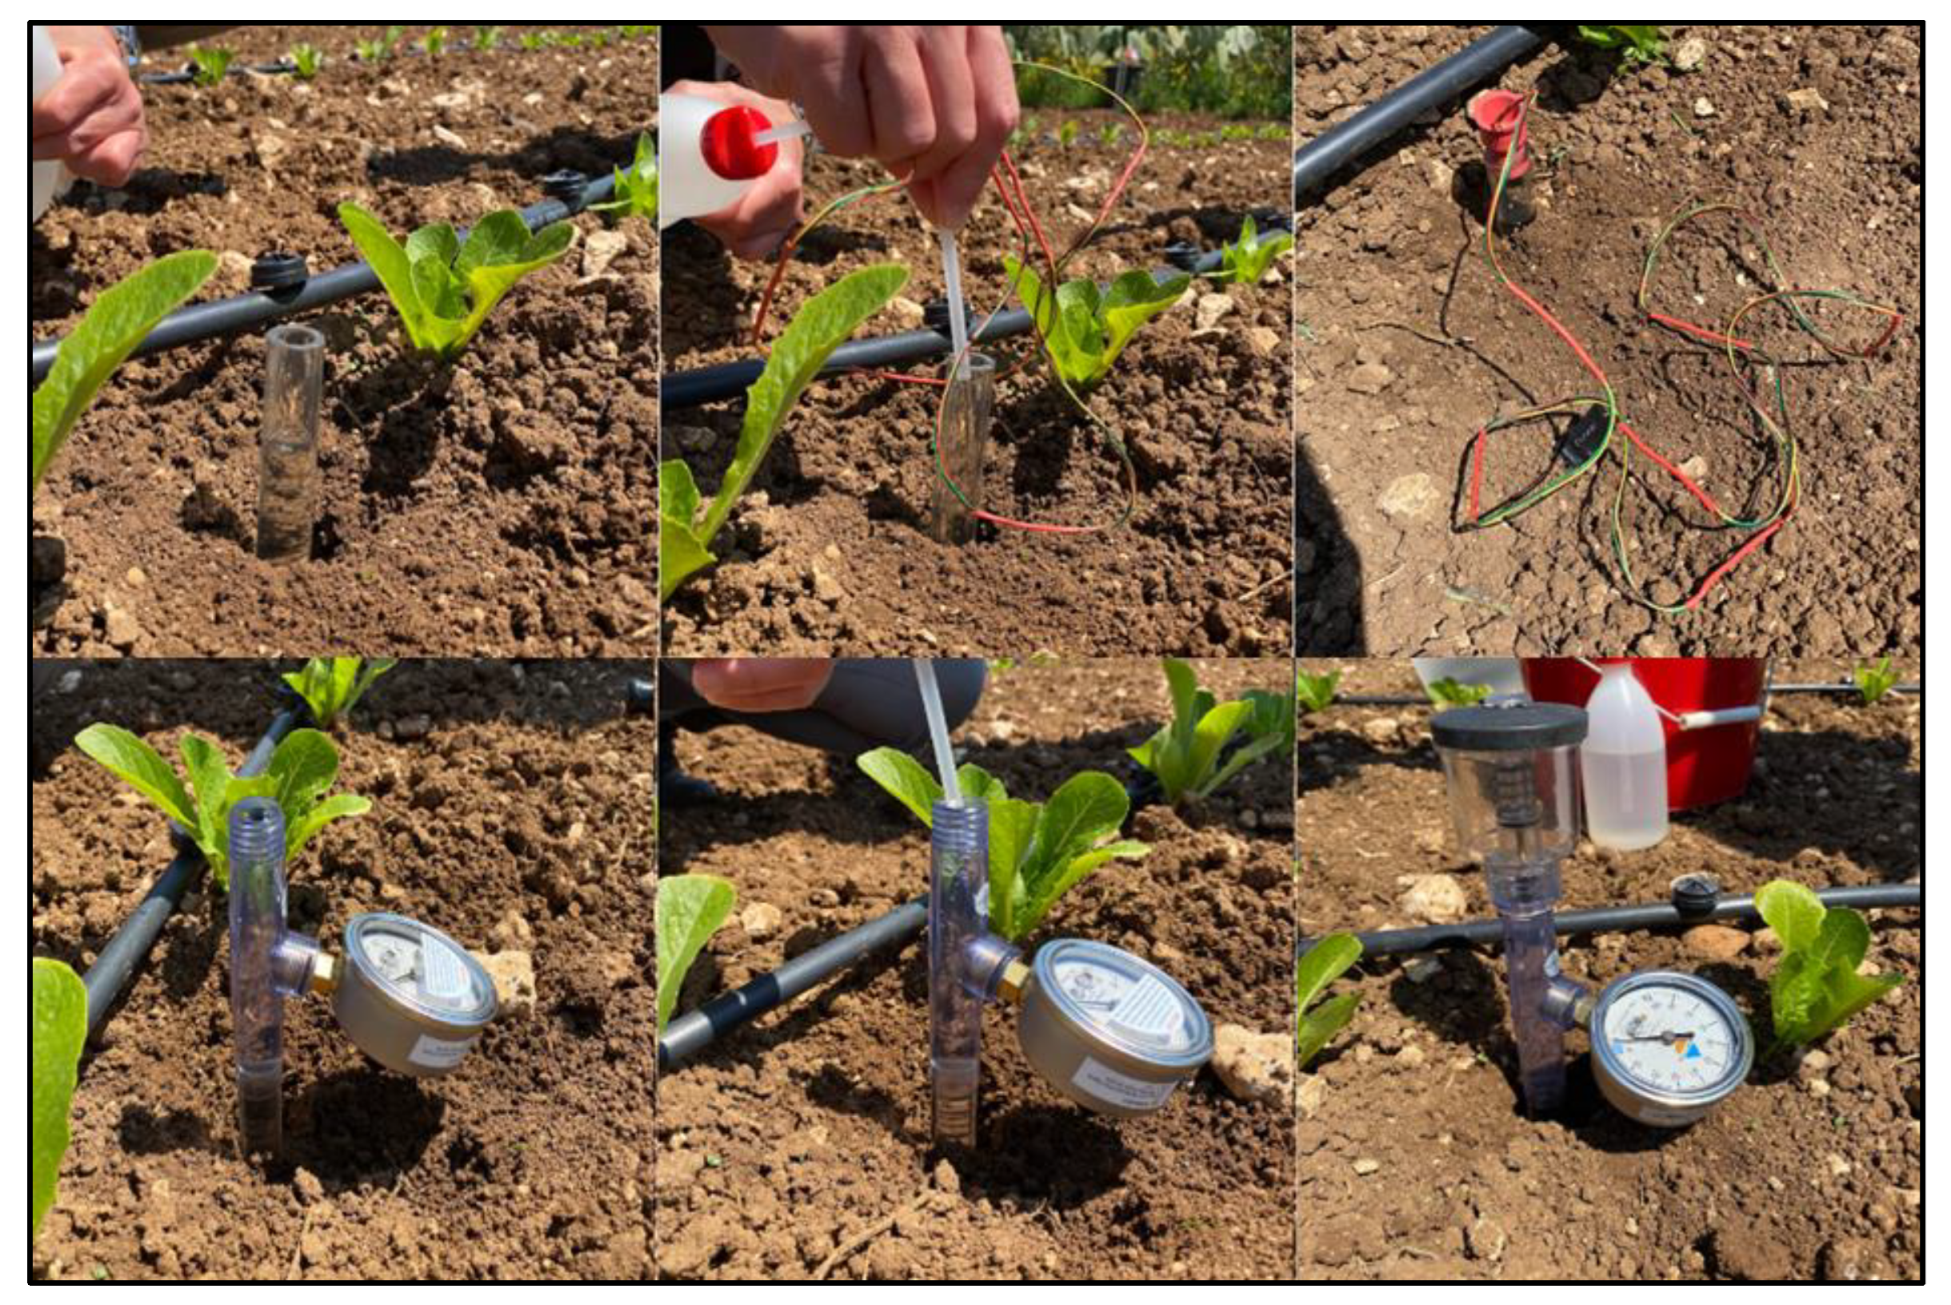
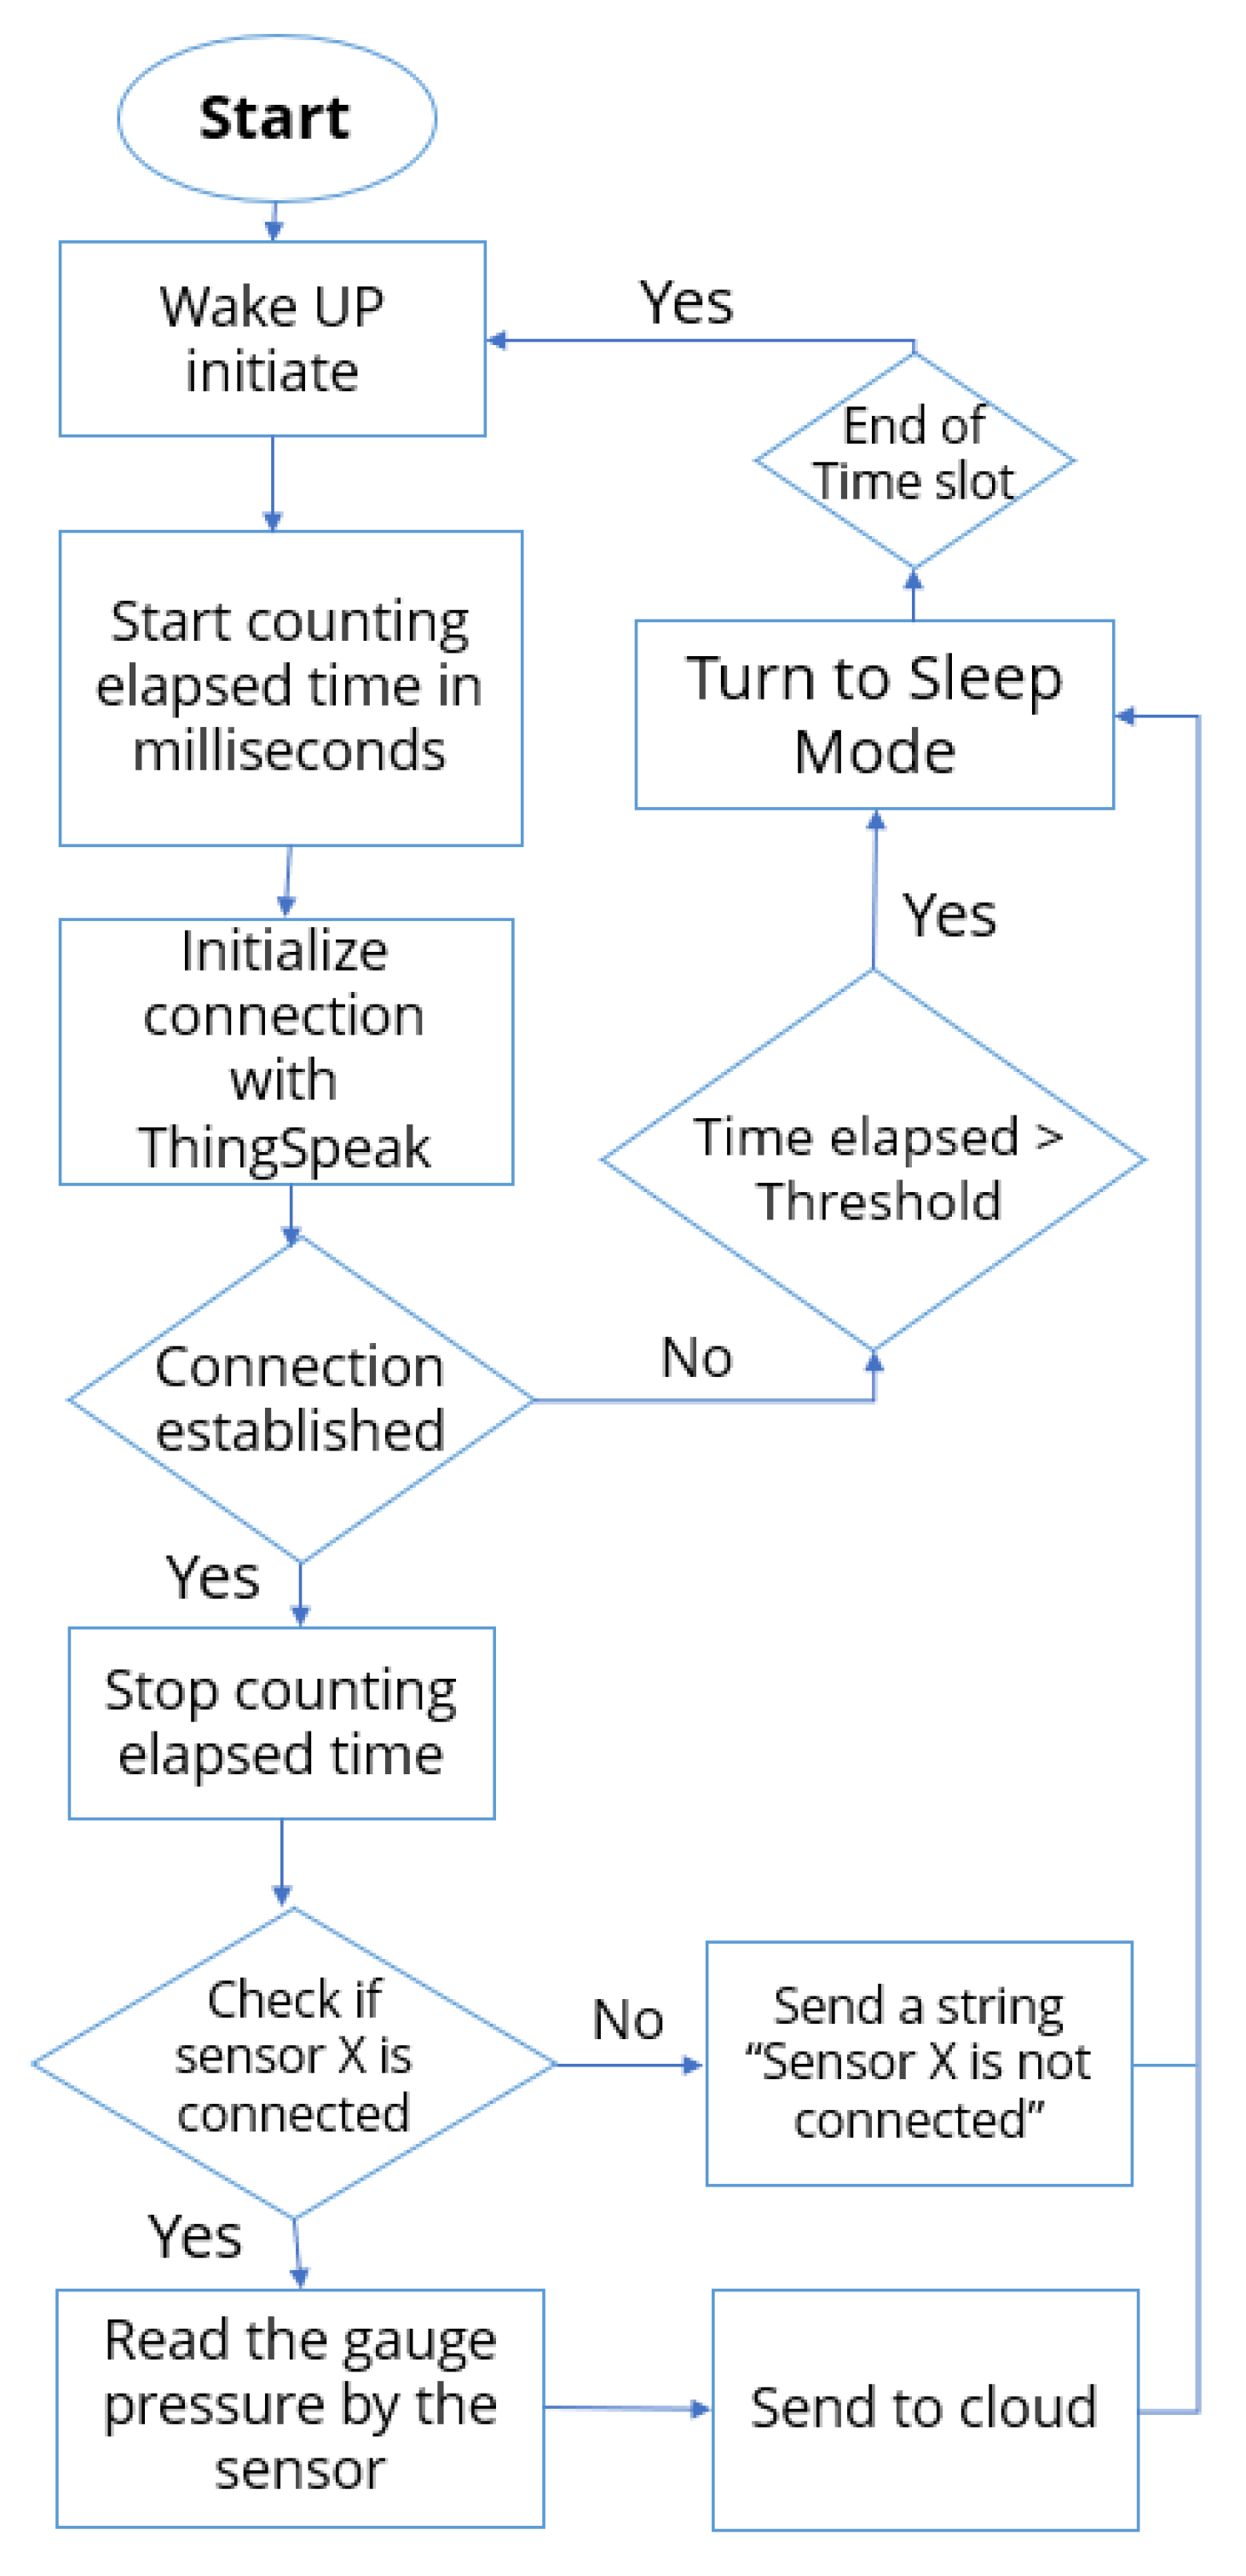
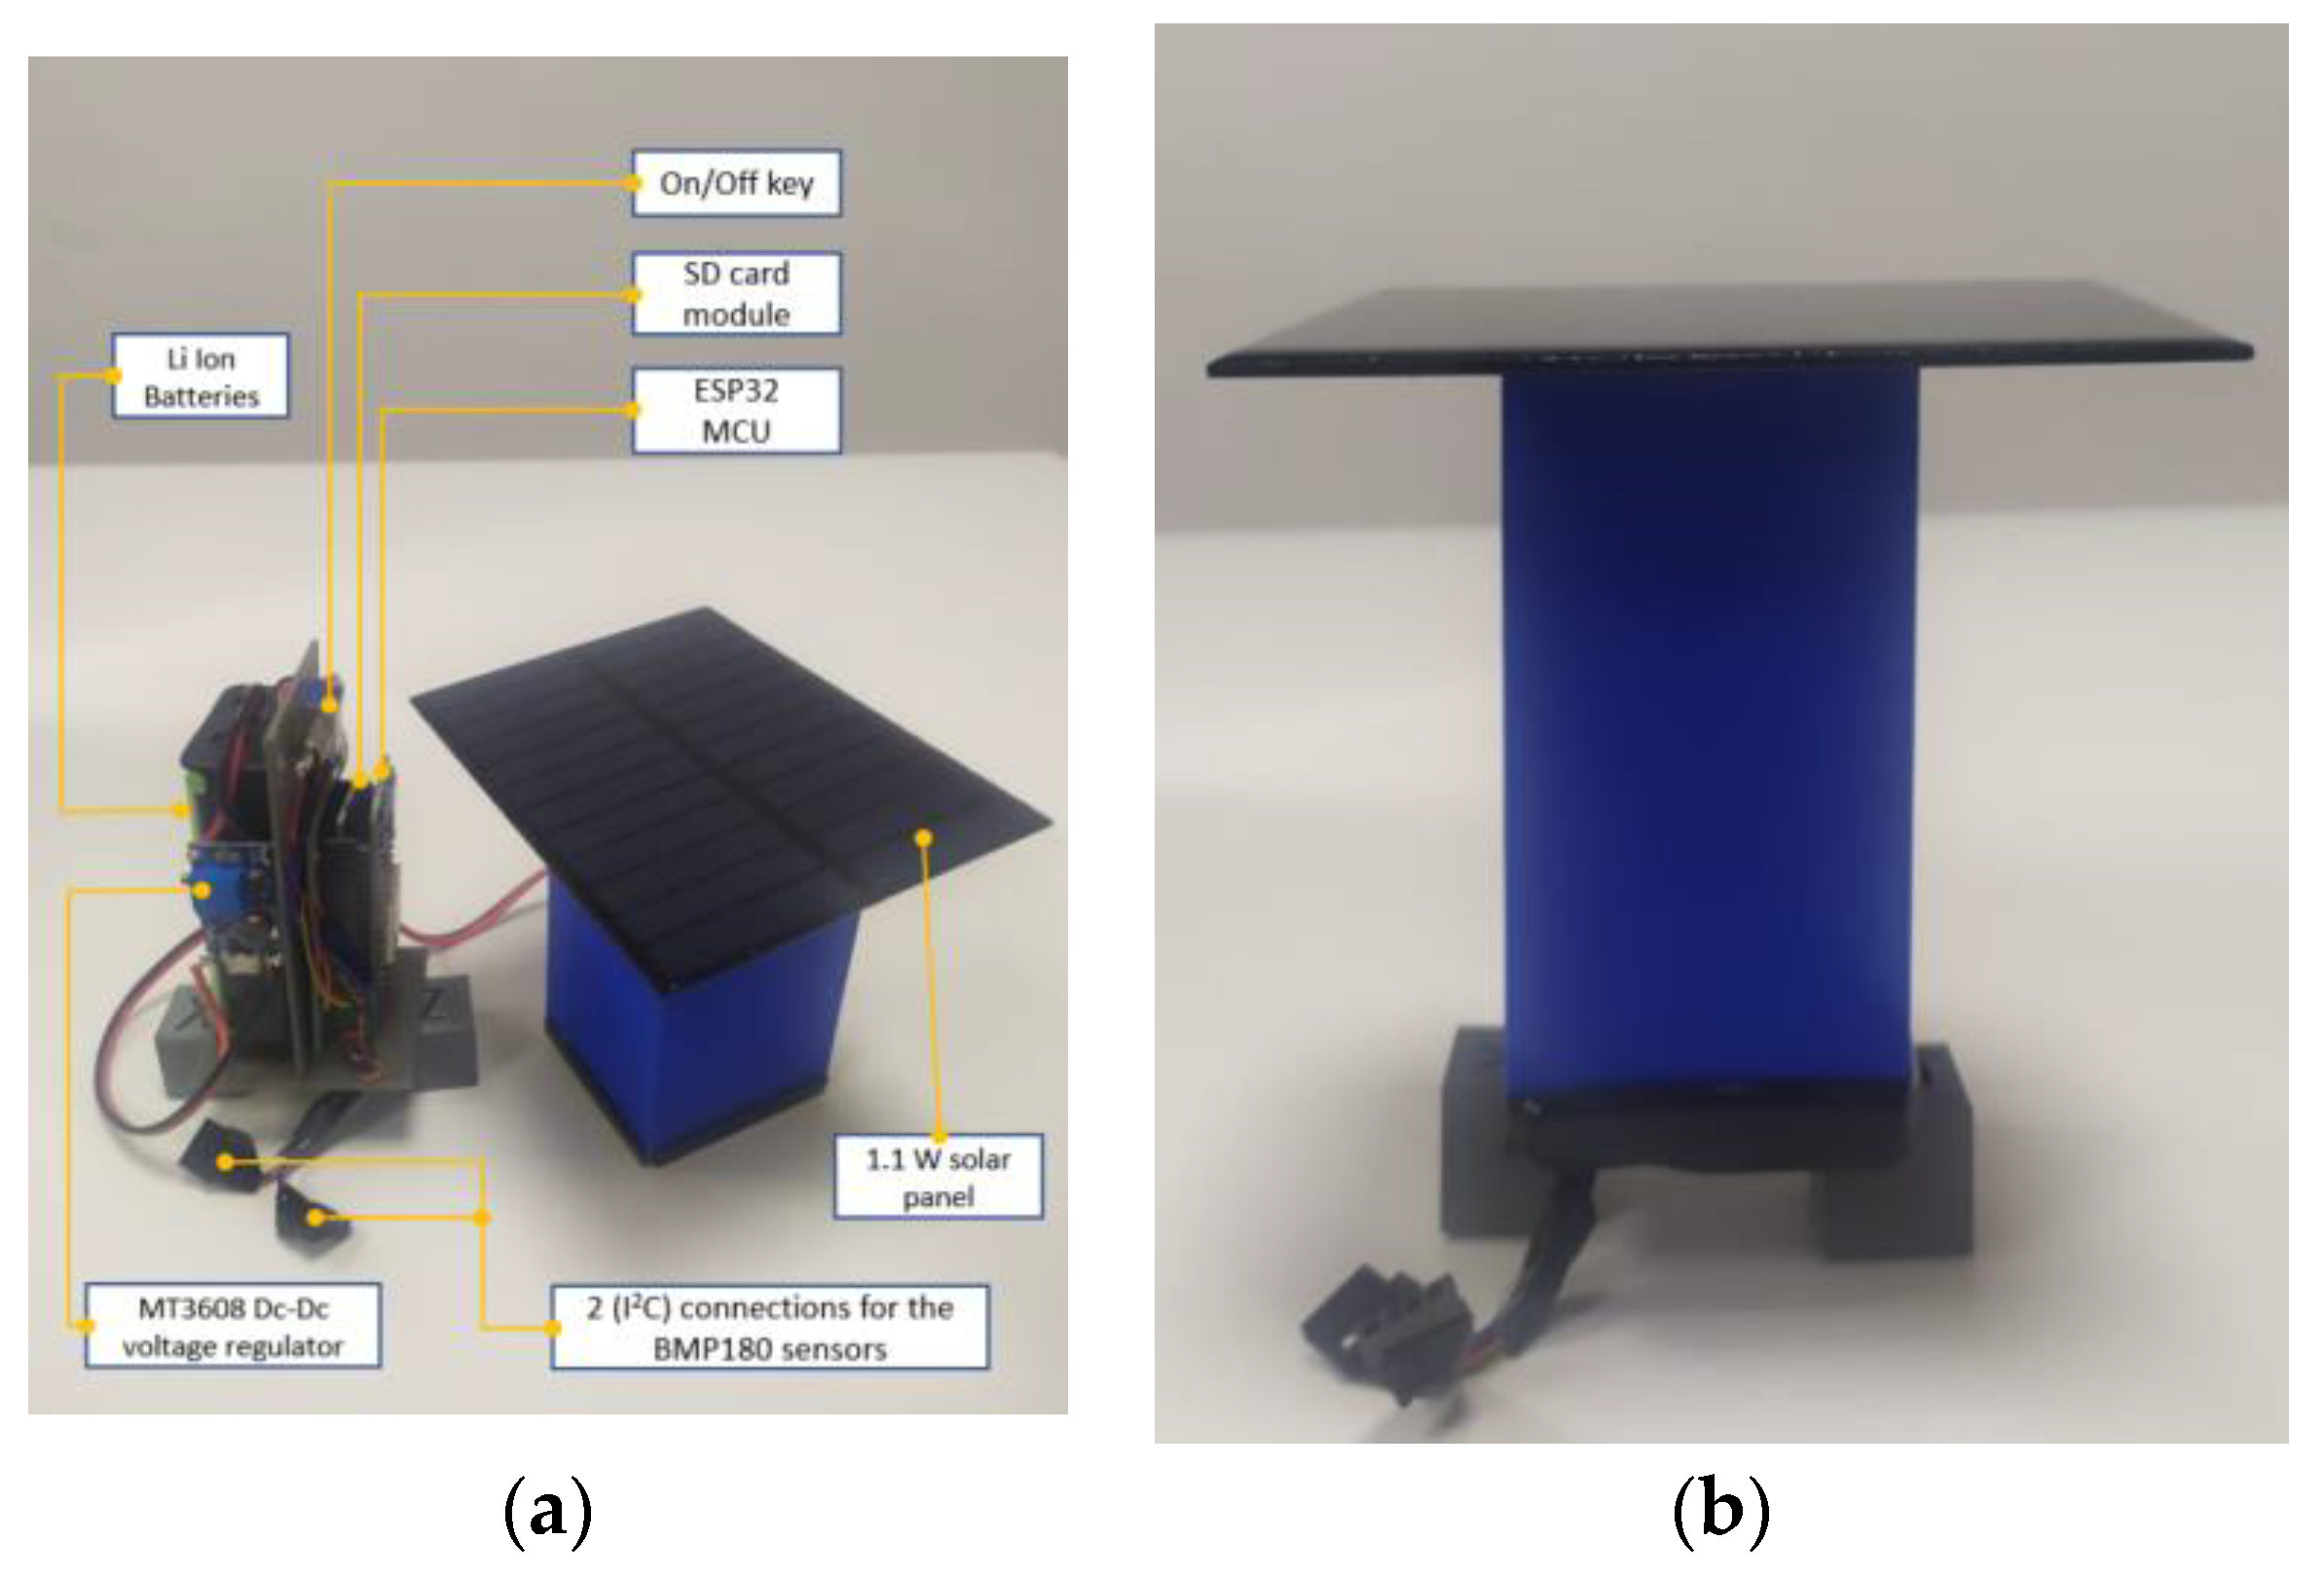
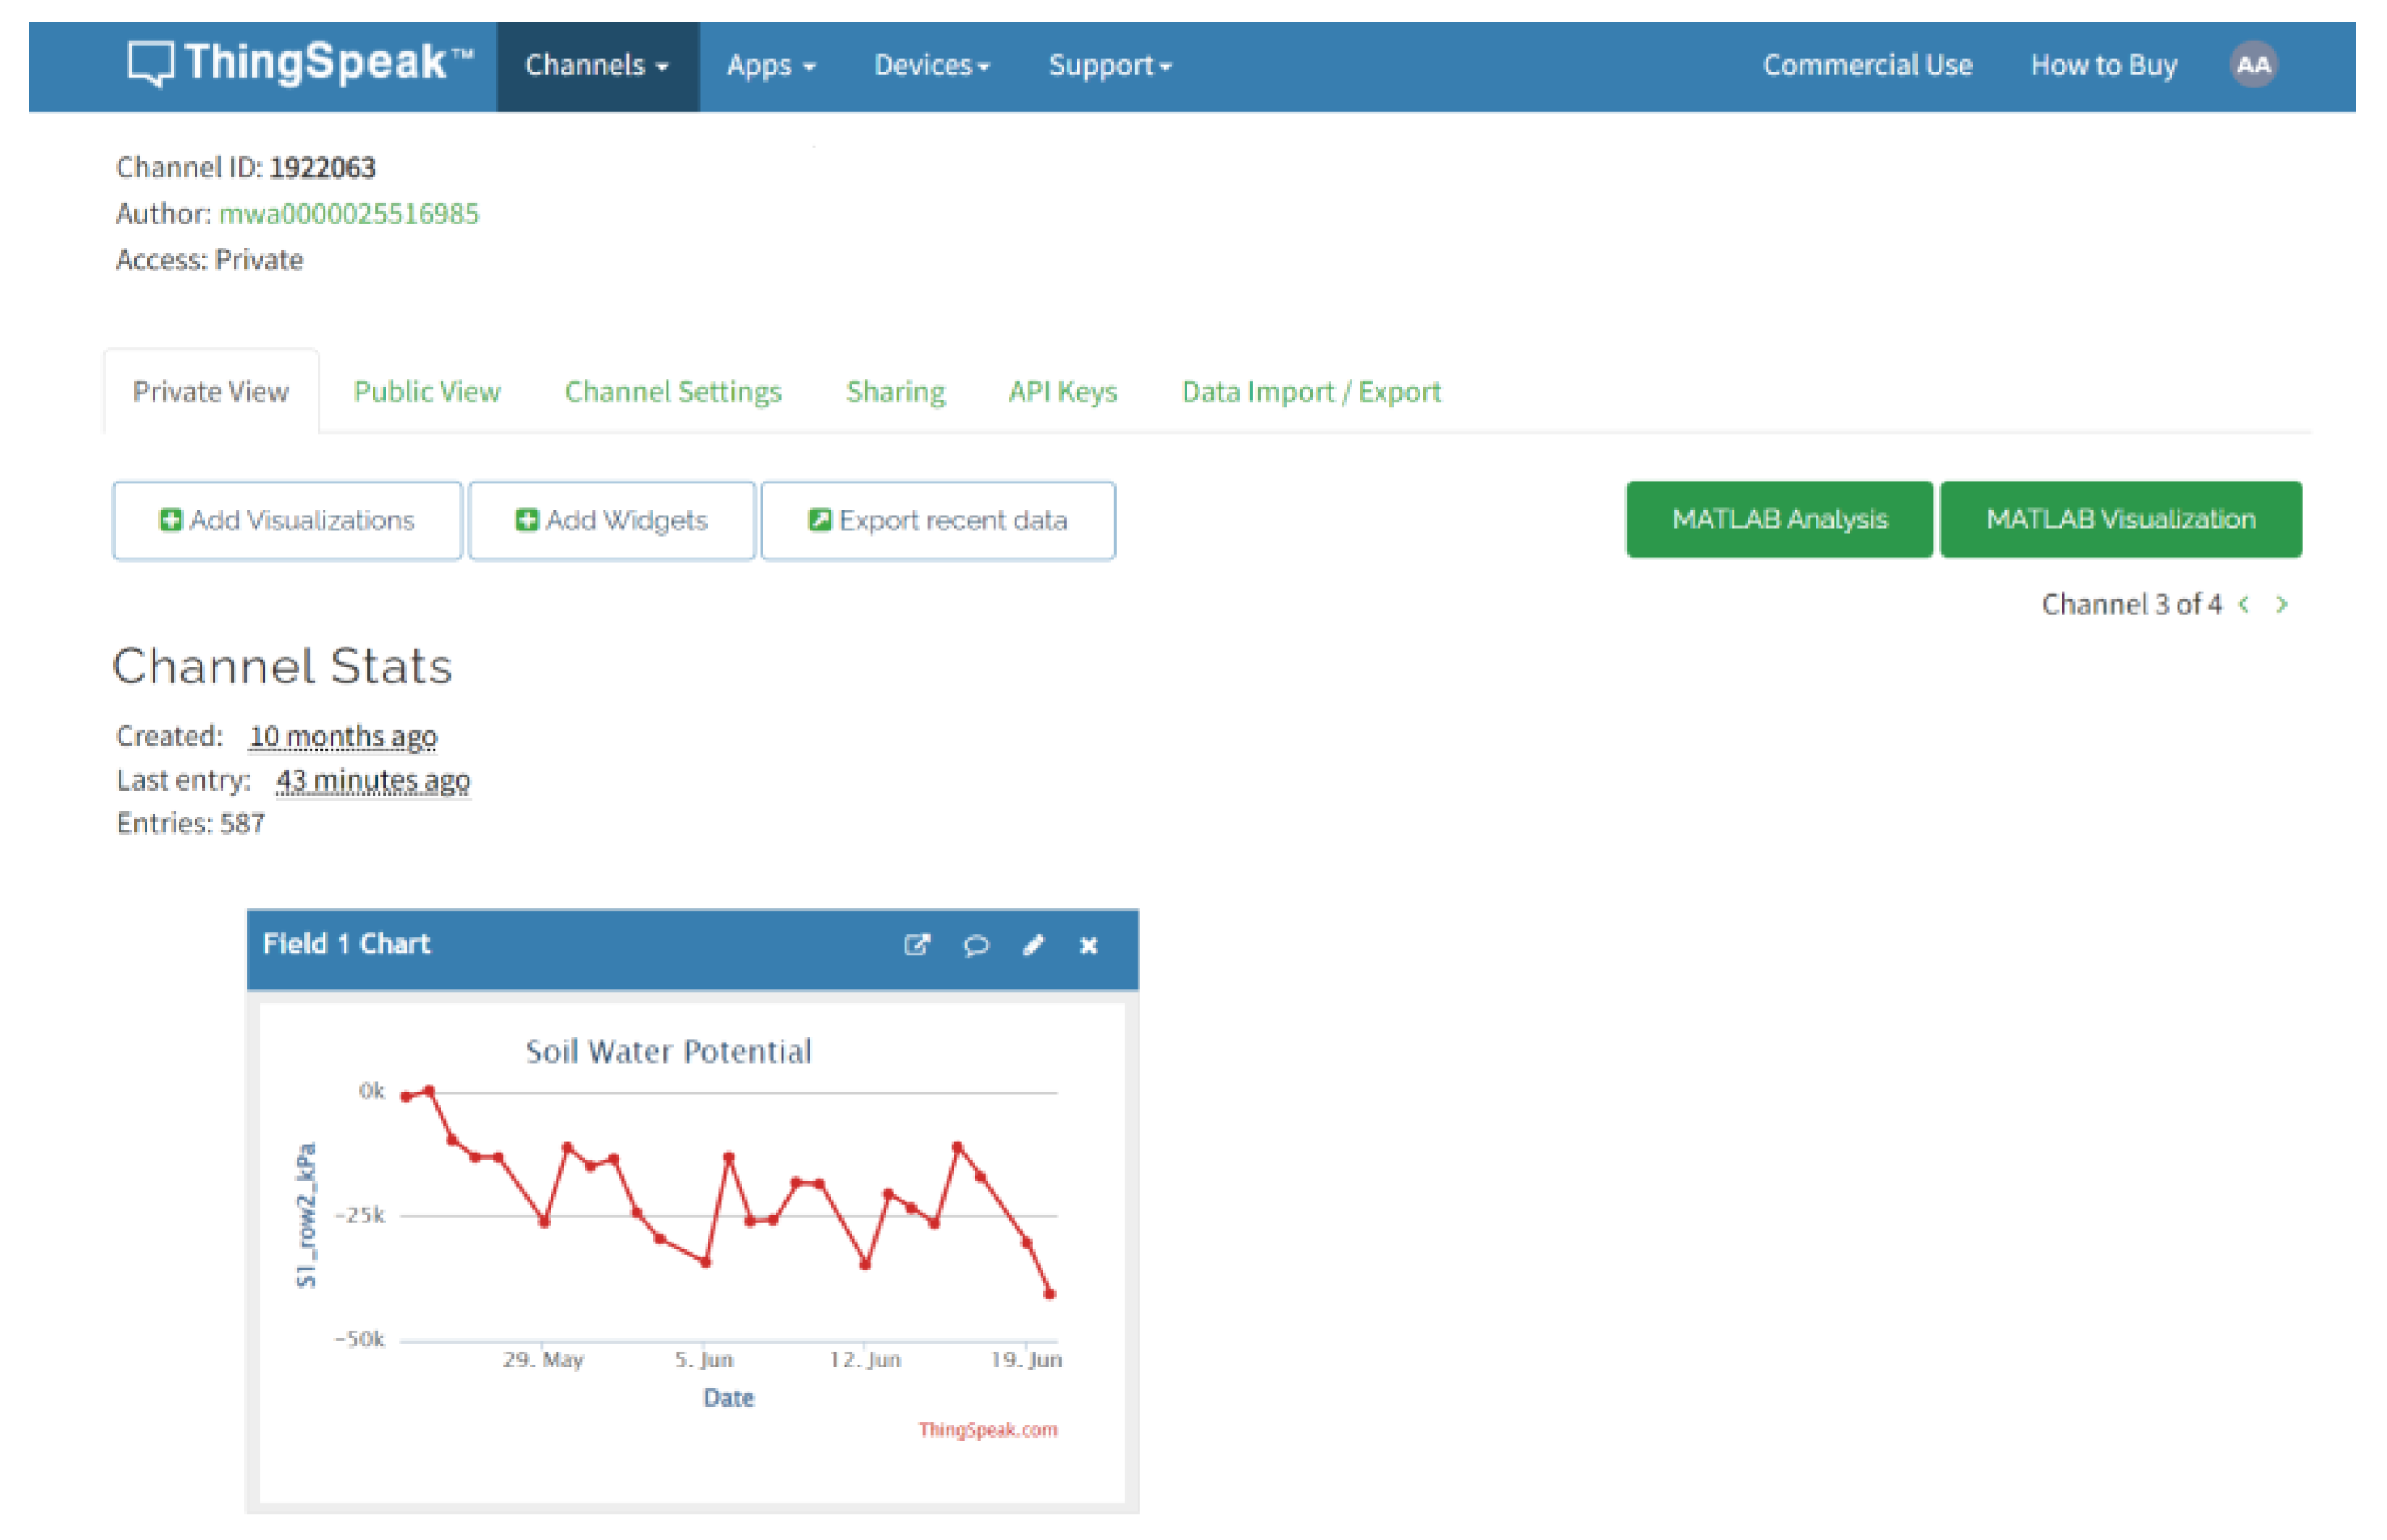
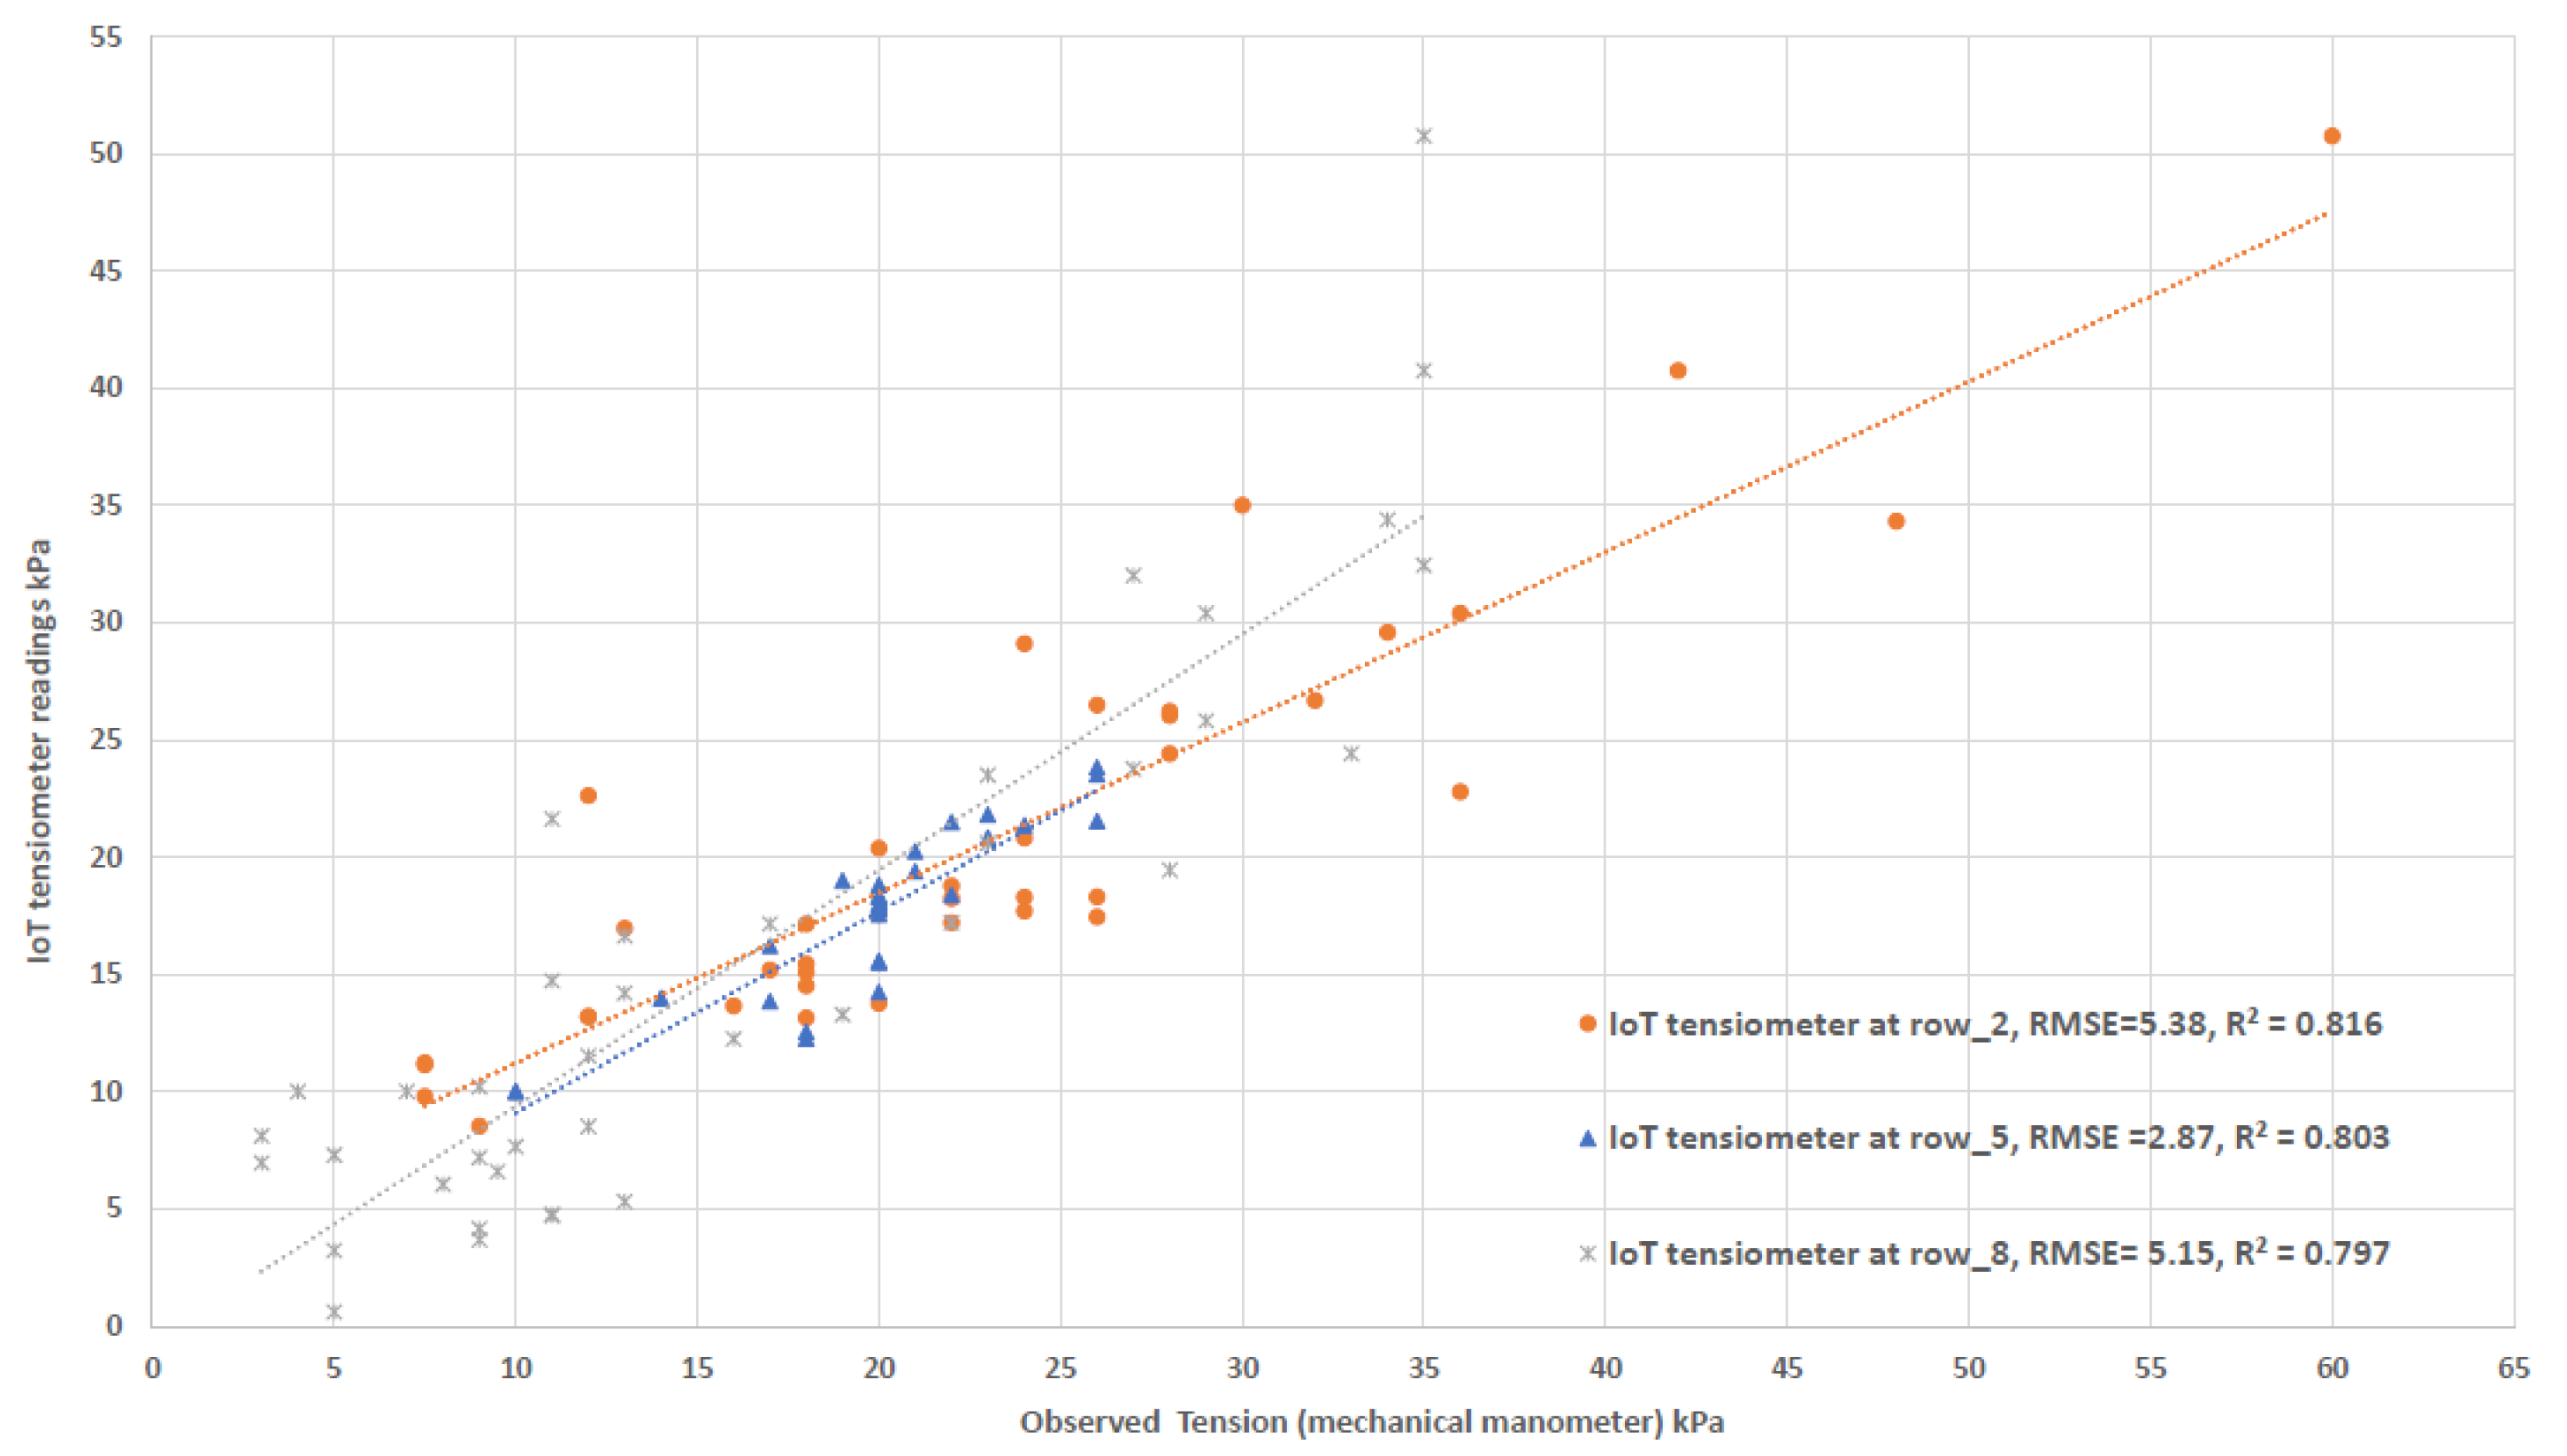
2.3. Design and Development of the IoT Soil Moisture Tensiometer Prototype
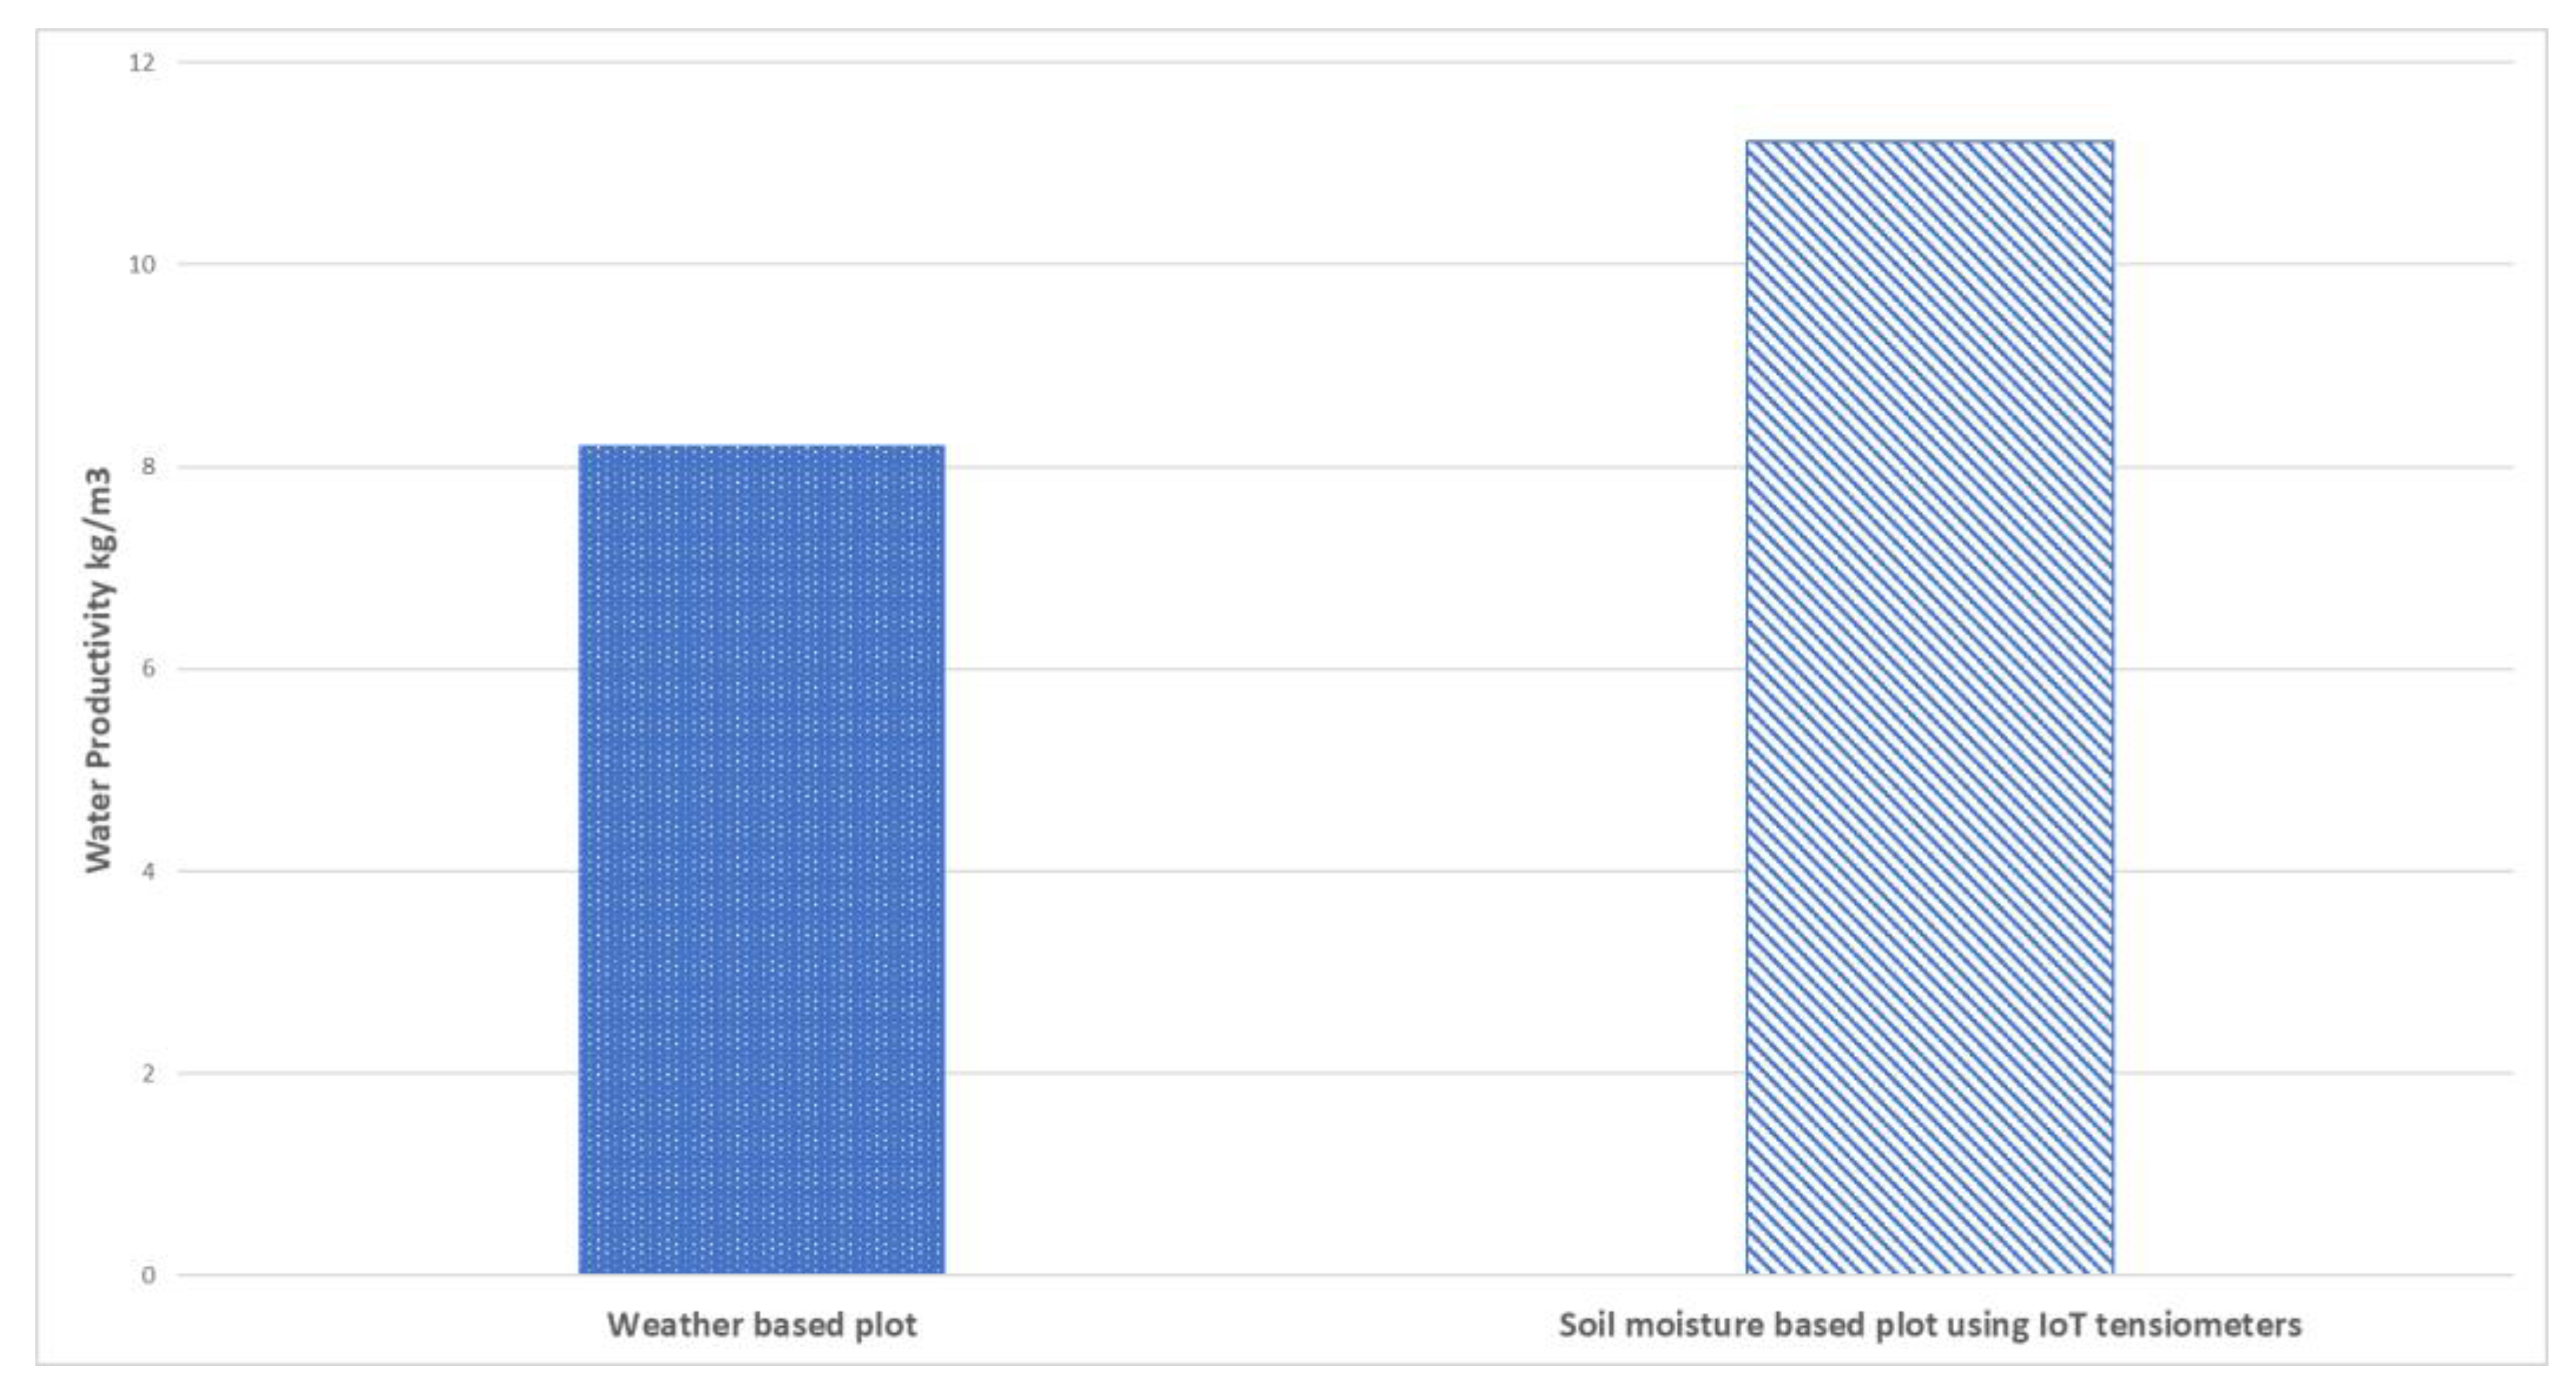
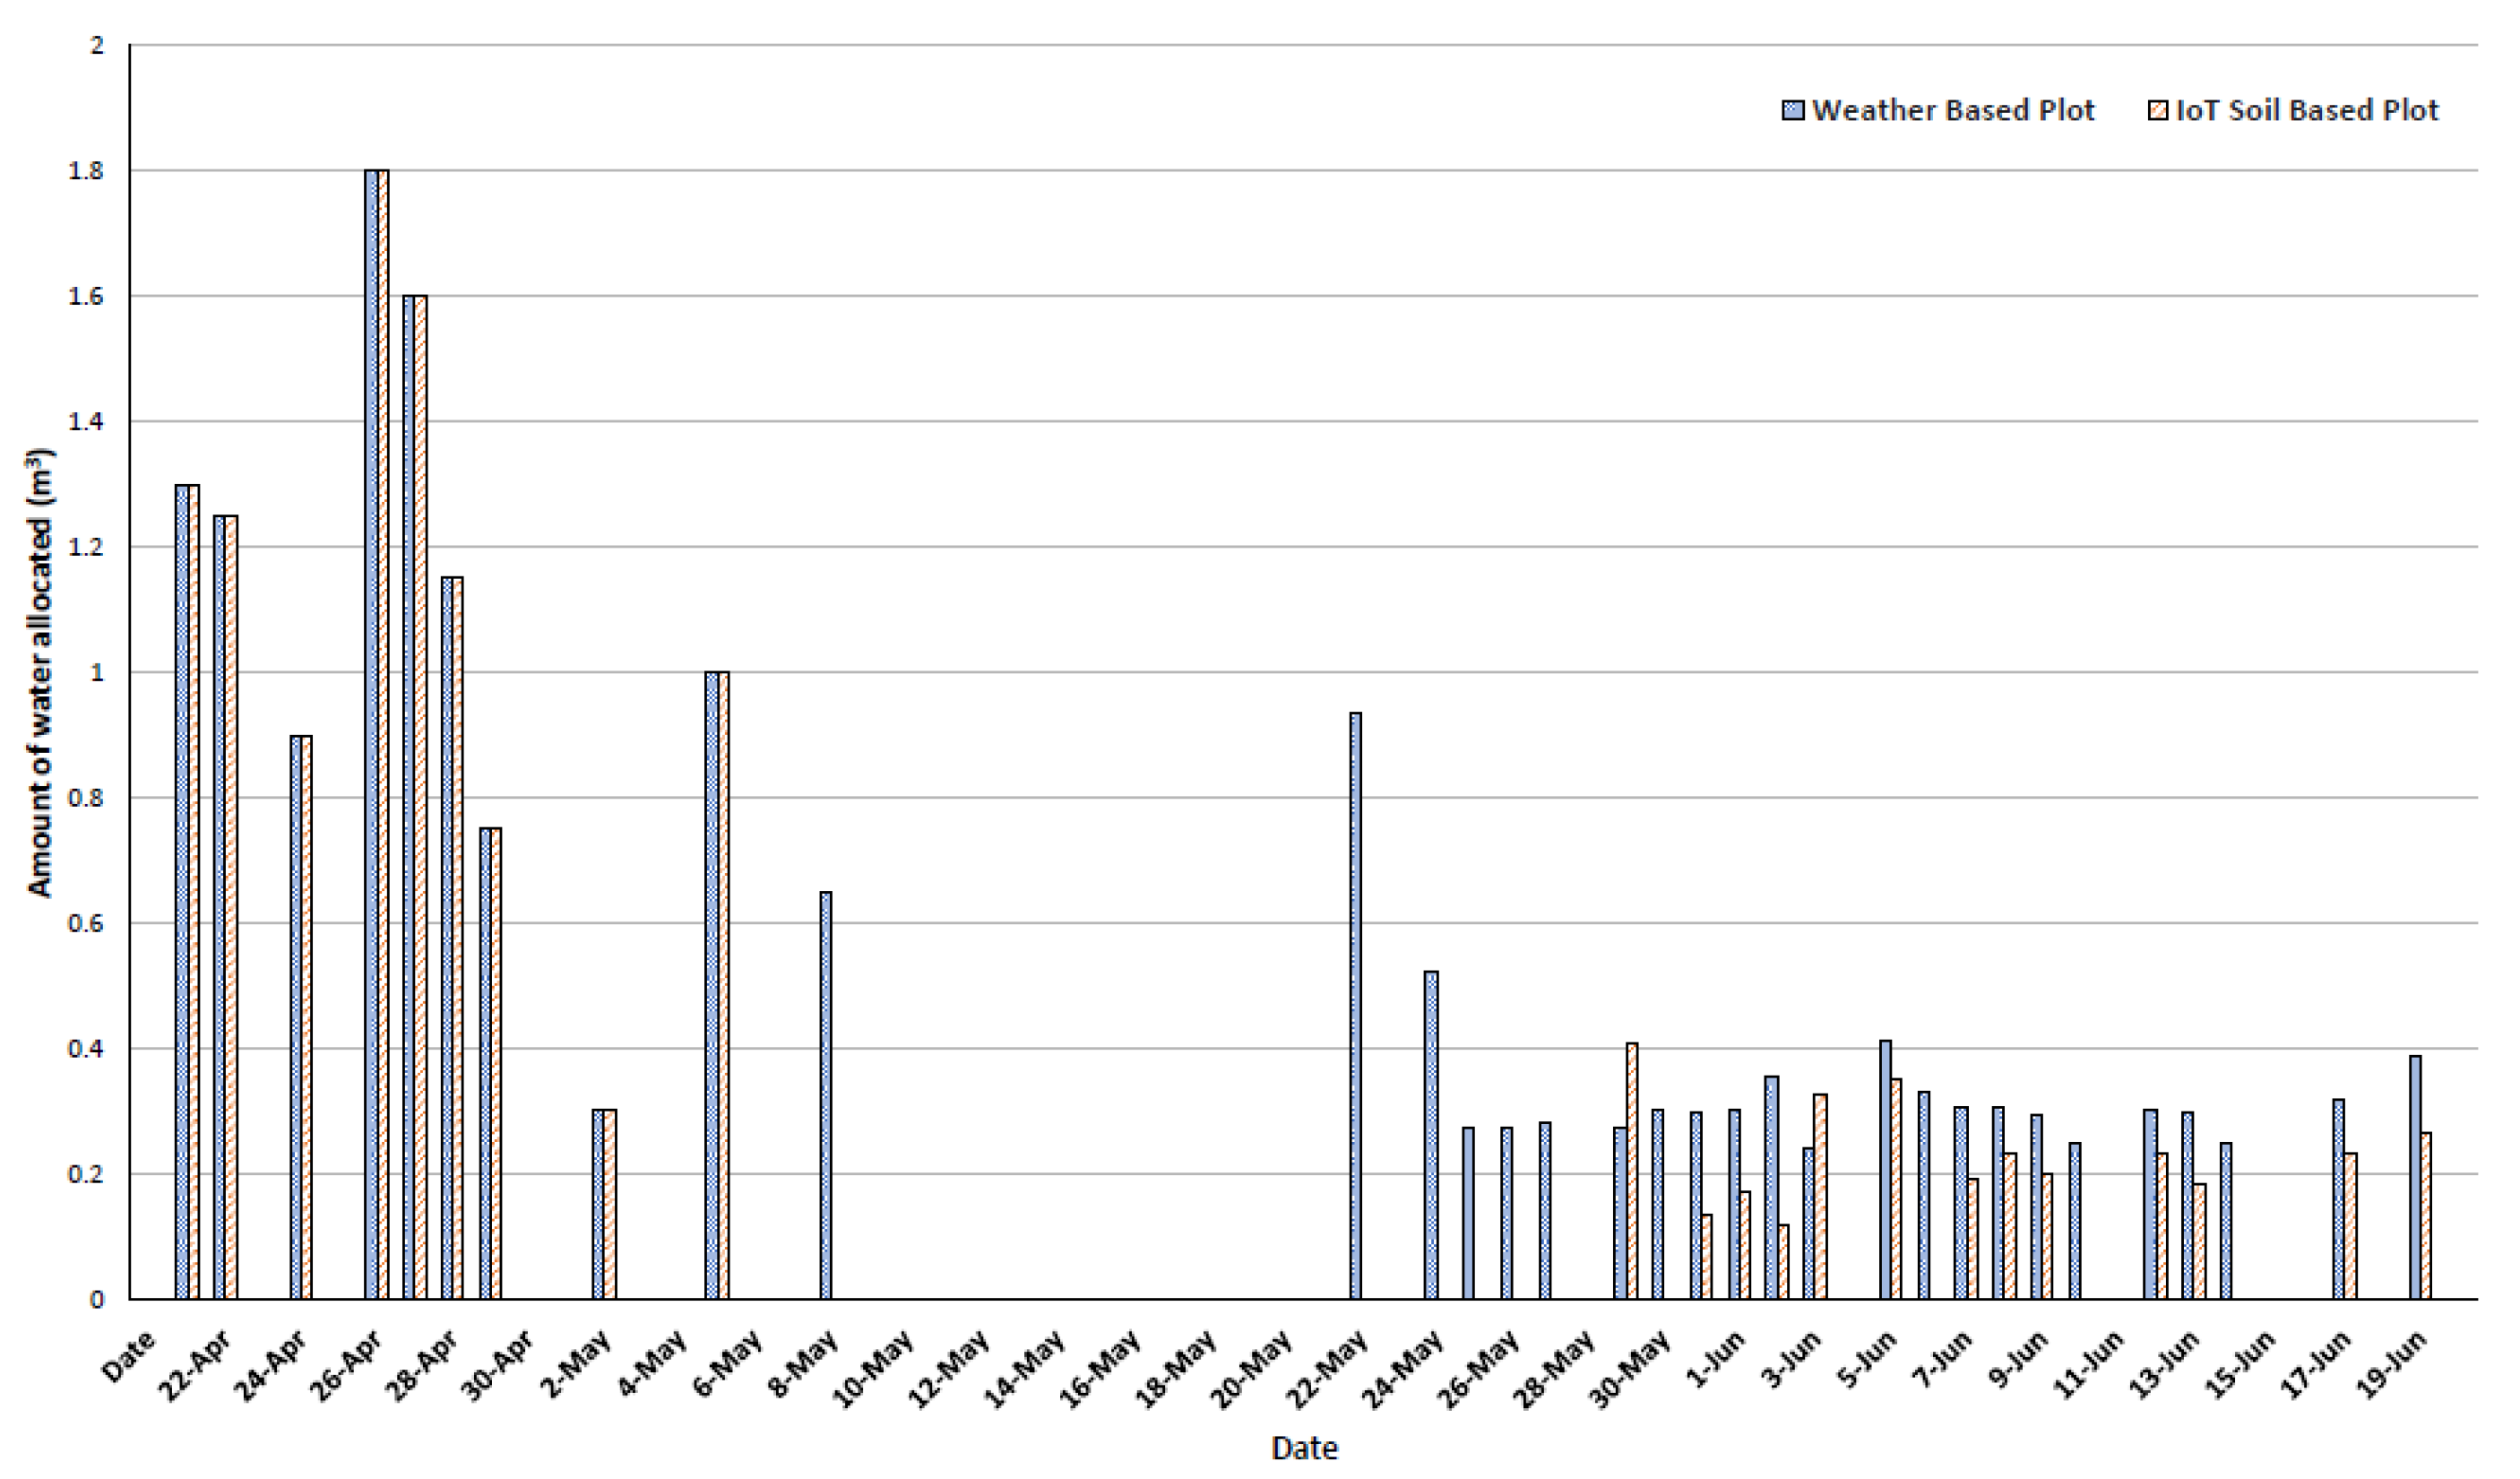
The IoT-tensiometer integrates an isolated BMP180 barometric pressure sensor positioned near the top of the tensiometer tube, just beneath the closing cap. This sensor is linked to an ESP32 microcontroller through four slender wires (measuring 0.55 mm in diameter) utilizing an Inter-Integrated Circuit interface (I2C). The BMP180 operates on a logic voltage of 3.3 V and boosts the capability to detect barometric pressure up to 110 kPa with exceptional precision (2 Pa), making it well-suited for discerning even slight fluctuations in the tensiometer’s vacuum. Serving as the prototype’s central processing unit is the ESP32-WROOM MCU, a cost-effective and potent microcontroller module featuring integrated WiFi and dual-mode Bluetooth capabilities. The detailed blueprints and description of the prototype can be found in [33].
In this study, the ESP32s deep sleep functionality was exploited to conserve power and ensure the prototype’s self-sufficient operation. Figure 3 shows the algorithm flowchart. It works as follows: The ESP32 rouses itself every six hours (referred to as the “time slot” in the flowchart) to gauge the tension within the tensiometer’s vacuum via the BMP180 sensors, then it transmits three data points to the ThingSpeak cloud service and reverts back to sleep mode.
If the MCU is unable to locate an accessible network within 30 s (as denoted by the “threshold” on the flowchart), it returns to sleep mode. Similarly, if the MCU manages to establish a connection but is unable to detect the sensors, it subsequently returns to sleep mode, awaiting the next designated time slot. Figure 3 provides a visual representation of the code algorithm, scripted in the C++ language within the Arduino IDE environment.
The prototype is powered by two 3.7 V Li-Ion batteries connected in series, providing a combined voltage of 7.4 V. These batteries are recharged using a 1.1 W solar panel through an MT3608 DC-DC voltage regulator, which stabilizes the incoming charging voltage from the panels to 9 V. The MT3608 is a compact, cost-effective step-up booster converter module designed to elevate voltage from as low as 2 V up to a maximum of 28 V DC.
All components have been affixed to a designed platform and printed using Polyethylene Terephthalate Glycol material (PTEG). The design prioritized durability under outdoor conditions by minimizing openings or holes. The mounted electronic components are enclosed within an elongated sleeve-like box with two securely fitted side ducts (like a drawer), with the solar panel positioned on top as depicted in Figure 4.

3. Results

The data feed from the three IoT prototyped tensiometers was compared to the readings of the mechanical tensiometers with a daily step along the season. Figure 5 shows the format of the data received on the ThingSpeak platform on a daily basis. The tool allowed for online and continuous soil water potential visualization and tracking, was easily accessed through personal devices, and could be downloaded as a .CSV file if needed.
The deep sleep feature enabled the prototype to achieve a high degree of autonomy. It draws (0.8 µA) while in sleep mode and peaks at 50 mA for a duration of 5 s when uploading data. On days with ample sunlight, the solar panel generates a charging current ranging between 100 and 120 milliamperes. Thus, a 2400 mAh Li-ion battery was more than sufficient to supply the prototype on dim, cloudy days or at night during the test period (29 days from the 24th of May to the 21st of June in Valenzano, south Italy, 2023).
The deployed prototypes were able to detect the variation in soil water potential during the reported period. Figure 6 shows a high correlation between the three tested prototypes and their accompanied mechanical manometers, with an average R2 of 0.8 while the root mean square error (RMSE) was insignificant, ranging from = 2.87 to 5.38. As the prototype was previously lab validated using bare soil pots [33], it is interesting to discuss how repeating the validation process in the open field impacted the prototype’s accuracy. Compared to the lab validation, R2 is reduced from 0.99 to 0.8, while the RMSE range increased from 0.7–1.1 Kpa in the lab to 2.87–5.38 Kpa in the open field. Such results could be interpreted mainly as follows: (i) The medium scale: compared to large-scale open field soil structures, the soil pots (30 × 28 cm) provided a more confined environment, thus permitting the validation setup to be less prone to vertical and horizontal soil water movement and redistribution; (ii) The plant’s effective root zone: unlike bare soil pots, the plant’s roots (in this case Lettuce) were introduced in this validation setup. Despite considering the tensiometer placement to be as close as possible to the transplants (10–15 cm), it is not feasible to predict the effective root zone development and its impact on the prototype accuracy, yet it is an inevitable consequence.
In terms of water productivity, fresh and dry yield were both weighed, while the amount of water allocated was registered using mechanical flowmeters. The fresh yield was almost the same: 149.7 kg in the weather-based plot and 146.9 kg in the soil-based one. On the other hand, the total amount of water allocated to the plots was 18.218 m3 and 13.103 m3 in the weather-based and soil-based plots, respectively, registering a reduction of 28%. Thus, the water productivity was higher by 36.44%, as shown in Figure 7.
Another result worth mentioning is the frequency of irrigation events. Figure 8 shows a comparison between the applied irrigation schedules. In the initial stage, both approaches were almost the same in terms of timing and quantity. However, after the initial stage (first week), the IoT soil-based plot maintained a soil water potential between −15 and −25 kPa, reducing the number of mandated irrigation events and spacing them apart. On the other hand, the gross irrigation requirements based on the simulated evapotranspiration from the adjacent weather station necessitated more irrigation events to meet the consumptive use. Overall, the weather-based plot required 32 irrigation events with a total of 26.7 irrigation hours. While the soil-based plot required only 22 irrigation events with 21.4 irrigation hours, a 28% reduction in the amount of water allocated. Although energy consumption was not measured in this study, the irrigation time implies that potential energy savings could be achieved.
One of the main advantages of the introduced prototype is its low cost, which does not only consider the initial cost of its components (82.20$) shown in Table 3 and compared to the readily available commercial versions (2023), whose costs range between 117 USD (Embsys Technologies Private Limited, Soil moisture tensiometer, Guindy, Chennai, Tamil Nadu, India) and 481 USD (METER, TEROS 32 Soil moisture tensiometer, 2365 NE Hopkins Ct. Pullamn, WA 99163, The United States of America). An important consideration instead is the subscription fee requested by the service provider to access data through the service provider platform. Open source DIY prototypes—such as the one in hand—facilitate access to low-cost innovative solutions while overcoming the burden of data handling fees and service providers’ ownership over data.

4. Conclusions

Progress in electronic technologies has granted researchers affordable access to solid-state sensors and programmable microcontroller-based circuits. Coupled with 3D printing potentials, prototyping for automating data collection has become much more feasible.
In this study, an easy-to-assemble, cost-effective, energy-autonomous prototype of an IoT tensiometer was field-validated. The IoT tensiometer proved to be reliable and was able to track the variation in the soil water potential with an average R2 = 0.8 and RMSE ranging from 4.25 to 7.1. It was then used to compare weather-based to soil-based irrigation management under drip-irrigated lettuce cultivation.
In consistency with previous studies, irrigation scheduling based on soil water tension proved potential water savings when compared to a weather-based approach. Water productivity was improved by 36.44% when irrigation was based on the IoT tensiometer prototype, setting a threshold of (−15 to −25 kPa) relative to the FAO 56 weather-based approach [12].
Such a low-cost prototype (82.20$) contributes to an affordable, easy-to-access soil moisture monitoring system, which is an inherent problem when addressing soil moisture-based irrigation management.
It is worth mentioning that the field deployment of the sensors lasted for approximately 2 months, along with the whole cropping season of lettuce. This period served the objective of this study and allowed for soil-based on-farm irrigation management; however, it still remains a short period to test the sensors’ durability and their long-term reliability. For the latter purpose, further investigation is needed, especially to set technical maintenance/replacement, and periodic recalibration requirements. The same applies for assessing the improvements in terms of energy consumption that accompany the irrigation time reduction.

Author Contributions

Conceptualization, A.A.A. and R.K.; methodology, A.A.A.; software, A.A.A. and A.E.; validation, G.D., A.E. and A.A.A.; formal analysis, A.A.A.and A.E.; investigation, G.D.; resources, R.K.; data curation, B.D.; writing—original draft preparation, A.A.A.; writing—review and editing, R.K.; visualization, A.A.A.; supervision, A.A.A.; project administration, R.K.; funding acquisition, R.K. All authors have read and agreed to the published version of the manuscript.

Funding

This research received no external funding.

Institutional Review Board Statement

This study did not require ethical approval.

Informed Consent Statement

This study did not involve humans.

Data Availability Statement

The data presented in this study are available on request from the corresponding author.

Acknowledgments

We extend our deepest gratitude to the dedicated and hardworking field workers who played a crucial role in the conclusion of this research experiment.

Conflicts of Interest

The authors declare no conflicts of interest.

References

  1. Mishra, R.K. Fresh water availability and its global challenge. Br. J. Multidiscip. Adv. Stud. 2023, 4, 1–78. [Google Scholar] [CrossRef]
  2. Fouial, A.; Khadra, R.; Daccache, A.; Lamaddalena, N. Modelling the impact of climate change on pressurised irrigation distribution systems: Use of a new tool for adaptation strategy implementation. Biosyst. Eng. 2016, 150, 182–190. [Google Scholar] [CrossRef]
  3. FAO. Water for Sustainable Food and Agriculture a Report Produced for the G20 Presidency of Germany; FAO: Rome, Italy, 2017. [Google Scholar]
  4. Hardie, M. Review of novel and emerging proximal soil moisture sensors for use in agriculture. Sensors 2020, 20, 6934. [Google Scholar] [CrossRef] [PubMed]
  5. Anjum, M.N.; Cheema, M.J.M.; Hussain, F.; Wu, R.-S. Precision irrigation: Challenges and opportunities. Precis. Agric. 2023, 85–101. [Google Scholar] [CrossRef]
  6. Wu, H.; Zhang, L.; Lv, J.; Zhang, Y.; Zhang, Y.; Yu, N. Optimization of irrigation and N fertilization management profoundly increases soil N retention potential in a greenhouse tomato production agroecosystem of Northeast China. Agric. Ecosyst. Environ. 2022, 340, 108185. [Google Scholar] [CrossRef]
  7. Khadra, R.; Sagardoy, J.A.; Taha, S.; Lamaddalena, N. Participatory irrigation management and transfer: Setting the guiding principles for a sustaining monitoring & evaluation system–a focus on the mediterranean. Water Resour. Manag. 2017, 31, 4227–4238. [Google Scholar]
  8. Abdelmoneim, A.A.; Daccache, A.; Khadra, R.; Bhanot, M.; Dragonetti, G. Internet of Things (IoT) for double ring infiltrometer automation. Comput. Electron. Agric. 2021, 188, 106324. [Google Scholar] [CrossRef]
  9. Koech, R.; Langat, P. Improving irrigation water use efficiency: A review of advances, challenges and opportunities in the Australian context. Water 2018, 10, 1771. [Google Scholar] [CrossRef]
  10. García-Tejera, O.; López-Bernal, Á.; Orgaz, F.; Testi, L.; Villalobos, F.J. The pitfalls of water potential for irrigation scheduling. Agric. Water Manag. 2021, 243, 106522. [Google Scholar] [CrossRef]
  11. Khadra, R.; Lamaddalena, N.; Inoubli, N. Optimization of on demand pressurized irrigation networks and on-farm constraints. Procedia Environ. Sci. 2013, 19, 942–954. [Google Scholar] [CrossRef]
  12. Allen, R.G.; Pereira, L.S.; Raes, D.; Smith, M. Crop Evapotranspiration-Guidelines for Computing Crop Water Requirements-FAO Irrigation and Drainage Paper 56; FAO: Rome, Italy, 1998; Volume 300, p. D05109. [Google Scholar]
  13. Penman, H.L. Natural evaporation from open water, bare soil and grass. Proc. R. Soc. Lond. Ser. A Math. Phys. Sci. 1948, 193, 120–145. [Google Scholar]
  14. Monteith, J. Evaporation and environment. In GE Fogg Symposium of the Society for Experimental Biology. The State and Movement of Water in Living Organisms; Cambridge University Press: Cambridge, UK, 1965; Volume 19, pp. 205–234. [Google Scholar]
  15. Huffman, R.L.; Fangmeier, D.D.; Elliot, W.J.; Workman, S.R.; Schwab, G. Soil and Water Conservation Engineering; American Society of Agricultural and Biological Engineers: St. Joseph, MI, USA, 2013. [Google Scholar]
  16. Cabelguenne, M.; Debaeke, P.; Puech, J.; Bosc, N. Real time irrigation management using the EPIC-PHASE model and weather forecasts. Agric. Water Manag. 1997, 32, 227–238. [Google Scholar] [CrossRef]
  17. Carr, M. Crop Yield Response to Water; Steduto, P., Hsiao, T.C., Fereres, E., Raes, D., Eds.; FAO Irrigation and Drainage Paper 66; Food and Agriculture Organization of the United Nations: Rome, Italy, 2012; p. 500. ISBN 978-92-5-107274-5. Available online: http://www.fao.org/docrep/016/i2800e/i2800e00.htm (accessed on 15 February 2023).
  18. Piccinni, G.; Ko, J.; Wentz, A.; Leskovar, D.; Marek, T.; Howell, T. Determination of crop coefficients (Kc) for irrigation management of crops. In Proceedings of the 28th Annual International Irrigation Show, San Diego, CA, USA, 9–12 December 2007. [Google Scholar]
  19. Guerra, E.; Ventura, F.; Snyder, R. Crop coefficients: A literature review. J. Irrig. Drain. Eng. 2016, 142, 06015006. [Google Scholar] [CrossRef]
  20. Grattan, S.; Bowers, W.; Dong, A.; Snyder, R.; Carroll, J.; George, W. New crop coefficients estimate water use of vegetables, row crops. Calif. Agric. 1998, 52, 16–21. [Google Scholar] [CrossRef]
  21. Cahn, M.D.; Johnson, L.F. New approaches to irrigation scheduling of vegetables. Horticulturae 2017, 3, 28. [Google Scholar] [CrossRef]
  22. Lea-Cox, J.D. Using wireless sensor networks for precision irrigation scheduling. In Problems, Perspectives and Challenges of Agricultural Water Management; InTech Press: Rijeka, Croatia, 2012; pp. 233–258. [Google Scholar]
  23. Gowing, J.; Ejieji, C. Real-time scheduling of supplemental irrigation for potatoes using a decision model and short-term weather forecasts. Agric. Water Manag. 2001, 47, 137–153. [Google Scholar] [CrossRef]
  24. Wang, D.; Cai, X. Irrigation scheduling—Role of weather forecasting and farmers’ behavior. J. Water Resour. Plan. Manag. 2009, 135, 364–372. [Google Scholar] [CrossRef]
  25. Lorite, I.; Ramírez-Cuesta, J.; Cruz-Blanco, M.; Santos, C. Using weather forecast data for irrigation scheduling under semi-arid conditions. Irrig. Sci. 2015, 33, 411–427. [Google Scholar] [CrossRef]
  26. Mahan, J.R.; Lascano, R.J. Irrigation analysis based on long-term weather data. Agriculture 2016, 6, 42. [Google Scholar] [CrossRef]
  27. Yang, Y.; Cui, Y.; Bai, K.; Luo, T.; Dai, J.; Wang, W.; Luo, Y. Short-term forecasting of daily reference evapotranspiration using the reduced-set Penman-Monteith model and public weather forecasts. Agric. Water Manag. 2019, 211, 70–80. [Google Scholar] [CrossRef]
  28. Yoder, R.; Ley, T.; Elliott, R. Measurement and reporting practices for automatic agricultural weather stations. In Proceedings of the 4th Decennial Symposium, Phoenix, AZ, USA, 14–16 November 2000; pp. 260–265. [Google Scholar]
  29. Delgoda, D.; Saleem, S.K.; Malano, H.; Halgamuge, M.N. Root zone soil moisture prediction models based on system identification: Formulation of the theory and validation using field and AQUACROP data. Agric. Water Manag. 2016, 163, 344–353. [Google Scholar] [CrossRef]
  30. Bianchi, A.; Masseroni, D.; Thalheimer, M.; Medici, L.; Facchi, A. Field irrigation management through soil water potential measurements: A review. Ital. J. Agrometeorol. 2017, 22, 25–38. [Google Scholar]
  31. Yu, L.; Gao, W.; R Shamshiri, R.; Tao, S.; Ren, Y.; Zhang, Y.; Su, G. Review of research progress on soil moisture sensor technology. Int. J. Agric. Biol. Eng. 2021, 14, 32–42. [Google Scholar] [CrossRef]
  32. Kassaye, K.T.; Boulange, J.; Saito, H.; Watanabe, H. Monitoring soil water content for decision supporting in agricultural water management based on critical threshold values adopted for Andosol in the temperate monsoon climate. Agric. Water Manag. 2020, 229, 105930. [Google Scholar] [CrossRef]
  33. Abdelmoneim, A.A.; Khadra, R.; Derardja, B.; Dragonetti, G. Internet of Things (IoT) for Soil Moisture Tensiometer Automation. Micromachines 2023, 14, 263. [Google Scholar] [CrossRef] [PubMed]
  34. Lieth, J.H.; Oki, L.R. Irrigation in soilless production. In Soilless Culture; Elsevier: Amsterdam, The Netherlands, 2019; pp. 381–423. [Google Scholar]
  35. Campbell, G.S. Soil water potential measurement: An overview. Irrig. Sci. 1988, 9, 265–273. [Google Scholar] [CrossRef]
  36. Richards, S. Soil suction measurements with tensiometers. In Methods of Soil Analysis: Part 1 Physical and Mineralogical Properties, Including Statistics of Measurement and Sampling; The American Society of Agronomy: Madison, WI, USA, 1965; Volume 9, pp. 153–163. [Google Scholar]
  37. Freire, A.G.; de Alencar, T.L.; Chaves, A.F.; do Nascimento, Í.V.; de Assis Junior, R.N.; van Lier, Q.d.J.; Mota, J.C.A. Comparison of devices for measuring soil matric potential and effects on soil hydraulic functions and related parameters. Agric. Water Manag. 2018, 209, 134–141. [Google Scholar] [CrossRef]
  38. Thompson, R.; Gallardo, M.; Valdez, L.; Fernández, M. Using plant water status to define threshold values for irrigation management of vegetable crops using soil moisture sensors. Agric. Water Manag. 2007, 88, 147–158. [Google Scholar] [CrossRef]
  39. Dobriyal, P.; Qureshi, A.; Badola, R.; Hussain, S.A. A review of the methods available for estimating soil moisture and its implications for water resource management. J. Hydrol. 2012, 458, 110–117. [Google Scholar] [CrossRef]
  40. Hubbell, J.; Sisson, J. Soil water potential measurement by tensiometers. In The Encyclopedia of Water Science; Marcel Dekker: New York, NY, USA, 2003; pp. 904–907. [Google Scholar]
  41. Shock, C.C.; Wang, F.-X. Soil water tension, a powerful measurement for productivity and stewardship. HortScience 2011, 46, 178–185. [Google Scholar] [CrossRef]
  42. Pardossi, A.; Incrocci, L. Traditional and new approaches to irrigation scheduling in vegetable crops. HortTechnology 2011, 21, 309–313. [Google Scholar] [CrossRef]
  43. Thompson, T.L.; Doerge, T.A.; Godin, R.E. Subsurface drip irrigation and fertigation of broccoli: I. Yield, quality, and nitrogen uptake. Soil Sci. Soc. Am. J. 2002, 66, 186–192. [Google Scholar] [CrossRef]
  44. Smittle, D.A.; Dickens, W.L.; Stansell, J.R. Irrigation regimes affect cabbage water use and yield. J. Am. Soc. Hortic. Sci. 1994, 119, 20–23. [Google Scholar] [CrossRef]
  45. Thompson, T.L.; Doerge, T.A.; Godin, R.E. Nitrogen and water interactions in subsurface drip-irrigated cauliflower II. Agronomic, economic, and environmental outcomes. Soil Sci. Soc. Am. J. 2000, 64, 412–418. [Google Scholar] [CrossRef]
  46. Gallardo, M.; Jackson, L.; Schulbach, K.; Snyder, R.; Thompson, R.; Wyland, L. Production and water use in lettuces under variable water supply. Irrig. Sci. 1996, 16, 125–137. [Google Scholar] [CrossRef]
  47. Thompson, T.L.; Doerge, T.A. Nitrogen and water rates for subsurface trickle-irrigated romaine lettuce. HortScience 1995, 30, 1233–1237. [Google Scholar] [CrossRef]
  48. Kukal, S.; Hira, G.; Sidhu, A. Soil matric potential-based irrigation scheduling to rice (Oryza sativa). Irrig. Sci. 2005, 23, 153–159. [Google Scholar] [CrossRef]
  49. Gendron, L.; Letourneau, G.; Anderson, L.; Sauvageau, G.; Depardieu, C.; Paddock, E.; van den Hout, A.; Levallois, R.; Daugovish, O.; Solis, S.S. Real-time irrigation: Cost-effectiveness and benefits for water use and productivity of strawberries. Sci. Hortic. 2018, 240, 468–477. [Google Scholar] [CrossRef]
  50. Smajstrla, A.G.; Locascio, S.J. Irrigation scheduling of drip-irrigated tomato using tensiometers and pan evaporation. Proc. Fla. State Hortic. Soc. Am. Soc. Agric. Biol. Eng. 1990, 103, 88–91. [Google Scholar]
  51. Munoz-Carpena, R.; Bryan, H.; Klassen, W. Automatic soil moisture-based drip irrigation for improving tomato production. In Proceedings of the Florida State Horticultural Society, Sheraton World Resort, Orlando, FL, USA, 8–10 June 2003; pp. 80–85. [Google Scholar]
  52. Buttaro, D.; Santamaria, P.; Signore, A.; Cantore, V.; Boari, F.; Montesano, F.F.; Parente, A. Irrigation management of greenhouse tomato and cucumber using tensiometer: Effects on yield, quality and water use. Agric. Agric. Sci. Procedia 2015, 4, 440–444. [Google Scholar] [CrossRef]
  53. Yang, J.; Liu, K.; Wang, Z.; Du, Y.; Zhang, J. Water-saving and high-yielding irrigation for lowland rice by controlling limiting values of soil water potential. J. Integr. Plant Biol. 2007, 49, 1445–1454. [Google Scholar] [CrossRef]
  54. Raes, D.; Steduto, P.; Hsiao, T.C.; Fereres, E. AquaCrop—The FAO crop model to simulate yield response to water: II. Main algorithms and software description. Agron. J. 2009, 101, 438–447. [Google Scholar] [CrossRef]
  55. Amirouche, M.; Smadhi, D.; Zella, L. Calibration and validation of the AquaCrop model for the culture lettuce (Lactuca sativa L.) under fertilization levels in pluvial condition. Agric. Water Manag. 2018, 208, 107–119. [Google Scholar] [CrossRef]
  56. Pasha, S. ThingSpeak based sensing and monitoring system for IoT with Matlab Analysis. Int. J. New Technol. Res. 2016, 2, 263492. [Google Scholar]
  57. Peters, R.T.; Desta, K.G.; Nelson, L. Practical Use of Soil Moisture Sensors and Their Data for Irrigation Scheduling; Washington State University Extension: Washington, DC, USA, 2013. [Google Scholar]
  58. Michael, C.; Barry, F. Using Tensiometers for Scheduling Irrigations of Coastal Vegetables; University of California US Cooperative Extension: Los Angeles, CA, USA, 2012. [Google Scholar]
  59. Dessureault-Rompré, J.; Caron, J.; Plamondon, L.; Gaudreau, L.; Jutras, S.; Lafond, J.A. Growth and water-use characteristics of Romaine lettuce cultivated in Histosol as affected by irrigation management, compaction, and seeding type. Can. J. Soil Sci. 2020, 100, 278–288. [Google Scholar] [CrossRef]
Figure 1. Layout of the irrigation network and the experimental field.
Sustainability 16 00306 g001
Figure 2. IoT and mechanical tensiometers as installed in the field.
Sustainability 16 00306 g002
Figure 3. Algorithm Flowchart.
Sustainability 16 00306 g003
Figure 4. The IoT tensiometer prototype: (a) The components; (b) the sealed prototype [33].
Sustainability 16 00306 g004
Figure 5. Data visualization is conducted on a daily basis, as shown on the ThingSpeak platform.
Sustainability 16 00306 g005
Figure 6. Validation of the three prototype sensors as compared to the mechanical manometers.
Sustainability 16 00306 g006
Figure 7. Water productivity as a result of irrigation scheduling based on weather and soil moisture using IoT tensiometers.
Sustainability 16 00306 g007
Figure 8. Applied irrigation schedules in both plots along the season.
Sustainability 16 00306 g008
Table 1. Climate, crop, management, and soil parameters are used to generate the weather-based irrigation schedule.
ParameterReference/Source
ClimateRainfall (mm)Daily data for the past 3 years was provided from the weather station situated close to the field at CIHEAM Bari
Evapotranspiration (mm)
Minimum and Maximum Temperature (°C)
Mean annual CO2 concentration (ppm)MaunaLoa.CO2 file from Aquacrop data base
CropCalendarGrowing period From 21 April to 21 June 2023
Crop Description Display crop parameters: Full set
ModeMode in: Growing Degree Days
Development
  • Initial canopy cover: 2.25%
  • Type of planting method: Transplanting
  • Maximum canopy cover: 60 days after transplant [55]
  • Root deepening: Shallow rooted crop (max 0.30 m)
  • Canopy growth coefficient (CGC): 15%/days
Fertility stress Not considered
Salinity and cold stress
Temperature
  • Base temperature for crop development: 7 °C
  • Upper temperature for crop development: 30 °C [55]
Water
  • Canopy expansion: Moderately tolerant to water stress
  • Upper threshold for canopy expansion: 0.25
  • Lower threshold for canopy expansion: 0.55
  • Shape factor for stress coefficient of
    canopy expansion: 3
  • Stomatal closure: Moderately sensitive to water stress
  • Upper threshold for canopy expansion: 0.50
  • Shape factor for stress coefficient for stomatal closure: 3 [55]
Type
  • Annuals: Leafy vegetable crops
  • Type of photosynthetic pathways: C3 crop
From the FAO irrigation and drainage paper No. 56 “Crop evapotranspiration”
ManagementIrrigation ModeGeneration of irrigation scheduleChosen by user preferences
Irrigation method
  • Drip irrigation
  • Percentage of soil surface wetted: 30%
Time and depth criteria
  • Time criteria: Allowable depletion (20% of RAW)
  • Depth criteria: Back to field capacity
  • Irrigation water quality (Excellent)
FieldNone
SoilSoil profile Characteristic of soil horizons
  • Description: Silt loam (clay 17.25%, silt 59.25%, sand 23.5%)
  • Thickness: 1.20 m
  • TAW: 130 mm/m
  • PWP: 13 vol %
  • FC: 26.0 vol %
  • SAT: 46 vol %
  • Hydraulic conductivity: 150 mm/day
Measured through a soil texture and structure analysis performed in the CIHEAM Bari soil lab
GroundwaterNone
Table 2. Above-threshold tensiometer readings and the relative amount of water required and allocated to set back the reading.
Reading of Soil Water Tension (kPa)Water Amount Allocated (mm)
−26 to −271.76
−27 to −282.64
−28 to −293.52
−29 to −30 4.4
Table 3. Breakdown of the cost of the prototype.
ItemQuantityCost ($)
ESP32 WROOM 110
BMP 180 sensor12.5
MT3608 DC–DC12
Tensiometer plexiglass tube115
Permeable ceramic cup115
2 cm airtight rubber cap13.20
Li-ion batteries 3.7 volts211
BMS 2S 10A charging model14
1.1 W 6 V solar panel114
Miscellaneous (Wires, isolation tape, pins…)115
PTGE filament0.5 kg1.5
Total82.20
Disclaimer/Publisher’s Note: The statements, opinions and data contained in all publications are solely those of the individual author(s) and contributor(s) and not of MDPI and/or the editor(s). MDPI and/or the editor(s) disclaim responsibility for any injury to people or property resulting from any ideas, methods, instructions or products referred to in the content.

