
Analyzing the Environmental, Economic, and Social Sustainability of Prefabricated Components: Modeling and Case Study


Abstract
1. Introduction
2. Literature Review
2.1. Sustainability Assessment Research of Prefabricated Buildings
- (1)
- Life cycle sustainability assessment
- (2)
- The environmental pillar
- (3)
- The economic pillar
- (4)
- The social pillar
- (5)
- Integration studies
2.2. Sustainability Assessment Research of Prefabricated Components
- (1)
- The environmental pillar
- (2)
- The economic pillar
- (3)
- The social pillar
- (4)
- Integration studies
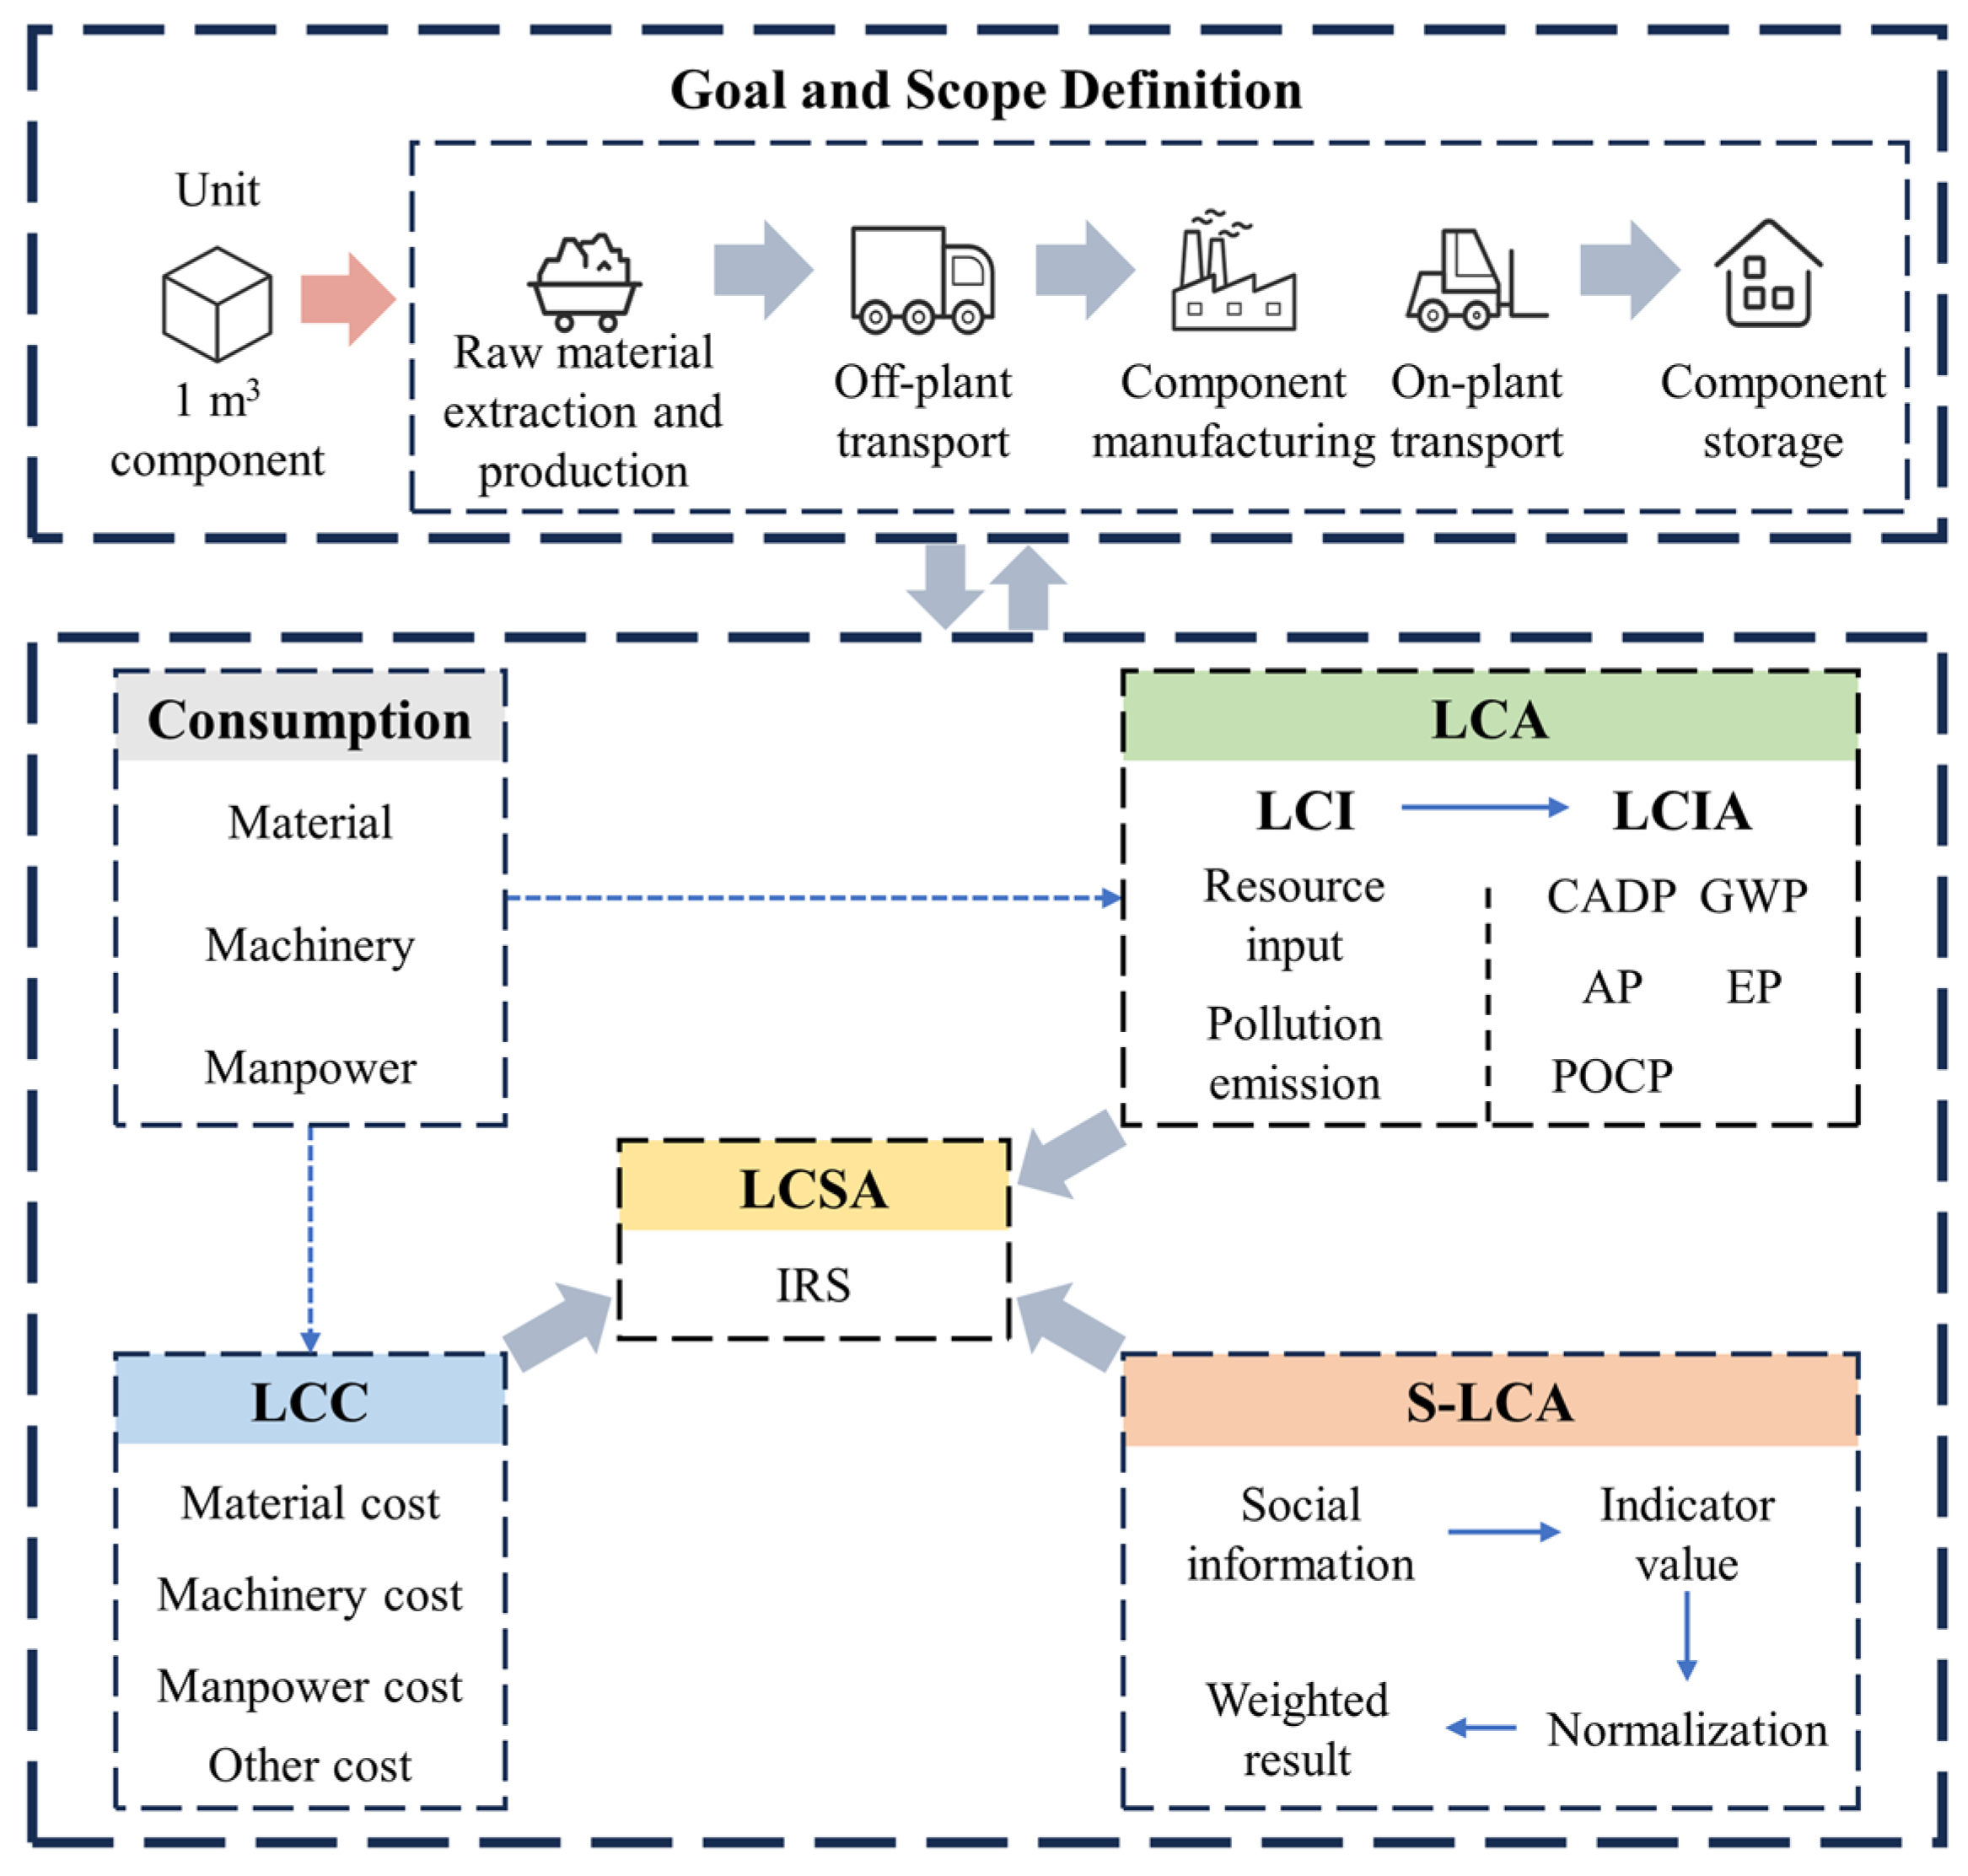
3. Methodology
3.1. Goal and Scope Definition
3.2. Environmental Assessment Model
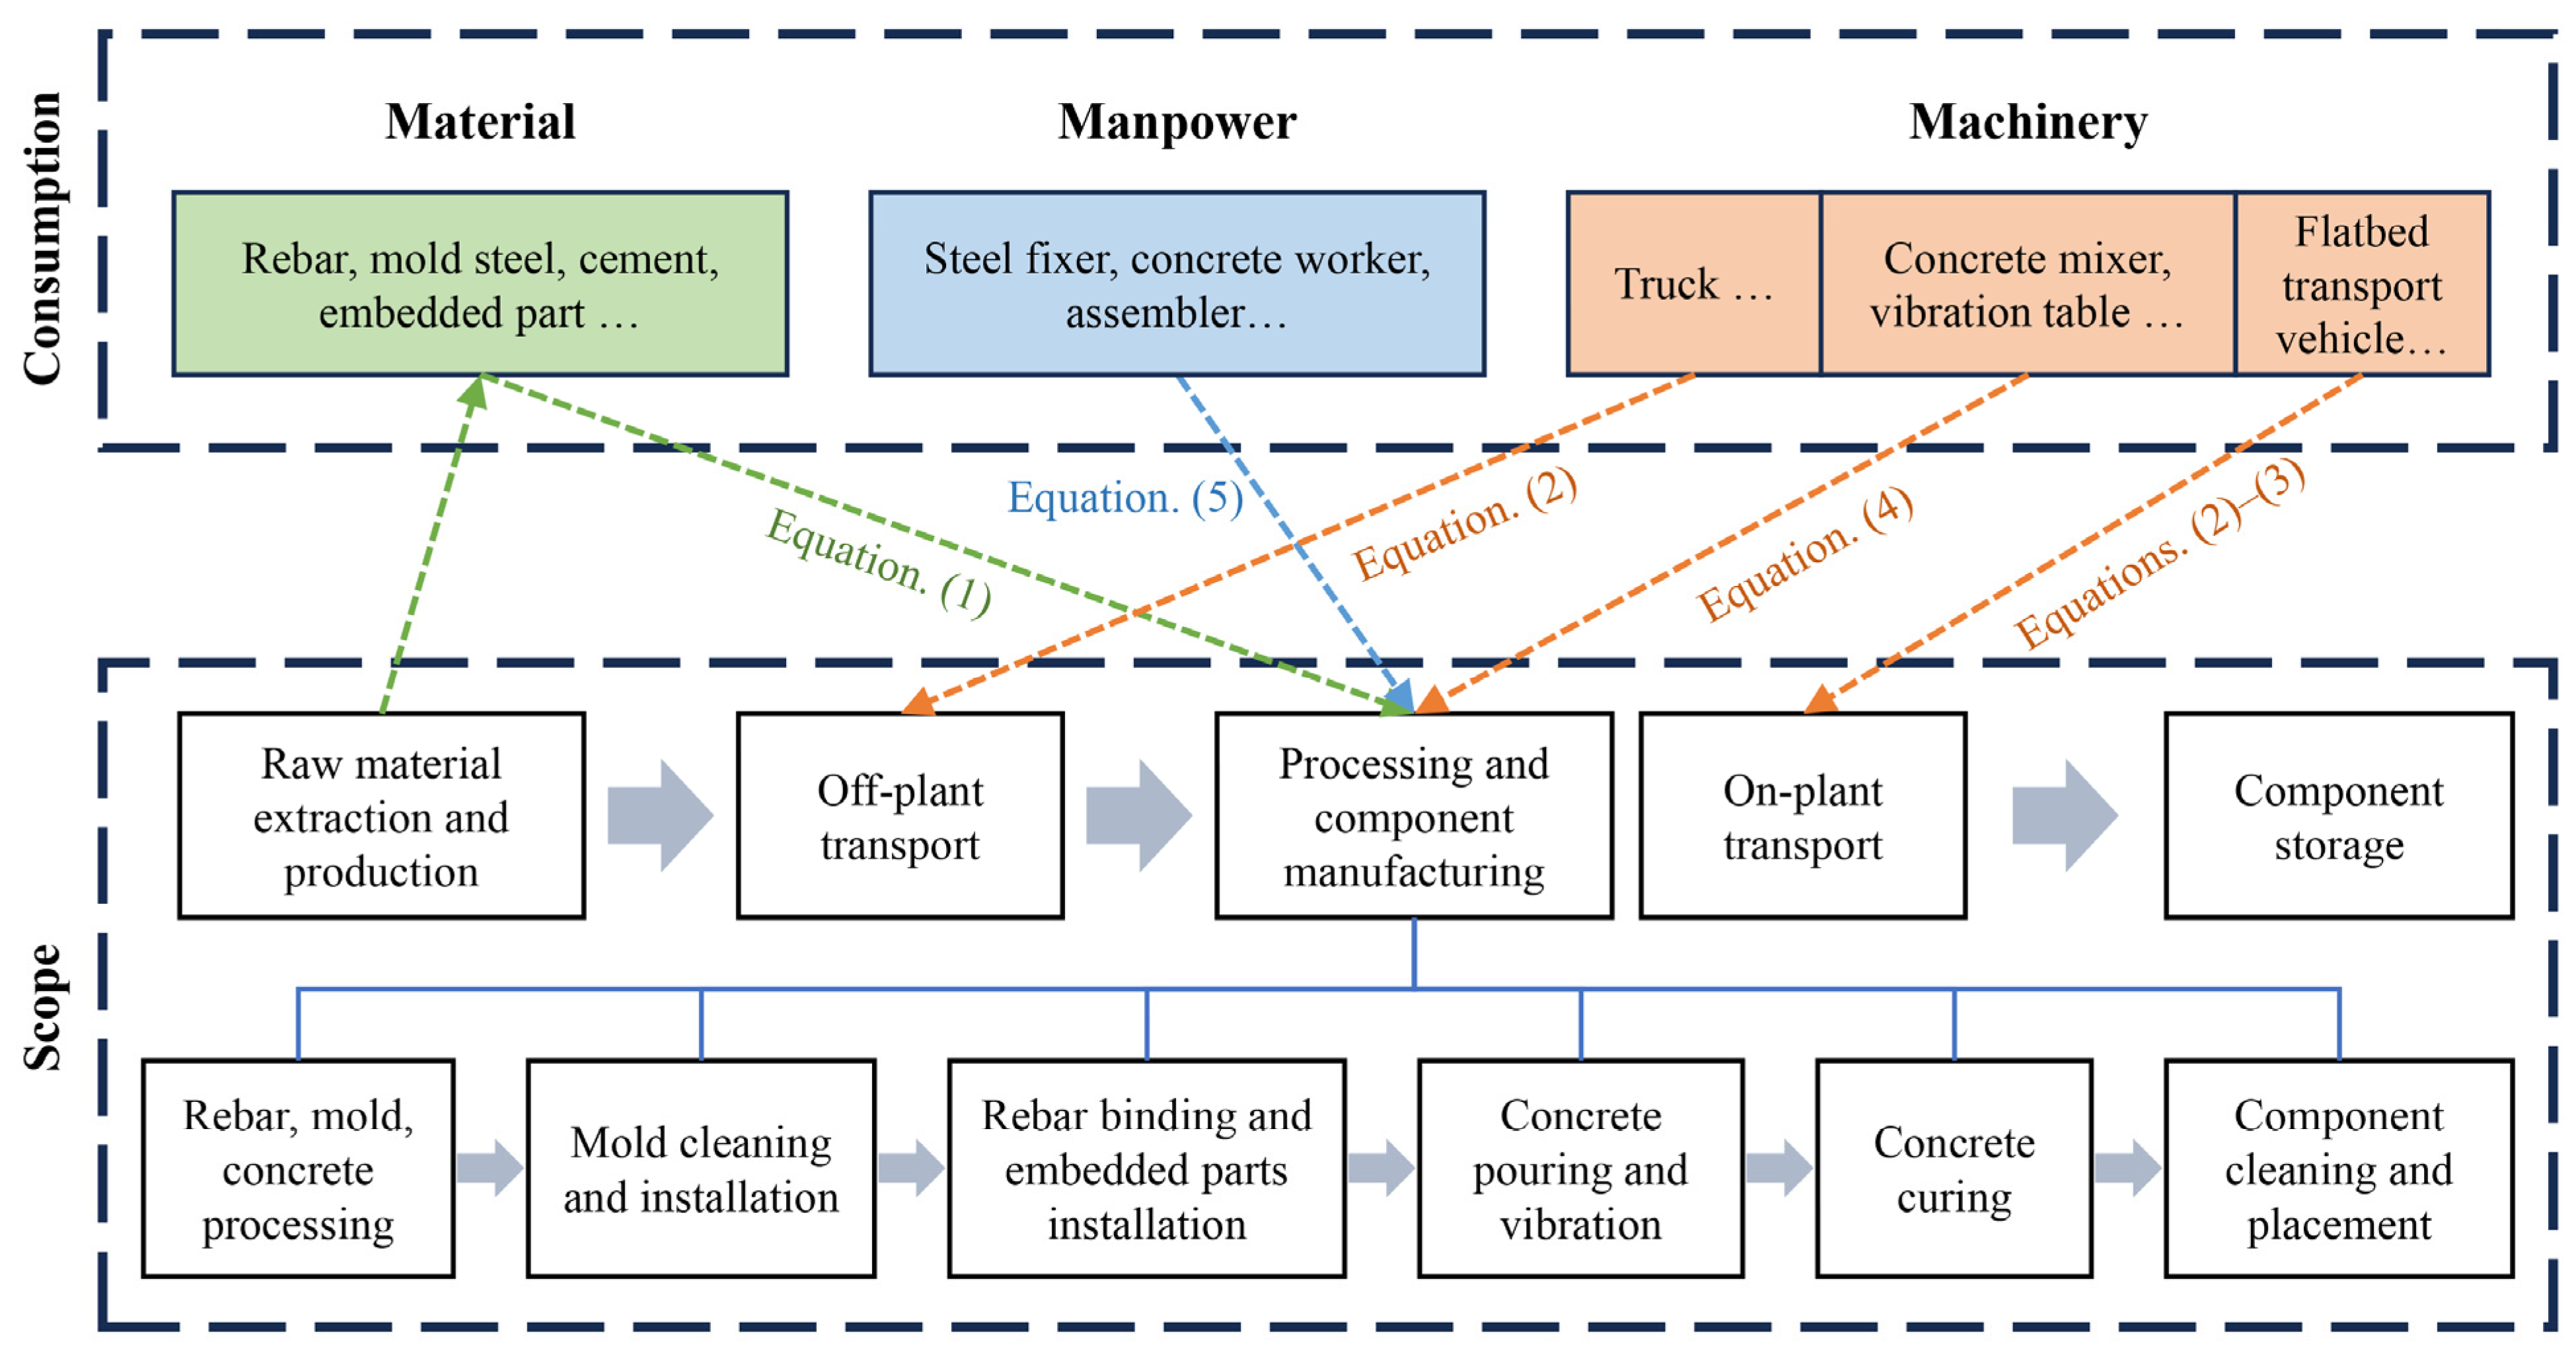
3.2.1. Consumption Analysis
- (1)
- Materials consumption
- (2)
- Energy consumption of transportation machinery
- (3)
- Energy consumption of operational machinery
- (4)
- Manpower
3.2.2. Environmental Impact Assessment
3.3. Economic Model
3.4. Social Model
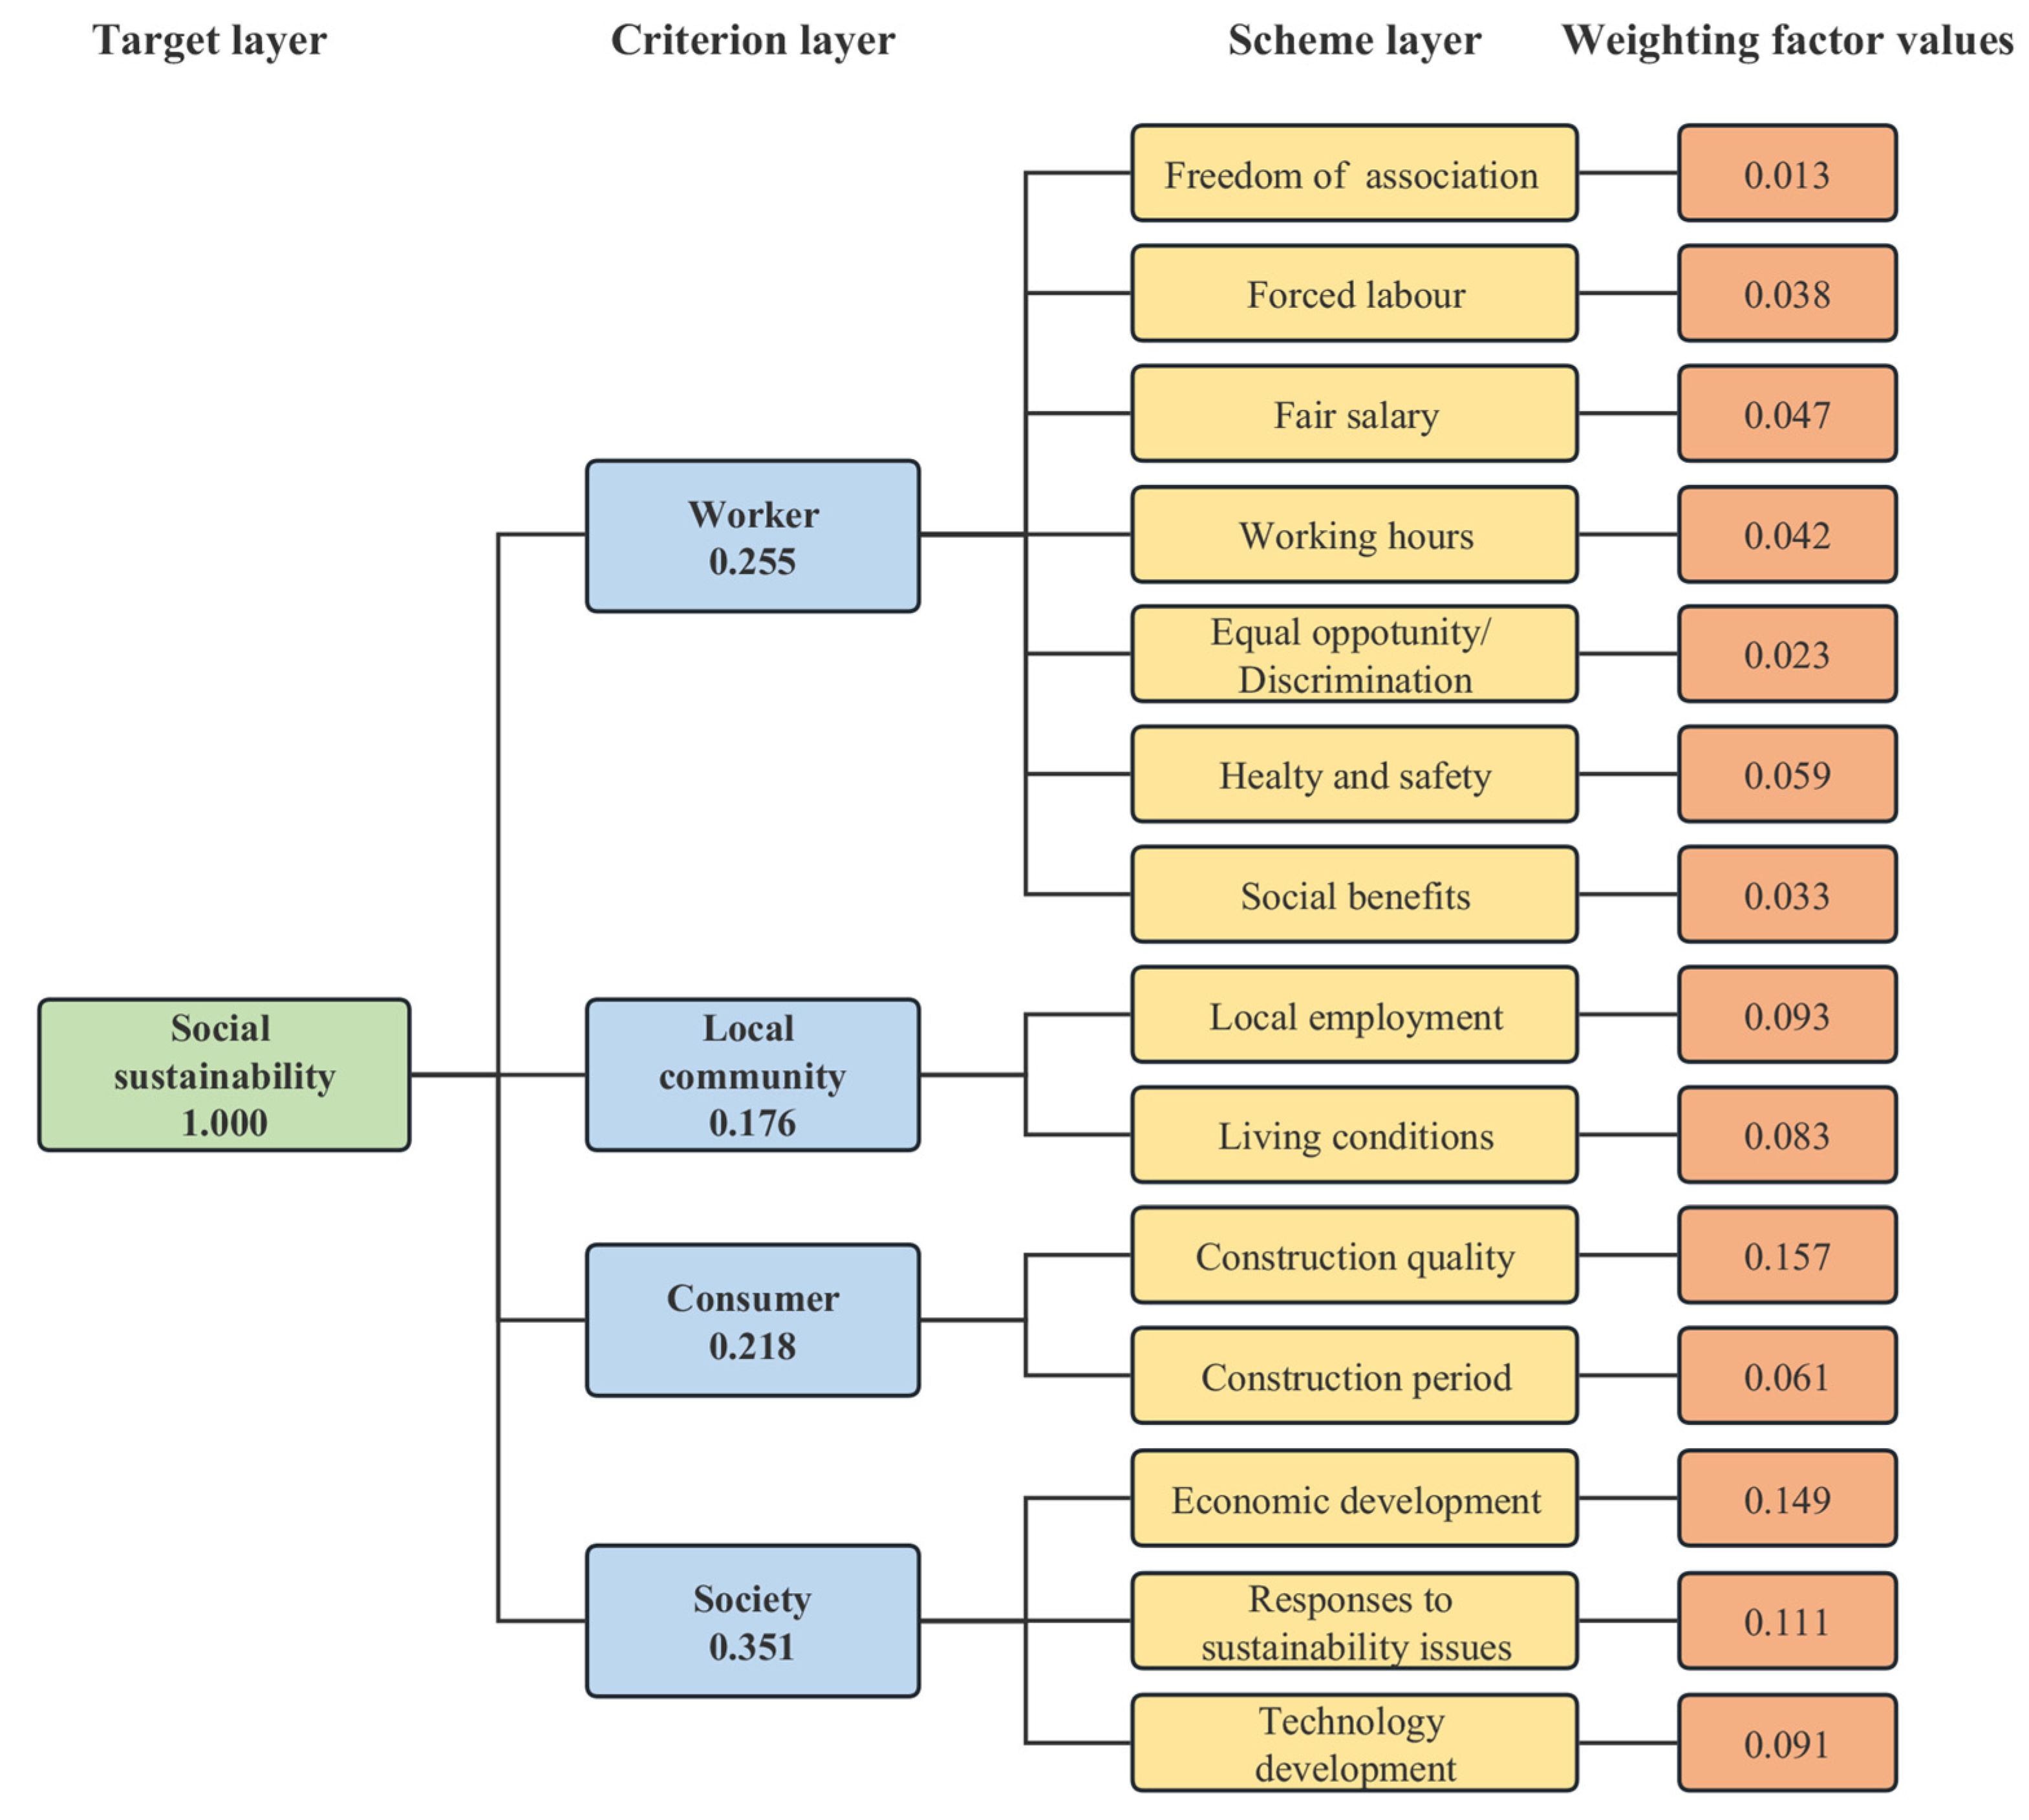
3.4.1. Social Impact Categories and Indicators
3.4.2. Social Impact Assessment
- (1)
- Characterization
- (2)
- Normalization
- (3)
- Weighting
3.5. LCSA Scores
4. Case Study
4.1. Basic Information
4.2. Data Collection
4.3. Analysis of Results
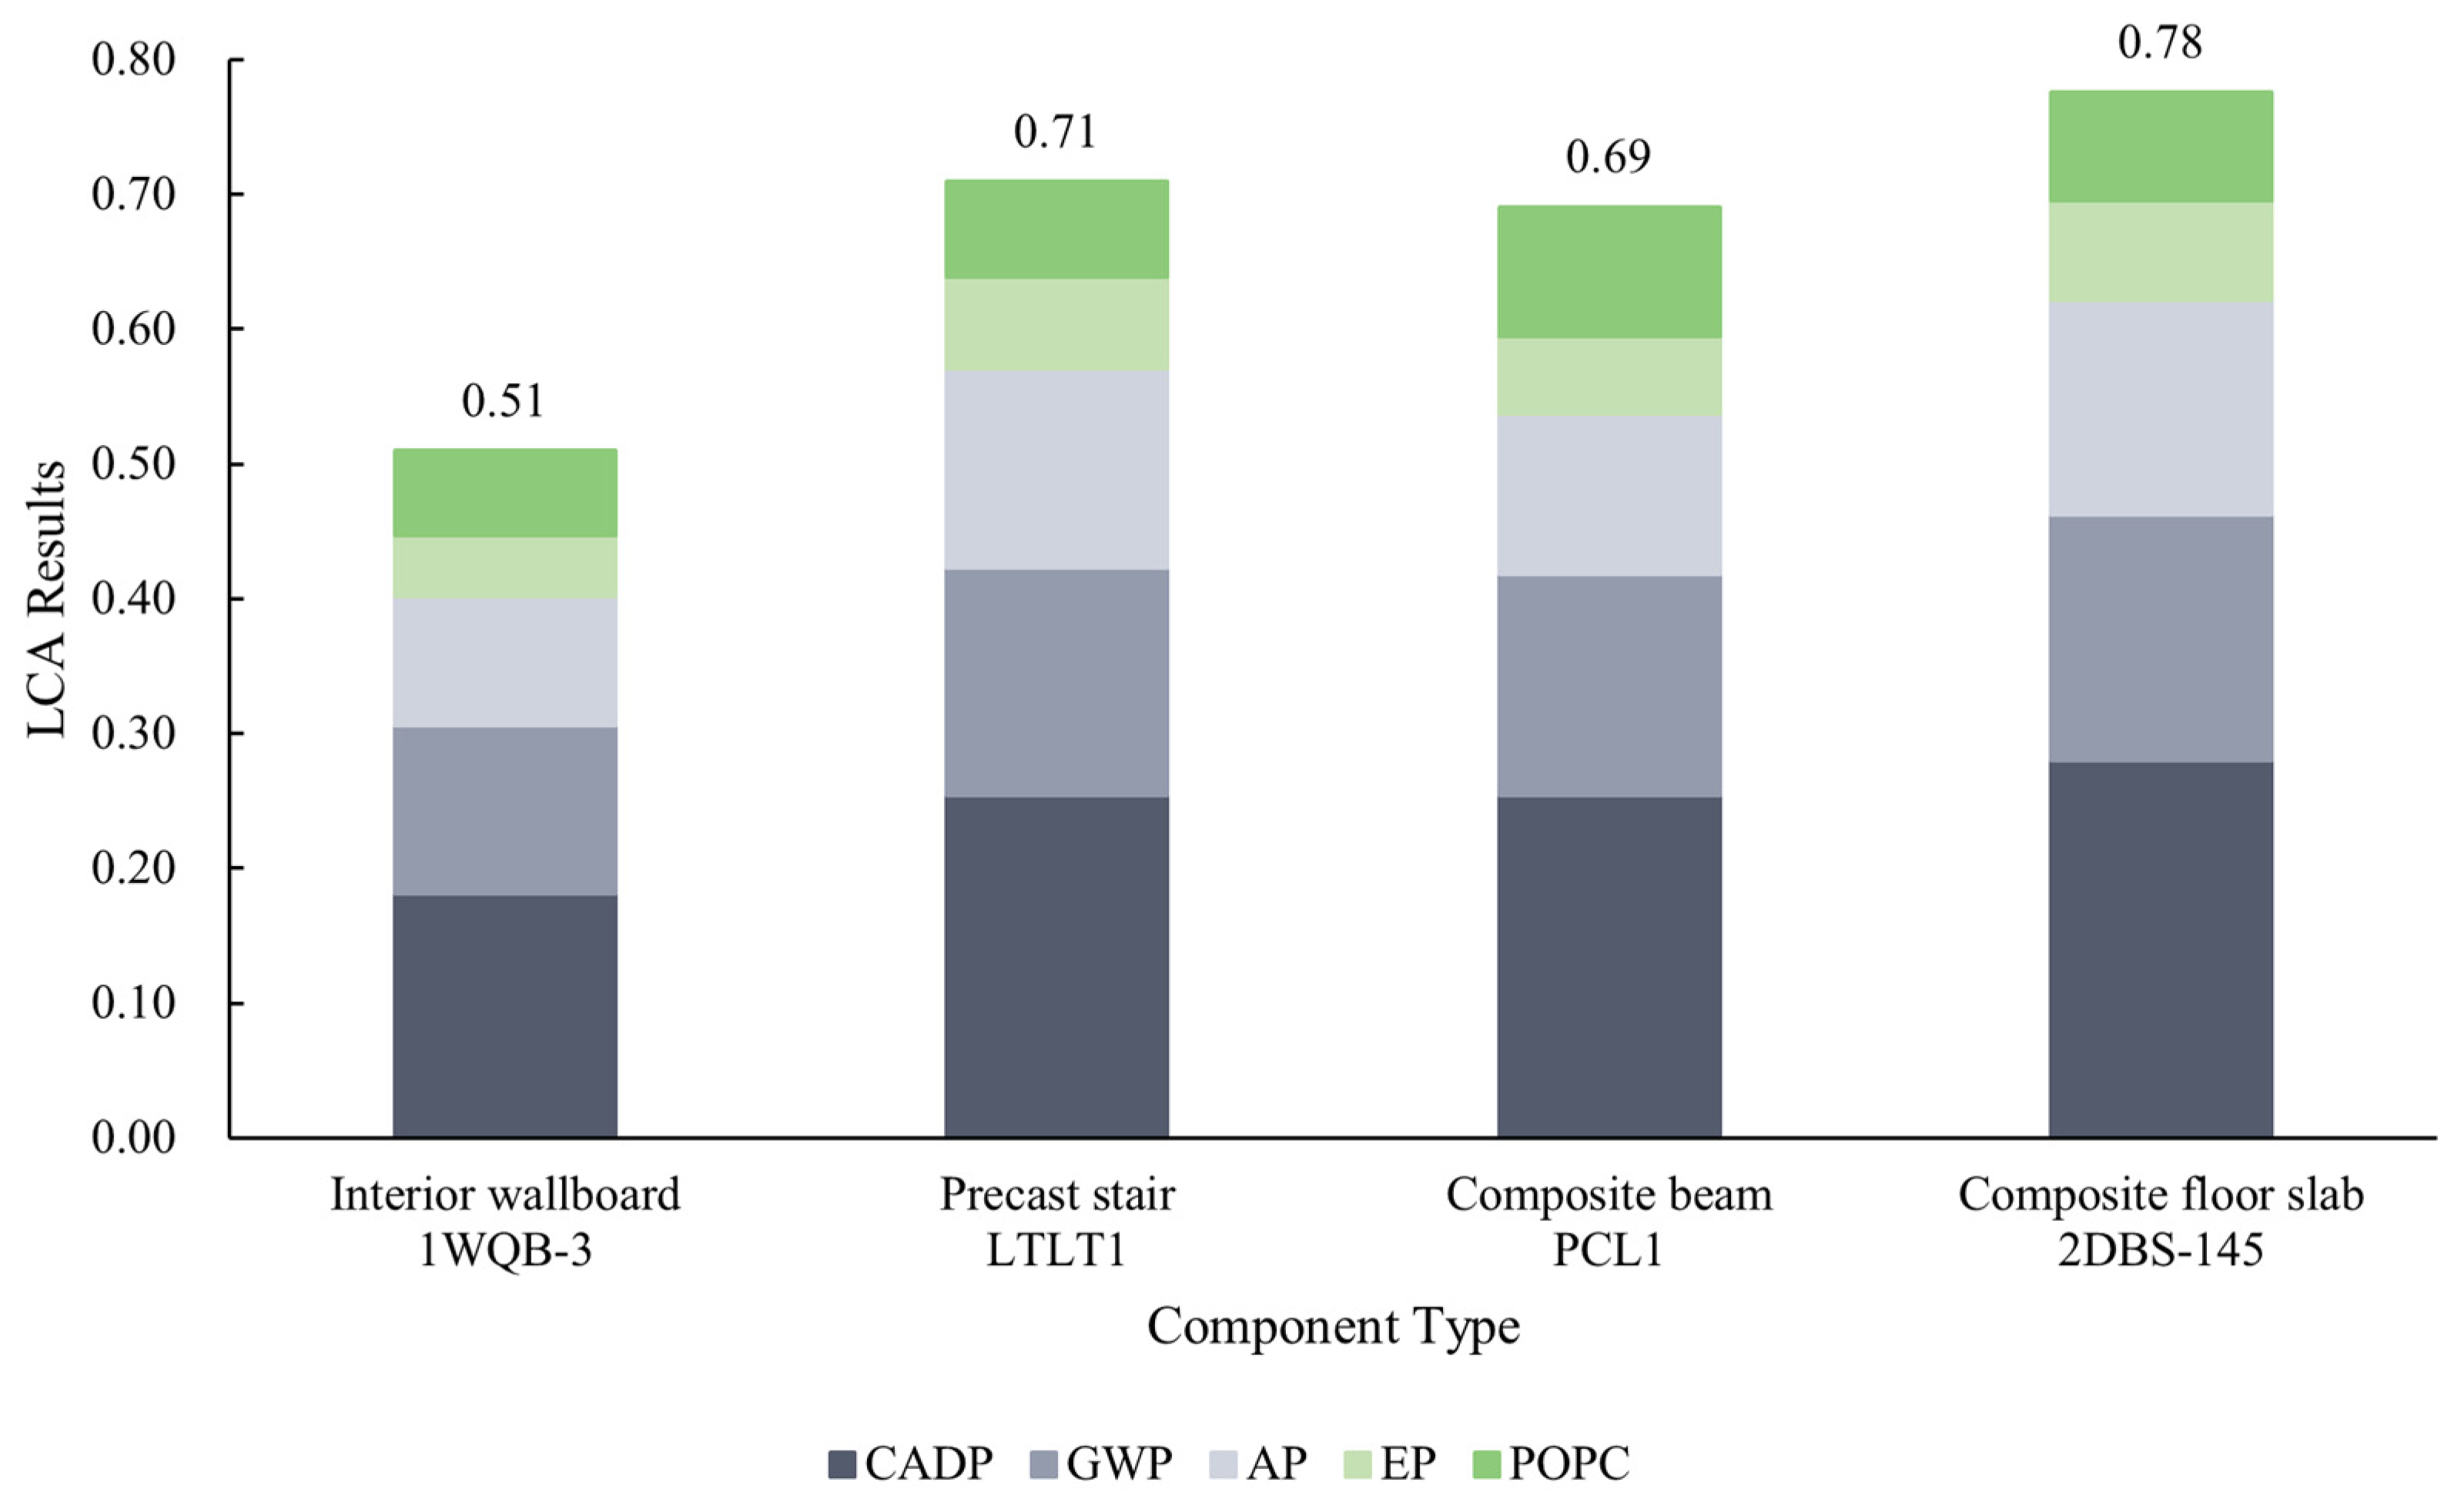
4.3.1. Environmental Sustainability Analysis
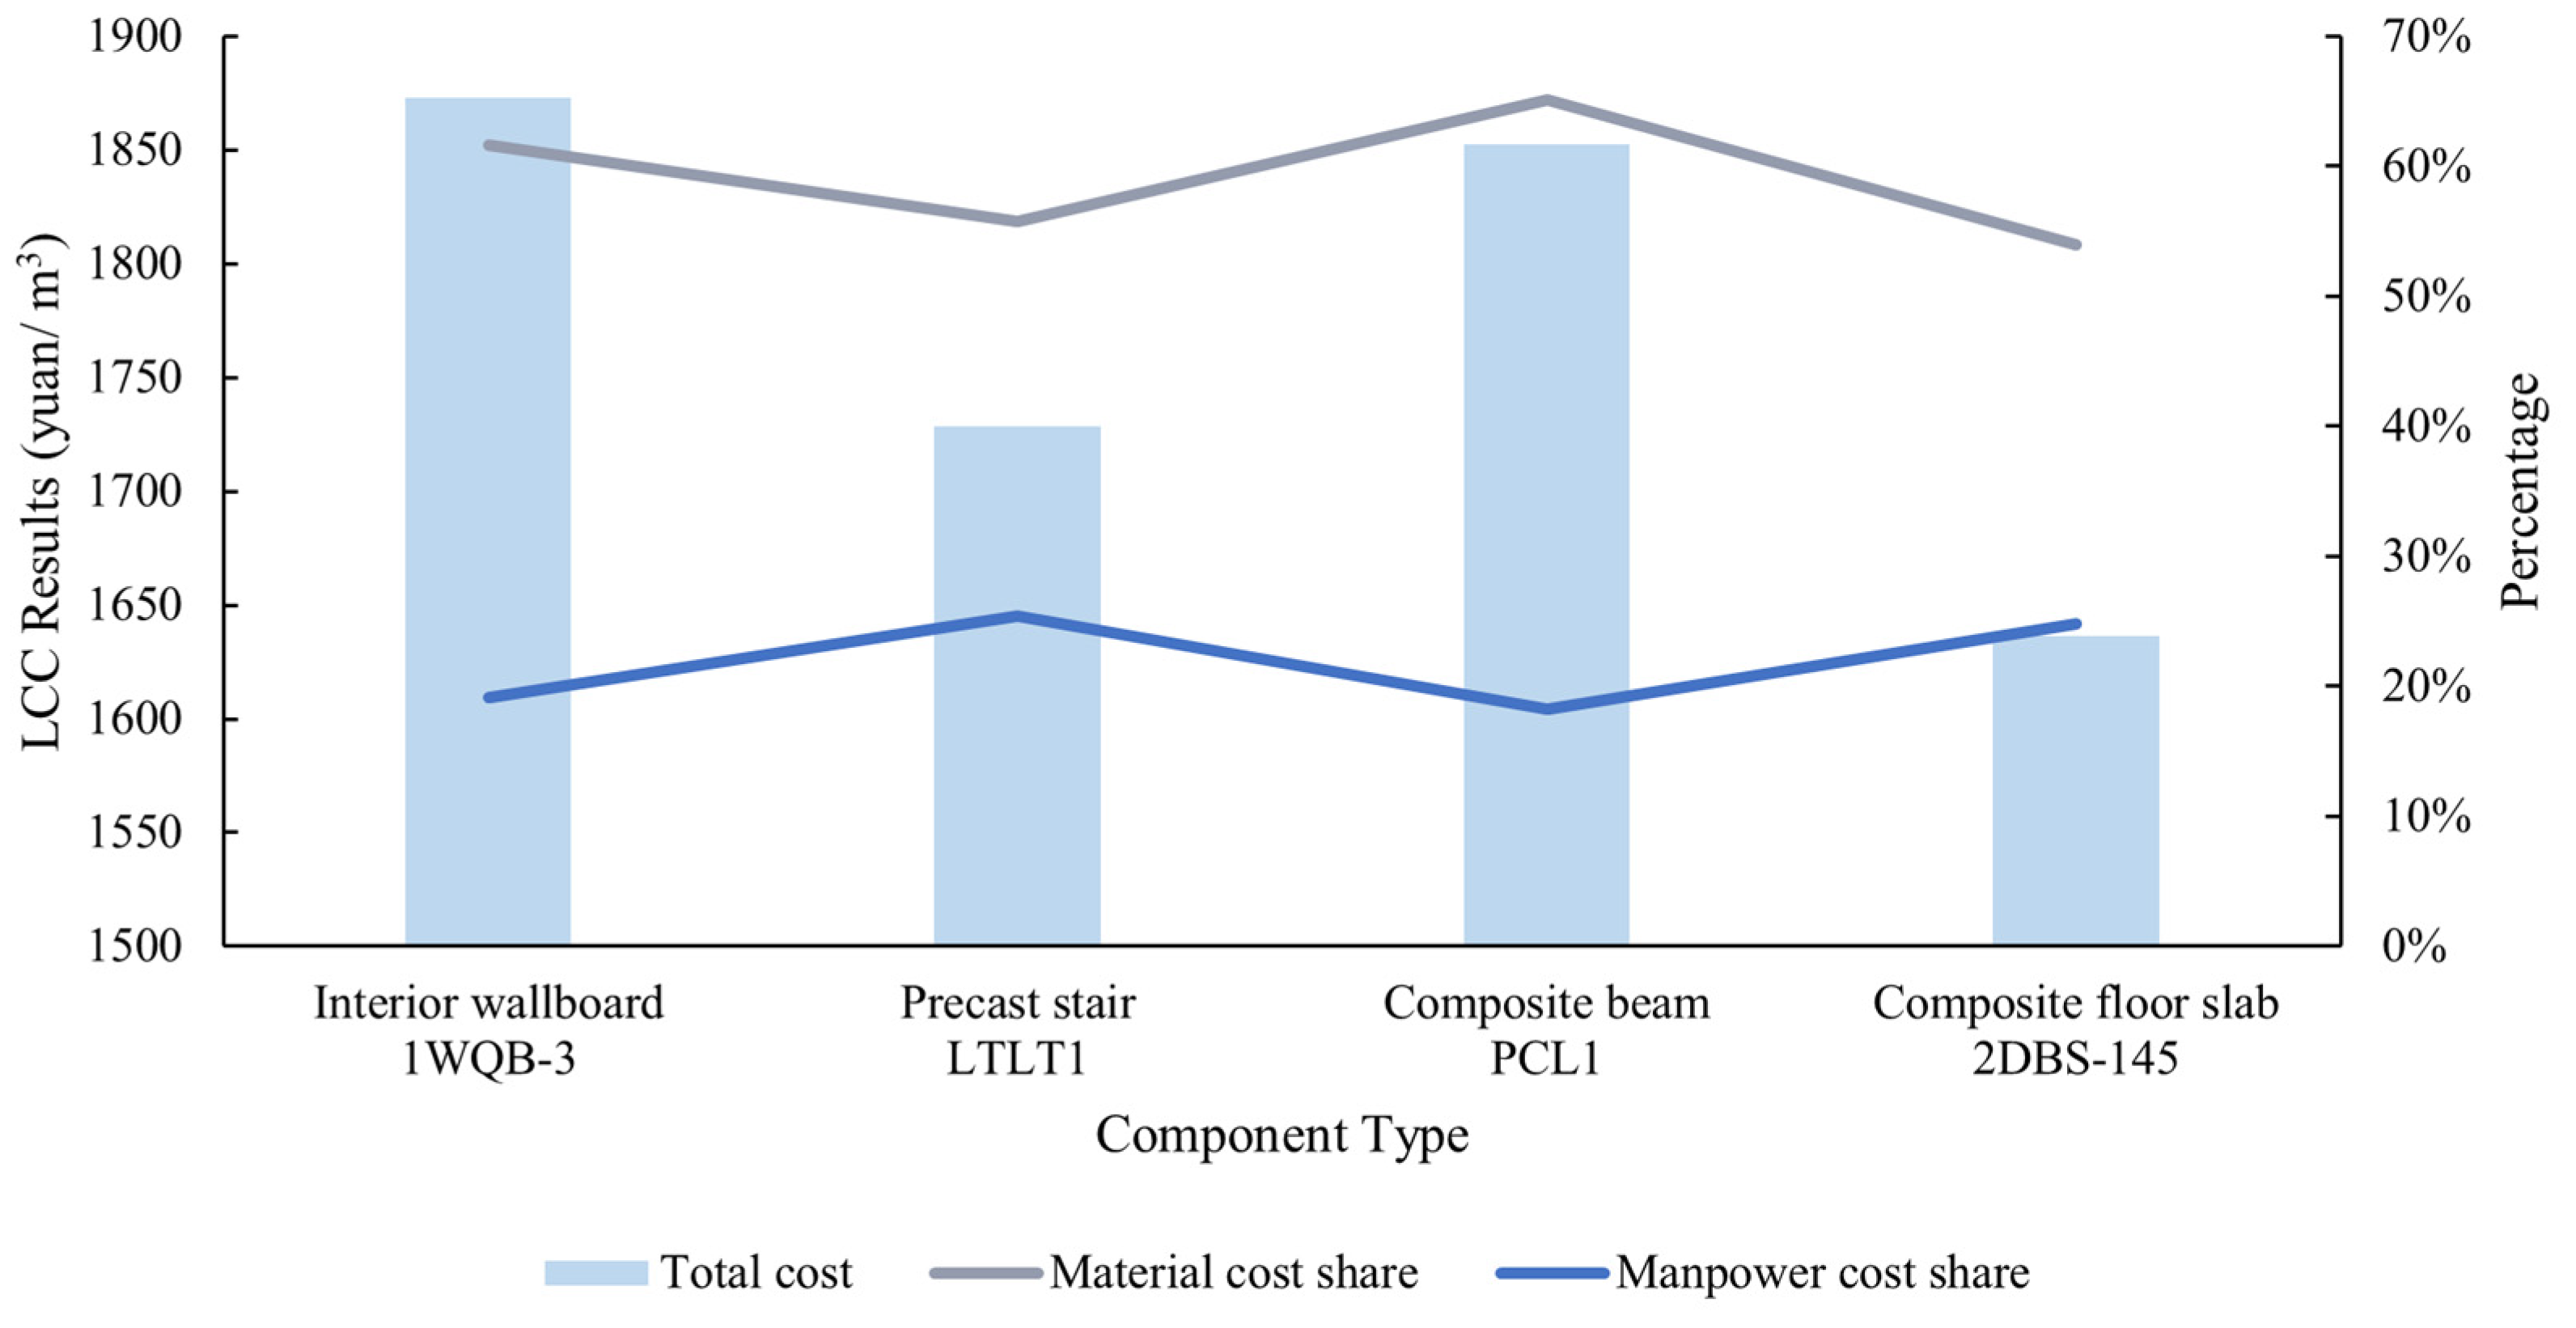
4.3.2. Economic Sustainability Analysis
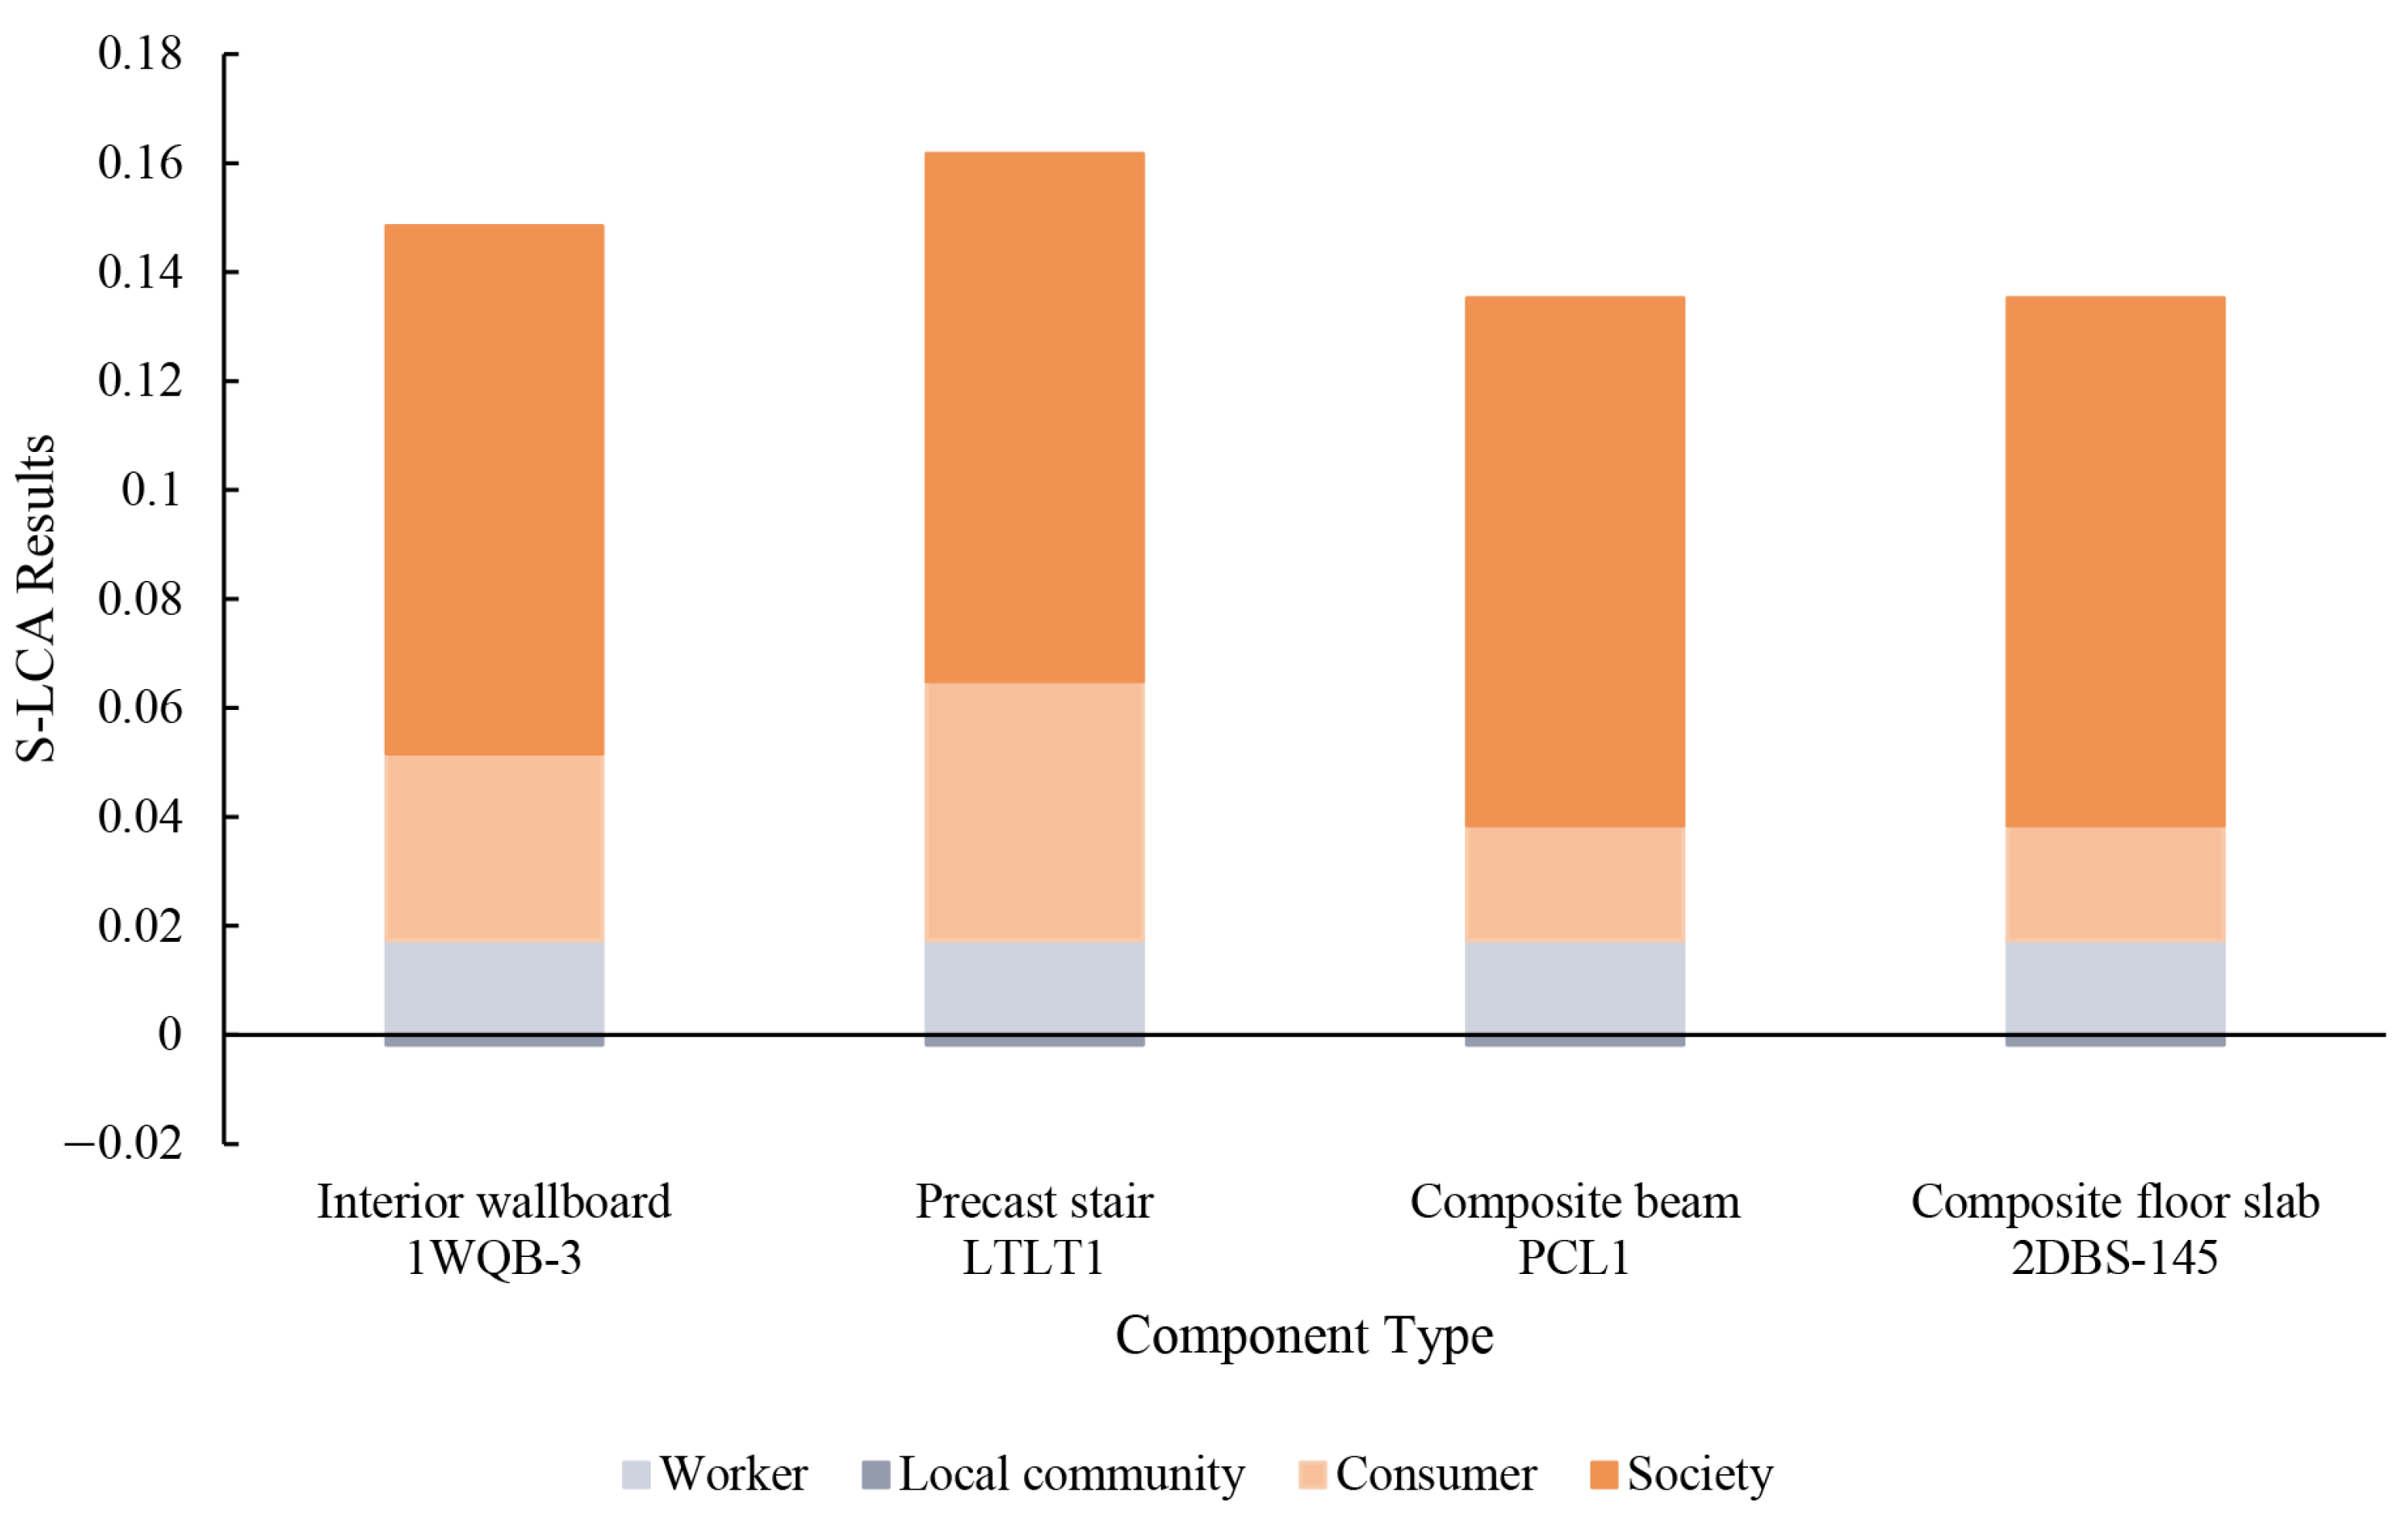
4.3.3. Social Sustainability Analysis
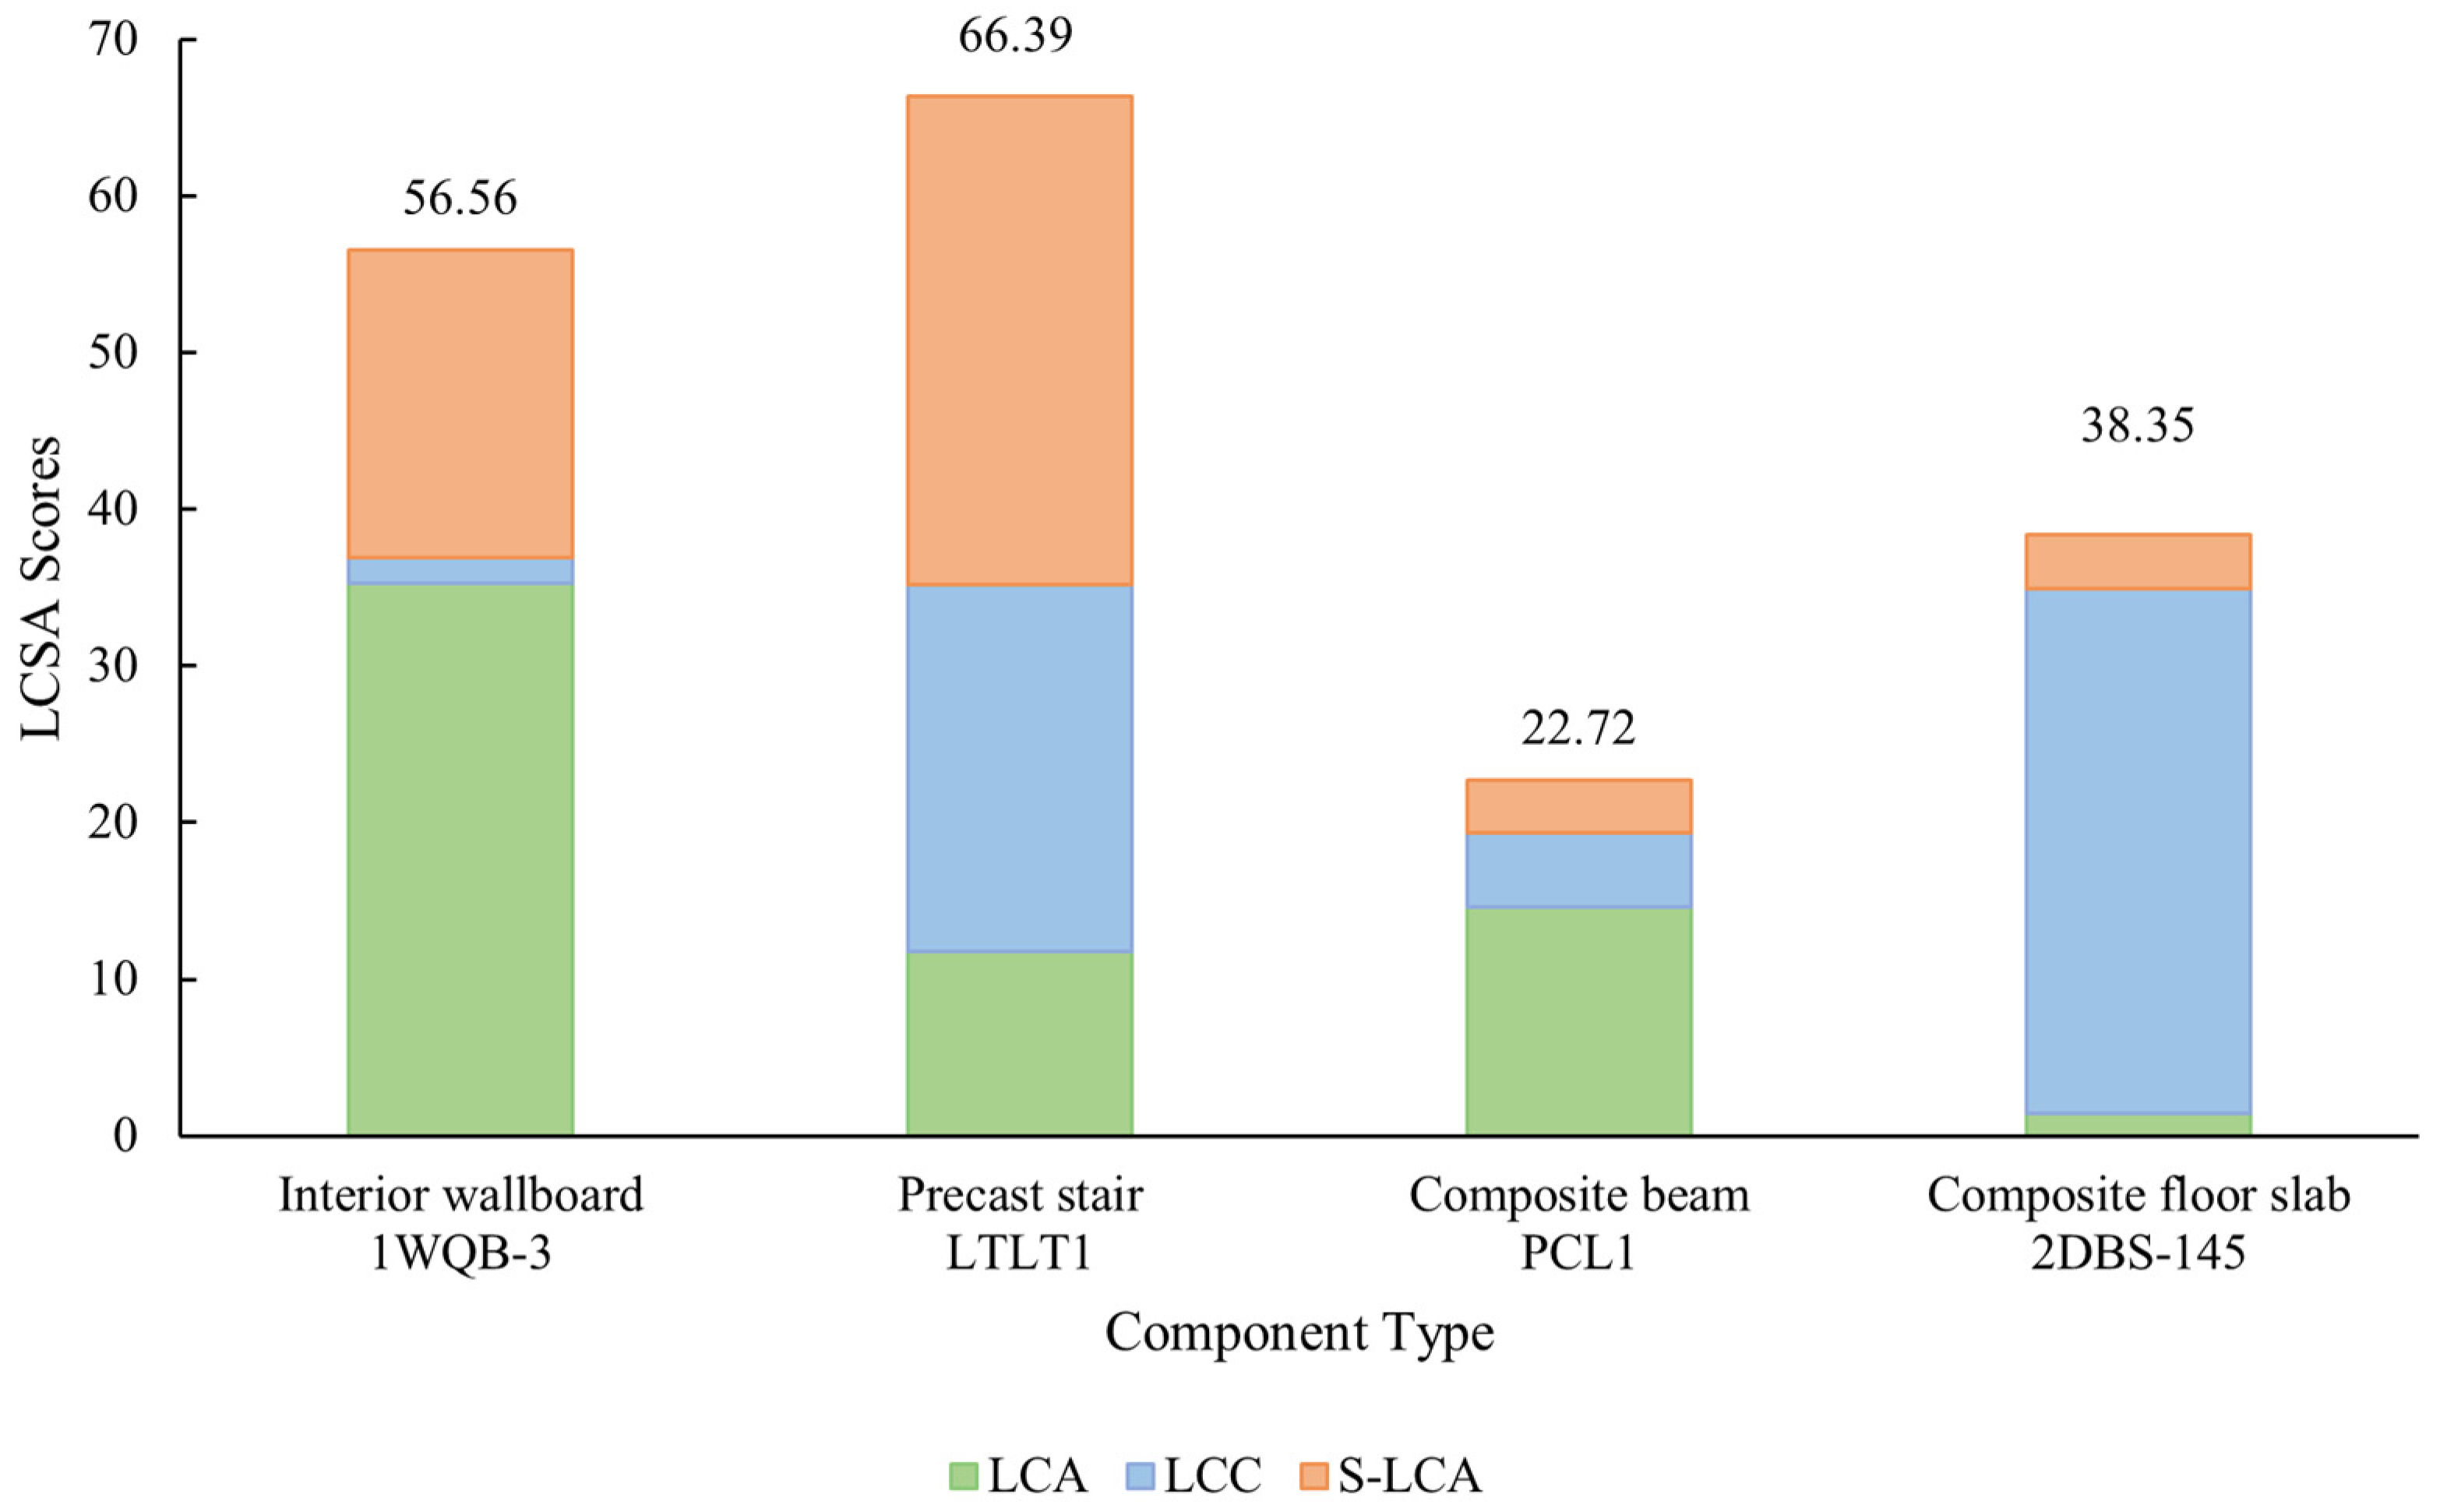
4.3.4. Comprehensive Sustainability Results
5. Discussion
5.1. Sensitivity Analysis
5.2. Model Adjustment and Parameter Selection
5.3. Analysis of Results across Multidimensions
6. Conclusions
Supplementary Materials
Author Contributions
Funding
Institutional Review Board Statement
Informed Consent Statement
Data Availability Statement
Conflicts of Interest
Correction Statement
References
- Liu, S.; Li, Z.; Teng, Y.; Dai, L. A Dynamic Simulation Study on the Sustainability of Prefabricated Buildings. Sustain. Cities Soc. 2022, 77, 103551. [Google Scholar] [CrossRef]
- Sfakianaki, E. Critical Success Factors for Sustainable Construction: A Literature Review. Manag. Environ. Qual. Int. J. 2018, 30, 176–196. [Google Scholar] [CrossRef]
- Luo, T.; Xue, X.; Wang, Y.; Xue, W.; Tan, Y. A Systematic Overview of Prefabricated Construction Policies in China. J. Clean. Prod. 2021, 280, 124371. [Google Scholar] [CrossRef]
- Sfakianaki, E. Resource-Efficient Construction: Rethinking Construction towards Sustainability. World J. Sci. Technol. Sustain. Dev. 2015, 12, 233–242. [Google Scholar] [CrossRef]
- Krizmane, M.; Slihte, S.; Borodinecs, A. Key Criteria Across Existing Sustainable Building Rating Tools. Energy Procedia 2016, 96, 94–99. [Google Scholar] [CrossRef]
- Wang, Y.; Xue, X.; Yu, T.; Wang, Y. Mapping the Dynamics of China’s Prefabricated Building Policies from 1956 to 2019: A Bibliometric Analysis. Build. Res. Inf. 2021, 49, 216–233. [Google Scholar] [CrossRef]
- Zhou, J.; Li, Y.; Ren, D. Quantitative Study on External Benefits of Prefabricated Buildings: From Perspectives of Economy, Environment, and Society. Sustain. Cities Soc. 2022, 86, 104132. [Google Scholar] [CrossRef]
- Cao, X.; Li, X.; Zhu, Y.; Zhang, Z. A Comparative Study of Environmental Performance between Prefabricated and Traditional Residential Buildings in China. J. Clean. Prod. 2015, 109, 131–143. [Google Scholar] [CrossRef]
- Tumminia, G.; Guarino, F.; Longo, S.; Ferraro, M.; Cellura, M.; Antonucci, V. Life Cycle Energy Performances and Environmental Impacts of a Prefabricated Building Module. Renew. Sustain. Energy Rev. 2018, 92, 272–283. [Google Scholar] [CrossRef]
- Kurpinska, M.; Grzyl, B.; Kristowski, A. Cost Analysis of Prefabricated Elements of the Ordinary and Lightweight Concrete Walls in Residential Construction. Materials 2019, 12, 3629. [Google Scholar] [CrossRef]
- ISO 14040:2006; Environmental Management–Life Cycle Assessment–Principles and Framework. ISO: Geneva, Switzerland, 2006.
- ISO 14044:2006; Environmental Management–Life Cycle Assessment–Requirements and Guidelines. ISO: Geneva, Switzerland, 2006.
- ISO 15686-5.2:2008; Buildings and Constructed Assets—Service Life Planning. ISO: Geneva, Switzerland, 2008.
- Taherkhani, R. An Integrated Social Sustainability Assessment Framework: The Case of Construction Industry. Open House Int. 2022, 48, 206–236. [Google Scholar] [CrossRef]
- Amini Toosi, H.; Lavagna, M.; Leonforte, F.; Del Pero, C.; Aste, N. Implementing Life Cycle Sustainability Assessment in Building and Energy Retrofit Design—An Investigation into Challenges and Opportunities. In Life Cycle Sustainability Assessment (LCSA); Muthu, S.S., Ed.; Environmental Footprints and Eco-design of Products and Processes; Springer: Singapore, 2021; pp. 103–136. ISBN 9789811645624. [Google Scholar]
- Kucukvar, M.; Tatari, O. Towards a Triple Bottom-Line Sustainability Assessment of the U.S. Construction Industry. Int. J. Life Cycle Assess. 2013, 18, 958–972. [Google Scholar] [CrossRef]
- Yan, J.; Zhao, T.; Lin, T.; Li, Y. Investigating Multi-Regional Cross-Industrial Linkage Based on Sustainability Assessment and Sensitivity Analysis: A Case of Construction Industry in China. J. Clean. Prod. 2017, 142, 2911–2924. [Google Scholar] [CrossRef]
- Hossaini, N.; Reza, B.; Akhtar, S.; Sadiq, R.; Hewage, K. AHP Based Life Cycle Sustainability Assessment (LCSA) Framework: A Case Study of Six Storey Wood Frame and Concrete Frame Buildings in Vancouver. J. Environ. Plan. Manag. 2015, 58, 1217–1241. [Google Scholar] [CrossRef]
- Dong, Y.H.; Ng, S.T. A Modeling Framework to Evaluate Sustainability of Building Construction Based on LCSA. Int. J. Life Cycle Assess. 2016, 21, 555–568. [Google Scholar] [CrossRef]
- Ferrari, A.M.; Volpi, L.; Pini, M.; Siligardi, C.; Enrique Garcia-Muina, F.; Settembre-Blundo, D. Building a Sustainability Benchmarking Framework of Ceramic Tiles Based on Life Cycle Sustainability Assessment (LCSA). Resources 2019, 8, 11. [Google Scholar] [CrossRef]
- Wang, J.; Wang, Y.; Sun, Y.; Tingley, D.D.; Zhang, Y. Life Cycle Sustainability Assessment of Fly Ash Concrete Structures. Renew. Sustain. Energy Rev. 2017, 80, 1162–1174. [Google Scholar] [CrossRef]
- López-Guerrero, R.E.; Vera, S.; Carpio, M. A Quantitative and Qualitative Evaluation of the Sustainability of Industrialised Building Systems: A Bibliographic Review and Analysis of Case Studies. Renew. Sustain. Energy Rev. 2022, 157, 112034. [Google Scholar] [CrossRef]
- Dantas, T.E.T.; Soares, S.R. Systematic Literature Review on the Application of Life Cycle Sustainability Assessment in the Energy Sector. Environ. Dev. Sustain. 2022, 24, 1583–1615. [Google Scholar] [CrossRef]
- Ciroth, A.; Finkbeiner, M.; Traverso, M.; Hildenbrand, J.; Kloepffer, W.; Mazijn, B.; Prakash, S.; Sonnemann, G.; Valdivia, S.; Ugaya, C.M.L.; et al. Towards a Life Cycle Sustainability Assessment: Making Informed Choices on Products; UNEP/SETAC: Paris, France, 2011. [Google Scholar]
- Ekener, E.; Hansson, J.; Larsson, A.; Peck, P. Developing Life Cycle Sustainability Assessment Methodology by Applying Values-Based Sustainability Weighting—Tested on Biomass Based and Fossil Transportation Fuels. J. Clean. Prod. 2018, 181, 337–351. [Google Scholar] [CrossRef]
- Chen, W.; Holden, N.M. Tiered Life Cycle Sustainability Assessment Applied to a Grazing Dairy Farm. J. Clean. Prod. 2018, 172, 1169–1179. [Google Scholar] [CrossRef]
- Nieder-Heitmann, M.; Haigh, K.F.; Görgens, J.F. Life Cycle Assessment and Multi-Criteria Analysis of Sugarcane Biorefinery Scenarios: Finding a Sustainable Solution for the South African Sugar Industry. J. Clean. Prod. 2019, 239, 118039. [Google Scholar] [CrossRef]
- Onat, N.C.; Kucukvar, M.; Aboushaqrah, N.N.M.; Jabbar, R. How Sustainable Is Electric Mobility? A Comprehensive Sustainability Assessment Approach for the Case of Qatar. Appl. Energy 2019, 250, 461–477. [Google Scholar] [CrossRef]
- Liu, S.; Qian, S. Towards Sustainability-Oriented Decision Making: Model Development and Its Validation via a Comparative Case Study on Building Construction Methods. Sustain. Dev. 2019, 27, 860–872. [Google Scholar] [CrossRef]
- Wen, J.T.; Chin Siong, H.; Noor, Z.Z. Assessment of Embodied Energy and Global Warming Potential of Building Construction Using Life Cycle Analysis Approach: Case Studies of Residential Buildings in Iskandar Malaysia. Energy Build. 2015, 93, 295–302. [Google Scholar] [CrossRef]
- Du, Q.; Bao, T.; Li, Y.; Huang, Y.; Shao, L. Impact of Prefabrication Technology on the Cradle-to-Site CO2 Emissions of Residential Buildings. Clean Technol. Environ. Policy 2019, 21, 1499–1514. [Google Scholar] [CrossRef]
- Zhu, H.; Hong, J.; Shen, G.Q.; Mao, C.; Zhang, H.; Li, Z. The Exploration of the Life-Cycle Energy Saving Potential for Using Prefabrication in Residential Buildings in China. Energy Build. 2018, 166, 561–570. [Google Scholar] [CrossRef]
- Zheng, X.; Xu, J. Research on Carbon Emissions of Assembly Building Life Cycle Based on LCA: Take a Light Steel Assembly Integrated Villa in Chongqing as an Example. Constr. Econ. 2019, 40, 107–111. [Google Scholar] [CrossRef]
- Tian, Y.; Spatari, S. Environmental Life Cycle Evaluation of Prefabricated Residential Construction in China. J. Build. Eng. 2022, 57, 104776. [Google Scholar] [CrossRef]
- Hong, J.; Shen, G.Q.; Li, Z.; Zhang, B.; Zhang, W. Barriers to Promoting Prefabricated Construction in China: A Cost–Benefit Analysis. J. Clean. Prod. 2018, 172, 649–660. [Google Scholar] [CrossRef]
- Qi, Y.; Chang, S.; Ji, Y.; Qi, K. BIM-Based Incremental Cost Analysis Method of Prefabricated Buildings in China. Sustainability 2018, 10, 4293. [Google Scholar] [CrossRef]
- Samani, P.; Gregory, J.; Leal, V.; Mendes, A.; Correia, N. Lifecycle Cost Analysis of Prefabricated Composite and Masonry Buildings: Comparative Study. J. Archit. Eng. 2018, 24, 05017012. [Google Scholar] [CrossRef]
- Rostamnezhad, M.; Thaheem, M.J. Social Sustainability in Construction Projects—A Systematic Review of Assessment Indicators and Taxonomy. Sustainability 2022, 14, 5279. [Google Scholar] [CrossRef]
- Radziejowska, A.; Sobotka, A. Assessment of Large-Panel Prefabricated Buildings in the Social Aspect of Sustainable Construction. Arch. Civ. Eng. 2021, 67, 93–108. [Google Scholar] [CrossRef]
- Li, X.; Geng, Y.; Song, Z.; Ma, Q.; Tian, X. Job Stress and Job Satisfaction of Workers in Traditional Cast-in-Situ Projects and Industrialized Projects. In Proceedings of the ICCREM 2017, Guangzhou, China, 9 November 2017; American Society of Civil Engineers: Guangzhou, China, 2017; pp. 89–96. [Google Scholar]
- Liu, S.; Qian, S. Evaluation of Social Life-Cycle Performance of Buildings: Theoretical Framework and Impact Assessment Approach. J. Clean. Prod. 2019, 213, 792–807. [Google Scholar] [CrossRef]
- Wu, K.; Wang, Z.; Jin, W.; Wang, W. Quantitative analysis of sustainable cost of prefabricated concrete structures. J. Build. Struct. 2021, 42, 133–144. [Google Scholar] [CrossRef]
- Kamali, M.; Hewage, K. Development of Performance Criteria for Sustainability Evaluation of Modular versus Conventional Construction Methods. J. Clean. Prod. 2017, 142, 3592–3606. [Google Scholar] [CrossRef]
- Liu, G.; Gu, T.; Xu, P.; Hong, J.; Shrestha, A.; Martek, I. A Production Line-Based Carbon Emission Assessment Model for Prefabricated Components in China. J. Clean. Prod. 2019, 209, 30–39. [Google Scholar] [CrossRef]
- Xu, Z.; Wang, S.; Wang, E. Integration of BIM and Energy Consumption Modelling for Manufacturing Prefabricated Components: A Case Study in China. Adv. Civ. Eng. 2019, 2019, e1609523. [Google Scholar] [CrossRef]
- Li, X.-J.; Xie, W.-J.; Jim, C.Y.; Feng, F. Holistic LCA Evaluation of the Carbon Footprint of Prefabricated Concrete Stairs. J. Clean. Prod. 2021, 329, 129621. [Google Scholar] [CrossRef]
- Hong, J.; Shen, G.Q.; Mao, C.; Li, Z.; Li, K. Life-Cycle Energy Analysis of Prefabricated Building Components: An Input–Output-Based Hybrid Model. J. Clean. Prod. 2016, 112, 2198–2207. [Google Scholar] [CrossRef]
- Jeong, J.; Hong, T.; Ji, C.; Kim, J.; Lee, M.; Jeong, K.; Lee, S. An Integrated Evaluation of Productivity, Cost and CO2 Emission between Prefabricated and Conventional Columns. J. Clean. Prod. 2017, 142, 2393–2406. [Google Scholar] [CrossRef]
- Cui, P.; Zhao, H.; Dong, Z.; Ju, X.; Zou, P.; Zhou, S. Modeling the Occupational Health Risk of Workers Caused by Environmental Release during the Production of PC Components. Front. Public Health 2022, 10, 4562. [Google Scholar] [CrossRef] [PubMed]
- Li, M.; Guo, Z. Research on Transportation Safety of Prefabricated Building Components Based on Spa- Abc. Civ. Eng. J. Staveb. Obz. 2022, 31, 613–624. [Google Scholar] [CrossRef]
- Zhang, C.; Hu, M.; Yang, X.; Amati, A.; Tukker, A. Life Cycle Greenhouse Gas Emission and Cost Analysis of Prefabricated Concrete Building Facade Elements. J. Ind. Ecol. 2020, 24, 1016–1030. [Google Scholar] [CrossRef]
- Cheng, Z.; Zhang, T.; Zhou, X.; Li, Z.; Jia, Y.; Ren, K.; Xu, T.; Li, C.; Hong, J. Life Cycle Environmental and Cost Assessment of Prefabricated Components Manufacture. J. Clean. Prod. 2023, 415, 137888. [Google Scholar] [CrossRef]
- Mostafaei, H.; Badarloo, B.; Chamasemani, N.F.; Rostampour, M.A.; Lehner, P. Investigating the Effects of Concrete Mix Design on the Environmental Impacts of Reinforced Concrete Structures. Buildings 2023, 13, 1313. [Google Scholar] [CrossRef]
- Huang, B.; Gao, X.; Xu, X.; Song, J.; Geng, Y.; Sarkis, J.; Fishman, T.; Kua, H.; Nakatani, J. A Life Cycle Thinking Framework to Mitigate the Environmental Impact of Building Materials. One Earth 2020, 3, 564–573. [Google Scholar] [CrossRef]
- Li, X.; Xie, W.; Yang, T.; Lin, C.; Jim, C.Y. Carbon Emission Evaluation of Prefabricated Concrete Composite Plates during the Building Materialization Stage. Build. Environ. 2023, 232, 110045. [Google Scholar] [CrossRef]
- Shi, J. Analysis Method Research on Multi-dimensional Remanufacturability of Mechanical Equipment Based on LCSA Theory. Ph.D. Thesis, Dalian University of Technology, Dalian, China, 2017. [Google Scholar]
- Yang, J.; Xu, C.; Wang, R. Methodology and Application of Life Cycle Assessment; China Meteorological Press: Beijing, China, 2002; ISBN 978-7-5029-3348-7. [Google Scholar]
- Andrews, E.S.; Barthel, L.-P.; Beck, T.; Benoît, C.; Ciroth, A.; Cucuzzella, C.; Gensch, C.-O.; Hébert, J.; Lesage, P.; Manhart, A.; et al. Guidelines for Social Life Cycle Assessment of Products; UNEP/SETAC: Paris, France, 2009. [Google Scholar]
- Ma, Z. Life Cycle Sustainability Assessment of Prefabricated Buildings-Taking Tianjin Shuangqing New Home as an Example. Master’s Thesis, Tianjin University, Tianjin, China, 2020. [Google Scholar]
- Zhang, Y. Social-Life Cycle Assessment of Industrialized Building. Master’s Thesis, Beijing Jiaotong University, Beijing, China, 2016. [Google Scholar]
- Gao, Z. Social Impact Assessment of Prefabricated and Construction Phase of Assembled Building Based on S-LCA. Master’s Thesis, Beijing Jiaotong University, Beijing, China, 2018. [Google Scholar]
- Ning, G.; Li, R. An Analysis on Difference in Citizenship Attainment for Rural to Urban Migrant with Different Migration Scopes. Chin. J. Popul. Sci. 2016, 4, 37–47+126–127. [Google Scholar]
- Wang, S.-W.; Hsu, C.-W.; Hu, A.H. An Analytic Framework for Social Life Cycle Impact Assessment—Part 1: Methodology. Int. J. Life Cycle Assess. 2016, 21, 1514–1528. [Google Scholar] [CrossRef]
- Zheng, X.; Easa, S.M.; Ji, T.; Jiang, Z. Modeling Life-Cycle Social Assessment in Sustainable Pavement Management at Project Level. Int. J. Life Cycle Assess. 2020, 25, 1106–1118. [Google Scholar] [CrossRef]
- Aung, T.S.; Fischer, T.B.; Azmi, A.S. Social Impacts of Large-Scale Hydropower Project in Myanmar: A Social Life Cycle Assessment of Shweli Hydropower Dam 1. Int. J. Life Cycle Assess. 2021, 26, 417–433. [Google Scholar] [CrossRef]
- Pollok, L.; Spierling, S.; Endres, H.-J.; Grote, U. Social Life Cycle Assessments: A Review on Past Development, Advances and Methodological Challenges. Sustainability 2021, 13, 10286. [Google Scholar] [CrossRef]
- Dong, Y.H.; Ng, S.T. A Social Life Cycle Assessment Model for Building Construction in Hong Kong. Int. J. Life Cycle Assess. 2015, 20, 1166–1180. [Google Scholar] [CrossRef]
- Pollesch, N.L.; Dale, V.H. Normalization in Sustainability Assessment: Methods and Implications. Ecol. Econ. 2016, 130, 195–208. [Google Scholar] [CrossRef]
- Tarne, P.; Lehmann, A.; Finkbeiner, M. Introducing Weights to Life Cycle Sustainability Assessment—How Do Decision-Makers Weight Sustainability Dimensions? Int. J. Life Cycle Assess. 2019, 24, 530–542. [Google Scholar] [CrossRef]
- Balasbaneh, A.T.; Ramli, M.Z. A Comparative Life Cycle Assessment (LCA) of Concrete and Steel-Prefabricated Prefinished Volumetric Construction Structures in Malaysia. Environ. Sci. Pollut. Res. 2020, 27, 43186–43201. [Google Scholar] [CrossRef]
- Shen, K.; Cheng, C.; Li, X.; Zhang, Z. Environmental Cost-Benefit Analysis of Prefabricated Public Housing in Beijing. Sustainability 2019, 11, 207. [Google Scholar] [CrossRef]
- Zheng, X.; Easa, S.M.; Yang, Z.; Ji, T.; Jiang, Z. Life-Cycle Sustainability Assessment of Pavement Maintenance Alternatives: Methodology and Case Study. J. Clean. Prod. 2019, 213, 659–672. [Google Scholar] [CrossRef]

| Stakeholder | Subcategory | Indicator | ||
|---|---|---|---|---|
| Label | Measurement | Type * | ||
| Workers | Freedom of association | Labor dispute ratio | Number of workers involved in labor disputes/Number of total workers | √ |
| Union participation ratio | Number of unionized workers/Number of total workers | √ | ||
| Forced labor | Percentage of weekly overtime hours | Average weekly overtime hours/Prescribed weekly overtime hours limit | √ | |
| Fair salary | Average salary ratio | Average salary of workers in the assessed factory/Average salary in the industry | √ | |
| Minimum salary worker ratio | Number of workers earning the local minimum salary/ Number of total workers | √ | ||
| Timely salary payment | Number of times salaries are paid on time/ Number of times salaries are due | √ | ||
| Working hours | Whether the total weekly working hours exceed the legal working hours | YES/NO | × | |
| Equal opportunities /Discrimination | Female labor force ratio | Number of female employees/Number of male employees | √ | |
| Female employee salary coefficient | Average salary for female employees/Average salary for male employee | √ | ||
| Discrimination in hiring | Gender, race, household registration, marital status | × | ||
| Health and safety | Workplace injury accident | YES/NO | × | |
| Usage rate of protective equipment | Number of workers properly performing production protection/ Number of total workers | √ | ||
| Social benefits | Insurances and housing fund proportion | Number of workers contributing to insurances and housing fund/ Number of total workers | √ | |
| Local community | Local employment | Proportion of local employees | Number of local employees/ Number of total workers | √ |
| Living conditions | Impact of production activities on local living environment | YES/NO | × | |
| Consumers | Construction quality | Building quality improvement | YES/NO | × |
| Construction period | Save construction time | Reduced construction time/Original construction time | √ | |
| Society | Economic development | Jobs created percentage | Number of jobs employed by the assessed factory/Average number of jobs absorbed | √ |
| Annual gross product contribution level | Annual gross product of the assessed factory/Annual average gross product | √ | ||
| Responses to sustainability issues | Response to hot social issues | YES/NO | × | |
| Technology development | Application of new technology, material, process, and equipment | YES/NO | × | |
| Indicator | Indicator Value | Normalized Value |
|---|---|---|
| Quantitative indicator | ||
| Labor dispute ratio; Percentage of weekly overtime hours | 0~20% | 1 |
| 20~40% | 0.5 | |
| 40~60% | 0 | |
| 60~80% | −0.5 | |
| 80~100% | −1 | |
| Union participation ratio; Average salary ratio; Minimum salary worker ratio; Timely salary payment; Female labor force ratio; Female employee salary coefficient; Usage rate of protective equipment; Insurances and housing fund proportion; Proportion of local employees; Jobs created percentage; Annual gross product contribution level | 0~20% | −1 |
| 20~40% | −0.5 | |
| 40~60% | 0 | |
| 60~80% | 0.5 | |
| 80~100% | 1 | |
| Save construction time | 0~10% | −1 |
| 10~20% | −0.5 | |
| 20~30% | 0 | |
| 30~40% | 0.5 | |
| 40~100% | 1 | |
| Semi-quantitative indicator | ||
| Whether the total weekly working hours exceed the legal working hours; Discrimination in hiring; Workplace injury accident; Impact of production activities on local living environment | Yes | −1 |
| No | 1 | |
| Building quality improvement; Response to hot social issues; Application of new technology, material, process, and equipment | Yes | 1 |
| No | −1 | |
| Workplace | Shares | Working Years | Shares | Educational Background | Shares |
|---|---|---|---|---|---|
| Administrative departments | 7% | <3 years | 7% | Junior college | 14% |
| Prefabrication factories | 29% | 3–5 years | 14% | Undergraduate | 21% |
| Scientific research institutions | 50% | 5–10 years | 21% | Postgraduate | 29% |
| Other | 14% | >10 years | 58% | Doctoral candidate | 36% |
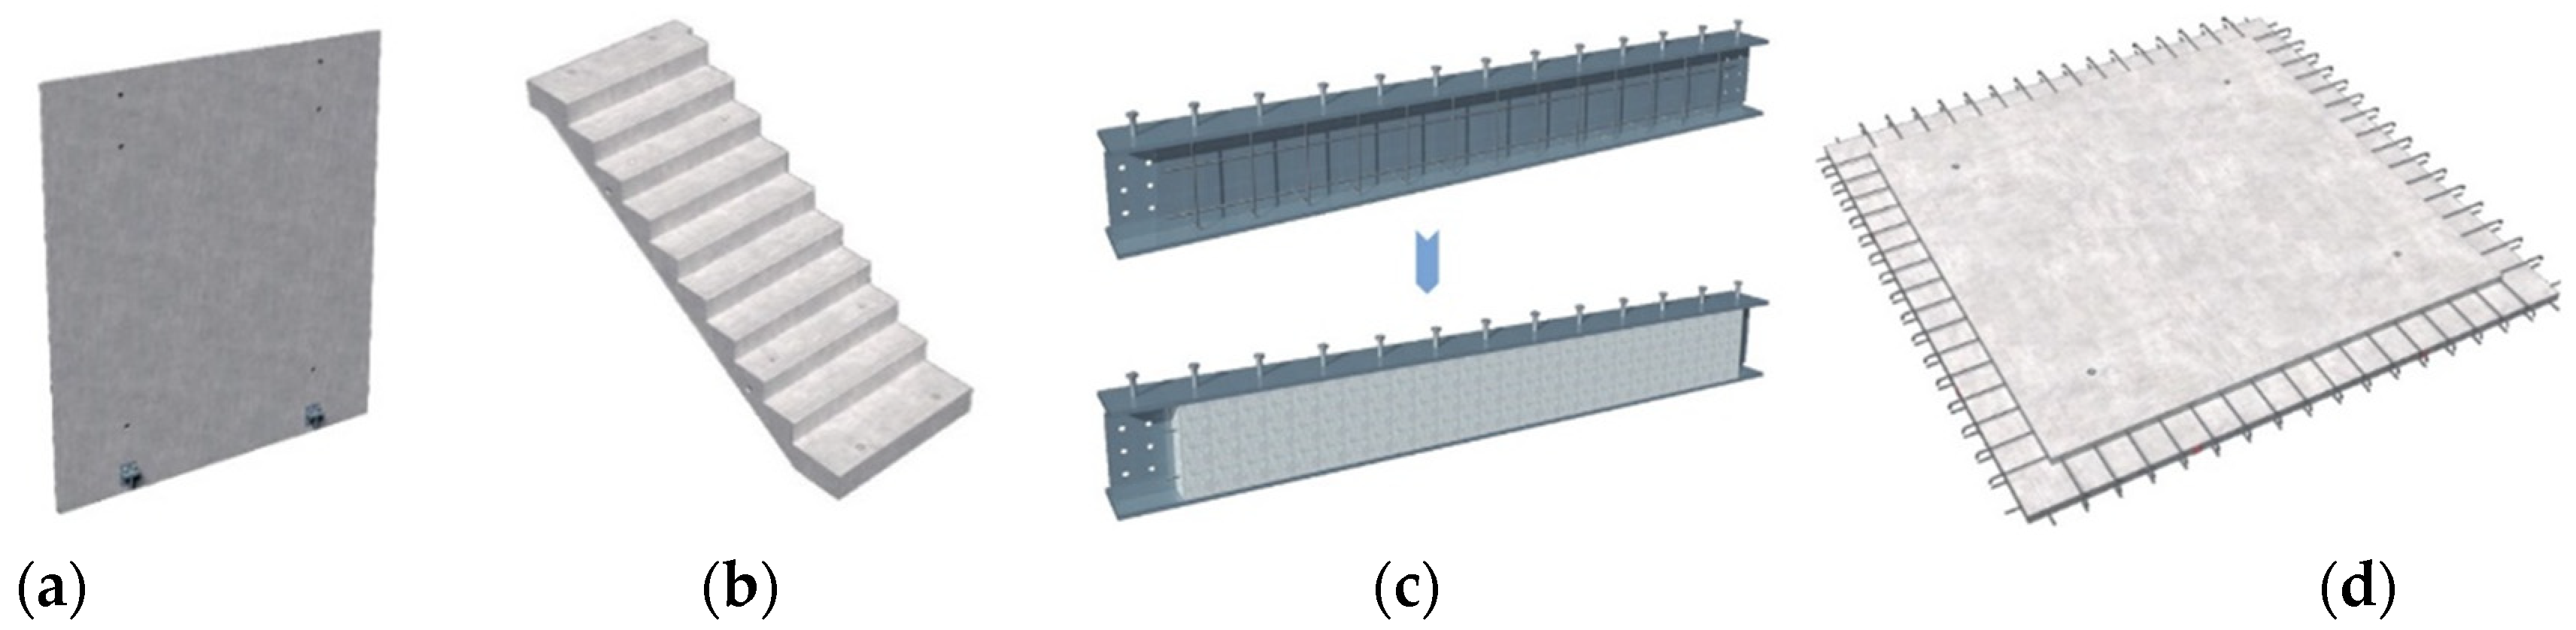
| Serial Number | Component Type | Volume | Production Organization Mode |
|---|---|---|---|
| 1WQB-3 | Interior wallboard | 1.19 m3 | Fixed line workshop |
| LTLT1 | Precast stair | 0.62 m3 | Fixed line workshop |
| PCL1 | Composite beam | 1.10 m3 | PEC workshop |
| 2DBS-145 | Composite floor slab | 0.44 m3 | Assembly line workshop |
| Parameter | Rangeability | Interior Wallboard | Precast Stairs | Composite Beam | Composite Floor Slab |
|---|---|---|---|---|---|
| Material scrap rate | −10.00% | −1.58 | 1.19 | 6.01 | −0.80 |
| 10.00% | 2.78 | −0.85 | −3.78 | 0.75 | |
| Transport distance variation coefficient | −10.00% | 0.00 | −0.06 | −0.04 | 0.08 |
| 10.00% | 0.00 | 0.06 | 0.04 | −0.08 | |
| Machinery operation rate | −10.00% | 0.00 | 0.72 | −1.37 | 0.43 |
| 10.00% | 0.00 | −0.61 | 1.19 | −0.33 | |
| Effective working utilization rate | −10.00% | −0.15 | −1.51 | 0.86 | 0.00 |
| 10.00% | 0.13 | 0.96 | −0.54 | 0.00 | |
| Machinery cost | −10.00% | 0.41 | −0.15 | −0.38 | 0.00 |
| 10.00% | −0.41 | 0.15 | 0.39 | 0.00 | |
| Minimum worker salary worker ratio | −10.00% | 0.00 | 0.00 | 0.00 | 0.00 |
| 10.00% | 0.00 | 0.00 | 0.00 | 0.00 | |
| Proportion of local employees | −10.00% | 0.00 | 0.00 | 0.00 | 0.00 |
| 10.00% | 0.00 | 0.00 | 0.00 | 0.00 | |
| Saved construction–time ratio | −10.00% | −4.07 | 0.00 | 1.19 | 1.19 |
| 10.00% | 3.73 | 0.00 | −0.78 | −0.78 | |
| Percentage of jobs created | −10.00% | 0.00 | 0.00 | 0.00 | 0.00 |
| 10.00% | 0.00 | 0.00 | 0.00 | 0.00 |
Disclaimer/Publisher’s Note: The statements, opinions and data contained in all publications are solely those of the individual author(s) and contributor(s) and not of MDPI and/or the editor(s). MDPI and/or the editor(s) disclaim responsibility for any injury to people or property resulting from any ideas, methods, instructions or products referred to in the content. |
© 2023 by the authors. Licensee MDPI, Basel, Switzerland. This article is an open access article distributed under the terms and conditions of the Creative Commons Attribution (CC BY) license (https://creativecommons.org/licenses/by/4.0/).
Share and Cite
Chen, X.; Su, S.; Yuan, J.; Li, J.; Lou, F.; Wang, Q. Analyzing the Environmental, Economic, and Social Sustainability of Prefabricated Components: Modeling and Case Study. Sustainability 2024, 16, 342. https://doi.org/10.3390/su16010342
Chen X, Su S, Yuan J, Li J, Lou F, Wang Q. Analyzing the Environmental, Economic, and Social Sustainability of Prefabricated Components: Modeling and Case Study. Sustainability. 2024; 16(1):342. https://doi.org/10.3390/su16010342
Chicago/Turabian StyleChen, Xu’anzhi, Shu Su, Jingfeng Yuan, Jiaming Li, Feng Lou, and Qinfang Wang. 2024. "Analyzing the Environmental, Economic, and Social Sustainability of Prefabricated Components: Modeling and Case Study" Sustainability 16, no. 1: 342. https://doi.org/10.3390/su16010342
APA StyleChen, X., Su, S., Yuan, J., Li, J., Lou, F., & Wang, Q. (2024). Analyzing the Environmental, Economic, and Social Sustainability of Prefabricated Components: Modeling and Case Study. Sustainability, 16(1), 342. https://doi.org/10.3390/su16010342