Article

Effect of Mechanical Properties on Performance of Cold Mix Asphalt with Recycled Aggregates Incorporating Filler Additives

by
Pinki Meena
*,
Gondaimei Ransinchung Rongmei Naga
and
Praveen Kumar
Civil Engineering Department, Indian Institute of Technology Roorkee, Haridwar 247667, India
*
Author to whom correspondence should be addressed.
Sustainability 2024, 16(1), 344; https://doi.org/10.3390/su16010344
Submission received: 31 October 2023 / Revised: 6 December 2023 / Accepted: 13 December 2023 / Published: 29 December 2023

Abstract

:
The utilization of recycled asphalt pavement in the construction and maintenance of flexible pavement with asphalt emulsion is advantageous and environmentally friendly. It saves energy due to zero heat loss during the mixing and laying of pavement compared to hot mix asphalt. Recycled asphalt pavement (RAP) is a sustainable material in place of virgin aggregates in road construction. The focus of this study is (i) virgin aggregate production, (ii) the utilization of waste material (additive), (iii) reducing the production temperature, and (iv) recycled RAP material in the pavement. This paper attempts to create a venue for using RAP greater than 50% during pavement construction. Cold mix asphalt (CMA) containing 0%, 50%, and 100% RAP materials with different dosages of cement, fly ash, and Stabil-road at 1%, 2%, and 3% of dry aggregate weight were used for ascertaining the mechanical and volumetric properties of mixtures. The mechanical properties for CMA samples, such as stability, tensile strength, moisture susceptibility, stiffness modulus, and the abrasion loss of CMA samples, were evaluated with and without RAP incorporation. Present laboratory studies revealed that a cold mix containing 50% RAP materials produced a higher stability value than the control mix, irrespective of the types of additives in its contents. All the additives can potentially resist moisture damage in the mix. Also, a significant improvement in the resilient modulus was considered for RAP-incorporated mixtures with the additives.

1. Introduction

Cold mix asphalt (CMA) technology is a novel technique that is friendlier to the environment. There is no heat consumption during pavement construction [1,2,3,4]. Most Pavement Industries use recycled asphalt pavement (RAP) in the construction of hot mix asphalt (HMA) and warm mix asphalt (WMA). As per the European Asphalt Pavement Association 2018, CMA mixtures contained 0.297% and 3.81% RAP in the USA and Europe, respectively. The RAP used in CMA mixtures was much less than HMA and WMA in 2018 [5,6]. RAP in CMA design reduced raw materials, asphalt demand, and greenhouse gas emissions [7,8]. The most common test in cold mix asphalt to measure the resistance of the asphalt mix under indirect tension is the indirect tensile strength (ITS) test. The mechanical properties such as tensile strength and resilient modulus (MR) of CMA samples were increased due to increasing curing time and decreasing test temperature (−10 °C, 5 °C, and 25 °C), and recommended that the effect of temperature was more prominent than curing time [9,10]. Four recycling technologies namely hot in-plant, hot in-place, cold in-plant, and cold in-place recycling technology are used nowadays. Cold recycling technology is environmentally friendly and consumes less energy [11,12,13]. Quan Li investigated the performance of cold recycled asphalt mixtures (CRAMs) using fly ash (FA) and cement as filler at different dosages and found that during long-term aging, the tensile strength of CRAMs with FA was higher than those with cement. Thus, the mineral filler (cement) should be replaced by industrial waste (FA) due to less consumption and reduced CO2 emissions [14]. As for the compaction process of the CMA specimen, some methods, such as the Marshall compactor and Superpave gyratory compactor (SGC), have been developed to optimize the mixture. The CMA specimens with RAP were crushed in the Marshall compactor; therefore, their stability was reduced, and the flow value increased. The cold recycled asphalt mix specimens with cement additive, prepared in SGC, had a higher tensile strength under both conditions (dry and wet) and lower density [15]. Liu et al. recommended that the Superpave gyratory compactor be used to design cold in-place recycling technology during the compaction of samples [16].
Natural resources are decreasing daily, so an alternative is required in pavement construction. After going through various studies, it was found that recycled asphalt pavement is a good alternative to natural aggregate for HMA and WMA, but in CMA design, there is less use of RAP. The cold asphalt mixes are used in the base layer due to their lower strength compared to HMA. The strength of CMA may be enhanced by incorporating active fillers, and CMA can be used on high-volume traffic roads. The CMA technique requires abundant natural aggregates and petroleum, which are considered non-renewable resources. RAP is used in place of renewable sources and recycled concrete aggregate [17,18,19,20]. Flores et al. (2019) evaluated the mechanical properties of the cold recycled mix, such as ITS, water sensitivity, wheel tracking, stiffness modulus, and the fatigue of the mix, through emulsification and 100% RAP aggregates. They also determined that the global performance index (GPI) = ( I Air Voids + Istiffness + IITS + IITSR + IWTS + IFatigue)/6, which indicates the behavior of the mixture. A higher GPI value indicates a better performance of the mix. The major issues in CMA are high air voids, less strength, and a long curing period. Air voids are reduced using a higher quantity of additives and emulsion content, which are considered CMA binders. Binder content boosts the efficiency in reducing air voids and filling the gaps among RAP particles [21,22]. Flores et al. used 3% pre-mix water in cold mix asphalt with 100% RAP and cured the Marshall samples at 50 °C for three days, and the air voids were evaluated between 10 and15% for cold recycled mix (CRM). The specimen’s dimension for CRM was 100 mm in diameter and 60 mm in height, with a recommended compaction energy of 100 gyrations [23].
Arimilli et al. studied RAP (0%, 30%, 50%, 60%, 70%, and 80%) with cold emulsified mixtures and observed that the RAP does not act as a black rock. The results, including the wheel tracking test, resilient modulus, dynamic creep, and fatigue life of mixes with RAP, were affected due to the presence of a binder in the RAP content. Rut depth was reduced by increasing the RAP content from 30% to 80% at 45 °C [24]. Ayar 2018 studied the effects of various additives such as lime, cement, coal waste ash, FA, and rice husk ash on a recycled cold mix and found that cement is a good additive that acts as an accelerator during emulsion-breaking and increases the stiffness of the mix [25].
In this study, the authors concluded that incorporating additives like fly ash, ordinary Portland cement, and chemical additive (Stabil-road) enhances the Marshall stability, ITS, and resilient modulus of CMA mix and reduces the abrasion loss of a mix with 50% RAP and 100% RAP.

Research Objective and Significance

The objective of this study is the incorporation of a high proportion of RAP content (≥50%) in dense bituminous macadam (DBM) courses to reduce the use of natural aggregates. The primary outcome of this paper is to show the results of performance of cold recycled asphalt mixture technology using different dosages of additives (cement, FA, and SR) in amounts of 1%, 2%, and 3% of dry aggregate weight with a bitumen emulsion binder.

2. Materials and Methods

2.1. Materials

2.1.1. Virgin Aggregates and RAP

While studying cold recycled asphalt mixtures (CRAMs) in the laboratory, materials like coarse and fine virgin aggregates (VA), recycled asphalt pavement, and various filler additives were used in the sample preparation. The virgin materials were collected from a local quarry in Roorkee, Uttarakhand, India. VA and RAP’s mechanical and physical properties were evaluated per the requirement specified in the Indian Scenario (presented in Table 1) [26,27]. The recycled material was collected near the National Highway in the Uttar Pradesh state of India and was almost eight years old. The collected RAP materials were crushed into smaller sizes in a thermostatically controlled oven for 48 h by maintaining 100 °C temperature. Based on the literature, the RAP dosages were selected as 0%, 50%, and 100% in place of virgin aggregates when constructing CRAMs [24,28,29,30,31].
The binder content of RAP was extracted to be 5% by aggregate weight using the centrifuge rotavapor extraction method [32]. The physical properties of the extracted RAP binder and bitumen emulsion (CSS2) are shown in Table 2. After going through various works of literature, the RAP material was selected in amounts of 0%, 50%, and 100% of the total dry aggregate weight. The aggregate gradation of the CMA with 50% and 100% RAP was within limits as per MORT&H specifications (Figure 1), and their physical appearance is shown in Figure 2.

2.1.2. Additives

In this research, three additives, ordinary Portland cement (C), FA, and chemical additive, were used to improve the strength and workability of the CMA. It can be seen from Table 3 that the cement is rich in calcite, aluminate, halite, and periclase. The specific gravity of cement was evaluated at 3.15 gm/cc, and its consistency was determined to be 3%. Another filler used in this study was FA, an industrial waste product with a high amount of coesite, aragonite, and lime. The additive FA was collected from a thermal power plant in Kota, Rajasthan, India. It is a coal waste product that comes from the thermal plant in a dry state and is transported to the cement industry in liquid form in a cylindrical container. The specific gravity and water absorption of FA were evaluated as 2.608 gm/cc and 0.54%, respectively. The third filler additive was a chemical additive, Stabil-road (SR), used in the CMA design, and has a specific gravity of 2.57 gm/cc. It was supplied by M/S Viswa Samudra Pvt. Ltd. Hyderabad, India. The chemical additive is rich in aluminum oxide, nitrogen oxide, and quartz.
The chemical compositions of the filler additive used in the recycled cold mix studied were identified by X-ray Diffraction (XRD) analysis, as presented in Table 3. Figure 3a–c represent the XRD analysis of the filler additives. XRD analysis is a high-tech, non-destructive technique for analyzing materials and their characterization. The microscopic images of filler additives shown in Figure 4, Figure 5 and Figure 6 were obtained using scanning electron microscope (SEM) imaging using a Carl Zeiss Gemini FE-SEM so that the shape and texture of the fillers can be seen.

2.1.3. Binder

There are two types of bitumen emulsion used in the cold mix design: one is cationic and the other one is anionic bitumen emulsion. This study used a cationic bitumen emulsion due to its higher strength and elastic modulus than anionic bitumen emulsions. A cationic slow-setting bitumen emulsion binder was used to mix the VA with grade 2 RAP materials; therefore, the binder was named CSS2. CSS2 was collected from Supreme Tar Products Karnal, Haryana, India. The binder is a two-phase system that adds water, bitumen, and one more additive to enhance its formation and stabilization. Soft water (with calcium amounts less than 75 ppm) is used to create a bitumen emulsion [39]. Additives are added along with CSS2 before emulsification to improve uniform particle size, storage stability, curing, and adhesion to aggregates. Additives are being used for higher strength and resistance to water damage. The bitumen emulsion was formulated with a high bitumen residue content (60% by weight of CSS2). The detailed properties of the bitumen residue were determined and are shown in Table 2.

2.2. Methods

This study designed the CMA per procedure based on the Asphalt Institute MS 14 and Thanaya [40]. The flow chart of specimen casting for CMA mixtures with 0%, 50%, and 100% RAP using different additives in the SGC compactor is shown in Figure 7. RAP was used as an aggregate at room temperature.
Aggregate gradation was determined for CMA mix I (50% VA + 50% RAP) and mix II (0% VA+ 100% RAP) as per the Ministry of Roads Transport and Highways, as shown in Figure 1. The moisture content of the air-dried sample was evaluated as per the ASTM D2216 [41]. The initial emulsion content (IEC) of the CMA mix was determined using the following Equation:
I E C = ( 0.05 A + 0.10 B + 0.50 C ) 0.70
where A = the percentage of retained aggregate weight on a 2.36 mm sieve, B = the percentage of aggregate passing through a 2.36 mm and retained on a 0.075 mm sieve, C = the percentage of aggregate passing through a 0.075 mm sieve.
As per the Asphalt Institute MS14 [42], 100% coating is preferred, but it is acceptable if the minimum coating is 75% for the surface and 50% for the base course. This study achieved a 95% coating of the CMA mix without additives. With aggregate gradation being A = 66.84%, B = 28.75%, and C = 4.41%, the percentage by weight of emulsion content was 5.90%. The emulsion used in this research has 60% bitumen and 40% water content; this shows that the emulsion demand required for mixtures was 9% of the dry aggregate weight. The quantity of the new bituminous binder (Pnb) was measured using the Asphalt Institute (2007) manual series (MS-20) and was calculated using the following equation:
P n b = P ( ( 100 r ) P s b ) / 100
where r = the percent of VA to be added in the recycled mix, and Psb = the average value of bitumen content in RAP. If a 50% RAP mixture is considered, Pnb is calculated as 3.40%. Therefore, specimens prepared with an increased emulsion content starting from 4.8% (with an increment of 0.6%). CMA mixes were prepared per the IRC SP:100 [42,43,44], and samples were prepared in SGC with different CSS2 contents.
In this research, 21 types of cold mixes are designed, as indicated in Figure 8: one control mix and 20 mixes with varying additives and RAP. The control mix was prepared without additives and termed CM, and the rest of the mixtures were designed with 50% and 100% RAP, termed 50R and 100R, respectively, using additives from 1% to 3% with a 1% increment—a mixture with 50% RAP and 1% ordinary Portland cement as the additive was 50R1C. Likewise, 50R2C and 50R3C indicate a recycled cold mix (RCM) with 2% and 3% ordinary Portland cement as additives. A recycled cold mix of 50R with 1%, 2%, and 3% FA and 1%, 2%, and 3% SR additives were termed 50R1FA, 50R2FA, 50R3FA, 50R1SR, 50R2SR, and 50R3SR, respectively. Likewise, a 100R RCM with cement, FA, and SR additives in 1%, 2%, and 3% increments were termed 100R1C, 100R2C, 100R3C, 100R1FA, 100R2FA, 100R3FA, 100R1SR, 100R2SR, and 100R3SR, respectively.

2.3. Experimental Program

2.3.1. Marshall Stability (MS)

The stability of the studied Recycled cold mixtures (RCM) was estimated as per the ASTM D6927 [45]. Cylindrical specimens were cast to create 3 samples for each CMA mix with a diameter of 100 mm and height of 63.5 ± 2.5 mm at their optimum emulsion content. The samples were kept in the water bath for 30–40 min at room temperature (25 °C). Afterward, the CMA samples were placed onto the Marshall testing machine. The maximum load at failure was known as the Marshall stability. The flow value was noted for maximum load at failure sustained by the sample, maintaining a constant loading rate (50.8 mm/min). The flow value shows the vertical deformation at the failure of the Marshall sample. The ratio of Marshall stability to flow value was estimated and termed as the Marshall Quotient (Mq), and Mq is the measure of recycled cold mix resistance to rutting. A higher value of Mq represents a stiffer and more resistant material to permanent deformation (Behnood et al., 2015).

2.3.2. Indirect Tensile Strength Test

The ITS of bituminous mixes shows the ability of the binder to bind the aggregates together in dry and wet conditions. The ITS of CMA mixes was estimated as per the ASTM D6931 [46] to resist cracking in bituminous mixtures. The ITS of conditioned and unconditioned RCM specimens was evaluated by incorporating filler additives. To determine the specimen’s unconditioned (dry) ITS, the Marshall samples were soaked in a water bath for 2 h at 25 °C. After 2 h, the specimens were extracted from the water bath. A 50.8 mm/min loading rate was applied on cylindrical specimens across their vertical diametrical plane in the Marshall testing machine. The peak load at failure, at which point cracks were developed, was determined. Thus, dry ITS (unconditioned ITS) was calculated using Equation (3). Afterward, the Marshall samples were soaked in the water bath for 23 h at a temperature of 40 °C, and samples were left for the remaining one hr. at 25 °C in a water bath. The samples were removed from the water bath, and the peak load at failure was recorded, which was used to evaluate the relative quality of the asphalt mixtures. Using this process, the wet ITS (conditioned ITS) was determined as follows:
I T S = 2 L / π D H
where:
L = the peak load at failure at which vertical cracks developed;
D = the diameter of the Marshall specimen in mm;
H = the height of the Marshall specimens in mm.
Afterward, the tensile strength ratio (TSR) of recycled cold mixtures was evaluated based on the ratio of wet ITS to dry ITS in percentages. It was analyzed to determine the moisture susceptibility of CMA mixtures, which depends on aggregate types. TSR is the result of the separation and removal of binder from the aggregate surface in the presence of moisture, and the TSR was analyzed as follows:
T S R = ( ( w e t   I T S ) / ( d r y   I T S ) ) 100

2.3.3. Resilient Modulus (RM) Test

Determining the RM of the bituminous mix specimens involves a non-destructive test used to analyze the effects of temperature, loading rate, and rest periods on emulsified mixtures. The RM values can be used to assess the relative quality of materials and generate input for pavement design and analysis. The test was performed per the ASTM D7369 [47] standard testing method at different pavement temperatures (5 °C, 25 °C, and 40 °C) with 0.33 Hz, 0.5 Hz, and 1 Hz frequencies using a Universal Testing Machine (UTM-14). The specimens were kept in the temperature control unit of the UTM apparatus for 24 h before the test. Afterward, the specimen was positioned under loading in the UTM machine, and input parameters were inserted, like contact load (10% of dry ITS), Poisson’s ratio (depends upon temperature), and rest period (0.9 s). In this method, the horizontal deformations were measured with the help of linear variable differential transducers (LVDTs). LVDTs were attached to the surface of the Marshall specimen on both sides. The instantaneous and recoverable horizontal deformations were measured with the help of LVDTs, and the sum of deformations is the total deformation representing the material’s viscoelastic behavior. The RM test was performed to grasp the effect of temperature and load on the materials.

2.3.4. Abrasion Resistance

The Cantabro test was carried out on CMA mixes to evaluate the cohesion and bonding between aggregates and binders. It will assess their resistance to impact. The abrasion resistance of RCM mixes was evaluated as per the ASTM D7064 [48]. In this study, three cylindrical specimens with a diameter of 101 mm and height of 63 mm for each mix were prepared, and all samples were tested for abrasion loss at a testing temperature of 25 °C. The RCM samples were sustained in the Los Angeles Abrasion (LAA) machine for about 9–10 min without abrasive charge at a 30–33 rev./min speed. The weight of the specimen was noted before and after the test, and the percent difference was calculated as the abrasion loss.

3. Results and Discussions

3.1. Selection of Optimum Emulsion Content (OEC)

All CMA samples (with and without RAP) were compacted in a Superpave gyratory compactor (SGC) with 80–110 gyrations. The volumetric properties (MS, dry density, total voids, and voids in mineral aggregates) of the CMA mixtures with 0% RAP, 50% RAP, and 100% RAP aggregates were determined per the Asphalt Institute MS-14. The relationship between MS, dry density, air voids, and voids in mineral aggregate (VMA) vs. bitumen residue is presented in Figure 9a–d. From Figure 9a,b, the maximum MS and maximum dry density were obtained at 6.60%, 5.40%, and 3.60% bitumen residue of the dry aggregate weight for the CM, 50R, and 100R mix, respectively. The minimum bitumen residue was required for the 100R mix only due to the presence of bitumen on RAP aggregates.
The minimum total voids were calculated as 14.08%, 5.52%, and 9.67% for CM, 50R, and 100R mix, respectively (Figure 9c), within the range of voids in the CMA mixes [43]. Minimum voids attained by 50R mixes among three mixes show that there were more 50R bonds between the aggregate and binder than the other mixes. RAP material has more fines than cold mixes without RAP mixes; therefore, voids are filled with fines, and less stripping occurs due to moisture [49,50].
The VMA value for mixes determines the durability performance of the cold mixtures, and the VMA results for all the cold mixes are shown in Figure 9d. For CMA design, the minimum VMA was taken as 14% per MORT&H specifications [51] for a 19 mm nominal maximum aggregate size. The VMA of the mix with and without RAP content was evaluated to be 26.75%, 17.14%, and 17.29% for the 0%, 50%, and 100% RAP mixes, respectively, without additives.
These results indicate that the optimum bitumen residue was selected at 6.60%, 5.40%, and 3.60% for the CM, 50R, and 100R mixes, respectively. It was observed from this study that the MS increased up to 50% RAP, but after 50% RAP, it was reduced (50R > 100R > CM). More voids were found in the CMA mix with 100% RAP compared to the CMA with 50% RAP due to the presence of more fines available in the 50R mixes, and they filled the interstices between aggregates [52]. The CMA mix design reduced CSS2 emulsion content with increasing RAP aggregate (CM > 50R > 100R) due to the presence of a binder on the RAP interface.

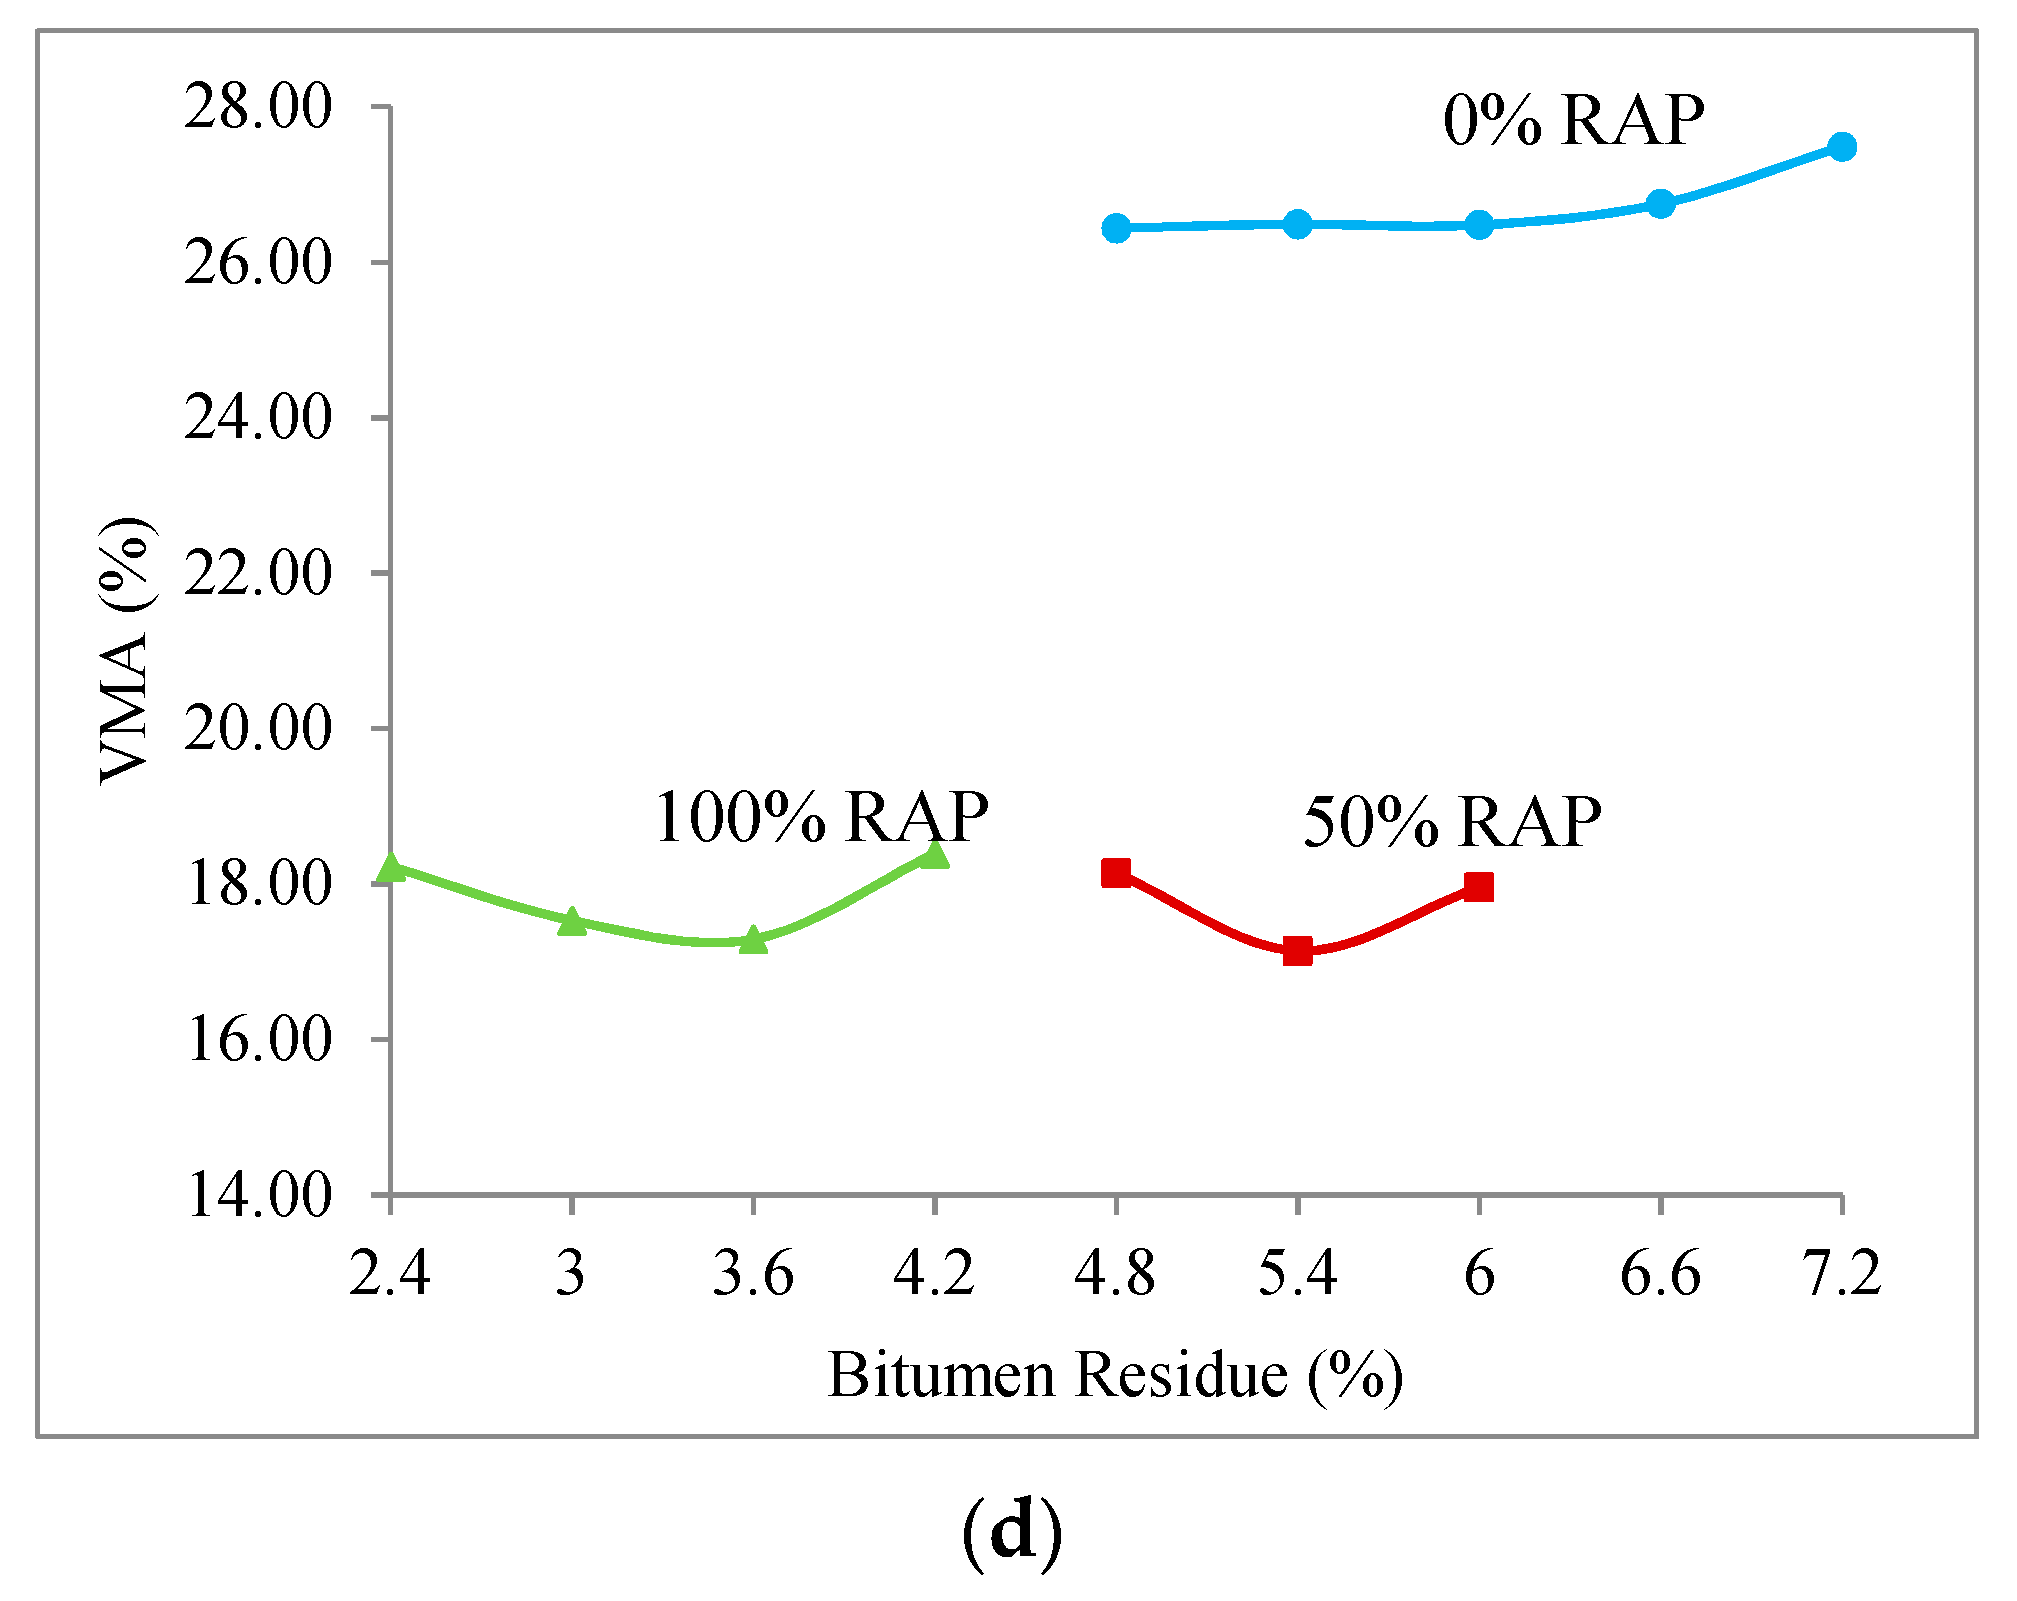
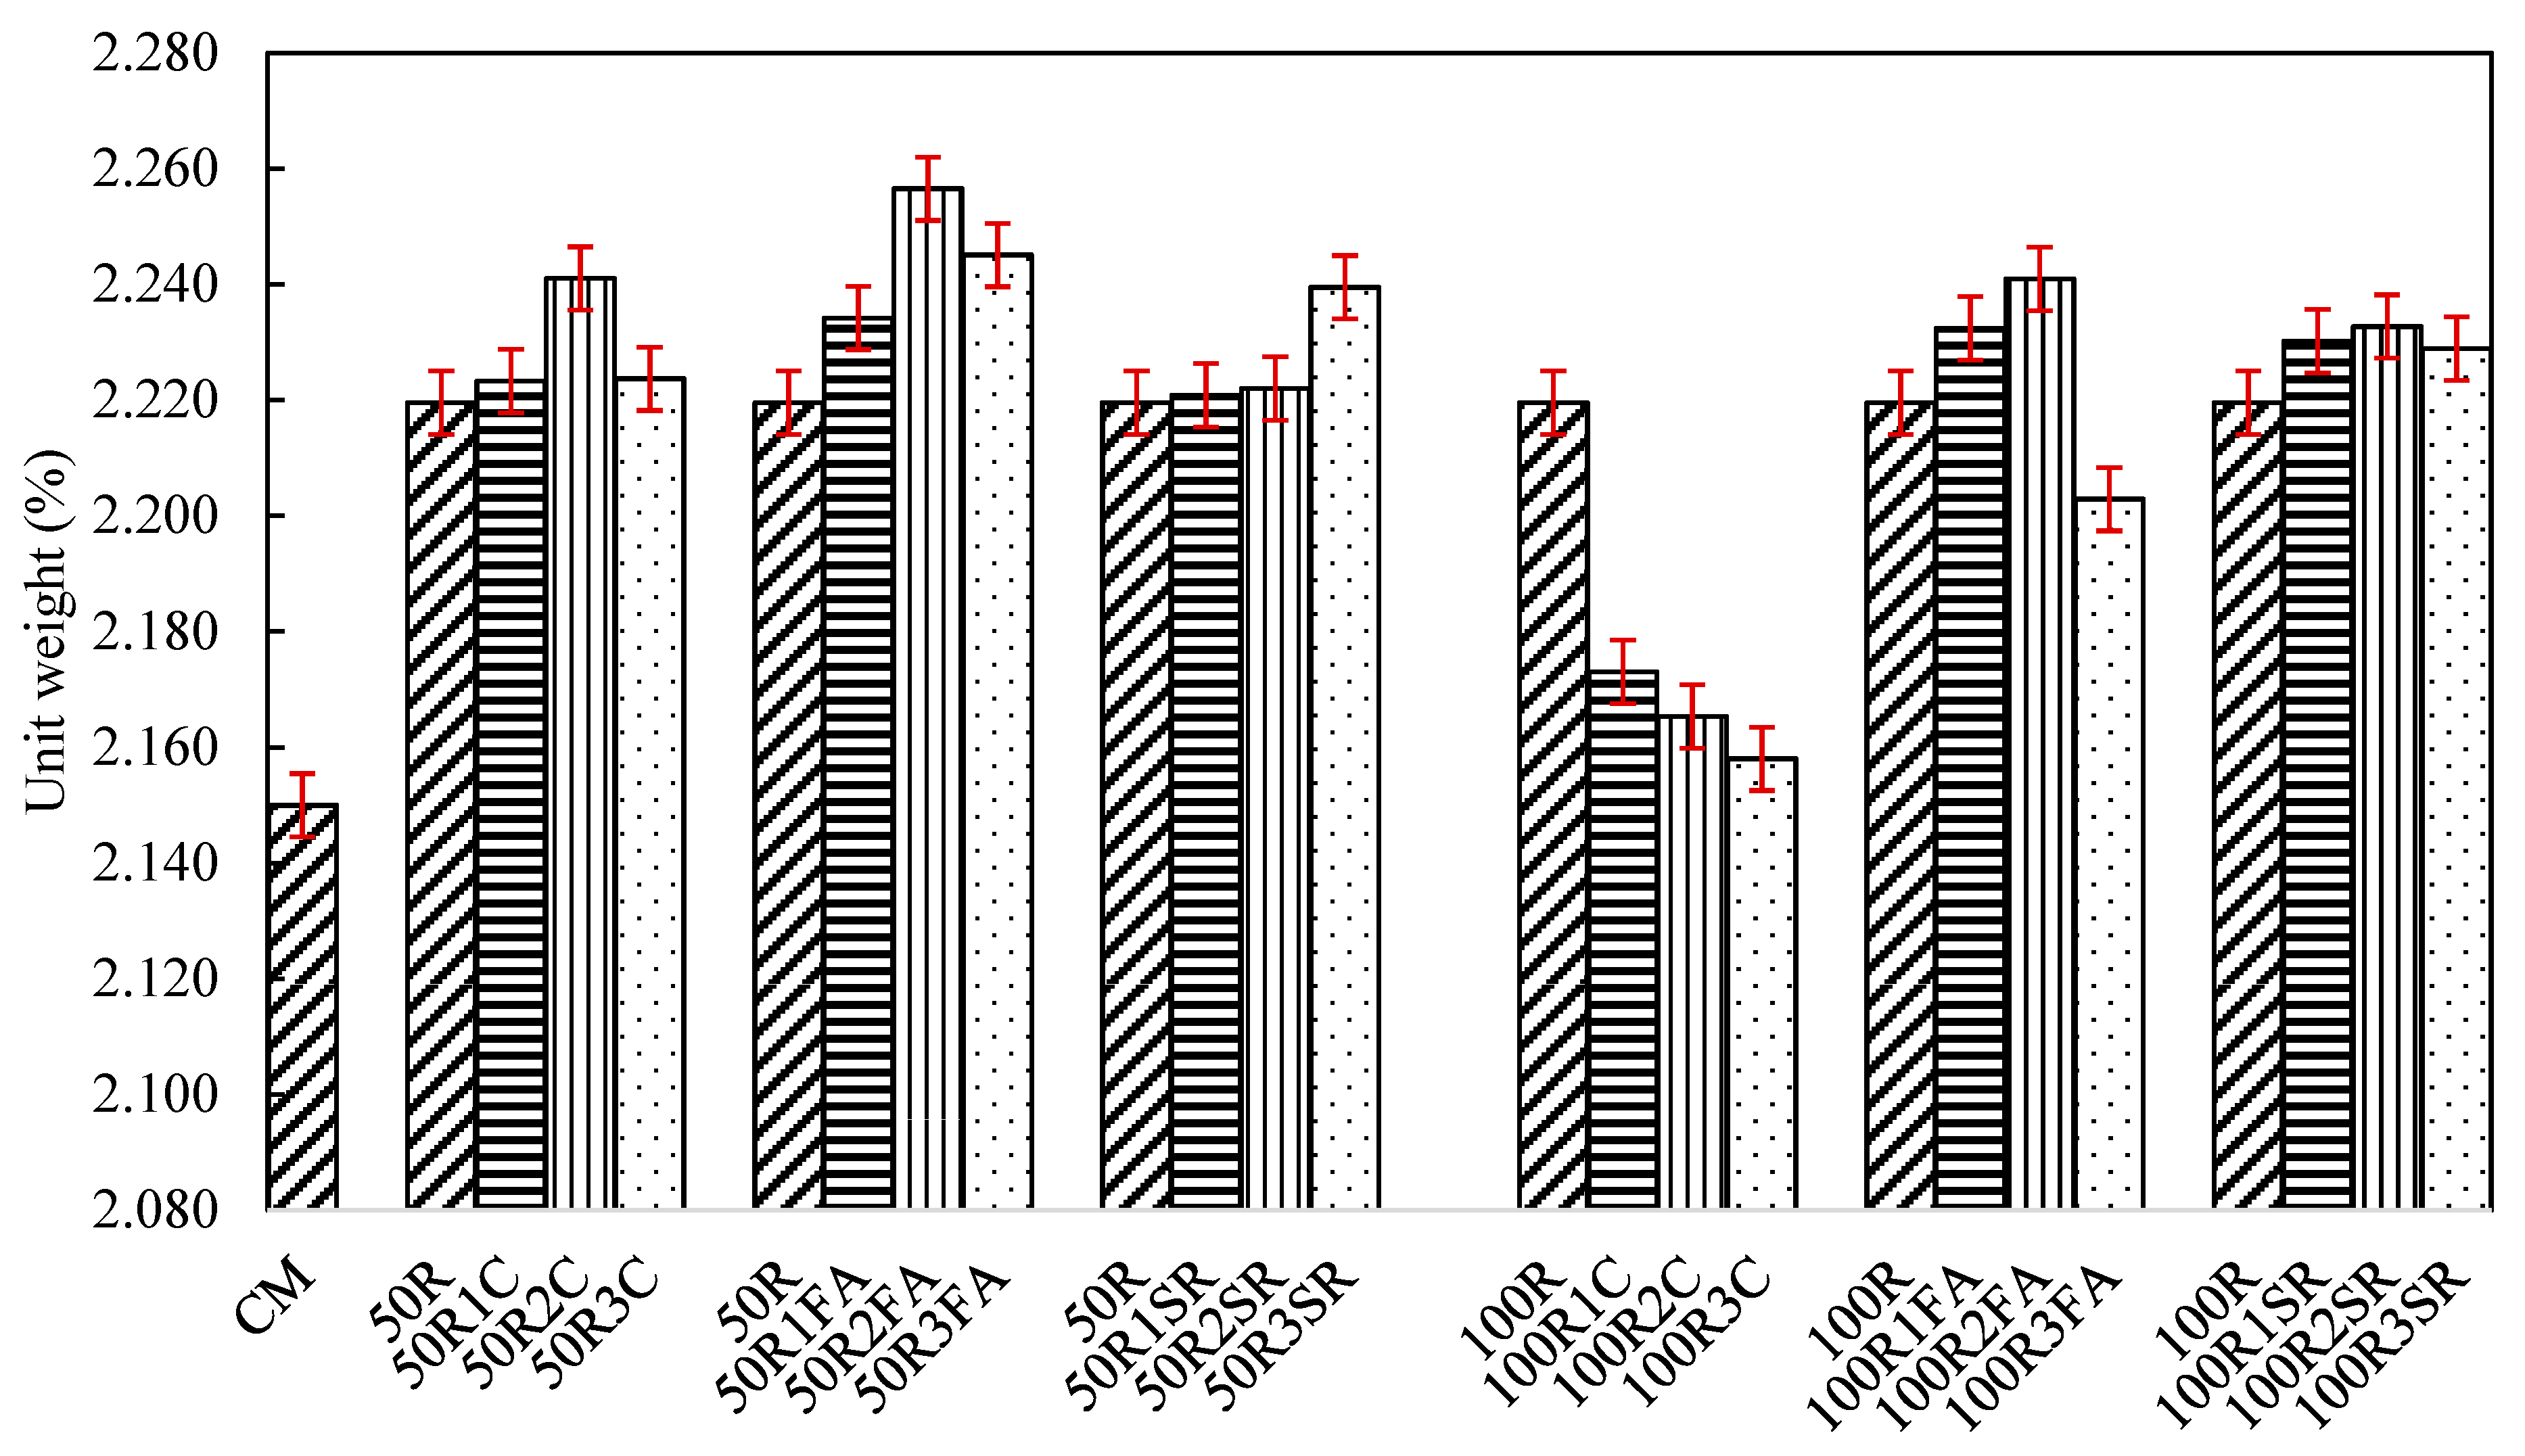
3.2. Volumetric Properties

All CMA mixtures with and without RAP were found to contain between 7 and14% voids, as graphically presented in Figure 10. The voids shown in CMA mixtures are higher than HMA (3–5%, as per MORT&H specifications) due to water in the binder (CSS2) used in the CMA mix design. Air voids decrease with increasing additive quantity (1 to 3%) in the 50% RAP mixtures, but voids increase with 100% RAP mixtures compared to CM and 50R due to the absence of fine particles in the 100R mix. The number of voids of the 100R mixtures increased with cement additives and were attributed to cement hydration with RAP. During the hydration process of CMA mixtures, water is absorbed by cement molecules, increasing the volume, so the number of voids increase in the mix. Also, some micro-voids were presented in the mix, so the emulsion did not penetrate these voids [53]. The number of voids in the mixes was reduced due to 50% RAP and increased due to 100% RAP compared to the control mix. With the addition of cement and FA as additives with the 50% RAP mixtures, the number of voids reduced by up to 2%, but at a 3% addition, the number of voids in the mixes increased. The results show that adding additives up to 2% has better results in cases with cement, FA, and chemical additives.
The VMA results for all the recycled CMAs indicate the durability performance of the bituminous mixtures described in Figure 11. For CMA design, the minimum VMA for 19 mm nominal maximum aggregate size (NMAS) is 14% per MoRTH specifications. The VMA of the CMAs with and without RAP content was determined to be 25.374%, 20.299%, and 18.915% for CM, 50R, and 100R, respectively, without any additives. By adding cement, FA, and SR fillers to the CMA mix with RAP, the VMA of the blend was reduced up to 2% in 50R mixes with filler additives due to the increasing unit weight of mixes. But in the case of 100R CRAMs with FA and SR additives, mixes are exposed to less moisture than 50R mixes, so they achieve fewer VMAs.
The unit weights of different CMA mixtures increased in the 50% RAP mix compared to the control CM mix, as graphically presented in Figure 12. This is due to the RAP binder covering the RAP aggregate on the outer surface (Figure 2), which has a higher unit weight than the control mix without RAP. Afterward, upon increasing the RAP percentages (100%), the unit weight decreased upon incorporating cement additives (up to 3%) due to the lower specific gravity of RAP aggregates compared to VA, as seen from the results presented in Table 1.
It is proposed that the maximum unit weight can be achieved by adding a 2% additive (cement or FA) with a 50% RAP-CMA mixture. The maximum dry density attained by mixes 50R2FA and 100R2FA was 2.257 gm/cc and 2.241 gm/cc, respectively.

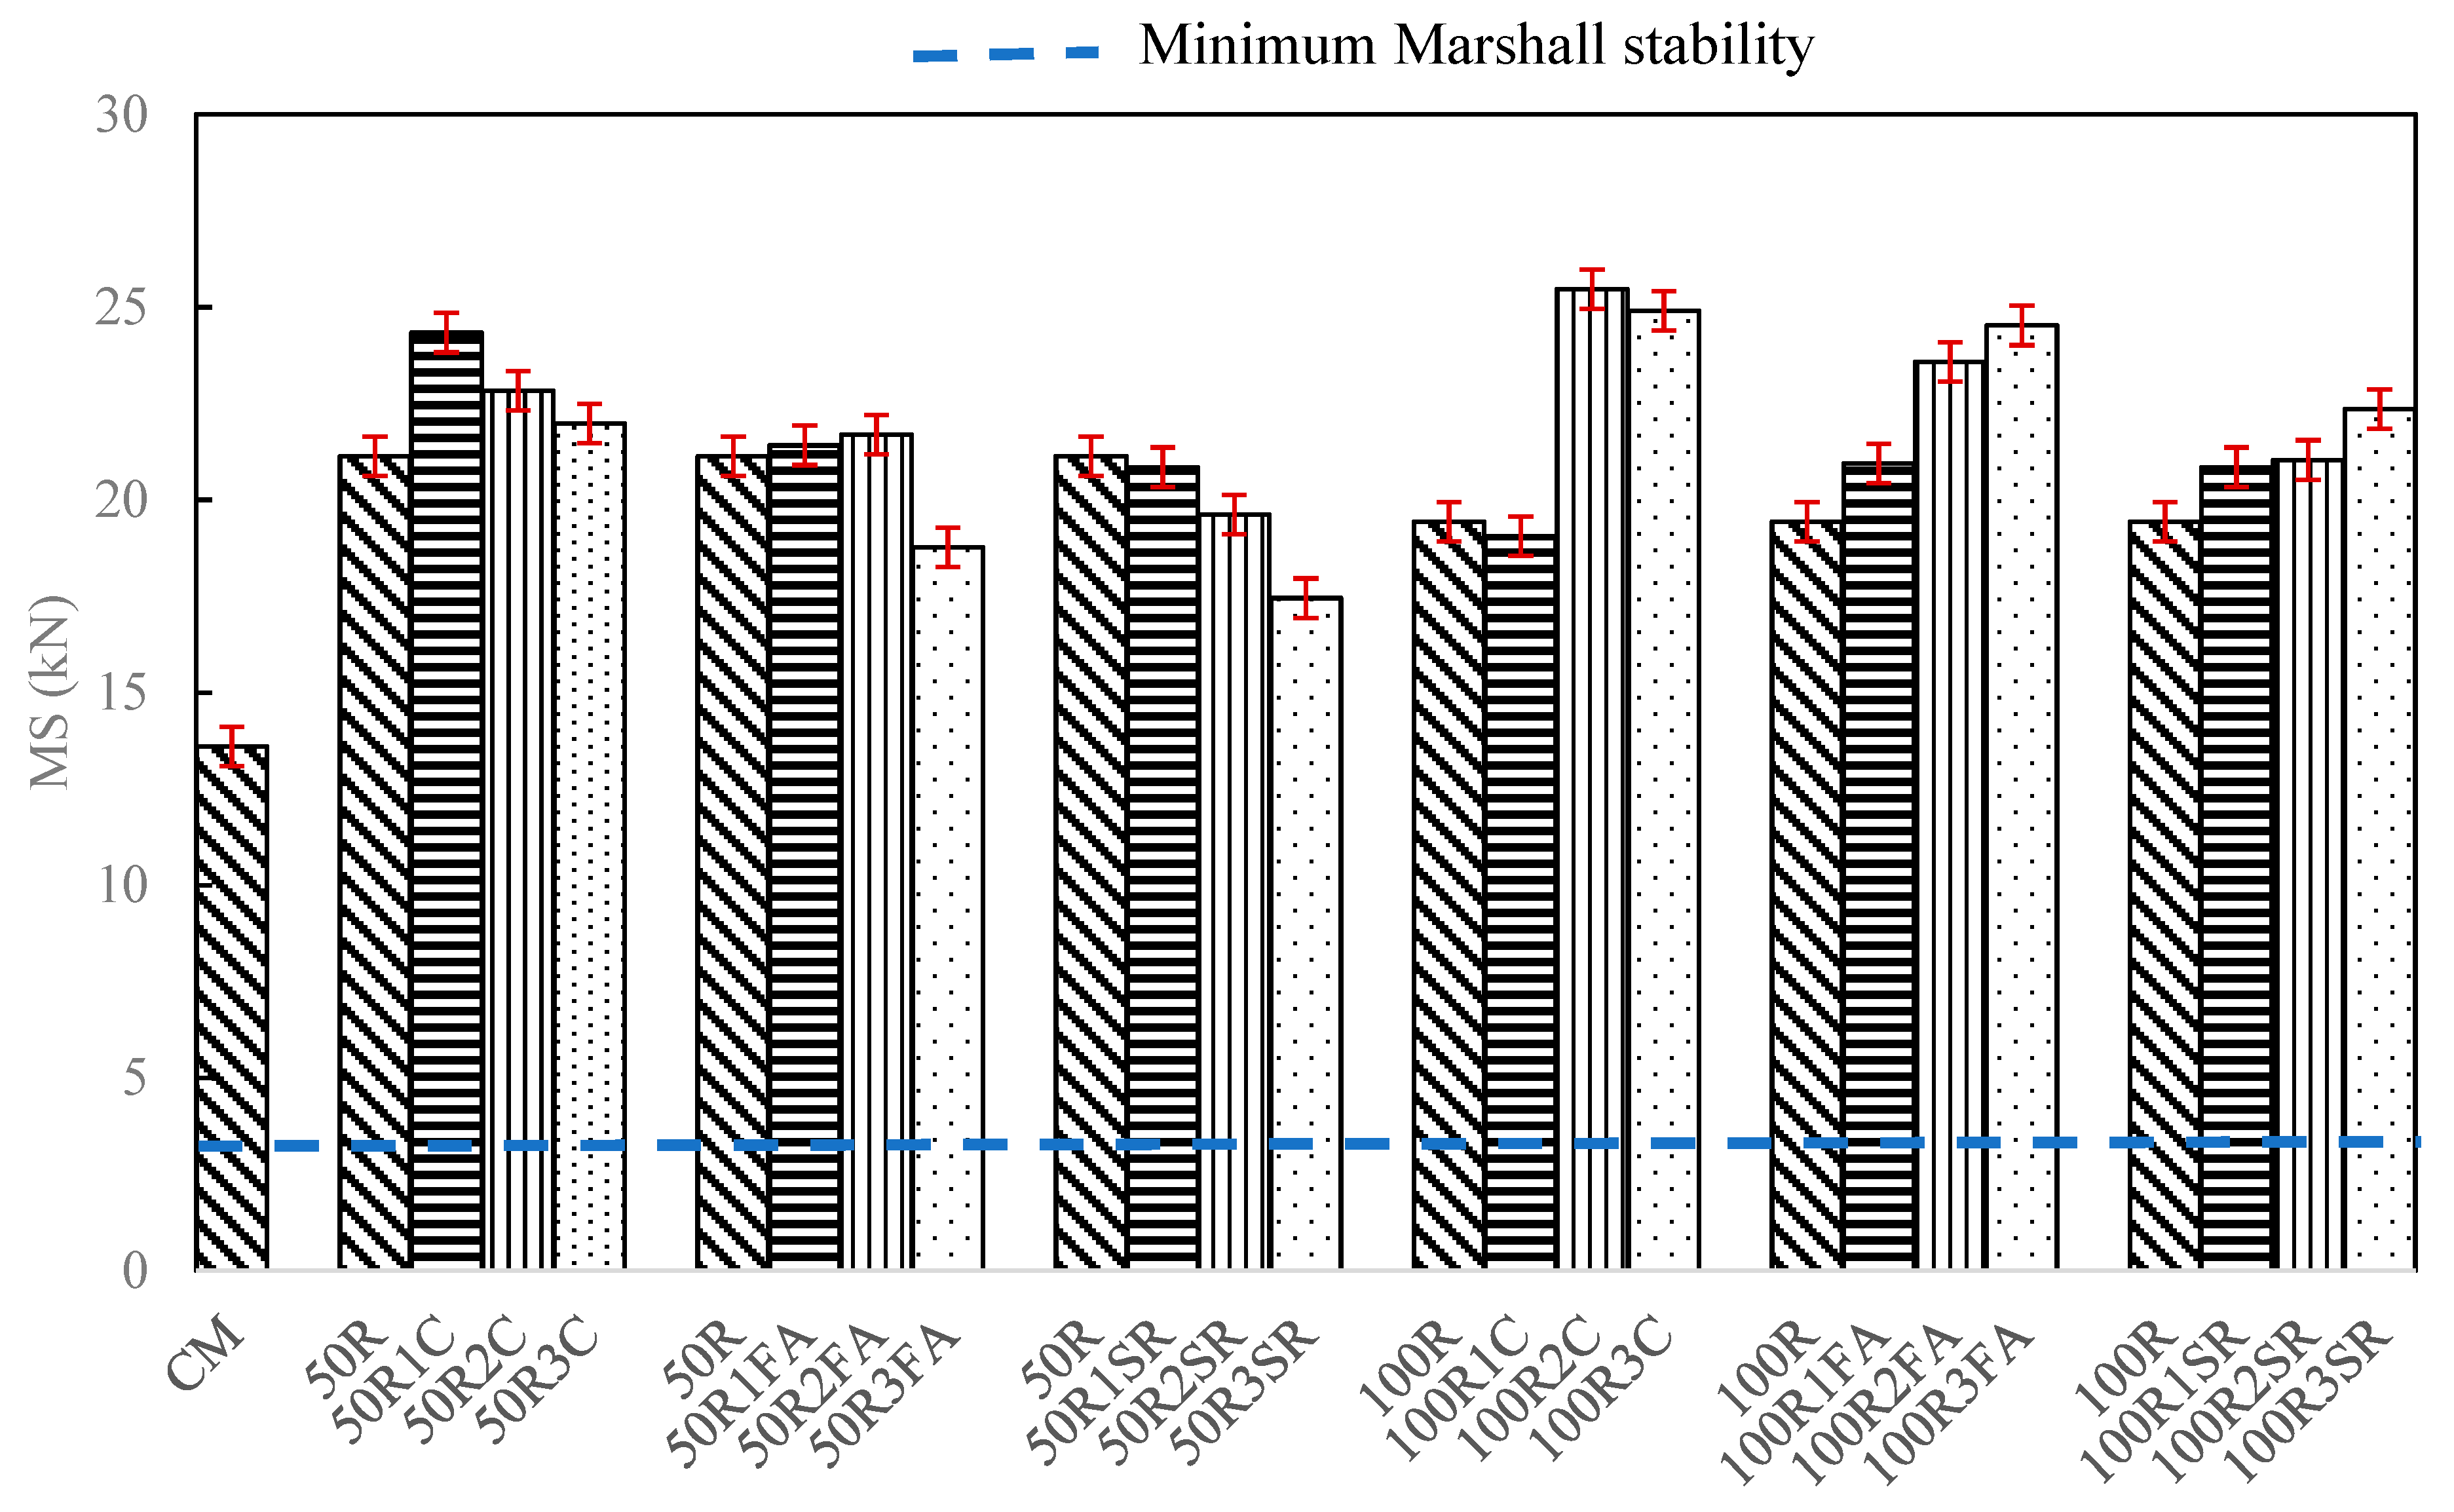
3.3. Marshall Stability

The effect of incorporating different proportions of filler additives (Cement, FA, and SR) on the MS of mixes with and without RAP aggregates is presented in Figure 13. Regarding the effect of CMA, a significant enhancement in MS of all CMA mixes with RAP inclusion was observed, and the minimum Marshall stability criteria (3.5 kN) for CMA specimens was attained by all mixtures with and without additives (IRC SP:100-2014, 2014). The MS of the CM, 50R, and 100R mixes was determined to be 13.6 kN, 21.131 kN, and 19.43 kN, respectively. The MS of the CMA mixes increased up to 50% with RAP inclusion, and afterward, the MS was reduced due to more voids between the aggregates, which showed fewer fines available in the 100R mix. The maximum MS value for the 50% RAP mix with additives (C and FA) was determined to be 24.34 kN and 21.70 kN for 50R1C and 50R2FA, which is higher than the amount of ~15% and ~3% compared to 50R mix, respectively.
From Figure 13, it can be observed that the MS increased with the increase in additive percentage (like cement, FA, and SR in 1%, 2%, and 3%), and the maximum MS of the 100% RAP mix samples was observed for mixes 100R2C, 100R3FA, and 100R3SR (2% cement, 3% FA, and 3% SR) at 25.47 kN, 24.53 kN, 22.36 kN, which is ~31, ~26 and ~15% higher compared to the 100R mix. The maximum MS of the CMA-RAP mix was achieved for 100R2C. As estimated, CSS2 in CMA mixes helped achieve a better MS value than the minimum specified limit of 3.50 kN obtained by the Indian Roads Congress (IRC SP:100-2014, 2014) in the Indian Scenario.
From the ordinary Portland cement XRD analysis (presented in Figure 3a), it was seen that cement consists of calcite (CaCO3), alumina (Al2O3), halite (NaCl), and periclase (MgO). These compounds make up around 75% of cement and react with moisture in CMA mixtures. This influence the strength of mixtures. CaCO3 reacts with water present in the CMA mix, resulting in the formation of calcium hydroxide and heat. These reactions are presented in Equation (5).
CaCO3 + H2O → Ca(OH)2 + CO2 + Energy
It was observed that FA is rich in SiO2, CaCO3, CaO, and K2O based on XRD FA analysis (Figure 3b). Calcium oxide (CaO) reacts with water during hydration and produces calcium hydroxide. Calcium hydroxide reacts with carbon dioxide (CO2) present in the environment, and in the carbonation process, it emits calcium carbonate. These reactions are as follows
CaO + H2O → Ca(OH)2 + CO2 + Energy
Ca(OH)2 + CO2 → CaCO3 + H2O
Calcium carbonate reduces air voids and improves stability due to the cementing action. It is recommended that cement can be substituted by industrial waste such as FA.
The MS increased with RAP content (in 50% and 100%) with and without a filler compared to the CMA mix without the addition of RAP. The maximum MS was achieved with 1% cement (50R1C) due to the cementing action with VA, RAP aggregating, and the binder in the CMA mix. Also, the MS with 2% FA and 2% SR filler equaled the maximum MS.

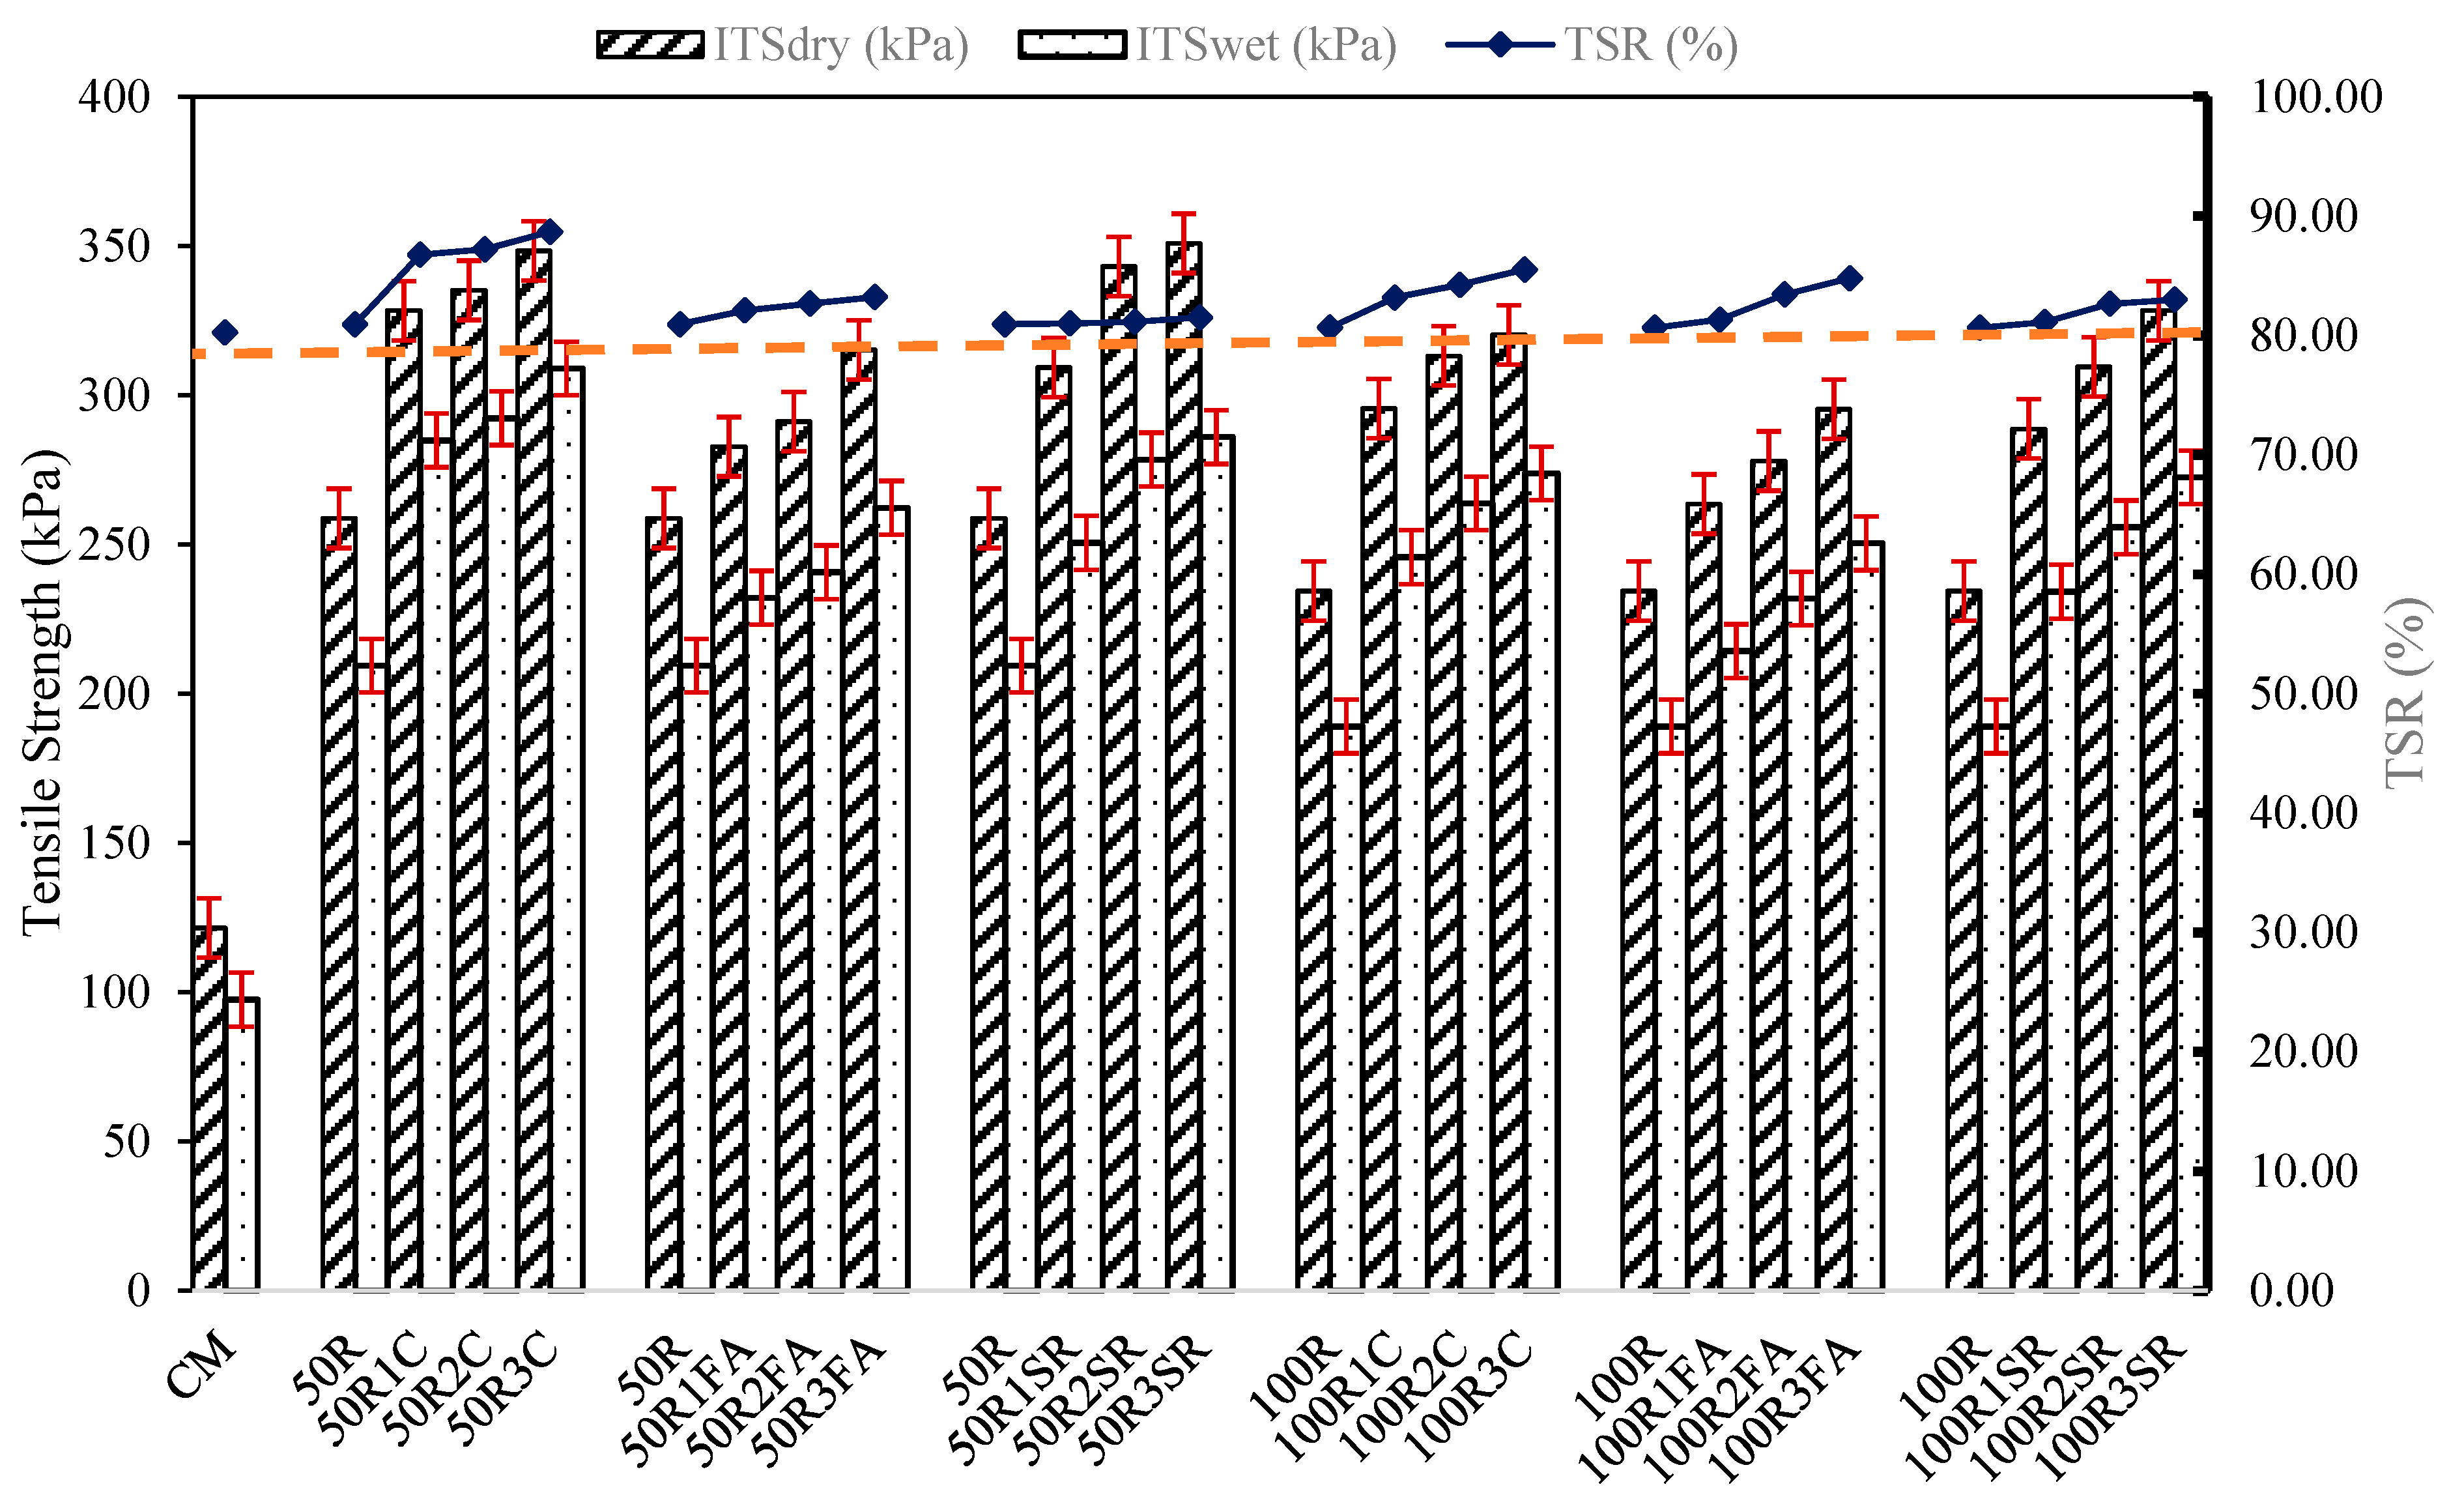
3.4. Tensile Strength

Figure 14 describes the results of the dry ITS, wet ITS, and TSR of recycled CMAs and shows that incorporating additives with CMA mixtures increased the dry ITS value significantly. For example, the dry ITS of the 50R mixtures was 258.72 kPa, which rose to 348.34 kPa, 315.14 kPa, and 350.82 kPa with inclusions of 3% C, 3% FA, and 3% SR, i.e., 34.64%, 21.81%, and 35.60% higher than that of 50R, respectively. The ITSdry value of the 100R mix was 274.39 kPa, which rose to 320.117; 295.31; and 328.318 kPa upon the addition of 3% C, 3% FA, and 2% SR, i.e., 16.66; 7.62; and 19.65% higher than that of 100R, respectively. The value of dry tensile strength of the 50R and 100R mix is 112.92% and 125.811% higher than that of the control mix (CM), respectively; the wet ITS increases with filler percentages of up to 3% in the 50R and 100R CRAMs. The maximum wet ITS was achieved for 50R3C and 100R3C, i.e., 308.91 kPa and 273.785 kPa, respectively. The tensile strength ratio value indicates the potential for moisture damage. TSR values of all mixes with and without RAP aggregates were greater than 80%. The maximum TSR was attained with 3% cement and 2% SR additives for the 50% RAP mix and 100% RAP mix with CMA, respectively.
The tensile strength increases as the additive quantity increases, and the maximum ITS is achieved at 3% addition of cement with the 50% RAP and 100% RAP in CMA mix. Cement adheres better to the binder than to other additives. It enhanced the cohesion in the mixture. In this study, the TSR values attained were more than 80%, indicating that CMA mixes can resist moisture damage with and without RAP-emulsified mixes. This resistance was maintained even when 100% RAP was added, which shows that moisture sensitivity can be reduced.

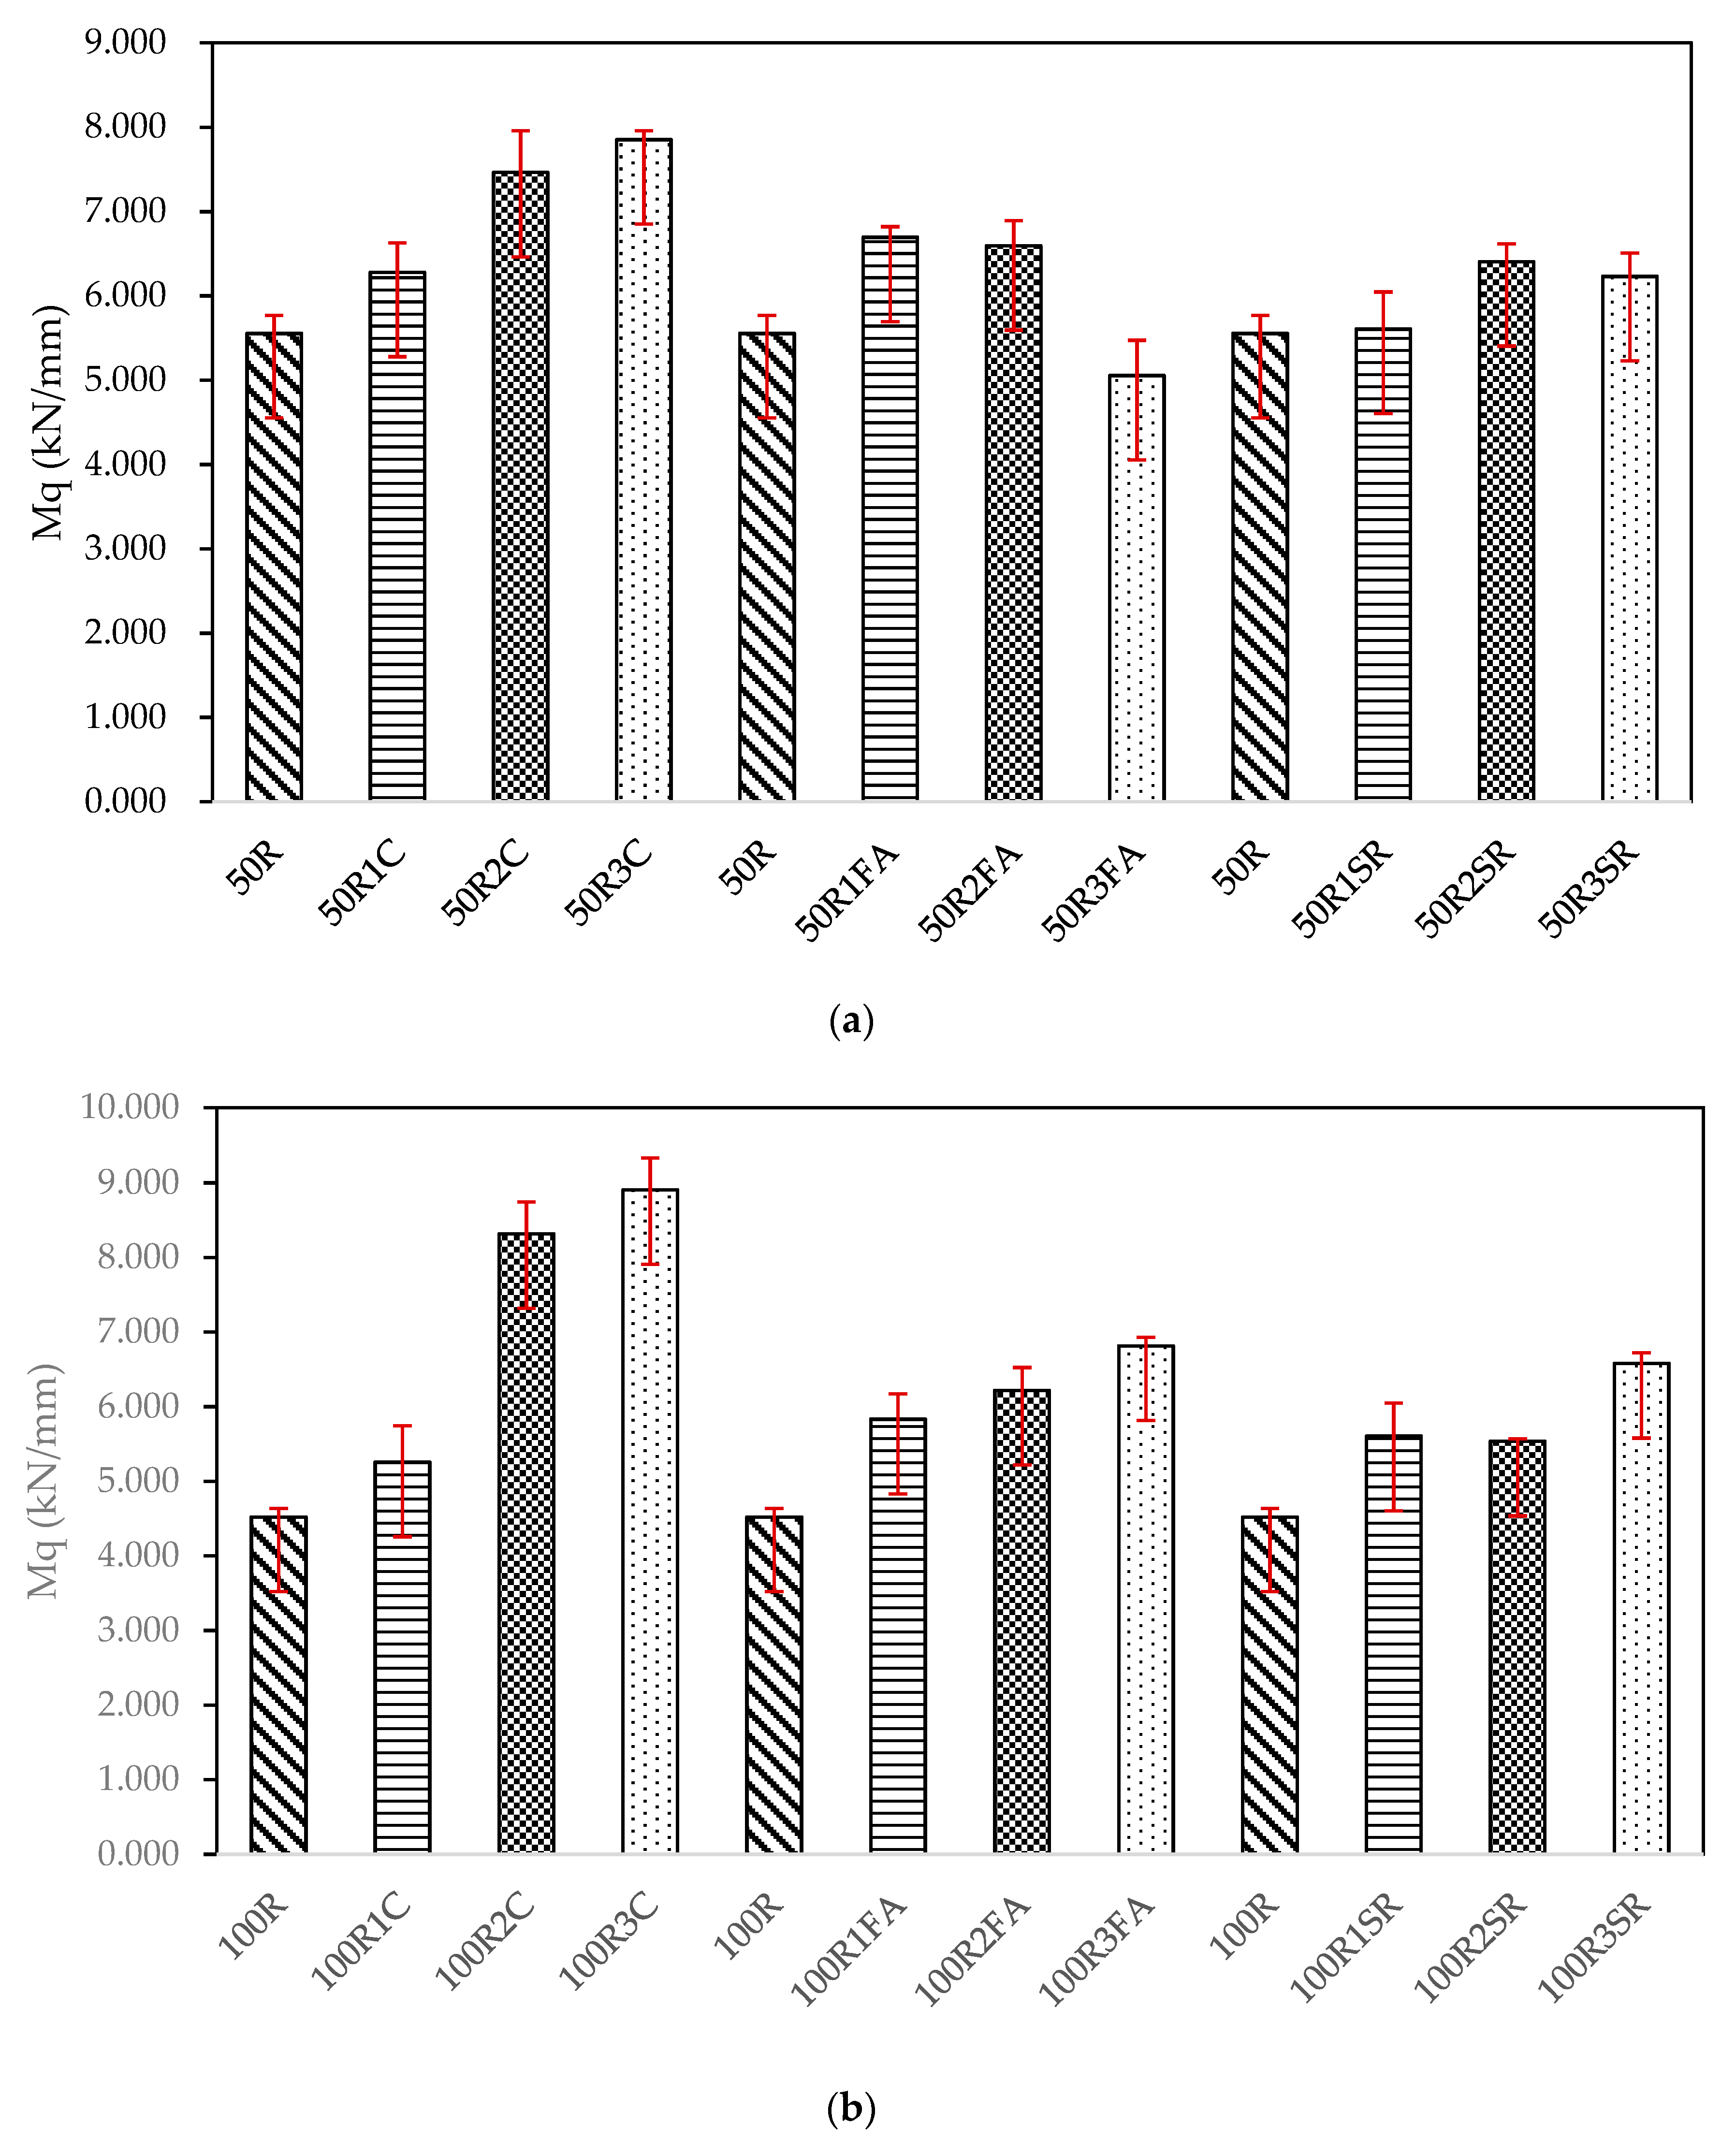
3.5. Marshall Quotient

The inclusion of additives to the mixes resulted in a higher Mq than those without additives and RAP mixes. The Mq of CMAs with 50% RAP and 100% RAP inclusion is presented in Figure 15a,b. Only the 50R3FA and 100R1C mixtures exhibited a lower Mq value. It was observed from the results that the Mq value increased with the incorporation of additives (cement, FA, and SR at 1%, 2%, and 3% of dry aggregate weight) with 50% and 100% RAP aggregate. The maximum Mq was obtained at 3% cement additives with the 100% RAP mix, which indicates that the cement is highly reactive with the binder compared to the other additives. When the MS increases with increasing filler percentages and the flow value decreases, Mq rises.
Table 4 summarizes the ANOVA analysis on the effect of filler additives on the Marshall Quotient of the cold recycled asphalt mixtures with 50% and 100% RAP inclusion. It was observed that the F critical value is less than the F statical value in both cases, showing that filler additives significantly affect the Mq value of cold recycled mixes. Moreover, it reveals the possibility of developing the CMA mix with fillers, which would undoubtedly have higher shear stress and deformation resistance than those without. It implies that the utilized additives significantly affect the Mq with and without RAP incorporation. The VA can be replaced by 100% RAP, which is sustainable for the environment and saves more energy.

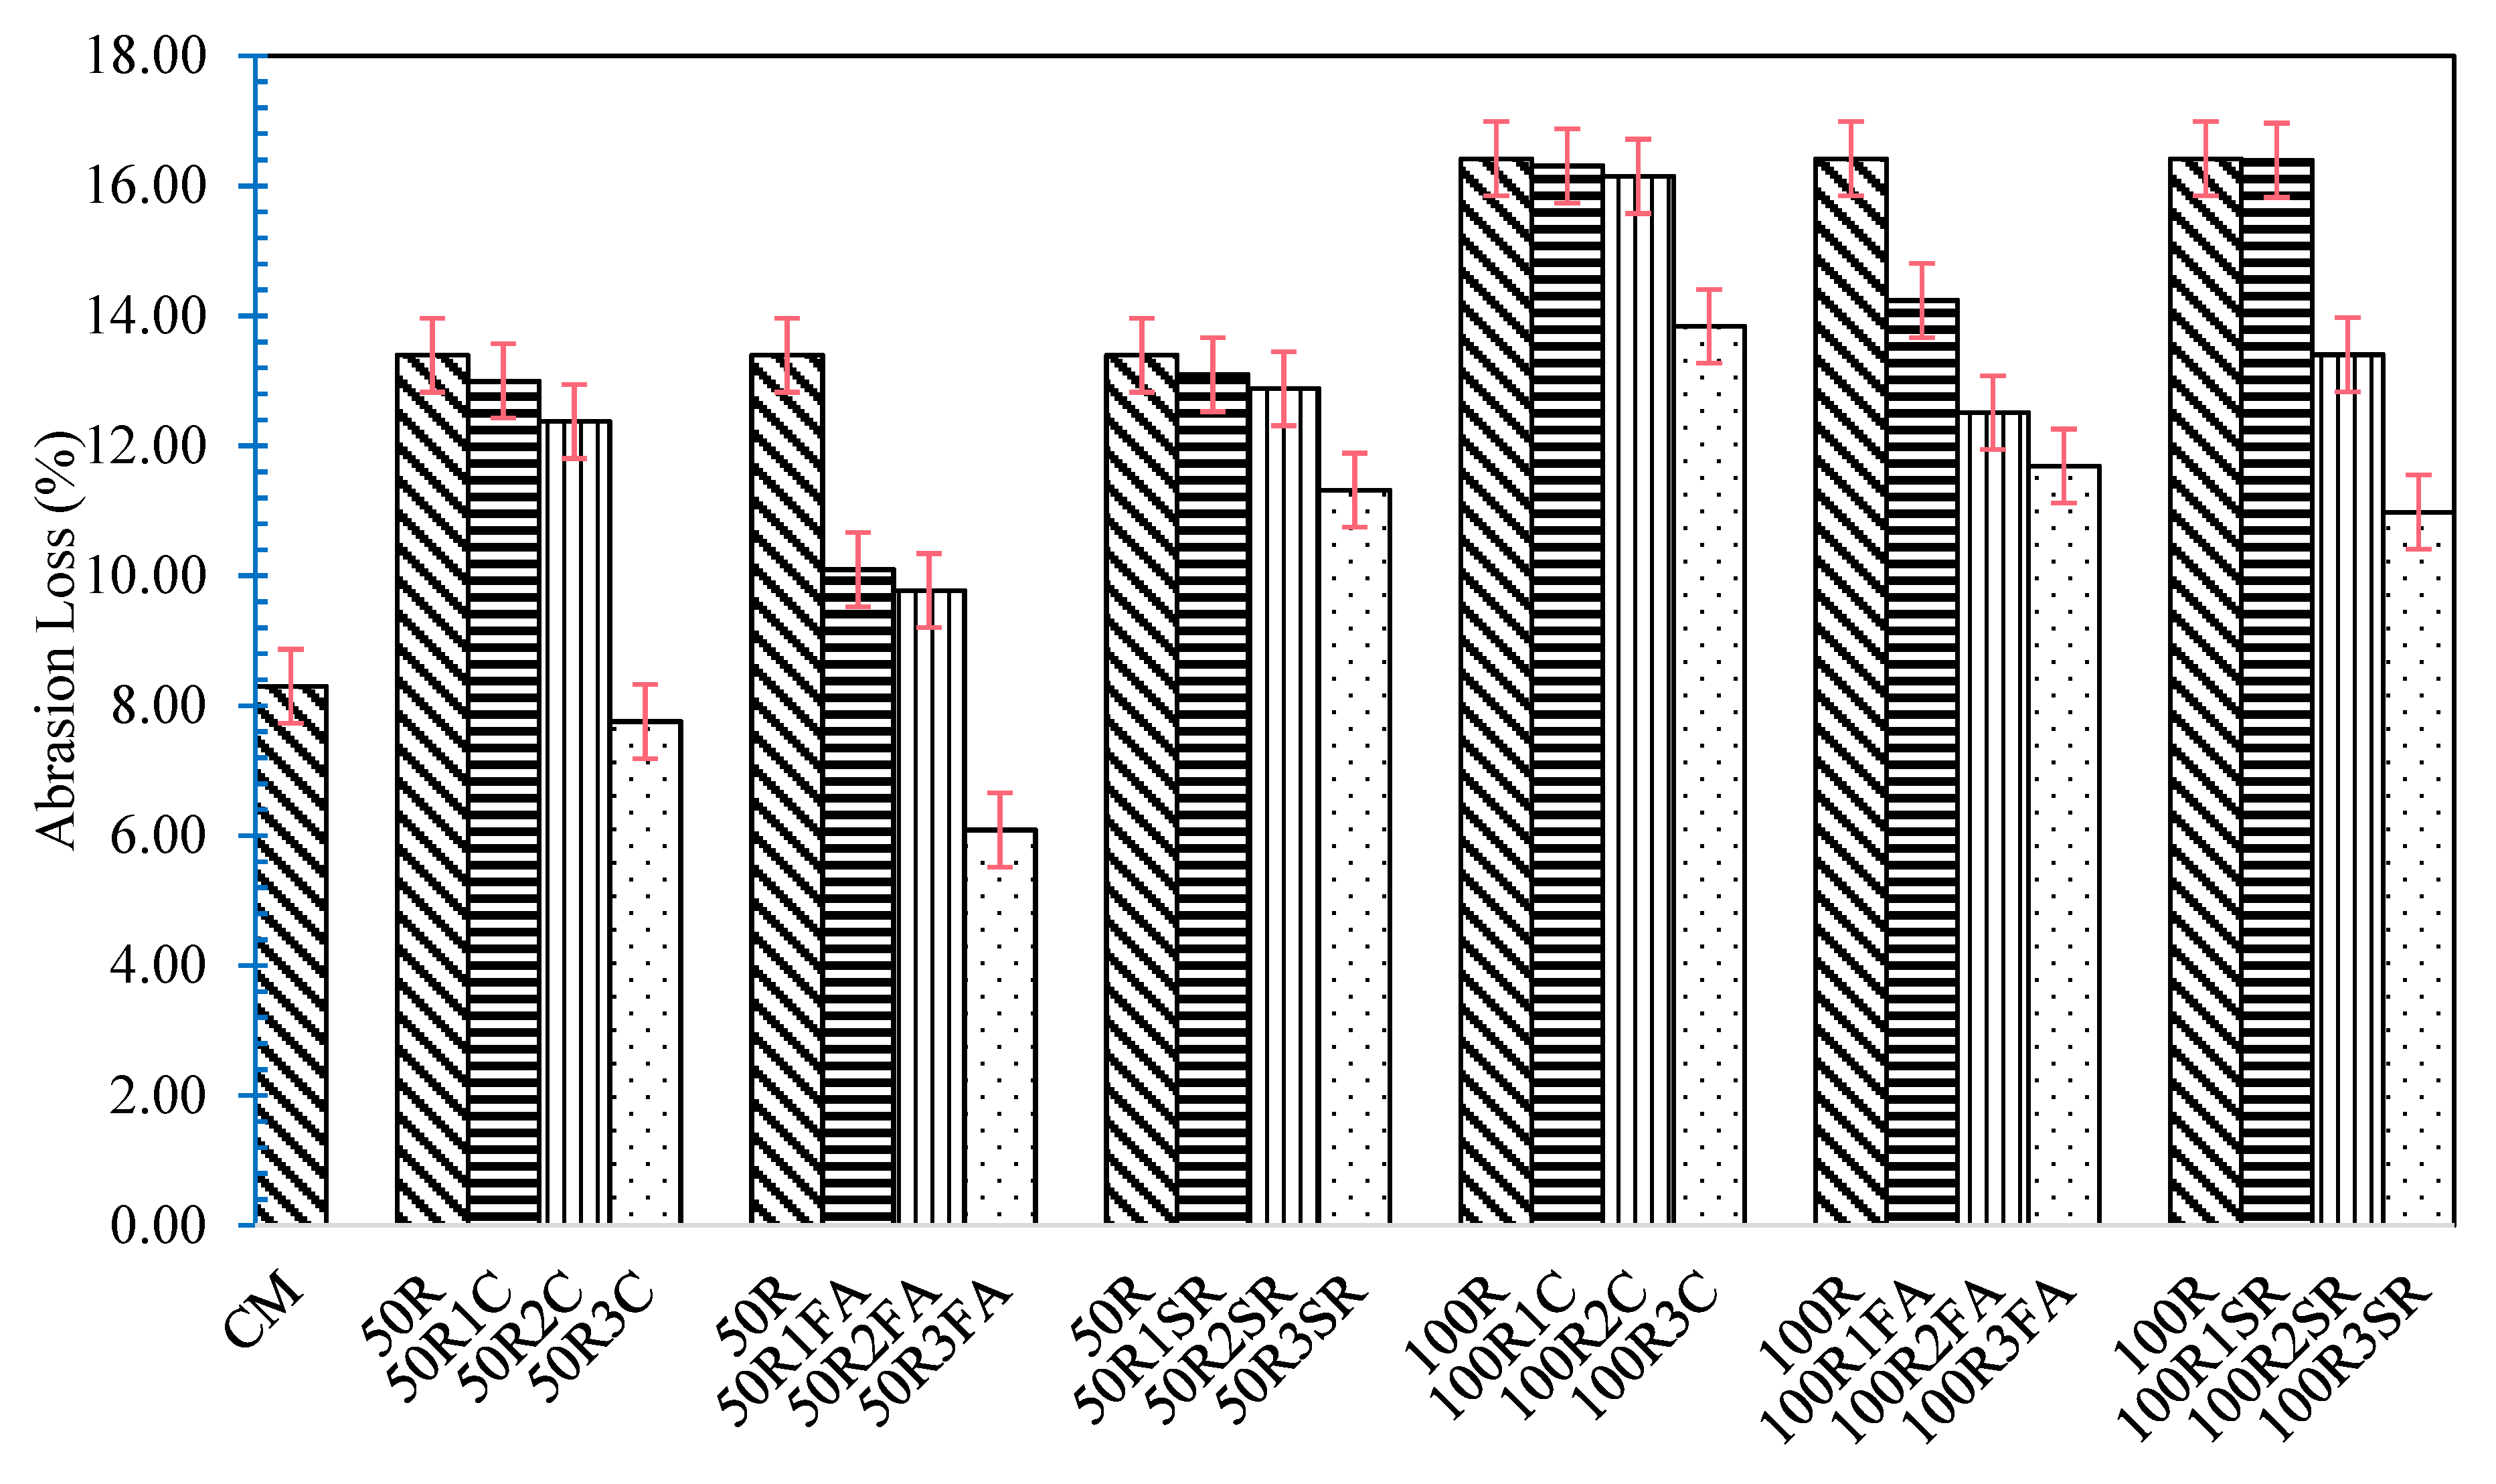
3.6. Standard Cantabro Loss

A low abrasion loss value is always required for pavement susceptible to raveling failure. It was observed that the utilized additives reduced the abrasion loss of mixtures. It can be analyzed from Figure 16 that the abrasion loss was enhanced due to incorporating recycled materials in place of VA. Still, it was reduced by using the additives with and without recycled materials. The abrasion loss is reduced with an increase I additives up to 3% of 50R (50R3FA < 50R3C < 50R3SR) (Figure 16). It signifies that the RAP and CSS2 binder adhere better in 50R cold recycled mixtures than in the control and 100% RAP mixes. Incorporating additives would not adversely affect the abrasion resistance of the CMA-RAP mixtures. In the case of CMA with 100% RAP, abrasion loss increased compared to 50% RAP. The minimum abrasion loss for CMA mixes with 50% RAP aggregate was attained by 50R3FA, and the maximum abrasion loss was achieved by 100R due to the presence of agglomerates. More agglomerates were present in the 100% RAP mixtures, and they broke down after applying external forces [28], which proves there was more abrasion loss in the 100R mixes compared to CM and 50R mixes. Abrasion loss is reduced after adding additives into the 100R mixes because fine particles fill the interstices between mixes.

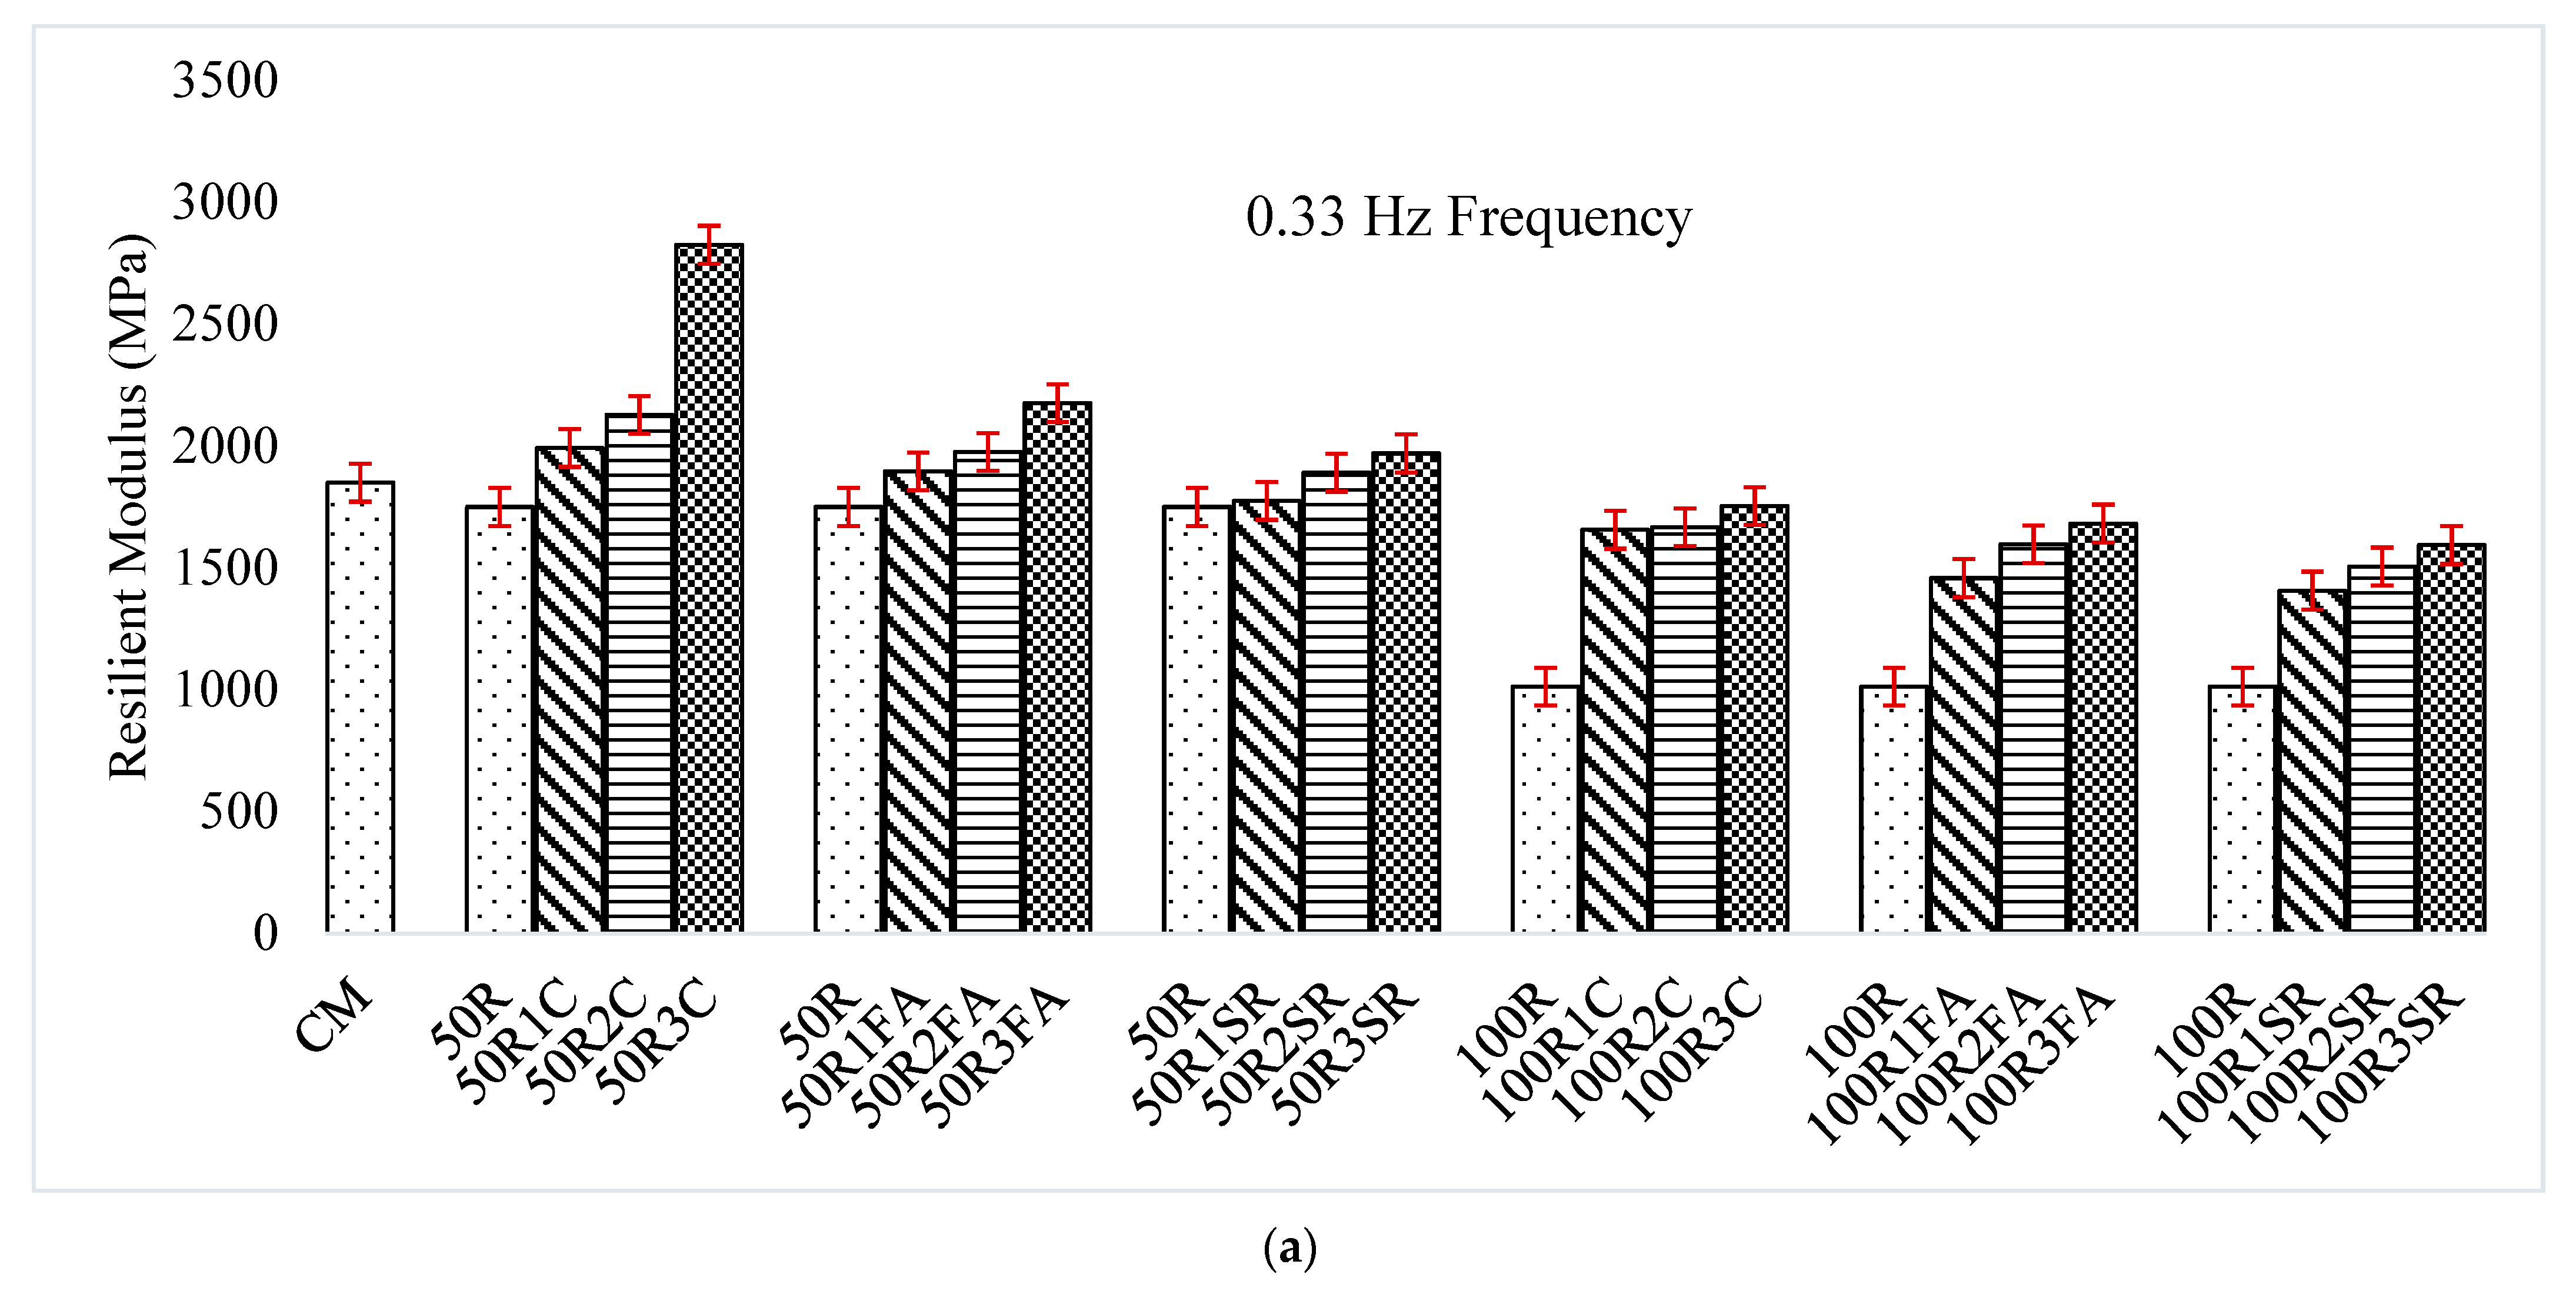
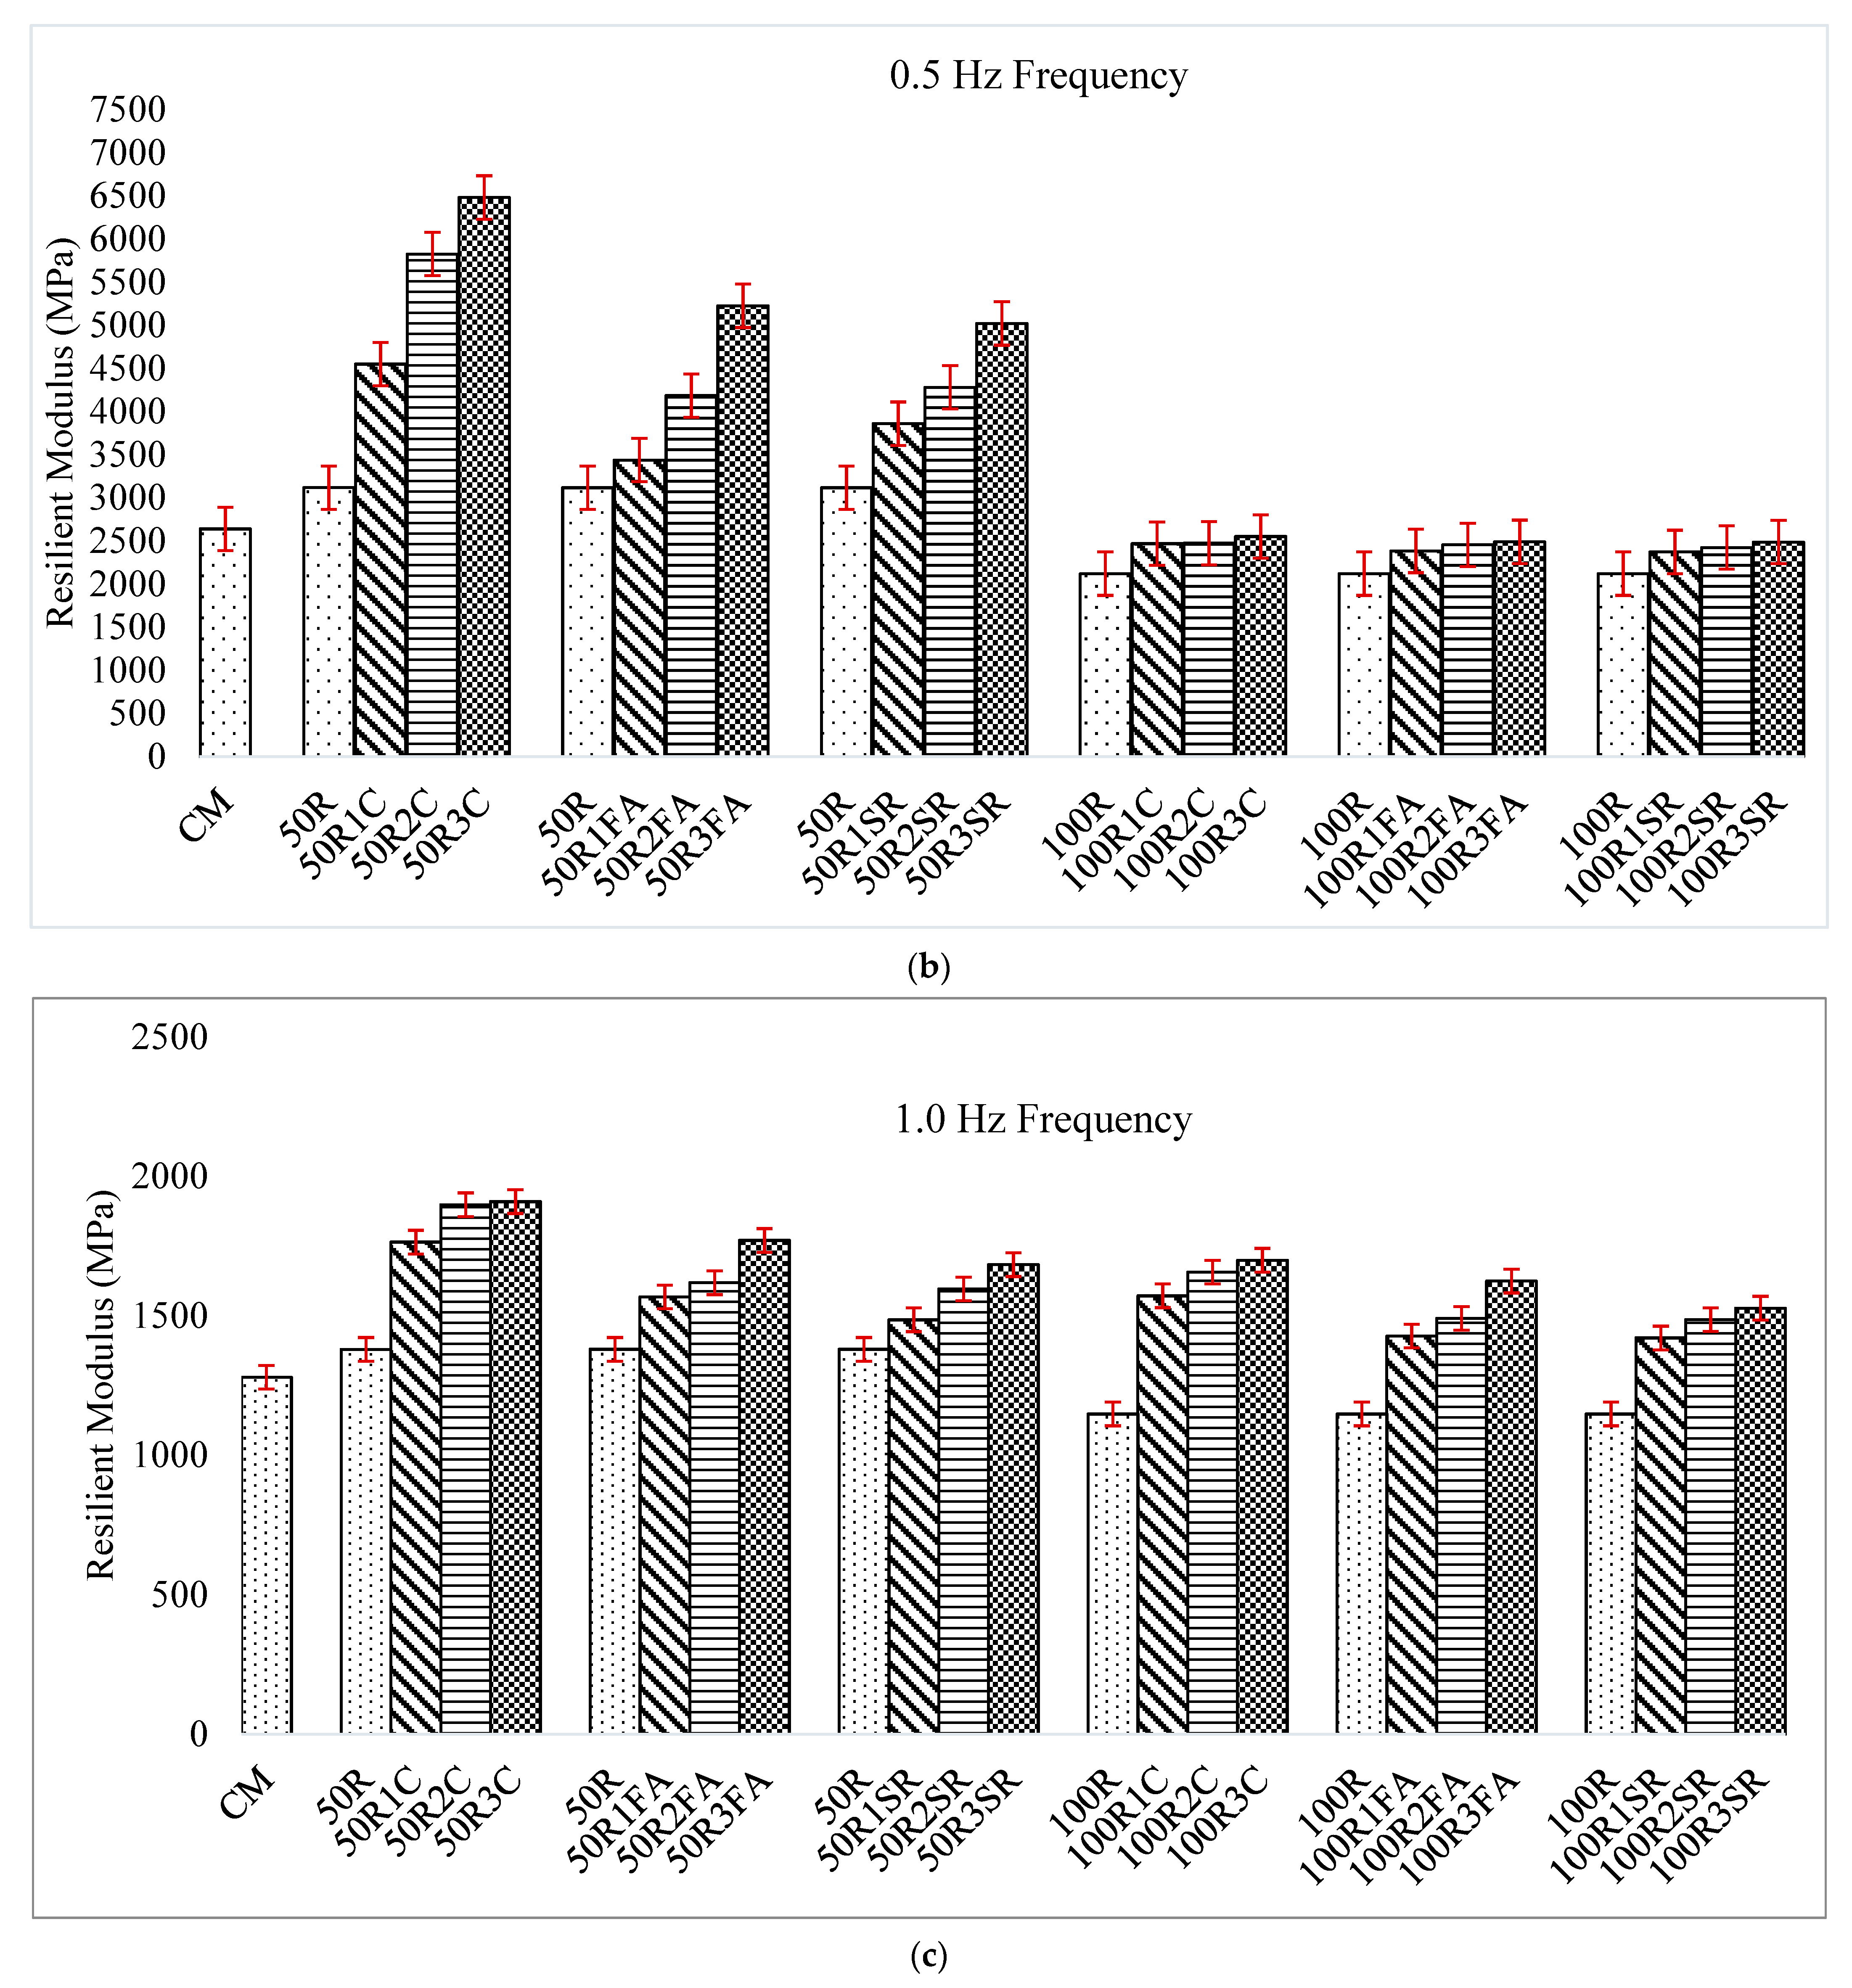
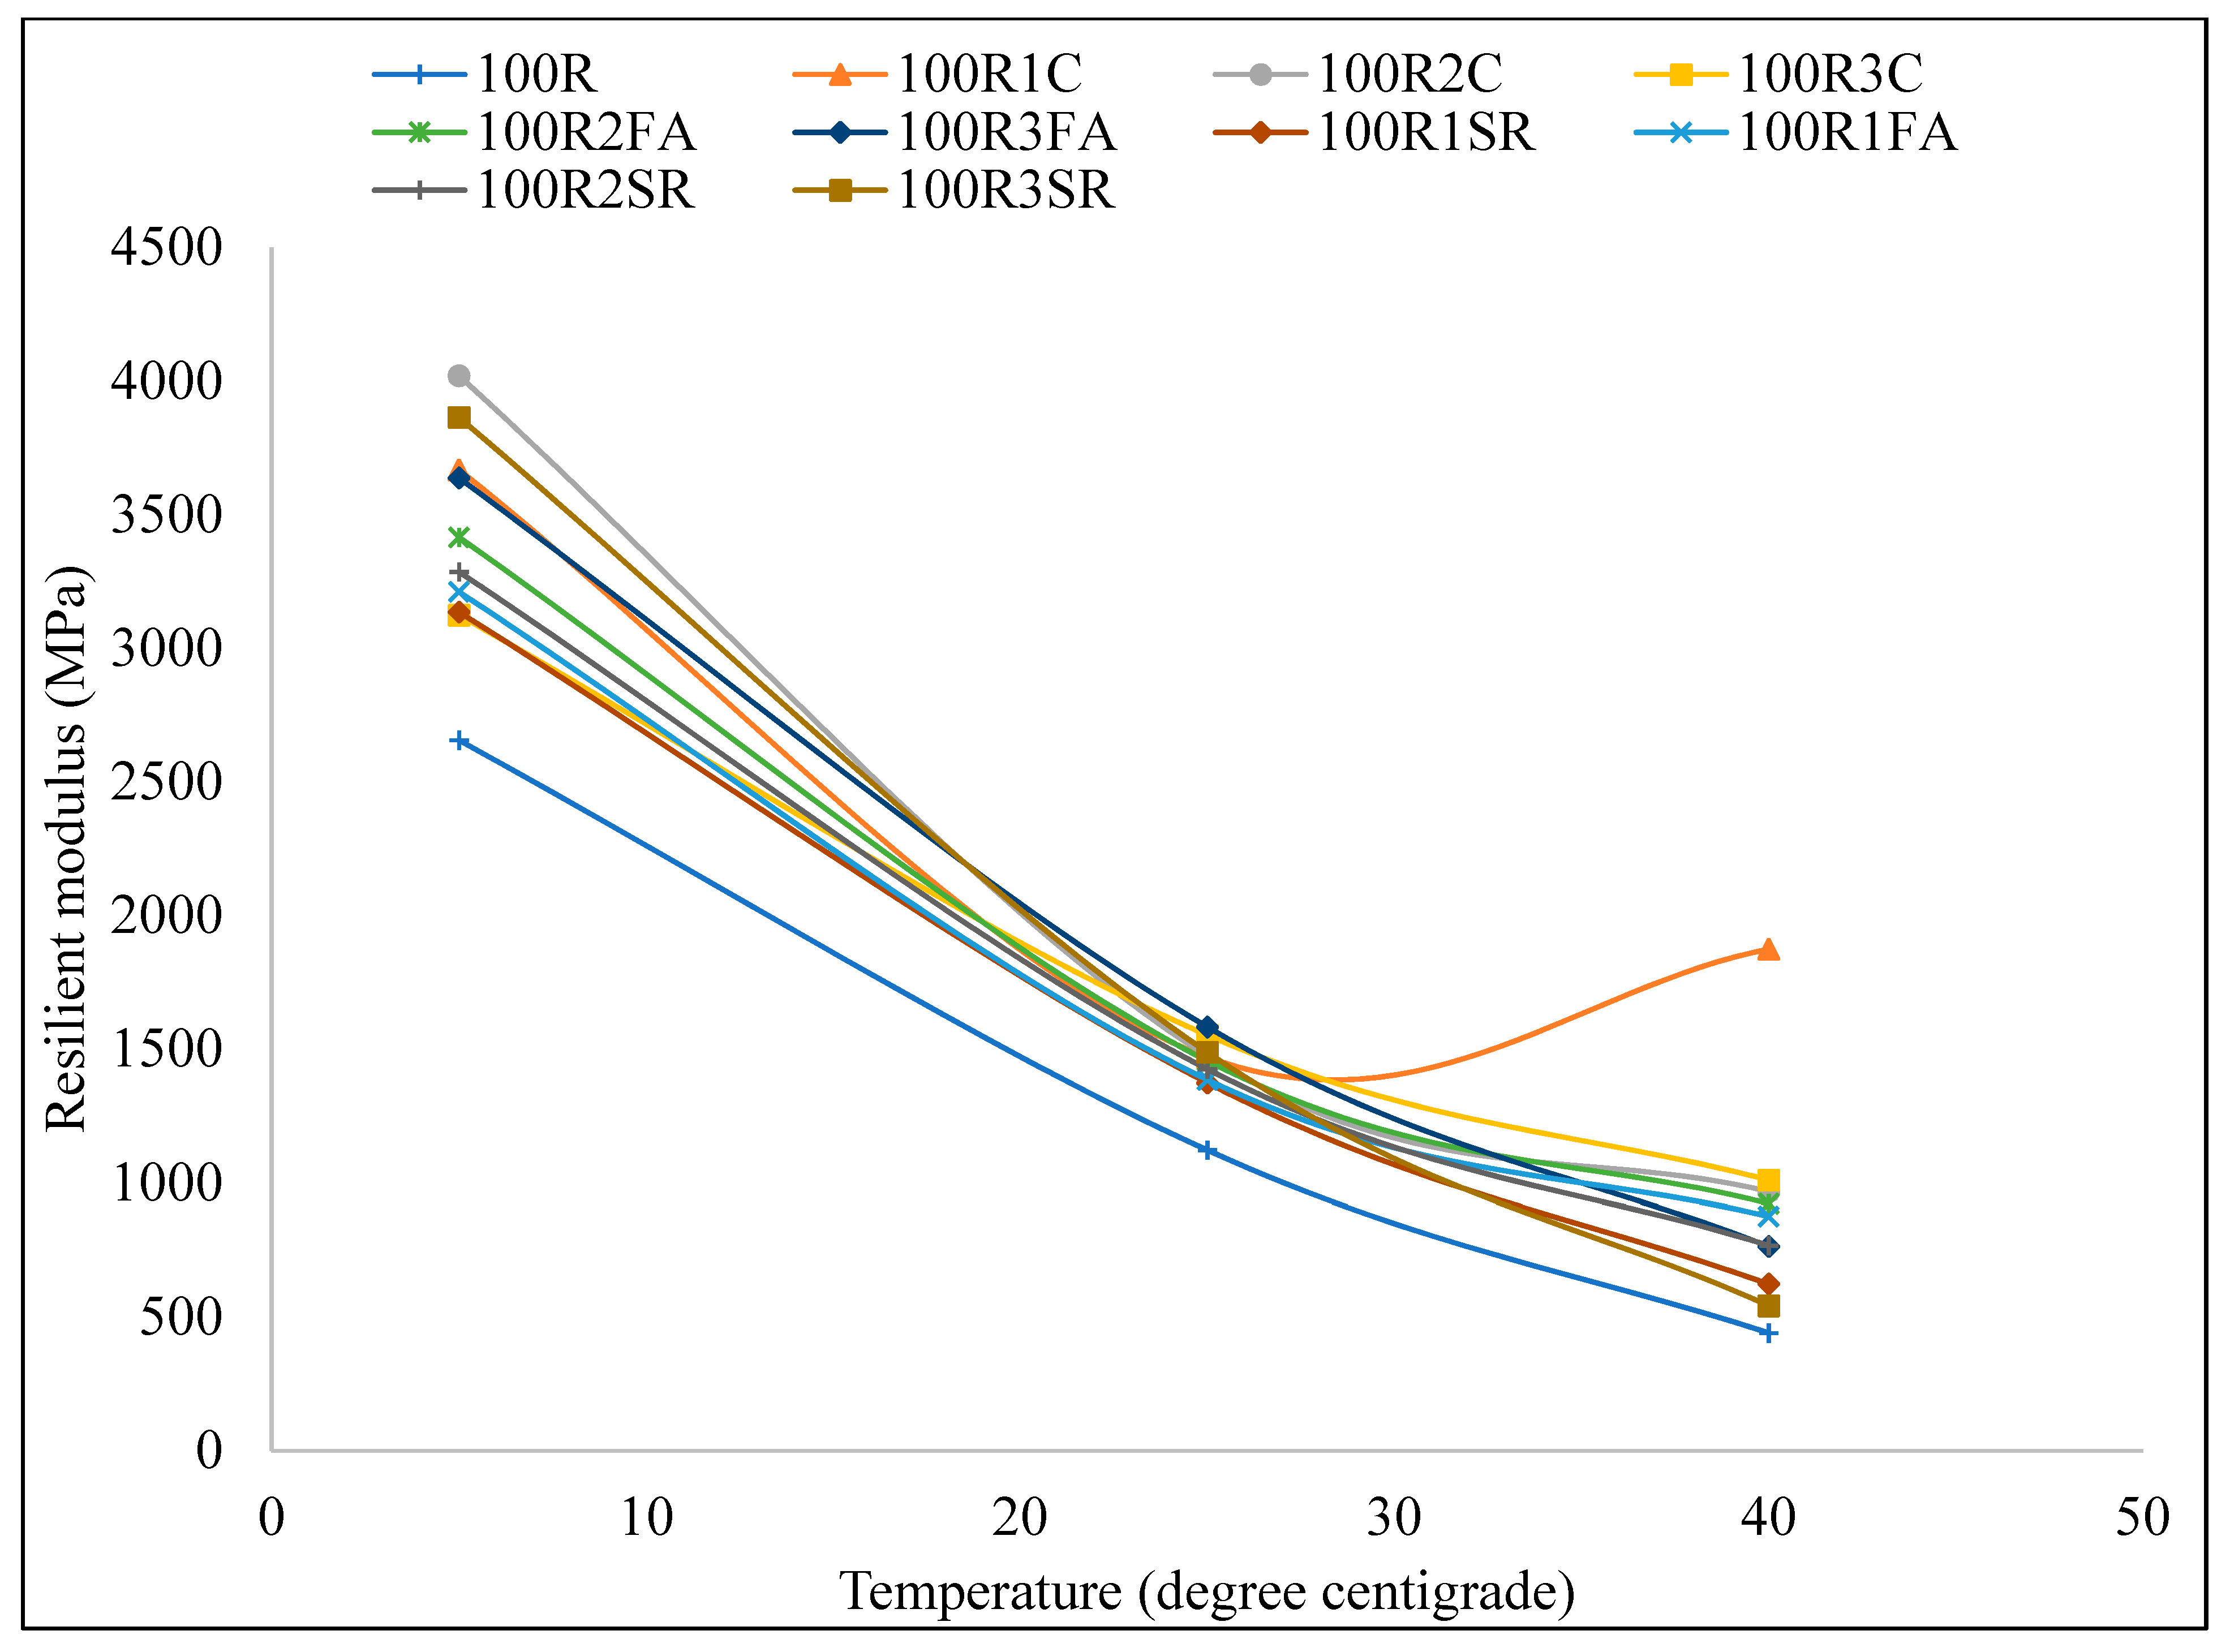
3.7. Resilient Modulus

The results of resilient modulus depend upon the structural behavior of the mix because it is related to the capacity of the material, which is used to generate the data for pavement design or pavement evaluation and analysis. The MR was evaluated at different pulse repetition periods, 3000 ms, 2000 ms, and 1000 ms, as shown in Figure 17a, b and c, respectively. The number of conditioning pulses was kept constant (1000). The resilient modulus of the CMA mixes was evaluated at different frequencies (0.33 Hz, 0.5 Hz, and 1.0 Hz), and frequency is the ratio of the conditioning pulse to the pulse repetition period. The resilient modulus value increased with additive percentages of up to three percent, and the maximum resilient modulus was achieved by the 50R3C mix, surpassing all cold recycled mixtures. The maximum resilient modulus was attained upon the inclusion of 3% cement additive with the 50R mixes due to the role of water in the hydration of cement and pozzolanic reaction [54]. A higher resilient modulus value indicates better mixture stiffness. In this research, 50R cold recycled mixtures are stiffer than the control mix, and 100R mixtures are at different frequencies. The results show that the resilient modulus of the CM, 50R, and 100R mixes are 2641 MPa, 3000–6000 MPa, and 2000–3000 MPa, respectively, which indicates the bonding between the aggregate and binder of the 50R mixes is better than that of other mixes. Cement is an effective additive compared to FA and SR. It can be seen that the resilient modulus of 100R mixtures reduces as the temperature increases (Figure 18). Based on data analysis at all temperatures tested (5 °C, 25 °C, and 40 °C), an increasing trend in MR values was observed up to 50% RAP, while the further addition of RAP (100% RAP) reversed the trend.

4. Conclusions

The effects of additives on the performance of the CMA-RAP mix were studied in this research. This research paper promotes using a high proportion of RAP material in cold mix asphalt design and pavement maintenance. Different additives can be incorporated (at 1%, 2%, and 3% of dry aggregate weight) with mixtures to improve the strength and stiffness of CMA-RAP technology. The following conclusions can be drawn from this study are:
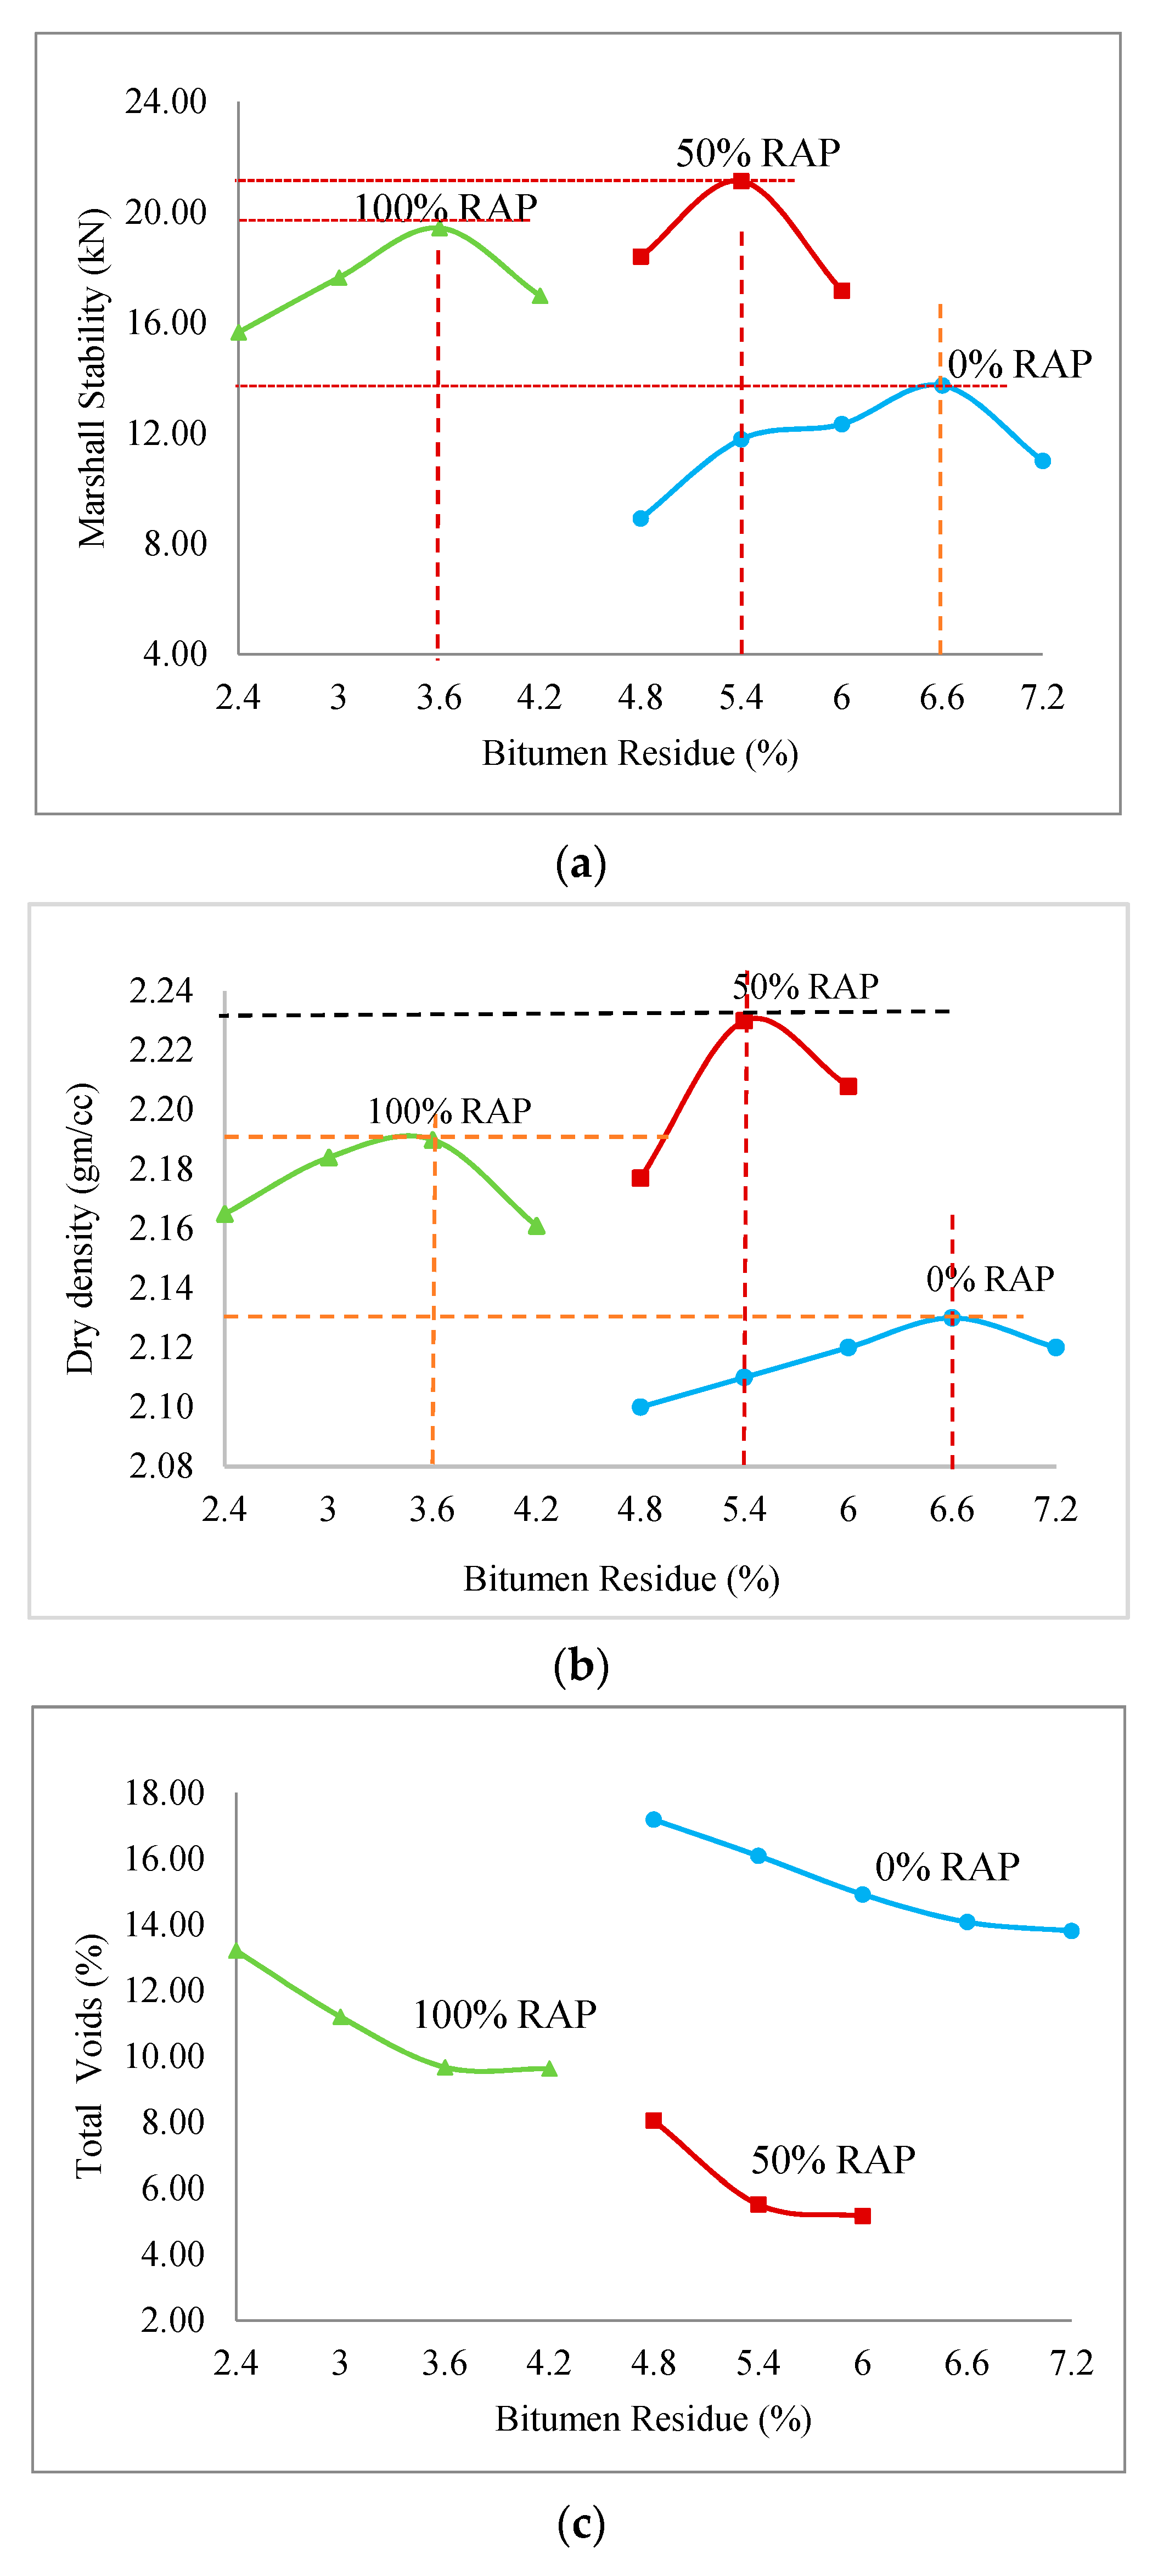
  • Optimum bitumen residue was determined as 6.6%, 5.4%, and 3.6% for CM, 50R, and 100R, respectively. It signifies that less bitumen emulsion is required to increase the RAP materials in the CRAMs.
  • All considered CMA mixes achieved a minimum MS value (of 3.5 kN). MS increased to 50% RAP with VA, and after replacing VA with 100% RAP, MS was reduced compared to 50R mixtures. This implies that the introduction of 50% RAP to a CMA mix has good results. The maximum MS attained by 50R1C (24.34 kN) and 100R2C (25.47 kN) is higher than CM (13.6 kN).
  • All cold recycled asphalt mixtures with 50% RAP and 100% RAP achieved a minimum tensile strength ratio (80%), which itself is a good indication of imparting moisture damage.
  • The resilient modulus of cold recycled asphalt mixtures was evaluated at different temperatures (40 °C, 25 °C, and 5 °C). The resilient modulus of the control mix, 50% RAP, and 100% RAP mixes are in range of 2000–3000 MPa, 3000–6000 MPa, and 2000–3000 MPa, respectively, which indicates the bonding between the aggregate and binder of the 50R mixes is better than that of the control and 100R mixes.
  • The results of the cold recycled asphalt mixtures with 50% RAP show better performance compared to 100% RAP materials in place of VA with different additives and also show that the CRAMs with cement additive are more effective and have more strength compared to other additives (FA and SR).
  • In the case of CMA-RAP technology, a RAP aggregate cannot be considered a black stone.

Author Contributions

Conceptualization, P.M.; methodology, P.M.; formal analysis, P.M.; data cation, P.M.; writing—original draft preparation, P.M.; supervision, G.R.R.N. and P.K.; writing—review and editing, G.R.R.N. and P.K. All authors have read and agreed to the published version of the manuscript.

Funding

This research has not received external funding.

Institutional Review Board Statement

Not applicable.

Informed Consent Statement

Not applicable.

Data Availability Statement

The experimental data were measured in the laboratory of IIT Roorkee. All the data shown in the manuscript are genuine and authentic to the best of the author’s knowledge.

Acknowledgments

The author (Pinki Meena) acknowledges the quality improvement program of the All-India Council for Teaching Education (AICTE), Government of India, for providing a scholarship to pursue this research conducted at the Indian Institute of Technology, Roorkee.

Conflicts of Interest

The authors declare no conflict of interest.

References

  1. Josa, A.; Aguado, A.; Heino, A.; Byars, E.; Cardim, A. Comparative Analysis of Available Life Cycle Inventories of Cement in the EU. Cem. Concr. Res. 2004, 34, 1313–1320. [Google Scholar] [CrossRef]
  2. Peralta, J.; Silva, H.M.R.D.; Hilliou, L.; MacHado, A.V.; Pais, J.; Christopher Williams, R. Mutual Changes in Bitumen and Rubber Related to the Production of Asphalt Rubber Binders. Constr. Build. Mater. 2012, 36, 557–565. [Google Scholar] [CrossRef]
  3. Wang, Y.; Leng, Z.; Li, X.; Hu, C. Cold Recycling of Reclaimed Asphalt Pavement towards Improved Engineering Performance. J. Clean. Prod. 2018, 171, 1031–1038. [Google Scholar] [CrossRef]
  4. Oruc, S.; Celik, F.; Aksoy, A. Performance of Cement Modified Dense Graded Cold-Mix Asphalt and Establishing Mathematical Model. Indian. J. Eng. Mater. Sci. 2006, 13, 512–519. [Google Scholar]
  5. Anthonissen, J.; Van den Bergh, W.; Braet, J. Review and Environmental Impact Assessment of Green Technologies for Base Courses in Bituminous Pavements. Environ. Impact Assess. Rev. 2016, 60, 139–147. [Google Scholar] [CrossRef]
  6. Tarsi, G.; Tataranni, P.; Sangiorgi, C. The Challenges of Using Reclaimed Asphalt Pavement for New Asphalt Mixtures: A Review. Materials 2020, 13, 4052. [Google Scholar] [CrossRef] [PubMed]
  7. Antunes, V.; Freire, A.C.; Neves, J. A Review on the Effect of RAP Recycling on Bituminous Mixtures Properties and the Viability of Multi-Recycling. Constr. Build. Mater. 2019, 211, 453–469. [Google Scholar] [CrossRef]
  8. Zaumanis, M.; Mallick, R.B.; Frank, R. 100% Recycled Hot Mix Asphalt: A Review and Analysis. Resour. Conserv. Recycl. 2014, 92, 230–245. [Google Scholar] [CrossRef]
  9. Kavussi, A.; Modarres, A. A Model for Resilient Modulus Determination of Recycled Mixes with Bitumen Emulsion and Cement from ITS Testing Results. Constr. Build. Mater. 2010, 24, 2252–2259. [Google Scholar] [CrossRef]
  10. Modarres, A.; Ayar, P. Comparing the Mechanical Properties of Cold Recycled Mixture Containing Coal Waste Additive and Ordinary Portland Cement. Int. J. Pavement Eng. 2016, 17, 211–224. [Google Scholar] [CrossRef]
  11. Kim, Y.; Lee, H.D. Influence of Reclaimed Asphalt Pavement Temperature on Mix Design Process of Cold In-Place Recycling Using Foamed Asphalt. J. Mater. Civil. Eng. 2011, 23, 961–968. [Google Scholar] [CrossRef]
  12. Xiao, F.; Yao, S.; Wang, J.; Li, X.; Amirkhanian, S. A Literature Review on Cold Recycling Technology of Asphalt Pavement. Constr. Build. Mater. 2018, 180, 579–604. [Google Scholar] [CrossRef]
  13. Li, Q.; Zhu, C.; Zhang, H.; Zhang, S. Evaluation on Long-Term Performance of Emulsified Asphalt Cold Recycled Mixture Incorporating Fly Ash by Mechanistic and Microscopic Characterization. Constr. Build. Mater. 2022, 319, 126120. [Google Scholar] [CrossRef]
  14. Faramarzi, M.; Lee, K.W.; Kim, Y.; Kwon, S. A Case Study on a Cement Treated RAP Containing Asphalt Emulsion and Acryl Polymer. Case Stud. Constr. Mater. 2018, 9, e00211. [Google Scholar] [CrossRef]
  15. Liu, Z.; Sun, L.; Zhai, J.; Huang, W. A Review of Design Methods for Cold In-Place Recycling Asphalt Mixtures: Design Processes, Key Parameters, and Evaluation. J. Clean. Prod. 2022, 370, 133530. [Google Scholar] [CrossRef]
  16. Nassar, A.I.; Thom, N.; Parry, T. Optimizing the Mix Design of Cold Bitumen Emulsion Mixtures Using Response Surface Methodology. Constr. Build. Mater. 2016, 104, 216–229. [Google Scholar] [CrossRef]
  17. Nassar, A.I.; Khashaa, M.; Thom, N.; Parry, T. Mechanical, Durability and Microstructure Properties of Cold Asphalt Emulsion Mixtures with Different Types of Filler. Constr. Build. Mater. 2016, 114, 352–363. [Google Scholar] [CrossRef]
  18. Nassar, A.I.; Mohammed, M.K.; Thom, N.; Nassar, A.I.; Mohammed, M.K.; Thom, N. Characterisation of High-Performance Cold Bitumen Emulsion Mixtures for Surface Courses. Int. J. Pavement Eng. 2018, 8436, 509–518. [Google Scholar] [CrossRef]
  19. Yadav, R.K. Prabhat Choudhary Emulsified Cold Mix Design for Bituminous Macadam (BM). Int. J. Innov. Sci. Res. Technol. 2018, 3, 658–663. [Google Scholar]
  20. Deb, P.; Singh, K.L. Performance of Cement-Treated Cold Mix Asphalt with Different Fillers. Innov. Infrastruct. Solut. 2023, 8, 6. [Google Scholar] [CrossRef]
  21. Deb, P.; Singh, K.L. Accelerated Curing Potential of Cold Mix Asphalt Using Silica Fume and Hydrated Lime as Filler. Int. J. Pavement Eng. 2022, 24, 1–21. [Google Scholar] [CrossRef]
  22. Flores, G.; Gallego, J.; Miranda, L.; Marcobal, J.R. Design Methodology for in Situ Cold Recycled Mixtures with Emulsion and 100% Rap. Constr. Build. Mater. 2019, 216, 496–505. [Google Scholar] [CrossRef]
  23. Flores, G.; Gallego, J.; Miranda, L.; Marcobal, J.R. Cold Asphalt Mix with Emulsion and 100% Rap: Compaction Energy and Influence of Emulsion and Cement Content. Constr. Build. Mater. 2020, 250, 118804. [Google Scholar] [CrossRef]
  24. Arimilli, S.; Jain, P.K.; Nagabhushana, M.N. Optimization of Recycled Asphalt Pavement in Cold Emulsified Mixtures by Mechanistic Characterization. J. Mater. Civil. Eng. 2016, 28, 04015132. [Google Scholar] [CrossRef]
  25. Ayar, P. Effects of Additives on the Mechanical Performance in Recycled Mixtures with Bitumen Emulsion: An Overview. Constr. Build. Mater. 2018, 178, 551–561. [Google Scholar] [CrossRef]
  26. ASTM D854; Standard Test Methods for Specific Gravity of Soil Solids by Water Pycnometer. American Society for Testing and Materials: West Conshohocken, PA, USA, 2000; Volume 2458000, pp. 1–7.
  27. IS:383-1970; Specification for Coarse and Fine Aggregates from Natural Sources for Concrete. Bureau of Indian Standards: New Delhi, India, 1970; pp. 1–24.
  28. Zhu, J.; Ma, T.; Fang, Z. Characterization of Agglomeration of Reclaimed Asphalt Pavement for Cold Recycling. Constr. Build. Mater. 2020, 240, 117912. [Google Scholar] [CrossRef]
  29. Lin, J.; Huo, L.; Xu, F.; Xiao, Y.; Hong, J. Development of Microstructure and Early-Stage Strength for 100% Cold Recycled Asphalt Mixture Treated with Emulsion and Cement. Constr. Build. Mater. 2018, 189, 924–933. [Google Scholar] [CrossRef]
  30. Ghabchi, R.; Barman, M.; Singh, D.; Zaman, M.; Mubaraki, M.A. Comparison of Laboratory Performance of Asphalt Mixes Containing Different Proportions of RAS and RAP. Constr. Build. Mater. 2016, 124, 343–351. [Google Scholar] [CrossRef]
  31. Magar, S.; Xiao, F.; Singh, D.; Showkat, B. Applications of Reclaimed Asphalt Pavement in India—A Review. J. Clean. Prod. 2022, 335, 130221. [Google Scholar] [CrossRef]
  32. ASTM D7906; Standard Practice for Recovery of Asphalt from Solution Using Toluene and the Rotary Evaporator. American Society for Testing and Materials: West Conshohocken, PA, USA, 2014; Volume 12, pp. 6–8. [CrossRef]
  33. ASTM D2171; Standard Test Method for Viscosity of Asphalts by Vacuum Capillary Viscometer. American Society for Testing and Materials: West Conshohocken, PA, USA, 2008; p. 327. [CrossRef]
  34. ASTM D2170; Standard Test Method for Kinematic Viscosity of Asphalts. American Society for Testing and Materials: West Conshohocken, PA, USA, 2015; Volume i, pp. 1–10. [CrossRef]
  35. ASTM D5/D5M-19; Standard Test Method for Penetration of Bituminous Materials. American Society for Testing and Materials: West Conshohocken, PA, USA, 2008. [CrossRef]
  36. ASTM D36; Softening Point of Bitumen (Ring-and-Ball Apparatus). American Society for Testing and Materials: West Conshohocken, PA, USA, 2020.
  37. ASTM D70; Standard Test Method for Density of Semi-Solid Asphalt Binder (Pycnometer Method). American Society for Testing and Materials: West Conshohocken, PA, USA, 2018; p. 5.
  38. ASTM D113-17; Standard Test Method for Ductility of Bituminous Materials. American Society for Testing and Materials: West Conshohocken, PA, USA, 2008. [CrossRef]
  39. IS:8887-2004; Bitumen Emulsion for Roads (Cationic Type)-Specification (Third Revision). Bureau of Indian Standards: New Delhi, India, 2018.
  40. Thanaya, I.N.A.; Zoorob, S.E.; Forth, J.P. A Laboratory Study on Cold-Mix, Cold-Lay Emulsion Mixtures. Proc. Inst. Civil. Eng. Transp. 2009, 162, 47–55. [Google Scholar] [CrossRef]
  41. ASTM D-2216-9; Standard Test Method for Laboratory Determination of Water (Moisture) Content of Soil and Rock by Mass. ASTM International: West Conshohocken, PA, USA, 1998; pp. 1–5. [CrossRef]
  42. Asphalt Institute. MS-14 Asphalt Cold Mix Manual; MS14 Asphalt Institute: Lexington, KY, USA, 1997. [Google Scholar]
  43. IRC SP:100-2014; Use of Cold Mix Technology in Construction and Maintenance of Roads Using Bitumen Emulsion. Indian Roads Congress: New Delhi, India, 2014; p. 100.
  44. Meena, P.; Naga, G.R.R.; Kumar, P.; Monu, K. Effect of Mechanical Properties of Cold Mix Asphalt Mixture Containing Different Proportion of Fillers. Int. J. Pavement Res. Technol. 2023, 1–17. [Google Scholar] [CrossRef]
  45. ASTM D6927; Standard Test Method for Marshall Stability and Flow of Asphalt Mixtures. American Society for Testing and Materials: West Conshohocken, PA, USA, 2015.
  46. ASTM D6931-17; Standard Test Method for Indirect Tensile (IDT) Strength of Bituminous Mixtures. American Society for Testing and Materials: West Conshohocken, PA, USA, 2011.
  47. ASTM D7369-20; Standard Test Method for Determining the Resilient Modulus of Asphalt Mixtures by Indirect Tension Test. American Society for Testing and Materials: West Conshohocken, PA, USA, 2020. [CrossRef]
  48. ASTM D7064/D7064M−21; Standard Practice for Open-Graded Friction Course (OGFC) Asphalt Mixture. American Society for Testing and Materials: West Conshohocken, PA, USA, 2021; pp. 1–7. [CrossRef]
  49. Cheng, L. Developing Evaluation Method of Moisture Susceptibility for Cold Mix Asphalt; University of Wisconsin: Madison, WI, USA, 2013. [Google Scholar]
  50. Ling, C.; Hanz, A.; Bahia, H. Evaluating Moisture Susceptibility of Cold-Mix Asphalt. Transp. Res. Rec. 2014, 2246, 60–69. [Google Scholar] [CrossRef]
  51. Ministry of Road Transport & Highways. MORT&H Fifth Revision; Indian Roads Congress: New Delhi, India, 2013.
  52. Dong, Q.; Yuan, J.; Chen, X.; Ma, X. Reduction of Moisture Susceptibility of Cold Asphalt Mixture with Portland Cement and Bentonite Nanoclay Additives. J. Clean. Prod. 2018, 176, 320–328. [Google Scholar] [CrossRef]
  53. Jain, S.; Singh, B. Recycled Concrete Aggregate Incorporated Cold Bituminous Emulsion Mixture: Mechanical, Environmental and Economic Evaluation. J. Clean. Prod. 2022, 380, 135026. [Google Scholar] [CrossRef]
  54. Behnood, A.; Modiri Gharehveran, M.; Gozali Asl, F.; Ameri, M. Effects of Copper Slag and Recycled Concrete Aggregate on the Properties of CIR Mixes with Bitumen Emulsion, Rice Husk Ash, Portland Cement and Fly Ash. Constr. Build. Mater. 2015, 96, 172–180. [Google Scholar] [CrossRef]
Figure 1. Final design gradation of CMA mixes with 50% RAP and 100% RAP.
Sustainability 16 00344 g001
Figure 2. Physical appearance of aggregates used in CMA design: 13.2 mm coarse aggregates, 6 mm aggregates, and RAP (from left to right).
Sustainability 16 00344 g002
Figure 3. Powder XRD analysis of additive used in CMA with RAP aggregates: (a) ordinary Portland cement; (b) fly ash; (c) Stabil-road.
Sustainability 16 00344 g003
Figure 4. SEM image of ordinary Portland cement additive.
Sustainability 16 00344 g004
Figure 5. SEM image of FA additive.
Sustainability 16 00344 g005
Figure 6. SEM image of SR additive.
Sustainability 16 00344 g006
Figure 7. Flow chart for the present study.
Sustainability 16 00344 g007
Figure 8. Distribution of CM, 50R, and 100R CMA mixes.
Sustainability 16 00344 g008
Figure 9. CM and recycled cold asphalt mixture design graphs: (a) stability versus asphalt residue; (b) density versus asphalt residue; (c) voids versus asphalt residue; (d) VMA versus asphalt residue.
Sustainability 16 00344 g009aSustainability 16 00344 g009b
Figure 10. Air voids values of different recycled cold mixtures.
Sustainability 16 00344 g010
Figure 11. Voids in mineral aggregate of different CMA mixtures.
Sustainability 16 00344 g011
Figure 12. Unit weight of different recycled cold mixtures.
Sustainability 16 00344 g012
Figure 13. MS values of recycled cold mixtures; 1 mm = 0.0393 in.; and 1 kN = 0.224 lb.
Sustainability 16 00344 g013
Figure 14. ITS and TSR of recycled cold mixtures.
Sustainability 16 00344 g014
Figure 15. Effect of filler additives on Marshall Quotient of cold recycled asphalt mixtures: (a) 50%RAP mix; (b) 100% RAP mix.
Sustainability 16 00344 g015
Figure 16. Abrasion loss of CM and recycled cold mixtures.
Sustainability 16 00344 g016
Figure 17. Resilient modulus of CMA with 50% and 100% RAP at different percentages of fillers and frequency at 25 °C. (a) 0.33 Hz; (b) 0.50 Hz; (c) 1.00 Hz.
Sustainability 16 00344 g017aSustainability 16 00344 g017b
Figure 18. Resilient modulus of CMA with 100% RAP at different temperatures.
Sustainability 16 00344 g018
Table 1. Physical properties of VA and RAP materials.
PropertiesValueMORT&H
Specifications
13.2 mm6 mm2.36–0.300 mmStone DustRAP
Bulk specific gravity (gm/cc)2.6522.6412.602.6082.562.50–3.20
Water absorption (%)0.8060.4181.2151.4200.6272.00
Los Angeles abrasion value (%)22.00---22.0035.00
Aggregate impact value (%)15.12---14.5018.00
Combined elongation and flakiness index (%)31.00---26.0035.00
Table 2. Physical properties of bitumen residue and RAP binder.
PropertyBitumen Residue RAP BinderDetermination Method
Absolute viscosity @60 °C (poise)1156-(ASTM D2171, 2018) [33]
Viscosity at 135 °C (c St)2955714(ASTM D2170, 2015) [34]
Penetration (25 °C, 100 gm, 5 s, 0.1 mm)10017(ASTM D5/D5M-19, 2008) [35]
Softening point-84(ASTM D36) [36]
Relative density1.0251.052(ASTM D70, 2018) [37]
Ductility at 27 °C54-(ASTM D113-17, 2008) [38]
Table 3. Chemical composition of filler additives.
Chemical NameCement Concentration (%)FA Concentration (%)SR Concentration (%)
CaCO328.812.510.1
Al2O324.34.130.8
NaCl11.41.23.5
Na2O75.62.9
SiO25.742.317.1
CaO5.911.41
Fe2O34.32.35.4
MgO11.22.52.3
K2O0.610.06.9
N2O0.98.120.2
Specific Gravity3.152.6082.570
Table 4. Summary of the ANOVA analysis on the effect of filler additives on Marshall Quotient of cold recycled asphalt mixtures.
Source of VariationSum of Square (SS)Mean Square (MS)Fp-ValueF Critical Value
50% RAP466.29312693.2586252125.2156542.72 × 10−322.35380896
100% RAP437.768318287.5536636453.541824286.5056× 10−222.35380896
Disclaimer/Publisher’s Note: The statements, opinions and data contained in all publications are solely those of the individual author(s) and contributor(s) and not of MDPI and/or the editor(s). MDPI and/or the editor(s) disclaim responsibility for any injury to people or property resulting from any ideas, methods, instructions or products referred to in the content.

