
Analysis of Spatiotemporal Evolution and Influencing Factors of Vegetation Net Primary Productivity in the Yellow River Basin from 2000 to 2022


 ,
,
Abstract
:1. Introduction
2. Data and Method
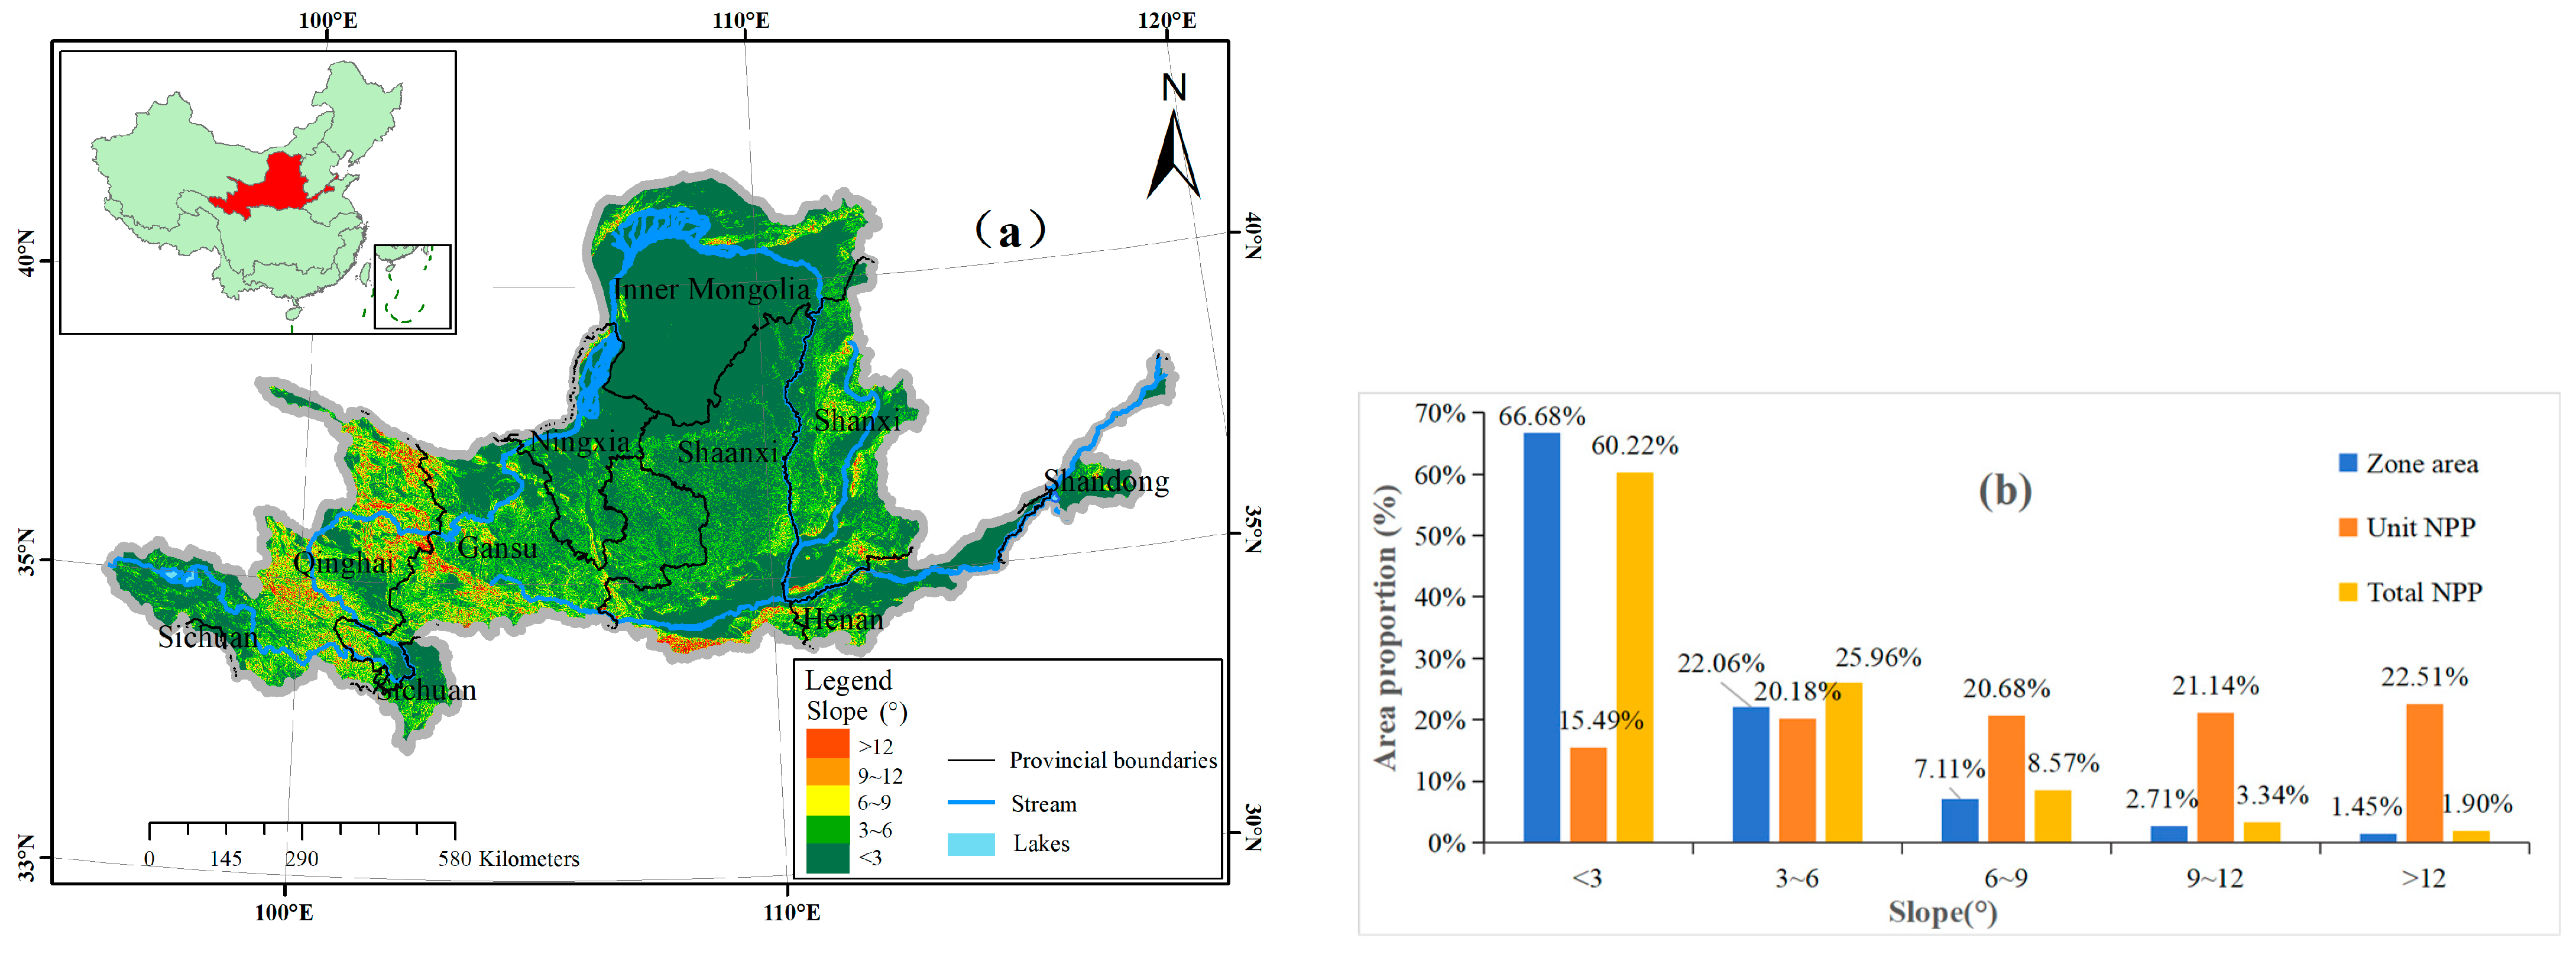
2.1. Study Area
2.2. Data
2.2.1. NPP
2.2.2. Static Factors Data
2.2.3. Dynamic Factors Data
- Meteorological data
- 2.
- TWS data
- 3.
- Human activity data
2.3. Method
2.3.1. Miami Model
2.3.2. Trend Analysis
2.3.3. Stability Analysis
2.3.4. Geographical Detector
2.3.5. Transfer Matrix
3. Results and Analysis
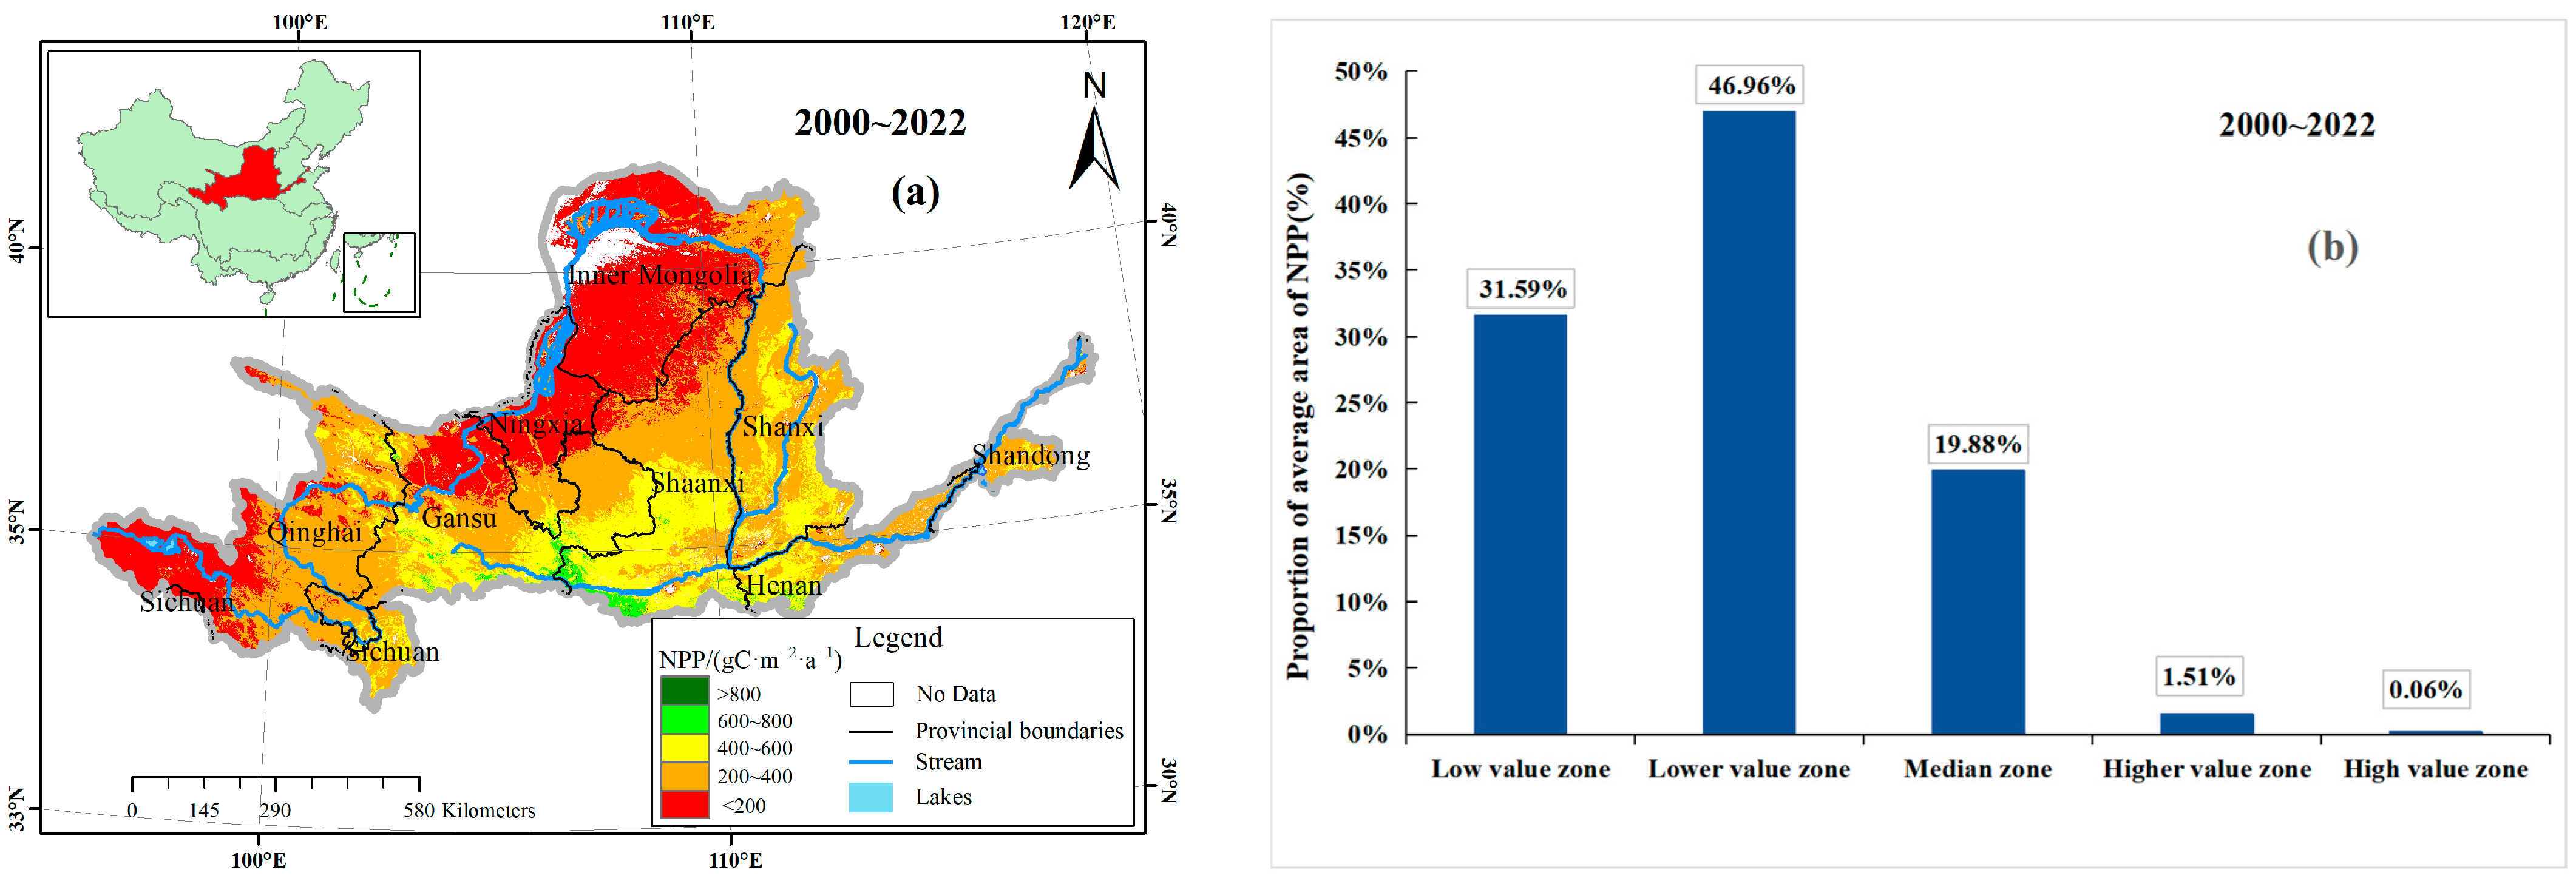
3.1. Spatiotemporal Distribution Characteristics of Vegetation NPP in the Yellow River Basin
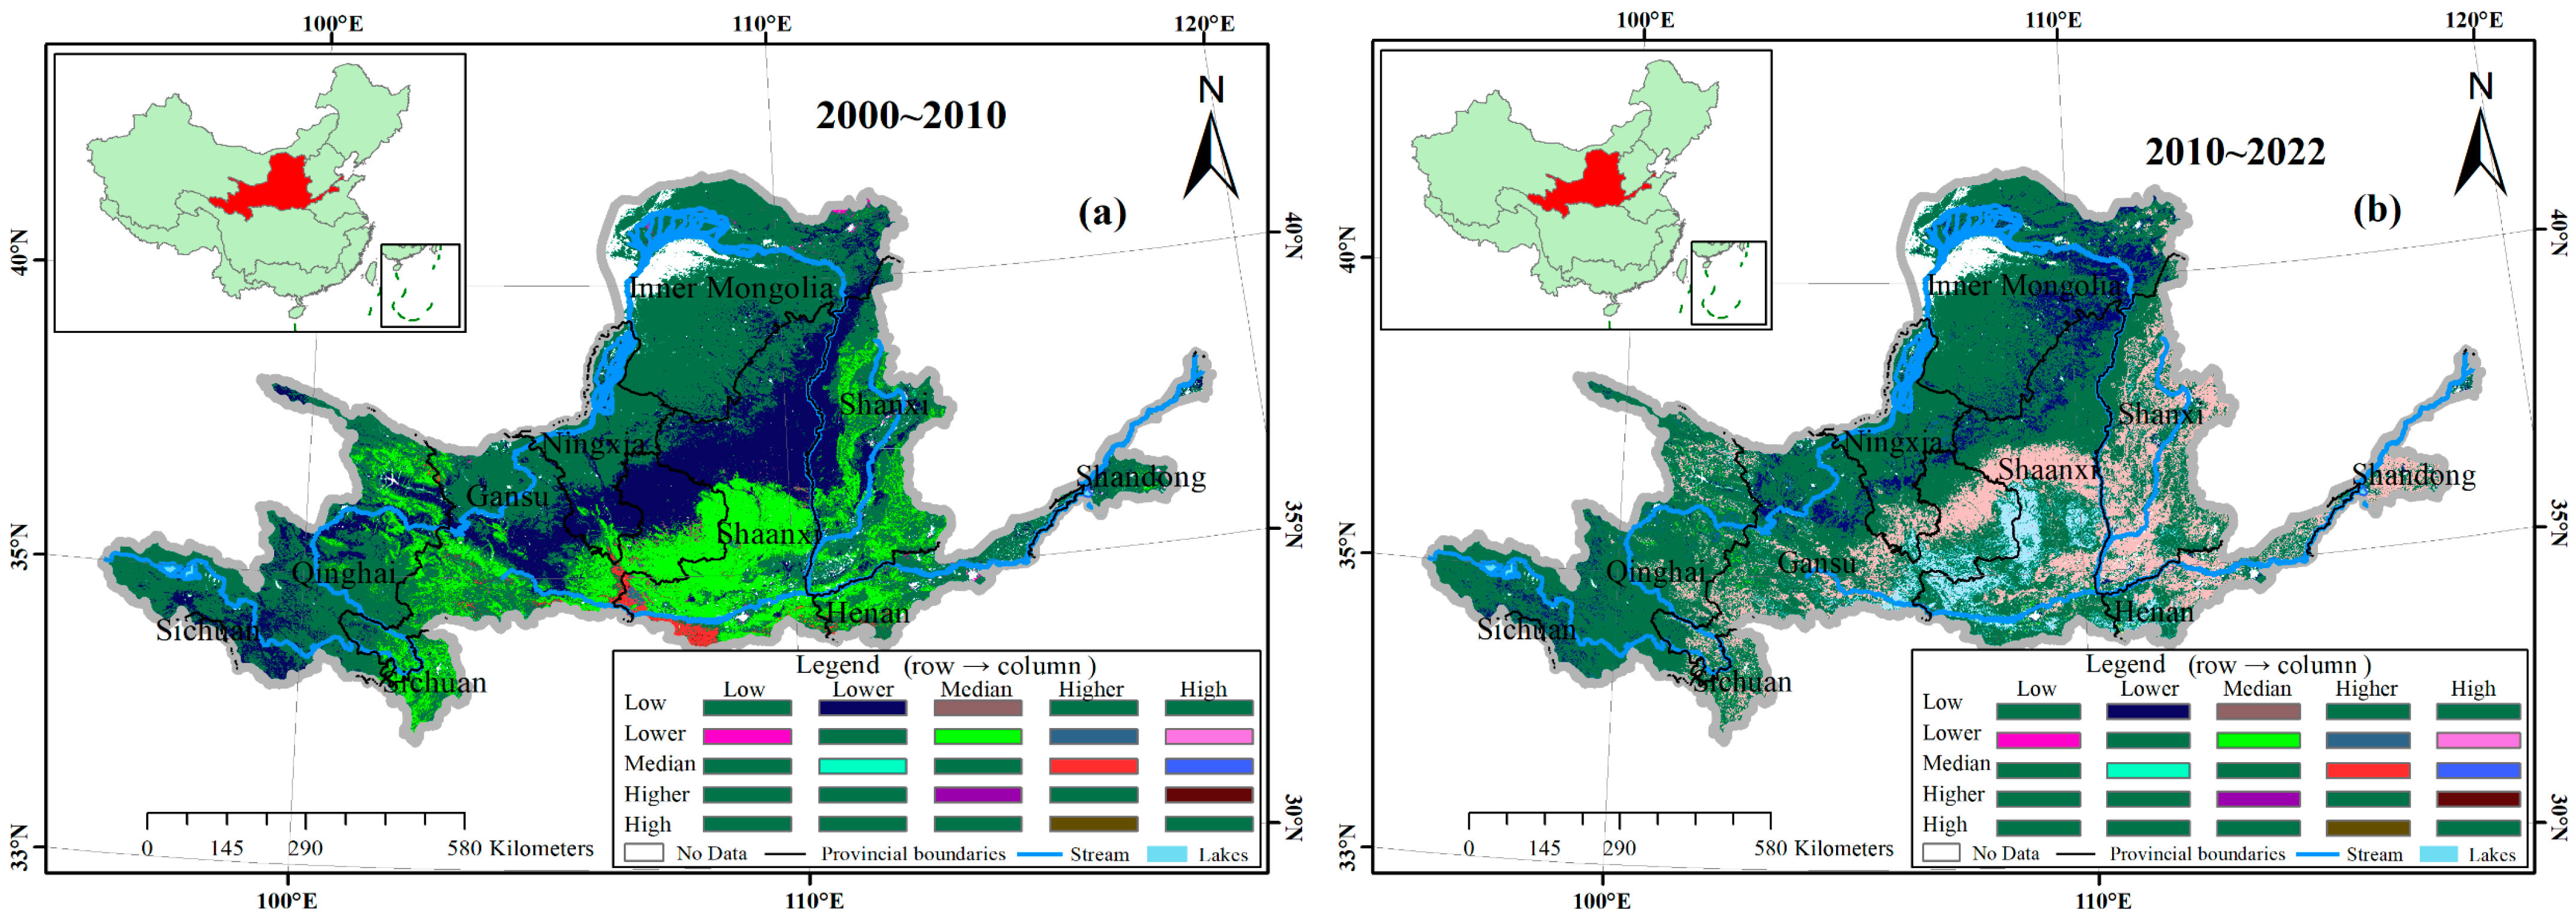
3.1.1. Spatiotemporal Changes in Vegetation NPP in the Yellow River Basin from 2000 to 2022
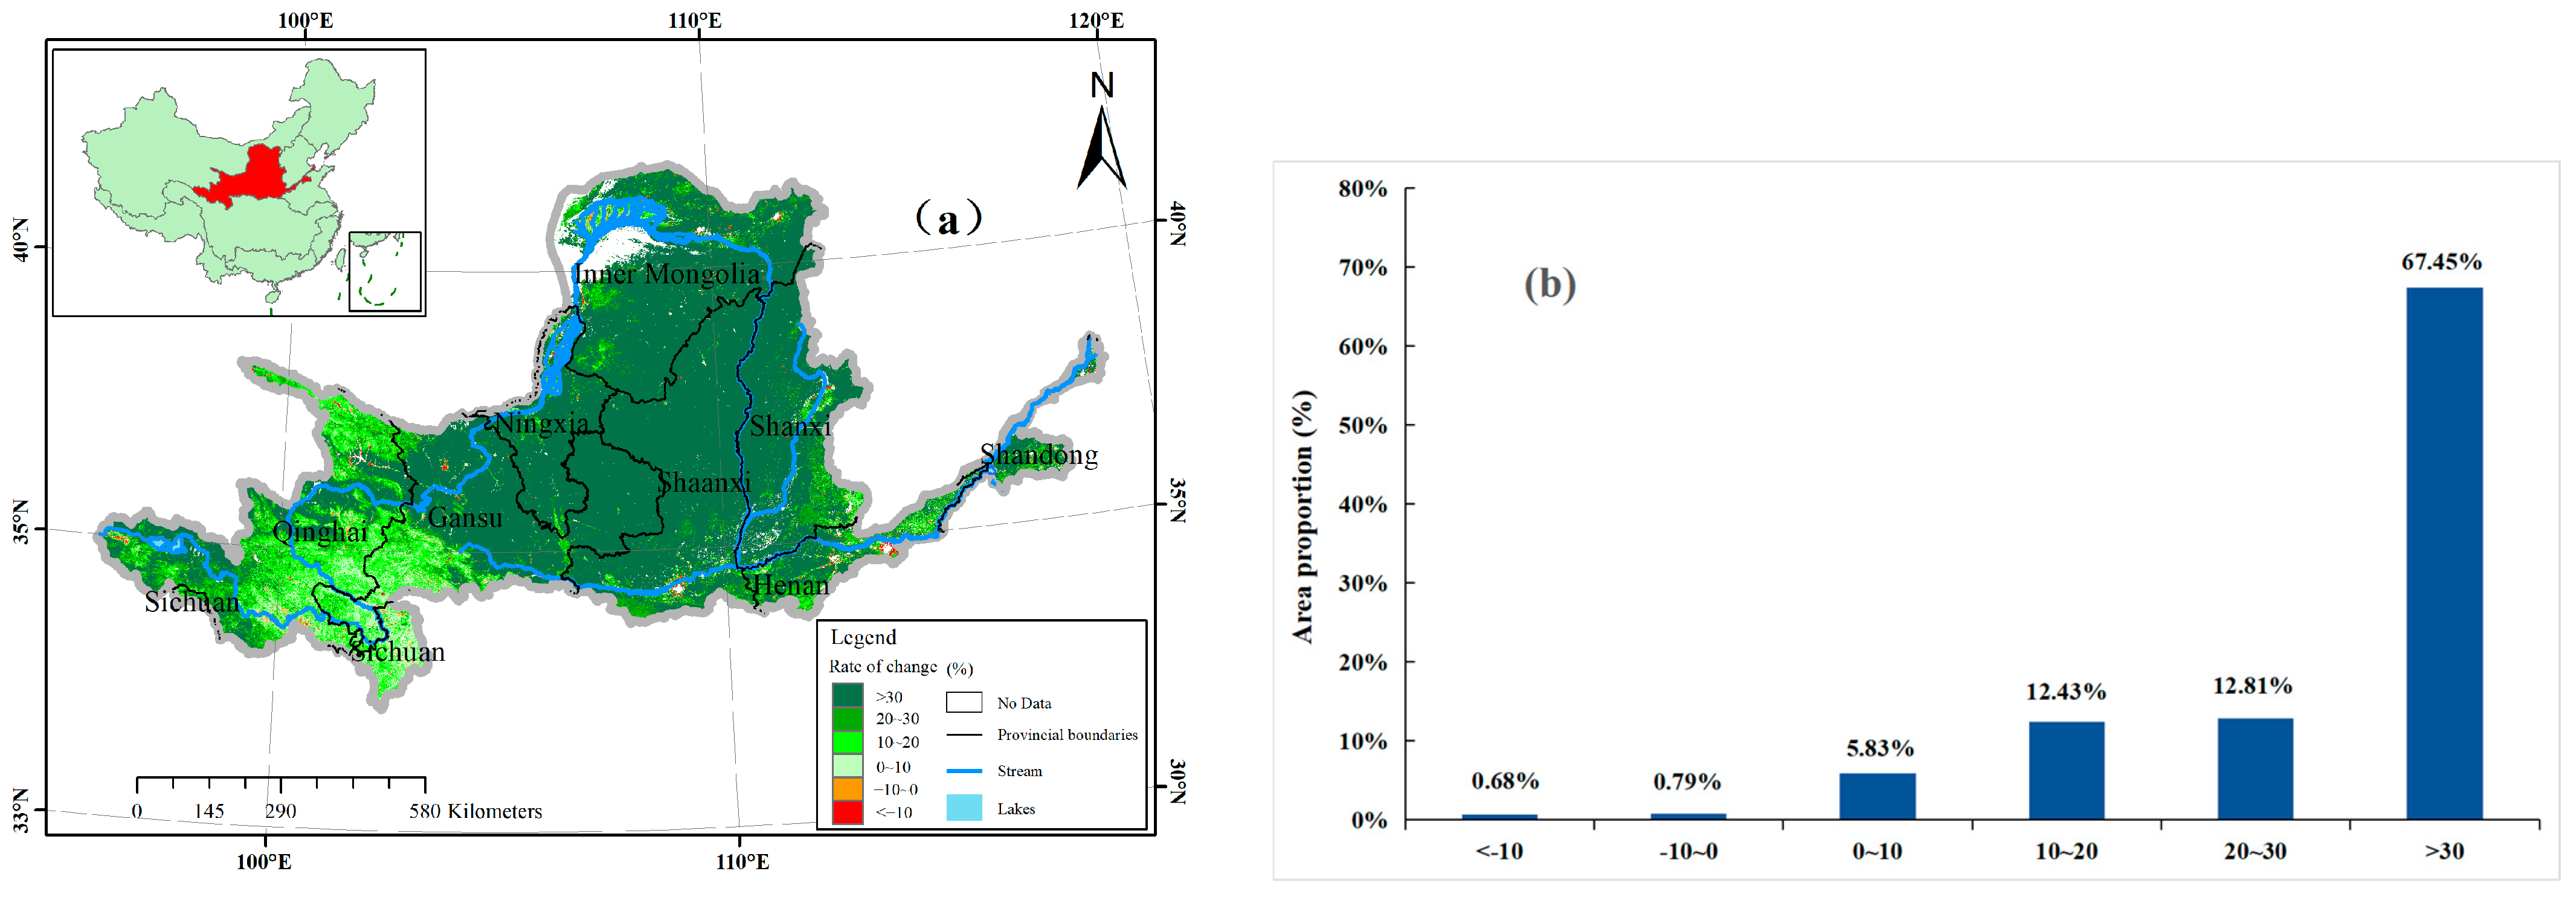
3.1.2. Change Rate and Stability Analysis
3.2. Static Factors Analysis on Vegetation NPP in the YRB
3.2.1. Geographical Location Analysis on Vegetation NPP in the YRB
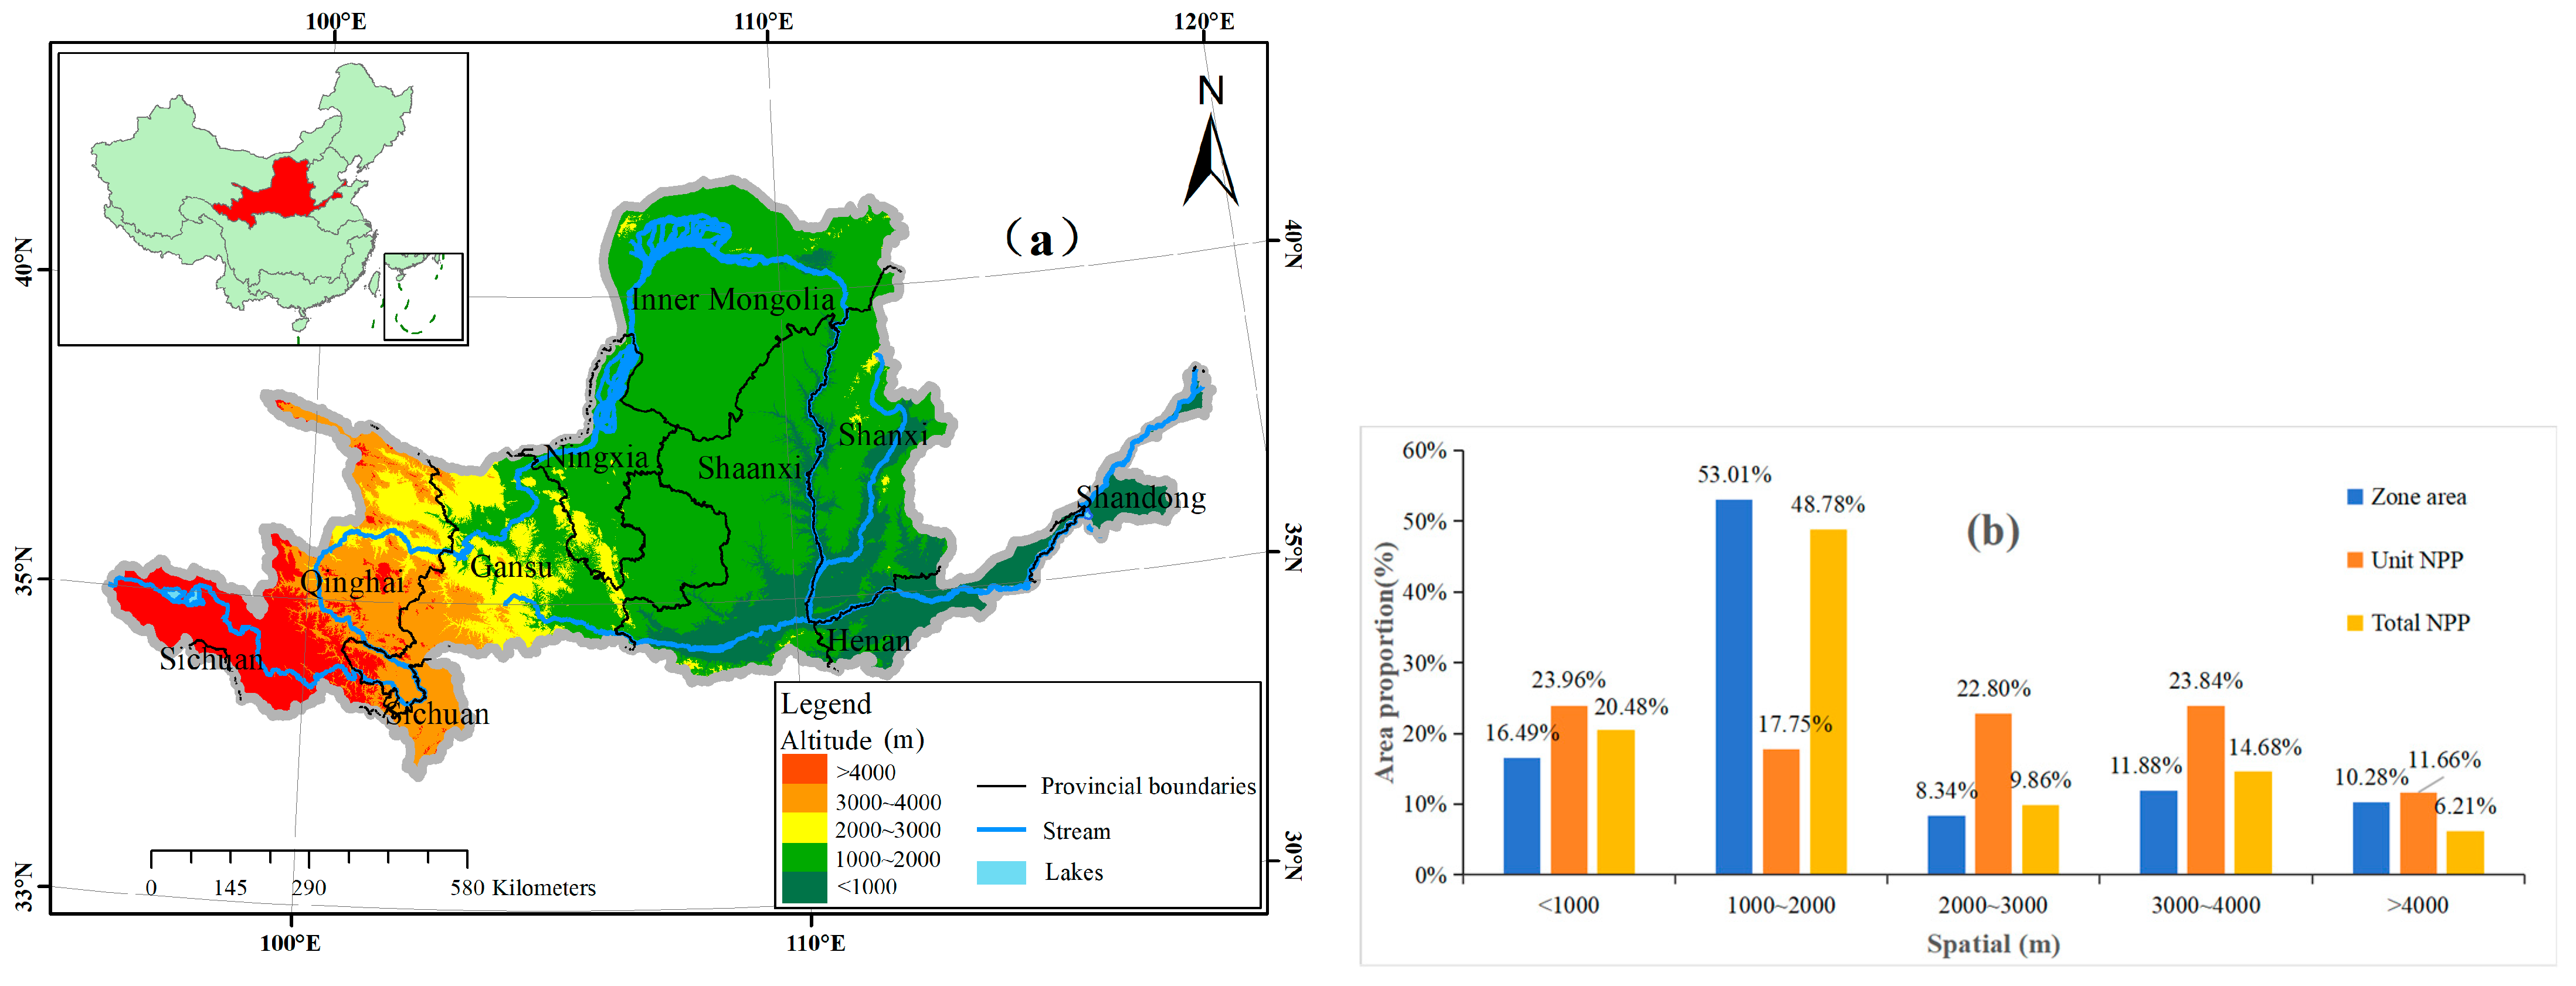
3.2.2. Altitude Analysis on Vegetation NPP in the YRB
3.2.3. Slope Analysis on Vegetation NPP in the YRB
3.3. Dynamic Factors Analysis Analysis on Vegetation NPP in the YRB
3.3.1. Correlation Analysis on Vegetation NPP in the YRB
3.3.2. Single Factor Analysis on Vegetation NPP in the YRB
4. Discussion
5. Conclusions
Author Contributions
Funding
Data Availability Statement
Conflicts of Interest
References
- Misra, R. Primary productivity of the biosphere. Agro-Ecosystems 1979, 5. [Google Scholar] [CrossRef]
- Guo, B.; Yang, F.; Fan, Y.W.; Zang, W.Q. The dominant driving factors of rocky desertification and their variations in typical mountainous karst areas of Southwest China in the context of global change. Catena 2023, 220, 106674. [Google Scholar] [CrossRef]
- Bao, G.; Bao, Y.; Qin, Z.; Xin, X.; Bao, Y.; Bayarsaikan, S.; Zhou, Y.; Chuntai, B. Modeling net primary productivity of terrestrial ecosystems in the semi-arid climate of the Mongolian Plateau using LSWI-based CASA ecosystem model. Int. J. Appl. Earth Obs. Geoinf. 2016, 46, 84–93. [Google Scholar] [CrossRef]
- Zhang, Y.; Wang, Q.; Wang, Z.; Yang, Y.; Li, J. Impact of human activities and climate change on the grassland dynamics under different regime policies in the Mongolian Plateau. Sci. Total Environ. 2020, 698, 134304. [Google Scholar] [CrossRef] [PubMed]
- Ruimy, A.; Saugie, B.; Dedieu, G. Methodology for the estimation of terrestrial net primary production from remotely sensed data. J. Geophys. Res. 1994, 99, 5263–5283. [Google Scholar] [CrossRef]
- Field, C.B.; Behrenfeld, M.J.; Randerson, J.T.; Falkowski, P. Primary production of the biosphere:integrating terrestrial and oceanic components. Science 1998, 281, 237–240. [Google Scholar] [CrossRef] [PubMed]
- Cao, H.J. Estimation and Spatiotemporal Evolution of Net Primary Productivity of Vegetation in the Hexi Corridor Based on Random Forests. Master’s Thesis, Northwest Normal University, Lanzhou, China, 2019. [Google Scholar]
- Anderson, R.G.; Goulden, M.L. Relationships between climate, vegetation, and energy exchange across a montane gradient. J. Geophys. Res. 2011, 116, G01026. [Google Scholar] [CrossRef]
- Du, W. Temporal and Spatial Changes of Forest Biomass in China and Its Response to Climate Change. Master’s Thesis, Nanjing Forestry University, Nanjing, China, 2018. [Google Scholar]
- Jin, K. Spatial and Temporal Changes in Vegetation Cover in China and Their Relationship with Climate and Human Activities. Ph.D. Thesis, Northwest A&F University, Xianyang, China, 2019. [Google Scholar]
- Fang, J.; Piao, S.; Field, C.B.; Pan, Y.; Guo, Q.; Zhou, L.; Peng, C.; Tao, S. Increasing net primary production in China from 1982 to 1999. Ecol. Soc. Am. 2003, 1, 293–297. [Google Scholar] [CrossRef]
- Gang, C.; Zhao, W.; Zhao, T.; Zhang, Y.; Gao, X.; Wen, Z. The impacts of land conversion and management measures on the grassland net primary productivity over the Loess Plateau, Northern China. Sci. Total Environ. 2018, 645, 827–836. [Google Scholar] [CrossRef]
- Yuan, Z.H.; Lei, J.; Bao, G.; Sa, C.L.; Suri, G.G.; Chi, Y.F. The impact of land use/cover change on vegetation coverage in the Hunshandak sandy land. J. Soil Water Conserv. 2016, 30, 330–338. [Google Scholar]
- Sun, Y.; Yang, Y.; Zhang, Y.; Wang, Z. Assessing vegetation dynamics and their relationships with climatic variability in northern China. Phys. Chem. Earth 2015, 87–88, 79–86. [Google Scholar] [CrossRef]
- Dong, S.Y.; Liu, W.W. Implementing the New Development Concept to Assist in Carbon Peak and Carbon Neutrality. People’s Daily, 11 April 2023. [Google Scholar]
- De Marco, A.; Fioretto, A.; Giordano, M.; Innangi, M.; Menta, C.; Papa, S.; Virzo De Santo, A.C. Stocks in Forest Floor and Mineral Soil of Two Mediterranean Beech Forests. Forests 2016, 7, 181. [Google Scholar] [CrossRef]
- Hazarika, M.K.; Yasuoka, Y.; Ito, A.; Dye, D. Estimation of net primary productivity by integrating remote sensing data with an ecosystem model. Remote Sens. Environ. 2005, 94, 298–310. [Google Scholar] [CrossRef]
- Zhou, Y.; Xing, B.; Ju, W. Assessing the impact of urban sprawl on net primary productivity of terrestrial ecosystems using a process-based model—A case study in Nanjing, China. IEEE J. Sel. Top. Appl. Earth Obs. Remote Sens. 2015, 8, 2318–2331. [Google Scholar] [CrossRef]
- Zhang, R.; Zhou, Y.; Luo, H.; Wang, F.; Wang, S. Estimation and analysis of spatiotemporal dynamics of the net primary productivity integrating efficiency model with process model in karst area. Remote Sens. 2017, 9, 477. [Google Scholar] [CrossRef]
- Zhou, W.; Mou, F.Y.; Gang, C.C.; Guan, D.J.; He, J.F.; Li, J.L. The spatiotemporal dynamics of net primary productivity of grasslands in China from 1982 to 2010 and its relationship with climate factors. J. Ecol. 2017, 37, 4335–4345. [Google Scholar]
- Yang, X.; Guo, B.; Han, B.M.; Chen, S.T.; Yang, F.; Fan, Y.W.; He, T.L.; Liu, Y. Analysis of the spatiotemporal evolution pattern and driving mechanism of NPP in the Qinghai Tibet Plateau. Resour. Environ. Yangtze River Basin 2019, 28, 3038–3050. [Google Scholar]
- Lu, L.; Li, X.; Frank, V. Remote sensing estimation of net primary productivity of vegetation in the Heihe River Basin. J. Desert Res. 2005, 6, 31–38. [Google Scholar]
- Lieth, H. Primary production: Terrestrial ecosystems. Hum. Ecol. 1973, 1, 303–332. [Google Scholar] [CrossRef]
- Running, S.W.; Hunt, E. Generalization of a Forest Ecosystem Process Model for Other Biomes, BIOME-BGC, and an Application for Global-Scale Models. In Scaling Physiological Processes; Academic Press, Inc.: San Diego, CA, USA, 1993; pp. 141–158. [Google Scholar]
- Potter, C.S.; Randerson, J.T.; Field, C.B.; Matson, P.A.; Vitousek, P.M.; Mooney, H.A.; Klooster, S.A. Terrestrial ecosystem production: A process model based on global satellite and surface data. Glob. Biogeochem. Cycles 1993, 7, 811–841. [Google Scholar] [CrossRef]
- Field, C.B.; Randerson, J.T.; Malmstrom, C.M. Global net primary production: Combining ecology and remote sensing. Remote Sens. Environ. 1995, 51, 74–88. [Google Scholar] [CrossRef]
- Zhou, G.S.; Zhang, X.S. A Preliminary Study on the Net Primary Productivity Model of Natural Vegetation. J. Plant Ecol. 1995, 19, 193–200. [Google Scholar]
- Xiao, F.J.; Liu, Q.F.; Xu, Y.Q. Estimation of Terrestrial Net Primary Productivity in the Yellow River Basin of China Using Light Use Efficiency Model. Sustainability 2022, 14, 7399. [Google Scholar] [CrossRef]
- Mowll, W.; Blumenthal, D.M.; Cherwin, K.; Symstad, A.J.; Vermeire, L.T.; Collins, S.L.; Smith, M.D.; Knapp, A.K. Climatic controls of aboveground net primary production in semi-arid grasslands along a latitudinal gradient portendlow sensitivity to warming. Oecologia 2015, 177, 959–969. [Google Scholar] [CrossRef] [PubMed]
- Terwayet, B.O.; Zhang, W.C.; Terwayet, B.H. Assessment of drought characteristics and its impacts on net primary productivity (NPP) in southeastern Tunisia. Arab. J. Geosci. 2022, 16, 26. [Google Scholar] [CrossRef]
- Seino, H.; Uchijima, Z. Agroclimatic Evaluation of Net Primary Productivity of Natural Vegetation: Assessment of Total Net Primary Production in Japan. J. Agric. Meteorol. 1985, 41, 139–144. [Google Scholar] [CrossRef]
- Vernet, M.; Ellingsen, I.; Marchese, C.; Bélanger, S.; Cape, M.; Slagstad, D.; Matrai, P.A. Spatial variability in rates of Net Primary Production (NPP) and onset of the spring bloom in Greenland shelf waters. Prog. Oceanogr. 2021, 198, 102655. [Google Scholar] [CrossRef]
- Li, D.K.; Wang, Z. Analysis of NPP Change Characteristics of Land Vegetation in China Based on MOD17A3. J. Ecol. Environ. 2018, 27, 397–405. [Google Scholar]
- Hong, C.Q. Research on the Impact of NPP Based Land Remediation on Cultivated Land Productivity. Master’s Thesis, Nanjing University of Information Technology, Nanjing, China, 2018. [Google Scholar]
- Li, L. Research on the Impact of Climate Change and Human Activities on NPP Changes of Vegetation in Northwest China. Master’s Thesis, Shaanxi Normal University, Xi’an, China, 2019. [Google Scholar]
- Zhang, Y.Z.; Gong, J.; Yang, J.X.; Peng, J. Evaluation of Future Trends Based on the Characteristics of Net Primary Production (NPP) Changes over 21 Years in the Yangtze River Basin in China. Sustainability. 2023, 15, 10606. [Google Scholar] [CrossRef]
- Lagomarsino, A.; Mazza, G.; Agnelli, A.E.; Lorenzetti, R.; Bartoli, C.; Viti, C.; Colombo, C.; Pastorelli, R. Litter fractions and dynamics in a degraded pine forest after thinning treatments. Eur. J. For. Res. 2020, 139, 295–310. [Google Scholar] [CrossRef]
- Li, Y.L.; Pan, X.Z.; Wang, C.K.; Liu, Y.; Zhao, Q.G. The spatiotemporal distribution characteristics and driving factors of net primary productivity of vegetation in Guangxi from 2000 to 2011. J. Ecol. 2014, 34, 5220–5228. [Google Scholar]
- Zhang, F.; Zhou, G.S.; Wang, Y.H. Dynamic simulation of net primary productivity of typical grassland vegetation in Inner Mongolia based on CASA model. J. Plant Ecol. 2008, 4, 786–797. [Google Scholar]
- Piao, S.L.; Fang, J.Y.; He, J.S. Variations in vegetation net primary production in the Qinghai-Xizang plateau, China, from 1982 to 1999. Clim. Chang. 2006, 74, 253–267. [Google Scholar] [CrossRef]
- Zhang, K.; Zhu, C.M.; Ma, X.D.; Zhang, X.; Yang, D.H.; Shao, Y.K. Spatiotemporal Variation Characteristics and Dynamic Persistence Analysis of Carbon Sources/Sinks in the Yellow River Basin. Remote Sens. 2023, 15, 323. [Google Scholar] [CrossRef]
- Jiang, T.; Wang, X.L.; Afzal, M.M.; Sun, L.; Luo, Y. Vegetation Productivity and Precipitation Use Efficiency across the Yellow River Basin: Spatial Patterns and Controls. Remote Sens. 2022, 14, 5074. [Google Scholar] [CrossRef]
- Yang, Y.J.; Li, H.Y. Monitoring spatiotemporal characteristics of land-use carbon emissions and their driving mechanisms in the Yellow River Delta: A grid-scale analysis. Environ. Res. 2022, 214, 114151. [Google Scholar] [CrossRef]
- Zhang, Z.W.; Liu, Y.F. Spatial Expansion and Correlation of Urban Agglomeration in the Yellow River Basin Based on Multi-Source Nighttime Light Data. Sustainability 2022, 14, 9359. [Google Scholar] [CrossRef]
- Liu, S.C.; Shao, Q.Q.; Ning, J.; Niu, L.N.; Zhang, X.Y.; Liu, G.B.; Huang, H.B. Remote-Sensing-Based Assessment of the Ecological Restoration Degree and Restoration Potential of Ecosystems in the Upper Yellow River over the Past 20 Years. Remote Sens. 2022, 14, 3550. [Google Scholar] [CrossRef]
- Tian, H.W.; Ji, X.J.; Zhang, F.M. Spatiotemporal variations of vegetation net primary productivity and its response to meteorological factors across the yellow river basin during the period 1981–2020. Front. Environ. Sci. 2022, 10, 949564. [Google Scholar] [CrossRef]
- Zhang, F.; Hu, X.S.; Zhang, J.; Li, C.Y.; Zhang, Y.P.; Li, X.L. Change in Alpine Grassland NPP in Response to Climate Variation and Human Activities in the Yellow River Source Zone from 2000 to 2020. Sustainability 2022, 14, 8790. [Google Scholar] [CrossRef]
- Xue, S.B.; Ma, B.; Wang, C.G.; Li, Z.B. Identifying key landscape pattern indices influencing the NPP: A case study of the upper and middle reaches of the Yellow River. Ecol. Model. 2023, 484, 110457. [Google Scholar] [CrossRef]
- Wei, Z.Y.; Jian, Z.; Sun, Y.J.; Pan, F.; Han, H.F.; Liu, Q.H.; Mei, Y. Ecological sustainability and high-quality development of the Yellow River Delta in China based on the improved ecological footprint model. Sci. Rep. 2023, 13, 3821. [Google Scholar] [CrossRef] [PubMed]
- Song, Y.; Liang, T.; Zhang, L.B.; Hao, C.Z.; Wang, H. Spatio-Temporal Changes and Contribution of Human and Meteorological Factors to Grassland Net Primary Productivity in the Three-Rivers Headwater Region from 2000 to 2019. Atmosphere 2023, 14, 278. [Google Scholar] [CrossRef]
- Xuan, W.X.; Rao, L.Y. Spatiotemporal dynamics of net primary productivity and its influencing factors in the middle reaches of the Yellow River from 2000 to 2020. Front. Plant Sci. 2023, 14, 1043807. [Google Scholar] [CrossRef] [PubMed]
- Chen, S.; Zhang, Q.; Chen, Y.; Zhou, H.; Xiang, Y.; Liu, Z.; Hou, Y. Vegetation Change and Eco-Environmental Quality Evaluation in the Loess Plateau of China from 2000 to 2020. Remote Sens. 2023, 15, 424. [Google Scholar] [CrossRef]
- Zhu, Z.Y.; Mei, Z.K.; Li, S.L.; Ren, G.X.; Feng, Y.Z. Evaluation of Ecological Carrying Capacity and Identification of Its Influencing Factors Based on Remote Sensing and Geographic Information System: A Case Study of the Yellow River Basin in Shaanxi. Land 2022, 11, 1080. [Google Scholar] [CrossRef]
- Hong, L.L.; Shen, Y.; Ma, H.B.; Zhang, P.; Huo, X.-R.; Wen, H.-C. Temporal and spatial variation of vegetation net primary productivity and its driving factors in Ningxia, China from 2000 to 2019. J. Appl. Ecol. 2022, 10, 2769–2776. [Google Scholar]
- Zhang, X.N.; Nian, L.L.; Liu, X.Y.; Samuel, A.; Yang, Y.B.; Li, X.D.; Wang, Q.X. The spatiotemporal response of photosynthetic accumulation per leaf area to climate change on alpine grassland. Glob. Ecol. Conserv. 2023, 43, e02467. [Google Scholar] [CrossRef]
- Wang, Z.L.; Dong, C.; Dai, L.; Wang, R.Y.; Liang, Q.; He, L.H.; Wei, D. Spatiotemporal evolution and attribution analysis of grassland NPP in the Yellow River source region, China. Ecol. Inform. 2023, 76, 102135. [Google Scholar] [CrossRef]
- Tian, Z.H.; Qin, T.L.; Wang, H.L.; Li, Y.Z.; Yan, S.; Hou, J.; Abebe, S.A. Delayed response of net primary productivity with climate change in the Yiluo River basin. Front. Earth Sci. 2023, 10, 1017819. [Google Scholar] [CrossRef]
- Wei, H.J.; Xue, D.; Huang, J.C.; Liu, M.X.; Li, L. Identification of Coupling Relationship between Ecosystem Services and Urbanization for Supporting Ecological Management: A Case Study on Areas along the Yellow River of Henan Province. Remote Sens. 2022, 14, 2277. [Google Scholar] [CrossRef]
- Wang, J.X.; Qiu, S.K.; Du, J.; Meng, S.W.; Wang, C.; Teng, F.; Liu, Y.Y. Spatial and Temporal Changes of Urban Built-Up Area in the Yellow River Basin from Nighttime Light Data. Land 2022, 11, 1067. [Google Scholar] [CrossRef]
- Guo, B.; Liu, Y.F.; Fan, J.F.; Lu, M.; Zang, W.; Liu, C.; Wang, B.; Huang, X.; Lai, J.; Wu, H. The salinization process and its response to the combined processes of climate change–human activity in the Yellow River Delta between 1984 and 2022. Catena 2023, 231, 107301. [Google Scholar] [CrossRef]
- Zhang, X.N.; Nian, L.L.; Liu, X.Y.; Li, X.D.; Adingo, S.; Liu, X.L.; Zhang, Y.Q. Spatial–Temporal Correlations between Soil pH and NPP of Grassland Ecosystems in the Yellow River Source Area, China. Int. J. Environ. Res. Public Health 2022, 19, 8852. [Google Scholar] [CrossRef] [PubMed]
- Zhou, J.; Zhang, B.; Zhang, Y.W.; Su, Y.; Chen, J.; Zhang, X. Research on the Trade-Offs and Synergies of Ecosystem Services and Their Impact Factors in the Taohe River Basin. Sustainability 2023, 15, 9689. [Google Scholar] [CrossRef]
- Shao, Y.J.; Liu, Y.S.; Li, Y.H.; Yuan, X.F. Regional ecosystem services relationships and their potential driving factors in the Yellow River Basin, China. J. Geogr. Sci. 2023, 33, 863–884. [Google Scholar] [CrossRef]
- Tian, K.J.; Wang, Z.T.; Li, F.P.; Gao, Y.; Xiao, Y.; Liu, C. Drought Events over the Amazon River Basin (1993–2019) as Detected by the Climate-Driven Total Water Storage Change. Remote Sens. 2021, 13, 1124. [Google Scholar] [CrossRef]
- Wang, Z.T.; Tian, K.J.; Li, F.P.; Xiong, S.; Gao, Y.; Wang, L.; Zhang, B. Using Swarm to Detect Total Water Storage Changes in 26 Global Basins (Taking the Amazon Basin, Volga Basin and Zambezi Basin as Examples). Remote Sens. 2021, 13, 2659. [Google Scholar] [CrossRef]
- Box, E.; Lieth, H.; Wolaver, T. Miami model productivity map. In primary production of terrestrial ecosystems. Hum. Ecol. 1982, 1, 303–332. [Google Scholar]
- Chen, S.T.; Guo, B.; Yang, F.; Han, B.M.; Fan, Y.W.; Yang, X.; He, T.L.; Liu, Y.; Yang, X.W. The spatiotemporal variation pattern of vegetation NPP on the Qinghai Tibet Plateau from 2000 to 2015 and its response to climate change. J. Nat. Resour. 2020, 35, 2511–2527. [Google Scholar]
- Thorpe, J.; Wolfe, S.A.; Houston, B. Potential impacts of climate change on grazing capacity of native grasslands in the Canadian prairies. Can. J. Soil Sci. 2008, 88, 595–609. [Google Scholar] [CrossRef]
- Ju, L.J.; Ouyang, X.Z.; Pan, P.; Liu, J.; Zhou, Q.Q.; Ye, Q.L. The spatiotemporal changes of net primary productivity of forests in Gannan from 2000 to 2019 and their relationship with climate factors. J. Northeast For. Univ. 2022, 50, 37–44. [Google Scholar]
- Wang, J.F.; Xu, C.D. Geographic detectors: Principles and prospects. J. Geogr. 2017, 72, 116–134. [Google Scholar]
- Wang, G.; Yue, D.P.; Yu, Q. Regulated Ecosystem Services Trade-Offs: Synergy Research and Driver Identification in the Vegetation Restoration Area of the Middle Stream of the Yellow River. Remote Sens. 2022, 14, 718. [Google Scholar] [CrossRef]
- Ma, D.L.; Huang, Q.J.; Liu, B.Z.; Zhang, Q. Analysis and Dynamic Evaluation of Eco-Environmental Quality in the Yellow River Delta from 2000 to 2020. Sustainability 2023, 15, 7835. [Google Scholar] [CrossRef]


| Data | Period | Spatial Resolution | Website (Access Data: 30 December 2023) | |
|---|---|---|---|---|
| NPP | 2000–2022 | 500 m | https://ladsweb.nascom.nasa.gov/ | |
| Static factors | Geographical location | 1 km | http://www.Gscloud.cn | |
| Elevation | ||||
| Slope | ||||
| Soil type | ||||
| Dynamic factors | Accumulated temperature | 2000–2019 | 1 km | http://data.cma.cn/data |
| Sunshine duration | ||||
| Temperature | ||||
| Precipitation | ||||
| TWS | 2003–2019 | 0.25° | http://data.tpdc.ac.cn/data | |
| Land use | 2000, 2005, 2010, 2015, 2019 | 1 km | http://www.resdc.cn | |
| Population density | ||||
| GDP | ||||
| NPP (gC·m−2·a−1) | NPP Categories | Area Ratio (2000) | Area Ratio (2022) | Area Ratio Change (2000–2022) |
|---|---|---|---|---|
| <200 | Low | 53.42% | 27.98% | −25.44% |
| 200~400 | Lower | 41.62% | 35.49% | −6.13% |
| 400~600 | Median | 2.60% | 30.84% | 28.24% |
| 600~800 | Higher | 2.35% | 5.59% | 3.24% |
| >800 | High | 0.01% | 0.10% | 0.09% |
| Spatial (m) | Spatial Proportion (%) | Unit NPP (gC·m−2·a−1) | RMS (gC·m−2·a−1) | Unit NPP Proportion (%) | Total NPP (gC·m−2·a−1) | Total NPP Proportion (%) |
|---|---|---|---|---|---|---|
| <1000 | 16.49% | 344.37 | 122.68 | 23.96% | 56.79 | 20.48% |
| 1000~2000 | 53.01% | 255.14 | 152.37 | 17.75% | 135.25 | 48.78% |
| 2000~3000 | 8.34% | 327.68 | 148.4 | 22.80% | 27.33 | 9.86% |
| 3000~4000 | 11.88% | 342.62 | 77.33 | 23.84% | 40.70 | 14.68% |
| >4000 | 10.28% | 167.55 | 75.94 | 11.66% | 17.22 | 6.21% |
| Slope (°) | Slope Proportion (%) | Unit NPP (gC·m−2·a−1) | RMS (gC·m−2·a−1) | Unit NPP Proportion (%) | Total NPP (gC·m−2·a−1) | Total NPP Proportion (%) |
|---|---|---|---|---|---|---|
| <3 | 66.68% | 250.46 | 138.1 | 15.49% | 167.01 | 60.22% |
| 3~6 | 22.06% | 326.39 | 136.12 | 20.18% | 72.00 | 25.96% |
| 6~9 | 7.11% | 334.43 | 146.67 | 20.68% | 23.78 | 8.57% |
| 9~12 | 2.71% | 341.94 | 156.84 | 21.14% | 9.27 | 3.34% |
| >12 | 1.45% | 364.02 | 170.83 | 22.51% | 5.28 | 1.90% |
| Correlation Coefficient | Correlation | Area Proportion | ||||
|---|---|---|---|---|---|---|
| Accumulated Temperature | Sunshine | Precipitation | Air Temperature | TWS | ||
| −1~−0.8 | Negative extremely strong | 0% | 0% | 0% | 0% | 16% |
| −0.8~−0.6 | Negative strong | 0% | 6% | 0% | 0% | 19% |
| −0.6~−0.4 | Negative moderate | 1% | 15% | 1% | 1% | 13% |
| −0.4~−0.2 | Negative weak | 2% | 20% | 4% | 2% | 8% |
| −0.2~−0 | Negative extremely weak | 11% | 23% | 14% | 9% | 11% |
| 0~0.2 | Positive extremely weak | 18% | 17% | 15% | 13% | 7% |
| 0.2~0.4 | Positive weak | 32% | 12% | 18% | 28% | 9% |
| 0.4~0.6 | Positive moderate | 20% | 6% | 25% | 36% | 10% |
| 0.6~0.8 | Positive strong | 15% | 1% | 20% | 12% | 5% |
| 0.8~1 | Positive extremely strong | 2% | 0% | 3% | 0% | 1% |
| Average proportion | 31% | 17% | 35% | 34% | 39% | |
| Significance proportion (>95%) | 76.42% | 85.75% | 50.95% | 87.21% | 52.48% | |
| Linear trend (npp:6.617) | 16.874 | −7.2665 | 2.9609 | 0.0721 | −0.7512 | |
| Linear correlation coefficient with NPP | 0.58 | −0.27 | 0.45 | 0.55 | −0.89 | |
Disclaimer/Publisher’s Note: The statements, opinions and data contained in all publications are solely those of the individual author(s) and contributor(s) and not of MDPI and/or the editor(s). MDPI and/or the editor(s) disclaim responsibility for any injury to people or property resulting from any ideas, methods, instructions or products referred to in the content. |
© 2023 by the authors. Licensee MDPI, Basel, Switzerland. This article is an open access article distributed under the terms and conditions of the Creative Commons Attribution (CC BY) license (https://creativecommons.org/licenses/by/4.0/).
Share and Cite
Tian, K.; Liu, X.; Zhang, B.; Wang, Z.; Xu, G.; Chang, K.; Xu, P.; Han, B. Analysis of Spatiotemporal Evolution and Influencing Factors of Vegetation Net Primary Productivity in the Yellow River Basin from 2000 to 2022. Sustainability 2024, 16, 381. https://doi.org/10.3390/su16010381
Tian K, Liu X, Zhang B, Wang Z, Xu G, Chang K, Xu P, Han B. Analysis of Spatiotemporal Evolution and Influencing Factors of Vegetation Net Primary Productivity in the Yellow River Basin from 2000 to 2022. Sustainability. 2024; 16(1):381. https://doi.org/10.3390/su16010381
Chicago/Turabian StyleTian, Kunjun, Xing Liu, Bingbing Zhang, Zhengtao Wang, Gong Xu, Kai Chang, Pengfei Xu, and Baomin Han. 2024. "Analysis of Spatiotemporal Evolution and Influencing Factors of Vegetation Net Primary Productivity in the Yellow River Basin from 2000 to 2022" Sustainability 16, no. 1: 381. https://doi.org/10.3390/su16010381
APA StyleTian, K., Liu, X., Zhang, B., Wang, Z., Xu, G., Chang, K., Xu, P., & Han, B. (2024). Analysis of Spatiotemporal Evolution and Influencing Factors of Vegetation Net Primary Productivity in the Yellow River Basin from 2000 to 2022. Sustainability, 16(1), 381. https://doi.org/10.3390/su16010381