Abstract
The significance of international maritime chokepoints and the exploration of their safety and security are intricately linked to the expansion of the maritime economy, the maintenance of political and social stability, and the safeguarding of state interests. Limited efforts have been dedicated to comprehensively assessing the extent of chokepoints’ influence or establishing a global ranking of their importance using dependable maritime data. In light of the growing significance of oceans and seas in the realms of economy and society, there is a pressing need to afford heightened attention to the importance of chokepoints. In this paper, 15 critical chokepoints from around the world are studied, and the method of Location Quotient is used to calculate the influence of their radiation range utilizing the Automatic Identification System (AIS); this study charts the worldwide spatial and temporal dimensions of maritime transport spanning from 2012 to 2022. The conclusion of this study reveals the following key findings: (1) Maritime shipping trajectories exhibit fluctuating growth over time, with traffic hotspots predominantly located in continental border zones, gradually decreasing from the equator toward the poles; (2) The regions with active maritime traffic do not exhibit a positive correlation with the hotspots; instead, there is a pattern of “strong in the north, weak in the south, strong in the east, weak in the west”; (3) The Strait of Gibraltar and the Strait of Malacca are identified as the globally most strategically valuable straits for maritime shipping; (4) There is significant variation in the influence range of strategic passages, and countries with mutual dependencies may have competitive relationships.
1. Introduction
“Whoever commands the sea commands the trade; whoever commands the trade of the world commands the riches of the world, and consequently the world itself [1]”. Oceans serve as a crucial wellspring of global prosperity, constituting a sophisticated system for the sustainable advancement of the global economy. Maritime transportation, a pivotal facet of the oceanic economy, emerges as the predominant choice for the conveyance of massive volumes of goods. In 2022, maritime trade encapsulated roughly 80% of the global trade volume and exceeded 70% in terms of the global merchandise value [2]. Confronted with the perpetually expanding maritime transportation market and the increasing demand for maritime transport, the establishment of an economical, environmentally friendly, and sustainable maritime transport environment has emerged as a key focus in ocean transportation research.
The marine chokepoint, denoted as a “critical juncture in the maritime supply chain”, represents a pivotal area of investigation in the development of a sustainable blue economy. Maritime chokepoints function as indispensable conduits for global shipping, and any disturbances or congestion in these passageways can exert profound repercussions on the worldwide economy. On the one hand, vessel congestion and the compelled redirection of sea routes lead to heightened operational expenses, escalating greenhouse gas emissions in international shipping, thereby significantly impacting the maritime industry [3,4]. A notable instance is the “Suez Canal Crisis”. According to Lloyd’s Register, this canal, averaging between 205 and 223 m in width, has witnessed almost 10 instances of vessel blockages in the past three years. The most recent incident occurred in June 2023 when the Maltese-flagged oil tanker “SEAVIGOUR” experienced a malfunction within the Suez Canal channel, which was fortunately resolved after causing a delay of several hours. However, not every occurrence concludes as smoothly. In March 2021, the Panama-flagged cargo ship “Ever Given”, owned by Taiwan’s Evergreen Marine Corporation, ran aground in the Suez Canal, resulting in a six-day blockade. Estimates by the Allianz Group suggest daily losses ranging from $6 to $10 billion due to the strait’s obstruction. On the other hand, the seamless functioning of global logistics and supply chains heavily hinges on marine chokepoints [5], exemplified by the critically significant maritime passageway—the Strait of Hormuz—for global fuel transport. Serving as the maritime pathway for oil-exporting nations in the Middle East, including Saudi Arabia, the United Arab Emirates, and Kuwait, the Strait of Hormuz plays a pivotal role. After transiting the Strait of Hormuz, depending on the geographical location of the destination country’s demand, the routing of oil to East Asian countries may involve traversing the Malacca Strait, bypassing the Sunda Strait or the Lombok Strait, delivering oil directly to Western European nations via the Suez Canal and the Strait of Gibraltar, or bypassing the Cape of Good Hope via the Mozambique Channel. The economic significance of oil and gas transportation via marine chokepoints is noteworthy. For exporters, World Bank data indicate that the share of oil rents in the GDP of Saudi Arabia and Kuwait exceeds 20%. For importers, China, a major oil importer, procured an impressive 230 million tons of crude oil from seven Arab countries, constituting 45.27% of its total crude oil imports in 2022. The unimpeded flow of these marine chokepoints is crucial for guaranteeing the economic and security interests of countries and regions at both ends of the supply and demand chain for transported goods.
The pivotal role of maritime chokepoints in driving global maritime economic prosperity and fostering sustainable development in countries, both economically and politically, is evident. However, a nuanced interpretation of the strategic significance of different maritime chokepoints is essential. Is there a variation in the level of importance among distinct marine chokepoints? Furthermore, what is the extent of the impact of the unique characteristics of marine chokepoints on various geographical locations? Adopting a perspective of mutual interdependence, does a pronounced reliance of nations on particular marine chokepoints exist? To address these inquiries, this paper adopts a geographical perspective and utilizes spatiotemporal trajectory data of maritime vessels. Specifically, this study employs a dual perspective of supply and demand to identify key maritime regions and critical maritime chokepoints. Additionally, an innovative application of the Location Quotient (LQ) model is introduced to characterize the spatial impact of maritime chokepoints on a national scale.
2. The Literature Review
Marine chokepoints play a pivotal role as key nodes in maritime navigation, serving as indispensable passageways for vessels owing to their navigational convenience. However, their narrow channels and precarious locations render them vulnerable points and bottlenecks in maritime transportation routes, prone to external attacks and blockades. The significance of marine chokepoints manifests predominantly in two dimensions: maritime security; and maritime economy. Serving as strategic highpoints in the maritime domain, marine chokepoints confront challenges encompassing both traditional and non-traditional security aspects [6]. From the Age of Discovery to the Cold War era, these vital channels for the expansion of capitalist nations predominantly encountered challenges rooted in traditional security concerns [7,8]. Post Cold War, substantial shifts in the global political and economic landscape have led to a reorientation of strategic priorities for nations, thereby transforming security threats in straits from traditional to non-traditional. Numerous studies have evaluated the impact of non-traditional security on marine chokepoints by formulating security risk models [9] and have further delved into the resilience of straits to such risks [10]. Research has also specifically targeted critical marine chokepoints. For example, Shepard and Pratson [11] concentrated on the repercussions of piracy on oil transportation in the Strait of Hormuz, revealing that pirate activities could result in prolonged disruptions in maritime transportation, adversely affecting efficiency for up to two years.
In the realm of maritime economics, numerous studies delve into the economic characteristics of marine chokepoints, evaluating their substantial value within the entire domain [12,13,14,15]. Scholars within the maritime trade sector commonly utilize shipping and trade data to investigate these strategic passages. For example, Pratson [16] assessed the vulnerability of key straits by simulating changes in trade flows among other critical straits and countries during the successive closure of each of the seven major global straits. The findings suggest that the blockage of any strait would significantly impact global shipping and overall commodity supply. Notably, the Danish Straits, the Bosporus Straits, the Strait of Hormuz, the South China Sea, and the East China Sea exhibit heightened economic appeal for countries reliant on maritime trade. Qu and Meng [17] employed data encompassing insurance surcharges, inventory costs, cargo time value, and time charter rates to examine the impact of the Malacca Strait and the Singapore Strait on shipping costs under extreme closure scenarios. That study reveals that there is no significant positive correlation between the duration of strait closure and cost loss; instead, the maximum cost loss occurs at 4.5 days. In specific trade sectors, scholars particularly focus on the transport of strategic commodities through straits, such as maritime oil and gas transportation. Carral et al. [18] evaluated the impact of the Panama Canal expansion on the global liquefied natural gas (LNG) market, considering transportation costs through the integration of LNG import and export data, ship fuel costs, and travel distances. Their research indicates that the expansion of the Panama Canal disrupts existing LNG routes, demonstrating significant competitiveness, especially for LNG shipped from the Gulf of Mexico and the Caribbean Sea through the Panama Canal to consumers in Asia. The Canadian National Aeronautics and Space Administration [19] conducted an economic analysis specifically focusing on congestion in maritime oil transport channels. This paper utilized the most crucial global oil chokepoints proposed by the U.S. Energy Information Administration (EIA)—the Strait of Hormuz, the Malacca Strait, the Suez Canal, the Strait of Malacca, the Turkish Strait, and the Panama Canal—as primary research objects, analyzing their significance in the global oil trade market. That study suggests that the disruption of vital maritime chokepoints would have a tremendous impact on major oil-importing countries.
As the utilization of big data in the maritime sector continues to grow, the Automatic Identification System (AIS), serving as a source of real-time ship data, has emerged as an increasingly vital reference point in strait research. Liu et al. [20] and Wu et al. [21] developed an assessment model utilizing AIS data, which enabled them to generate a global map illustrating the density of maritime traffic. Through this model, they assessed the intricacies of maritime traffic, with a specific focus on chokepoint traffic. Bateman and Mathai [22] examined the vulnerability of chokepoints by scrutinizing shipping traffic patterns and vessels traversing the Malacca and Singapore straits. In the case of the Straits of Singapore and the Strait of Malacca, Maimun et al. [23] undertook risk assessments leveraging AIS data.
In antecedent research, the safety and economic value of straits have been duly underscored. However, contemporary inquiries exhibit certain constraints. Previous research has often inclined toward a qualitative evaluation of the safety value of marine chokepoints or confined economic analyses to specific ones, thereby lacking an objective depiction of their strategic importance and a comprehensive global perspective. Given the rapid advancements in big data technology, a meticulous examination of marine chokepoints utilizing spatiotemporal vessel data has become of paramount significance. Consequently, by building upon the existing research framework, this study embraces a global perspective, fully harnessing the nuanced attributes of spatiotemporal vessel traffic data. The primary aim is to delineate global maritime patterns and discern the hierarchical characteristics of chokepoints, with the overarching objective of providing enhanced guidance for the development of global maritime strategies, the optimization of trade routes, and the safeguarding of international security.
3. Data and Methodology
The proposed approach delineates the scope of influence and quantifies alterations in the degree of influence exerted by the world’s most strategic chokepoints. This is achieved through the analysis of the degree of change in global maritime traffic between various regions. Built the comprehensive conceptual diagram of the article based on the primary structure of the text, as illustrated in Figure 1.
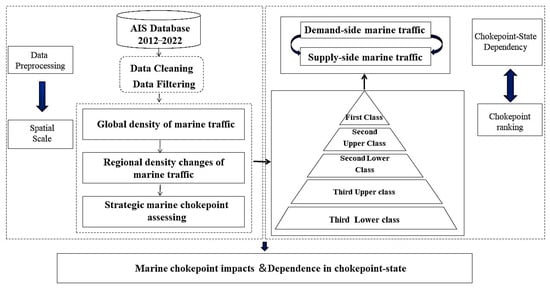
Figure 1.
The logical framework flow chart.
3.1. Data
The comprehensive global marine traffic flow dataset spanning 2012 to 2022, as detailed in this paper, relies on AIS data, which includes Satellite AIS, Shore-based AIS, and Mobile Base Station AIS. The Automatic Identification System (AIS) serves as an automated reporting system commonly integrated into ships, transmitting ship trajectories and relevant vessel information at six-minute intervals. Initially designed to prevent collisions, AIS continuously reports vessels’ kinematic and identity data. Since the end of 2004, International Maritime Organization (IMO) regulations mandate the installation of AIS transponders on all ships of 300 gross tonnes and above involved in international voyages, cargo ships of 500 gross tonnes and above, irrespective of international voyages, and all passenger ships, regardless of their size. The AIS position reports used for this study’s period (2012–2022) typically consist of more than 106–180 million messages annually.
3.2. Identification of Maritime Trajectories and Strategic Chokepoints
Utilizing AIS data, this study divides the global maritime expanse into grids of 0.1 × 0.1 degrees. The count of ship passages within each grid reflects the trajectory map of global maritime transport from 2012 to 2022. Accordingly, the primary maritime regions are filtered out using the inter-annual variation in the number of ship passages within the grid. Combining the global distribution of maritime transport densities and the inter-annual flow variations within the regions, fifteen strategic chokepoints were found throughout the world.
3.3. Maritime Transport Dependency
In this context, maritime dependence signifies a maritime nation’s reliance on a specific strategic chokepoint. This reliance reflects the appeal of the chokepoint to the nation’s maritime transport. It can be divided into demand-side marine traffic flow and supply-side marine traffic flow according to the differences in the import and export trade of each state. For a more comprehensive understanding of a chokepoint’s maritime transport scope, this study employs the Location Quotient (LQ) model [24,25]. Here, signifies a state’s reliance on a specific chokepoint, computed through the following formula:
In Equation (1), where i represents the nation and j denotes the strategic chokepoint, denotes the maritime traffic flow of the ith nation through the jth strategic chokepoint; represents the total maritime traffic flow of the ith nation, while corresponds to the total maritime traffic flow through the jth strategic chokepoint, and signifies the aggregate maritime traffic flow across all strategic chokepoints.
In essence, this equation calculates the ratio of a specific nation’s maritime traffic through a particular chokepoint to the total traffic through that chokepoint across all nations . This ratio is then normalized by the overall maritime traffic across all chokepoints and nations . A value greater than 1 indicates significant maritime dependence of nation i on chokepoint j, with higher values representing stronger dependence. Conversely, a value less than 1 suggests lower maritime dependence.
4. Empirical Results
4.1. Global Maritime Transport Flows Pattern
4.1.1. Spatial and Temporal Variation in Global Maritime Transport Flows
We examine the global patterns of marine traffic between 2012 and 2022 through the utilization of satellite AIS data. This analysis presents annual fluctuations in the spatial footprint of ships’ maritime transport and maritime traffic flows, as shown in Figure 2.
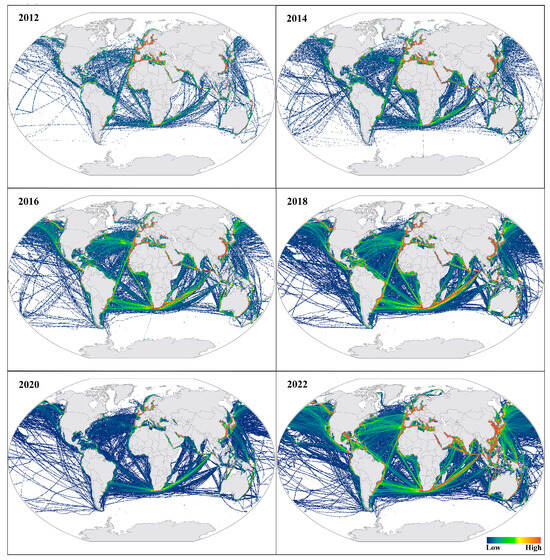
Figure 2.
Global density of marine traffic, 2012–2022.
From Figure 2, we can vividly depict the morphological characteristics of shipping routes through the footprint of vessels, especially distinguishing popular routes. These routes include the Far East route connecting the Far East region with other global regions. Specifically, this includes routes from the Far East region (such as eastern China, Japan, Korea, etc.) to other regions, potentially involving Europe, the Middle East, Africa, and beyond. And the Asia–Pacific route (connecting Asia with the Pacific region. Specifically, it encompasses routes from Asian regions, such as China, Japan, South Korea, etc., to Pacific regions, including the U.S. West Coast, Canadian West Coast, Australia, and others). These routes exhibit a relatively high level of route integrity. Considering the utilization of ocean space by ships, a gradual decrease is observed along routes from the equator toward the poles. This phenomenon is primarily attributed to challenging navigational factors such as monsoons, sea ice, and the distance from economic centers. Notably, the northernmost segment of the Atlantic Ocean and the southernmost stretches of the Atlantic, Indian, and Pacific Oceans experience limited utilization due to these conditions. In tandem with economic globalization, political multipolarity, and global warming trends, it is noteworthy that the utilization of the Northeast Arctic Passage along the northern coasts of Russia and the Arctic routes of the Western Europe–North America Northwest Passage have witnessed incremental expansion. This expansion serves to elongate the Arctic realm within the traditional global shipping routes, thereby augmenting the spectrum of connections linking Asia and Eastern countries. Beyond the focal concentration of vessel traffic along specific routes, it becomes apparent that regions exhibiting high ship density are primarily situated along coastlines. Coastal zones of continents emerge as pivotal areas for the facilitation of goods supply and demand, energy replenishment, as well as ship maintenance and management.
Viewed from the perspective of changing traffic patterns, the overall volume of global maritime traffic experienced a fluctuating upward trajectory between 2012 and 2022, marked by distinct inflection points. Notably, there were two notable phases of fluctuating decline: one spanning 2014 to 2015 and the other spanning 2019 to 2020. Firstly, technological advancements have significantly contributed to the expansion of maritime traffic. This is evidenced by the continuous growth in ship capacity, augmented ship volumes, increased speeds, and the implementation of automation. Secondly, given that maritime transport is intrinsically linked to trade demand, the global economic landscape exerts substantial influence on it. Variations occur in response to fluctuations in the supply and demand of trade volume. The global shipping market encountered a period of economic downturn in 2014, colloquially termed a “winter period”. During this phase, a notable disparity between maritime cargo supply and demand emerged, resulting in a discernible deceleration and reduction in global maritime traffic volume. Additionally, non-traditional security factors, including the risk of significant disease outbreaks, ecological challenges, terrorism, and piracy, exert considerable influence on the global shipping landscape. In 2019, the emergence of a novel coronavirus led to another period of abrupt declines in maritime traffic. The imposition of restrictions on human activity at sea and the disruption of global consumption patterns contributed to this decline.
4.1.2. Variability of Maritime Traffic Flow in Priority Regions
During the period from 2012 to 2022, a substantial escalation in maritime traffic was projected, accentuated by notable variations across regions and the emergence of prominent hotspot areas. A discernible surge in maritime traffic was anticipated, spanning from 2012 to 2022, accompanied by pronounced differences both at the regional level and within hotspot areas. The assessment of inter-annual variability in maritime transport involves quantifying fluctuations in ship numbers within grid segments.
As shown in Figure 2, we observe that large differences in shipping densities are always found within specific regions; this evaluation highlights regions characterized by significant density variations, indicating active hotspot areas (Figure 3). In these hotspot areas, a prevalent “strong in the north and weak in the south” pattern is observed, delineating “five cores”: Caribbean-Gulf of Mexico; Southeast Asia–Australia; The Mediterranean–Black Sea Region; Persian Gulf–Red Sea Area; and East China Sea–Japan Sea Area. These regions serve as convergence points for multiple shipping routes, facilitating the “dispersion and reorganization” of the cargoes. Their substantial impact on the dynamics of the maritime transport market is noteworthy. Regional disparities are evident in the changes to maritime transport flows.
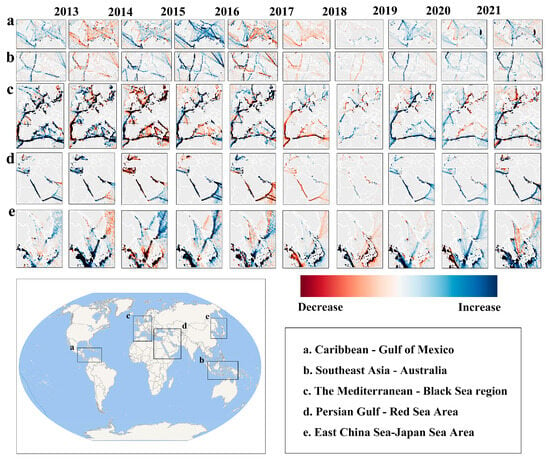
Figure 3.
Regional changes in marine traffic, 2012–2022.
The Mediterranean–Black Sea region and the East China Sea–Japan Sea region, identified as the most active core maritime transport regions that witnessed significant inter-annual fluctuations in maritime transport, marked by both increases and decreases. These regions stand out due to factors such as the strategic distribution of chokepoints, the concentration of major ports, the density of shipping routes, the relative political stability of coastal countries (regions), and their dynamic economic markets. In contrast, the inter-annual traffic differentials in the remaining two regions were marginal, signifying a relatively stable maritime traffic environment. Notably, the Persian Gulf–Red Sea region experienced pronounced fluctuations in maritime traffic before 2017, followed by a period of stabilization post 2018.
In the realm of temporal dynamics, fluctuations in regional maritime transport flows over consecutive years typically mirror global trends in maritime flow. However, nuanced irregularities manifest within regional flow patterns. These divergences in regional flow are primarily attributed to local events, including but not limited to national traffic control measures, maritime security strategies, and various contextual factors with broader implications. To illustrate, the escalation of the Russian–Ukrainian conflict in the Mediterranean and Black Sea regions during the period of 2021–2022 led to a noticeable reduction in maritime traffic passing through the Bosphorus. Simultaneously, there was an observed increase in maritime traffic through the Strait of Gibraltar.
4.2. Critical Chokepoints Identification
The global maritime transport density map (Figure 2), coupled with the map illustrating regional maritime transport trends (Figure 3), underscores the concentration of total maritime transport volume and dynamic shifts within 15 pivotal chokepoints (Figure 4a). These chokepoints play a crucial role as maritime transshipment centers strategically positioned along key sea lanes, significantly contributing to the strategic importance of these areas and exerting a profound impact on the sustainability and progression of global maritime transport. Geographically, the distribution of strategic chokepoints tends to favor the eastern side over the western, with a more pronounced presence in the northern regions compared to the southern regions. This spatial pattern is largely attributed to the intricate interplay between land and sea distribution. Primarily situated at the intersections of the Earth’s tectonic plates, these chokepoints establish vital connections among major sea expanses. Notably, the Mediterranean–Black Sea Region, the Persian Gulf–Red Sea Area, and Southeast –Australia exhibit a pronounced density of strategic chokepoints, with some regions even hosting two or more of these critical chokepoints.
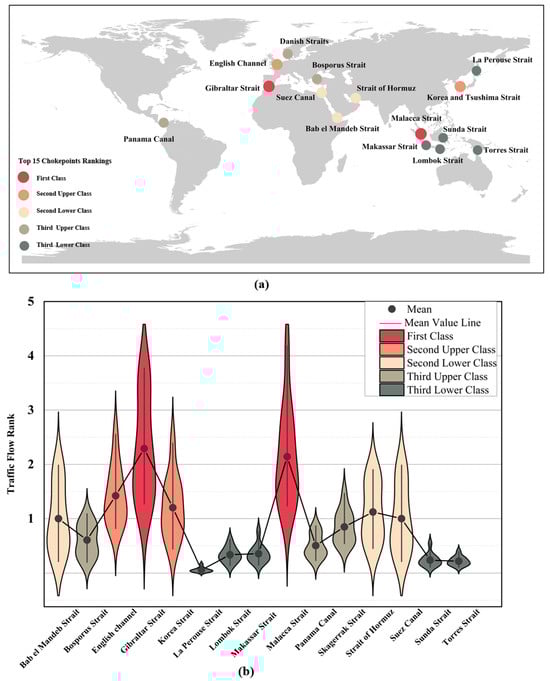
Figure 4.
(a) Diagram of the 15 strategic chokepoints. (b) Ranking of strategic chokepoints by maritime traffic.
The influence and prominence of strategic chokepoints exhibit significant variations (Figure 4b). Chokepoints experiencing higher maritime traffic volumes inherently possess an increased capacity to regulate vessel movement, thereby achieving elevated strategic importance. To systematically assess their significance, annual average maritime traffic figures for each chokepoint were utilized to categorize the 15 strategic chokepoints into five distinct classes: First Class; Second–Upper Class; Second–Lower Class; Third–Upper Class; and Third–Lower Class.
The Straits of Gibraltar and Malacca, which have exceptional trans-shipment capacity and unique maritime economic value, are at the top of the strategic hierarchy. The Strait of Gibraltar, connecting Southern Europe and North Africa, is often referred to as the “lifeline” of Mediterranean shipping and serves as the sole passageway linking the Mediterranean Sea and the Atlantic Ocean. Similarly, the Strait of Malacca, connecting the Malay Peninsula and the island of Sumatra in Southeast Asia, boasts numerous ports along its coast and offers excellent natural shipping conditions. Between 2012 and 2022, the average maritime traffic value in the Strait of Gibraltar slightly surpasses that of the Strait of Malacca, with the latter exhibiting relatively larger interannual variability in traffic flows compared to the former.
The English Channel and Korea–Tsushima Strait are positioned in the second tier of critical chokepoints owing to their substantial capacity for maritime transshipment, minimal inter-annual variations in maritime traffic, and strategic regional significance. The English Channel, situated in Western Europe, links the Atlantic Ocean to the North Sea and ranks among Europe’s largest navigable waterways. Serving as Northeast Asia’s entryway, the Korea–Tsushima Strait is located at the westernmost point of the North Pacific Ocean. The Suez Canal, Bab-el-Mandeb Strait, and Strait of Hormuz are all part of the Second–Lower Class. All three chokepoints are located in the Persian Gulf–Red Sea region and serve as important entry points for oil and gas maritime transport in the Middle East, as well as a critical role in global oil and gas maritime security. The Bosphorus Strait, Danish Straits, and Panama Canal comprise the Third–Upper Class straits. Serving as a pivotal passageway between the Black Sea and the Sea of Marmara, the Bosphorus Strait holds significant relevance for transportation between Asia and Europe. The Danish Straits, situated as the northernmost strategic chokepoint globally, interconnect the North Sea and the Baltic Sea. In the Americas, the Panama Canal stands as the sole strategically vital chokepoint, bridging the Atlantic and Pacific Oceans. La Perouse Strait, the Straits of Lombok, the Straits of Makassar, the Straits of Sunda, and the Straits of Torres collectively constitute the Third–Lower Class Strait. These five strategic chokepoints serve as pivotal maritime shipping hubs in the western Pacific, all located within the eastern hemisphere, specifically the East China Sea–Japan Sea Area and Southeast Asia–Australia.
4.3. Chokepoints Scope of Influence
4.3.1. Overall Supply–Demand Influence
The geographic distribution of states, the nature of trade cooperation, the recipients of trade cooperation, and the extent to which states rely on chokepoints in terms of supply and demand for trade display notable variability. Over the span of 2012–2022, diverse levels of shared dependence, both on the demand and supply sides, of states on the 15 critical chokepoints were evident. Remarkably, significant disparities in dependence levels among different states were identified. Figure 5 presents a visual representation of the top 10% of states in terms of total dependence.
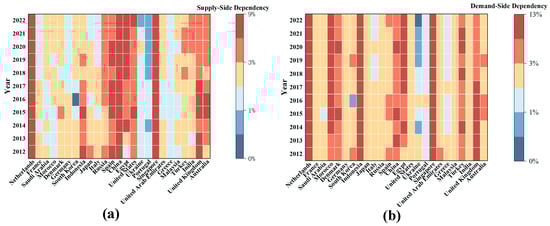
Figure 5.
State Dependency on the Chokepoints. (a) Supply-side Dependency. (b) Demand-side Dependency.
As a collective trend, countries located in close geographical proximity and serving as gateway hubs often demonstrate heightened dependence on critical chokepoints, primarily stemming from their reliance on trade. In terms of supply-side dependence, China, Singapore, and the Netherlands consistently exhibited heightened levels of dependency on these chokepoints throughout this study’s period. China, renowned as the “factory of the world”, possesses extensive manufacturing capacity. The nation heavily depends on maritime transportation, given its eastern borders that span the East China Sea, the South China Sea, and a portion of the Bohai Sea and the Yellow Sea. Additionally, the coastline is dotted with numerous world-class harbors. The continuous expansion of China’s foreign trade has led to the proliferation of maritime routes and service networks across the globe, resulting in an incremental increase in trade dependence on the chokepoints. Singapore’s significant supply dependence on the Straits arises from its geographical proximity to the First-Class Strait, the Strait of Malacca, and its role as one of the co-jurisdictions overseeing the Strait of Malacca. Similarly, the Netherlands and Belgium, serving as the crucial gateway to Europe, rely significantly on the chokepoints for goods supply. In addition to the aforementioned countries, Egypt, Spain, the United Kingdom, and Indonesia also share a high level of supply dependence on the chokepoints. In terms of demand-side dependence, the Netherlands, Indonesia, and Singapore consistently rely on these chokepoints. Notably, the Netherlands and Singapore emerge as two states heavily dependent on the straits for both supply and demand. Indonesia, as an archipelagic nation, plays a vital role in safeguarding crucial international trade routes such as the Malacca Strait, the Sunda Strait, and the Lombok Strait, resulting in a significant dependency on these maritime chokepoints.
4.3.2. The Chokepoint’s Maritime Sphere of Influence
As chokepoints decline in ranking, both their sphere of influence and their impact on the number of states gradually decrease, resulting in the clustering of affected states’ locations.
(1) First-Class Chokepoint
As chokepoints secure top-tier global importance, the Straits of Malacca and Gibraltar emerge as key maritime influencers. Aligning with the overarching trend of “East is strong and West is weak”, the impact of the Strait of Malacca (Figure 6a) is predominantly felt in East Asia, Southeast Asia, Australia, and South Africa. Noteworthy is the United States, one of the most influential maritime trading nations, exerting the greatest degree of influence in the Americas within this context. Conversely, the influence of the Strait of Gibraltar (Figure 6b) is concentrated in North Africa, Western Europe, and the East Coast of the Americas. It is crucial to highlight that France and the United Kingdom, in particular, demonstrate substantial dependence on the Strait of Gibraltar.
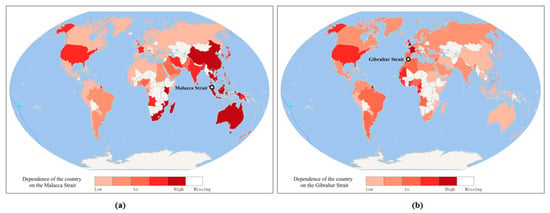
Figure 6.
Dependency of the States on the First-class Chokepoint. (a) Malacca Strait. (b) Gibraltar Strait.
(2) Second–Upper Class Chokepoint
The English Channel and the Korea–Tsushima Strait, both categorized as Second–Upper Class Straits, exhibit a regional influence that encompasses a smaller radius compared to that of a First-Class chokepoint yet remains substantial. On a specific geospatial scale, the English Channel (Figure 7a) holds sway over states situated along the Atlantic Ocean, including Europe, the east coast of South America, and North America. Conversely, the sphere of influence of the Korea–Tsushima Strait (Figure 7b) centers on East Asian states and extends to North American states. Notably, this influence holds particular allure for China and the United States, two major global trading powers.
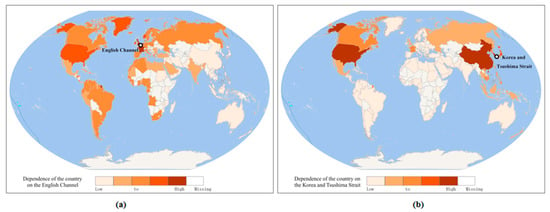
Figure 7.
Dependency of the States on the Second–Upper Class Chokepoint. (a) English Channel. (b) Korea and Tsushima Strait.
(3) Second–Lower Class Chokepoint
The Suez Canal, Bab-el-Mandeb, and Strait of Hormuz exhibit notably similar spheres of influence, primarily concentrated in West Asia and North Africa. Although the degree of influence varies slightly, the overarching regions remain consistent. Among these, the Suez Canal (Figure 8a) holds the broadest sphere of influence, encompassing not only West Asia and North Africa but also extending its reach to include China, the United States, and several European states. The Bab-el-Mandeb Strait (Figure 8b) primarily impacts regions in West Asia, North Africa, and South Asia while also affecting select states in Western Europe. However, the center of gravity of influence for the Strait of Hormuz (Figure 8c) has shifted toward the east. This shift is evident as the focus of influence narrows down to specific states in West Asia, South Asia, East Asia, and North Africa.
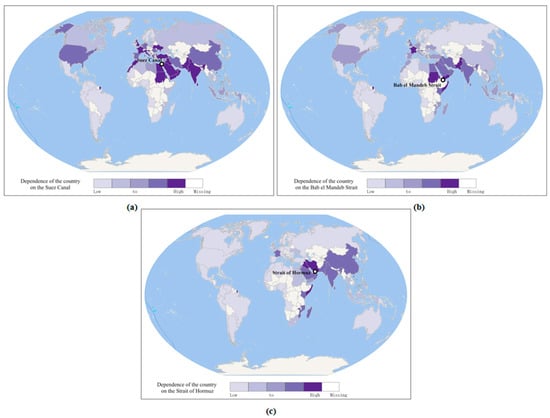
Figure 8.
Dependency of the States on the Second–Lower Class Chokepoint. (a) Suez Canal. (b) Bab-el-Mandeb Strait. (c) Strait of Hormuz.
(4) Third–Upper Class Chokepoint
The influence of the Bosphorus, the Danish Straits, and the Panama Canal exhibits significant variation. The Bosphorus (Figure 9a) predominantly impacts states situated in North Africa, Eastern Europe, and Russia. The Mediterranean coast serves as a central focal point of this influence. Meanwhile, the Danish Straits (Figure 9b) primarily concentrate their influence on Russia, Northwest European nations, and the Southern Arctic Ocean. This concentrated influence radiates from these key points, shaping the maritime dynamics of the region. Conversely, the Panama Canal’s (Figure 9c) influence is distinctly focused on the continents of North and South America, as well as extending to France in Europe. This influential distribution reflects the strategic importance of the canal in connecting major global trade routes.
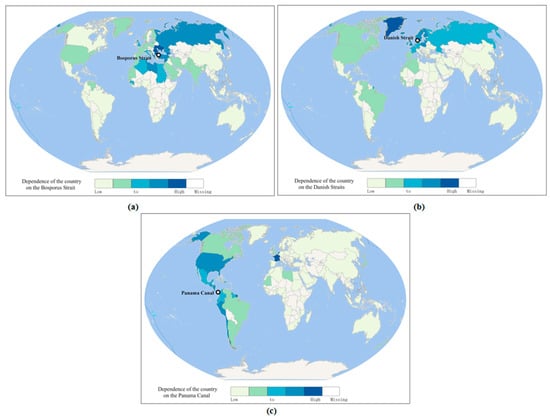
Figure 9.
Dependency of the States on the Third–Upper Class Chokepoint. (a) Bosporus Strait. (b) Danish Straits. (c) Panama Canal.
(5) Third–Lower Class Chokepoint
The Lombok Strait, Makassar Strait, Sunda Strait, and Torres Strait (Figure 10b–e) all exhibit comparable spheres of influence, with the influence of the La Perouse Strait (Figure 10a) shifting northward. The primary regions under the influence of the La Perouse Strait are East Asia, North America, and Russia. These regions are predominantly situated to the north of the equator, contributing to the strait’s distinctive influence pattern. Similarly, the Lombok Strait, Makassar Strait, Sunda Strait, and Torres Strait significantly impact the Pacific coastal nations of Australia, Indonesia, China, and the United States. These straits play a pivotal role in shaping maritime dynamics and trade interactions within the Pacific region.
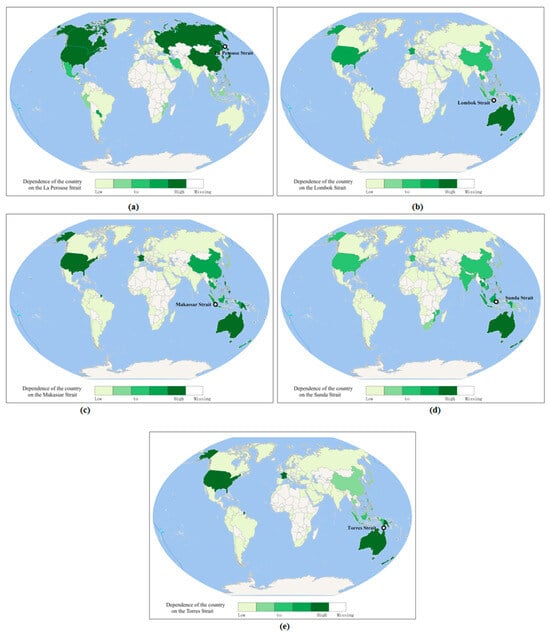
Figure 10.
Dependency of the States on the Third–Lower Class Chokepoint. (a) La Perouse Strait. (b) Lombok Strait. (c) Makassar Strait. (d) Sunda Strait. (e) Torres Strait.
4.4. Discussion
From a global perspective, the influence of a chokepoint and the extent of its radiating impact significantly shape the development of a state’s sustainable maritime economy. Additionally, the level of constraint imposed by a chokepoint profoundly influences the growth of a state’s maritime power and global future development. Chokepoints hold a pivotal position in maritime transportation security, and a state’s reliance on these routes for imports and exports, especially critical goods, can render it strategically vulnerable. This susceptibility arises due to the ease with which strategic chokepoints can be disrupted or targeted. Consequently, a state heavily reliant on a limited number of maritime chokepoints is directly exposed to potential disruptions, affecting its ability to maintain international strategic security during times of political instability.
This paper further delves into the dependency of countries on chokepoints, revealing various degrees of competition between states that share such dependencies. A higher number of countries reliant on a particular chokepoint intensifies their interdependence and competitive dynamics. For example, the Malacca Strait, designated as a First-Class strait, encompasses influential maritime nations such as China, Australia, India, and the United States—all heavily dependent on its passage. Limited resources in the Malacca Strait can trigger competition among these maritime powers. Similarly, the Suez Canal, a gateway to vital oil and gas resources in the Middle East, dictates energy vulnerabilities for states within its sphere of influence, including China, the United States, India, and others.
The marine chokepoints, as natural formations, exhibit relatively weak political attributes. From a geopolitical standpoint, one can draw parallels with theories such as the “heartland” concerning land, attributing political significance to the straits. Characteristics such as limited geographical space determine the straits’ inherent geopolitical fragility. Simultaneously, the substantial maritime traffic and strategic control over tectonic plate intersections enhance their geopolitical value, gradually transforming them into pivotal maritime zones contested by various nations. Amid unprecedented global changes, where geopolitical and economic landscapes undergo dynamic shifts, the intertwining of traditional and non-traditional security aspects becomes evident. Recognizing the maritime value of straits is crucial for gaining a clearer perspective on the global maritime geopolitical situation, providing a foundation for a nation’s sustainable development in these times of profound transformation.
5. Conclusions and Policy Implications
This paper employs spatial and temporal vehicle data to identify critical maritime regions and chokepoints. This study delves into the significance of 15 chokepoints in maritime transportation and the extent to which states rely on them. Leveraging AIS data, we extract ship footprints, determine the origin and destination states of maritime journeys, calculate passage volumes through crucial straits, and utilize the Location Quotient model to measure the coverage of their influence. As emphasized by Ma and Qian [26] and Sobral et al. [27], data granularity plays a crucial role in accurately capturing changes, especially in the context of transportation analysis. Our utilization of AIS data creates a spatiotemporal maritime transport footprint, revealing discernible shifts in global maritime connectivity. The maritime footprint closely aligns with official routes, exhibiting increased ship density over time, particularly in critical regions and chokepoints.
These findings hold critical implications for various stakeholders. Understanding major states’ shipping routes and the critical regions they traverse empowers maritime authorities to collaborate with relevant agencies, enhancing operational efficiency and ensuring maritime transportation safety. Evaluating a state’s reliance on chokepoints from both supply and demand perspectives serves as a clear indicator of its maritime import and export trade, aiding adjustments to supply–demand structures. Importantly, knowledge of chokepoint dependencies enables states to optimize maritime and economic security. For shipping companies, an emphasis on chokepoint dependencies informs future enterprise development strategies. Analyzing competition between enterprises across different nations sharing the same strait provides theoretical support for ship scheduling and mitigating economic risks. Moreover, the pursuit of alternate routes to circumvent geopolitical and maritime hazards becomes a mutual objective for nations and businesses, charting a new path for the future of maritime transport.
It is important to acknowledge certain limitations in our study, which will guide the direction and future research efforts. In the initial framing of our research, factors such as local environmental conditions, prevailing political atmospheres, economic dynamics, and geopolitical influences contribute to the observed patterns, although our analysis primarily concentrates on indicators of maritime traffic. Variations in vessel types and cargo carried could impact the weighting of maritime routes, potentially altering the perceived significance of specific straits. A more nuanced interpretation could stem from more comprehensive analyses of maritime flows, shedding light on the value associated with these flows. Furthermore, regarding data-related concerns, this paper has employed AIS data spanning from 2012 to 2022, encompassing satellite AIS, shore-based AIS, and mobile station AIS data. The selection of this timeframe and data sources aligns with contemporary advancements in research. However, the primary focus of this study is on strait identification, and this manuscript falls short of providing a comprehensive discussion on data processing considerations such as technological updates, station additions, and changes in coverage areas. This omission is critical, as it could significantly impact the accuracy of this paper. In future investigations, meticulous efforts will be made to refine the research content for greater precision. Lastly, exploring potential mechanisms (e.g., non-traditional security concerns, policy interventions, trade barriers, etc.) influencing the radius of influence of chokepoints remains an avenue for future investigation.
Author Contributions
Conceptualization, X.W. and D.D.; methodology, X.W.; software, X.W. and Y.P.; validation, X.W., Y.P. and D.D.; writing—original draft preparation, X.W.; writing—review and editing, X.W., Y.P. and D.D.; supervision, D.D.; project administration, D.D.; funding acquisition, D.D. All authors have read and agreed to the published version of the manuscript.
Funding
14th Five-Year National Key Research and Development Program, Key Special Project on “Earth Observation and Navigation” [2023YFB3906700]. Chinese National Funding of Social Sciences [23&ZD330].
Institutional Review Board Statement
Not applicable.
Informed Consent Statement
Not applicable.
Data Availability Statement
The data used to support the findings of this study are available from the corresponding author upon request. Restrictions apply to the availability of these data, which were used under license for this study and are not publicly available.
Conflicts of Interest
The authors declare no conflict of interest.
References
- Le Billon, P. The geopolitical economy of ‘resource wars’. Geopolitics 2004, 9, 1–28. [Google Scholar] [CrossRef]
- UNCTAD. Review of Maritime Transport 2022. Available online: https://unctad.org/rmt2022 (accessed on 1 July 2023).
- Ma, M.; Fan, H.; Jiang, X.; Guo, Z. Truck arrivals scheduling with vessel dependent time windows to reduce carbon emissions. Sustainability 2019, 11, 6410. [Google Scholar] [CrossRef]
- Xiao, L.; Chen, S.; Xiong, S.; Qi, P.; Wang, T.; Gong, Y.; Liu, N. Security risk assessment and visualization study of key nodes of sea lanes: Case studies on the Tsugaru Strait and the Makassar Strait. Nat. Hazards 2022, 114, 2657–2681. [Google Scholar] [CrossRef] [PubMed]
- Rodrigue, J.P. Straits, passages and chokepoints: A maritime geostrategy of petroleum distribution. Cah. Géographie Québec 2004, 48, 357–374. [Google Scholar] [CrossRef]
- Titovich, A.; Atnashev, V. Development Trends of the Strait of Malacca Countries in the Field of Countering Non-traditional Threats to National Security in the Context of the Indo-Pacific Region in 2010s–2020s. In Proceedings of Topical Issues in International Political Geography; Springer Geography; Springer: Cham, Switzerland, 2021. [Google Scholar] [CrossRef]
- McIntyre, W.D. The Strategic Significance of Singapore, 1917–1942. The Naval Base and the Commonwealth. J. Southeast Asian Hist. 1969, 10, 69–94. [Google Scholar] [CrossRef]
- Chua, D.W.B. America’s Role in the Five Power Defence Arrangements: Anglo-American Power Transition in South-East Asia, 1967–1971. Int. Hist. Rev. 2017, 39, 615–637. [Google Scholar] [CrossRef]
- Jiang, M.; Lu, J. A novel risk assessment approach for strait/canal security evaluation along the 21st Century Maritime Silk Road. Int. J. Shipp. Transp. Logist. 2022, 15, 215–238. [Google Scholar] [CrossRef]
- Fan, H.; Gong, X.; Lyu, J. Resilience assessment of strait/canal: A rule-based Bayesian network framework. Transp. Res. Part D Transp. Environ. 2023, 12, 103960. [Google Scholar] [CrossRef]
- Shepard, J.U.; Pratson, L.F. Maritime piracy in the Strait of Hormuz and implications of energy export security. Energy Policy 2020, 140, 111379. [Google Scholar] [CrossRef]
- Zuhdi, A.; Turan, E. Kra canal project and its influence on world maritime trade. Proc. Inst. Mech. Eng. Part M J. Eng. Marit. Environ. 2022, 236, 493–503. [Google Scholar] [CrossRef]
- Parlow, A. Arctic Geopolitics, Cross-Boundary Soft-Power, Ecosystem Protection, and Human Security in the Bering Sea and Strait. In The Climate-Conflict-Displacement Nexus from a Human Security Perspective; Springer International Publishing: Cham, Switzerland, 2022; pp. 171–196. [Google Scholar]
- Peters, K. Deep routeing and the making of ‘maritime motorways’: Beyond surficial geographies of connection for governing global shipping. Geopolitics 2020, 25, 43–64. [Google Scholar] [CrossRef]
- Waloven, S.; Kapsar, K.; Schwoerer, T.; Berman, M.; Schmidt, J.I.; Viña, A.; Liu, J. Global gateways as telecoupled human and natural systems: The emerging case of the Bering Strait. AMBIO 2023, 52, 1040–1055. [Google Scholar] [CrossRef] [PubMed]
- Pratson, L.F. Assessing impacts to maritime shipping from marine chokepoint closures. Commun. Transp. Res. 2023, 3, 100083. [Google Scholar] [CrossRef]
- Qu, X.; Meng, Q. The economic importance of the Straits of Malacca and Singapore: An extreme-scenario analysis. Transp. Res. Part E Logist. Transp. Rev. 2012, 48, 258–265. [Google Scholar] [CrossRef]
- Carral, L.; Tarrío-Saavedra, J.; Crespo-Pereira, D.; Fernández-Campoamor, M.; Sabonge, R. Competitive position of the expanded Panama Canal in the shipment of liquefied natural gas. Proc. Inst. Mech. Eng. Part M J. Eng. Marit. Environ. 2019, 233, 1154–1176. [Google Scholar] [CrossRef]
- Komiss, W.; Huntzinger, L. The Economic Implications of Disruptions to Maritime Oil Chokepoints; Center for Naval Analysis: Alexandria, VA, USA, 2011. [Google Scholar]
- Liu, Z.; Wu, Z.; Zheng, Z.; Yu, X. A Molecular Dynamics Approach to Identify the Marine Traffic Complexity in a Waterway. J. Mar. Sci. Eng. 2022, 10, 1678. [Google Scholar] [CrossRef]
- Wu, L.; Xu, Y.; Wang, Q.; Wang, F.; Xu, Z. Mapping global shipping density from AIS data. J. Navig. 2017, 70, 67–81. [Google Scholar] [CrossRef]
- Bateman, S.; Ho, J.; Mathai, M. Shipping Patterns in the Malacca and Singapore Straits: An Assessment of the Risks to Different Types of Vessel. Contemp. Southeast Asia 2007, 29, 309–332. [Google Scholar] [CrossRef]
- Maimun, A.; Nursyirman, I.F.; Sian, A.Y.; Samad, R.; Oladokun, S. Using AIS data for navigational risk assessment in restricted waters. In Transportation Systems and Engineering: Concepts, Methodologies, Tools, and Applications; IGI Global: Hershey, PA, USA, 2015; pp. 1154–1163. [Google Scholar]
- Billings, S.B.; Johnson, E.B. The location quotient as an estimator of industrial concentration. Reg. Sci. Urban Econ. 2012, 42, 642–647. [Google Scholar] [CrossRef]
- Panagiotopoulos, G.; Kaliampakos, D. Location quotient-based travel costs for determining accessibility changes. J. Transp. Geogr. 2021, 91, 102951. [Google Scholar] [CrossRef]
- Ma, W.; Qian, Z.S. Estimating multi-year 24/7 origin-destination demand using high-granular multi-source traffic data. Transp. Res. Part C Emerg. Technol. 2018, 96, 96–121. [Google Scholar] [CrossRef]
- Sobral, T.; Galvão, T.; Borges, J. Visualization of urban mobility data from intelligent transportation systems. Sensors 2019, 19, 332. [Google Scholar] [CrossRef] [PubMed]
Disclaimer/Publisher’s Note: The statements, opinions and data contained in all publications are solely those of the individual author(s) and contributor(s) and not of MDPI and/or the editor(s). MDPI and/or the editor(s) disclaim responsibility for any injury to people or property resulting from any ideas, methods, instructions or products referred to in the content. |
© 2023 by the authors. Licensee MDPI, Basel, Switzerland. This article is an open access article distributed under the terms and conditions of the Creative Commons Attribution (CC BY) license (https://creativecommons.org/licenses/by/4.0/).