Article

Purification of Pesticide-Contaminated Water Using Activated Carbon from Prickly Pear Seeds for Environmentally Friendly Reuse in a Circular Economy

Laboratory of Environmental Chemistry and Clean Processes LR21ES04, Faculty of Sciences, University of Monastir, Monastir 5000, Tunisia
*
Author to whom correspondence should be addressed.
Sustainability 2024, 16(1), 406; https://doi.org/10.3390/su16010406
Submission received: 8 November 2023 / Revised: 20 December 2023 / Accepted: 28 December 2023 / Published: 2 January 2024
(This article belongs to the Special Issue Green Chemistry, Wastes Valorisation and Circular Bioeconomy)

Abstract

:
This study proposes an innovative approach based on the concept of the circular economy. It involves treating deltamethrin-contaminated water using an activated carbon (AC) adsorption technique based on a highly adsorbent plant waste derived from prickly pear seeds (PPSs). Activated carbon was prepared from PPS via a simple pyrolysis process preceded by chemical impregnation with phosphoric acid. Thus, a whole range of physicochemical tests were carried out, including iodine number ( Q I 2 ), methylene blue number (QMB), Bohem dosage, pHZC, Brunauer–Emmett–Teller analysis (BET), and scanning electron microscopy (SEM). The Q I 2 and QMB were, respectively, 963.5 (mg g−1) and 8.3 (mg g−1). The pHzc of activated carbon was 2.5, and the surface area BET was 1161.3 m2 g−1. Adsorption kinetics, isotherms, and thermodynamic studies of pesticides using activated carbon were established. The obtained results revealed that the adsorption of the pesticide by the activated carbon appeared to be chemisorption with an adsorption capacity of 1.13 mg g−1. The adsorption capacity increased with increasing temperature, which explains an endothermic adsorption interaction. These results are in agreement with the results found using the density functional theory (DFT) and showed that activated carbon has an interesting adsorption power, which makes it as efficient as commercial activated carbon and predisposes it to the depollution of aqueous solutions contaminated with pesticides.

1. Introduction

The circular economy is currently one of today’s most significant challenges. It has developed in response to the growing consumption of depleted natural resources. Indeed, the unsustainable exploitation of resources has led to an inherent degradation of the environment, an imbalance in biodiversity, and the pollution of water bodies [1,2,3]. Hence, there is growing interest in transitioning to a circular economy, which aims to limit the consumption and wastage of natural resources and the production of waste. It goes beyond the linear economic model of extracting, manufacturing, consuming, and disposing by calling for rational and responsible use of natural resources and primary raw materials, as well as, in order of priority, the prevention of waste production. This includes the reuse and recycling of products, or, if that is not possible, the recovery of waste [1,2,3]. On the other hand, the global contamination of surface and groundwater by pesticides has become a major concern worldwide. As a result, these environmental issues have caught the attention of researchers, and the whole world is now determined to take action to restore water to good ecological status [4]. Pesticides are now the source of diffuse pollution that contaminates all continental waters in the world, including rivers, groundwater, and coastal areas. This contamination affects water quality, and, as a result, further treatment is required [5,6,7]. Pesticides may at first have seemed beneficial, but their harmful side-effects have now come to light. They are highly harmful to human health, being toxic [8], allergenic [9], carcinogenic [10], and mutagenic [11]. Their toxicity is linked to their molecular structure [12]. The main pesticides in use today belong to several major chemical families: organochlorines, organophosphates, pyrethroids, carbamates, phytosanitary products, and others [13]. Deltamethrin is a synthetic pyrethroid pesticide. It is mainly used as an active ingredient in certain insecticides. It is widely used in agriculture for its efficacy and potency against various ectoparasites (flies, lice, and ticks) and snakes due to its neurotoxic properties [14]. Deltamethrin is also frequently used in preserving and protecting stored grains and cereals from insects [14,15]. This substance is classified as highly toxic to aquatic life, with long-term effects. Its residues are often found in fruit, vegetables, cereals, and dairy products, as well as in drinking water [16,17,18,19]. Currently, there are several methods for treating pesticide-contaminated water, including ozonation [20,21], reverse osmosis [21], photocatalytic degradation [22] using various nanomaterials [23], the advanced oxidative process [24,25], photo-Fenton processes [26,27], anaerobic–aerobic biological treatment [28], etc. AC adsorption is a highly successful technique used for the removal of pesticides from contaminated water [29]. AC is characterized by its porous structure, large specific surface area, high adsorption capacity, and excellent mechanical stability, which probably make it a highly effective adsorbent for the removal of pollutants and the treatment of water [30,31]. However, commercial activated carbon is a relatively expensive product, and its regeneration is not always evident. As a result, in recent years, researchers have been searching for eco-responsible solutions to produce cheaper activated carbon from renewable materials [32]. On the other hand, the growing global interest in protecting the environment from solid waste generated by various human activities has prompted researchers to find ways of recovering this waste and encouraging the transition to a circular economy in which the objectives are energy, ecology, and a commitment to sustainable development [1,2,3]. In this context, several studies have been carried out in the framework of recovering agricultural waste in the production of activated charcoal. These coals are derived from lignocellulosic residues, such as olive kernels [33], apricot kernel shell [34], apricot stones [35], almond shells [36], pistachio shells [37], walnut shells [38], date kernels [39], banana stalks [9], rambutan peels [40], mangosteen peels [41], corncob [42], grape marks [43], coconut shells [44], peanut shells [45], etc. They are used, in turn, in water treatment [36,38,39,43], product purification [30,42], and gas adsorption systems [40,41]. In this context, this work proposes the valorization of PPS. This biomass, recovered from a food processing company, was first used in the extraction of residual fixed fatty oils using an ecological supercritical fluid extraction method. The waste regenerated from this operation was then reused for the elaboration of activated carbon. This study contributes to exploring eco-design strategies aimed at extending the life of a product by sharing, repairing, and reusing or recycling the materials that make them up at the end of their life, in a never-ending cycle. This contribution therefore allows for the management of PPS waste in line with the principles of the circular economy. In particular, it involves studying and validating a chemical treatment process for PPS that is inexpensive, effective, and perfectly suited to Tunisia’s socio-economic context. The main objective of this study is to prepare AC from the PPS to obtain an adsorbent that can be used for water treatment, particularly for pesticide removal. The PPS waste was transformed into activated carbon through chemical activation with phosphoric acid. Likewise, a physicochemical characterization of the biochar was carried out using different analysis techniques, including, in particular, Iodine ( Q I 2 ) and Methylene Blue (QMB) numbers, pH of zero charge value (pHZC), Boehm dosage, scanning electron microscope (SEM), and Brunauer–Emmett–Teller (BET). In addition, kinetic modeling was carried out to establish the adsorption mechanism. In this study, isothermal models (Langmuir and Freundlich) were used to determine the equilibrium pesticide saturation rate. The thermodynamic parameters were also investigated to better understand the adsorption mechanisms. Importantly, this work is novel in its use of a modern scientific tool to establish the theoretical retention mechanism between the pesticide and activated carbon from PPS. This tool is known as the density functional theory (DFT), which is increasingly used in predicting reaction mechanisms between various systems consisting of adsorbent and adsorbate [46,47,48,49,50,51].

2. Materials and Methods

2.1. Adsorbate

Deltamethrin (DLT) (99%) was obtained from Sigma Aldrich (Switzerland) and used as a standard to identify the presence of the pesticide.
Pure deltamethrin has low water solubility (0.2 µg L−1 at 25 °C), but it is soluble in some organic solvents. All experiments were conducted in ultra-pure water using a water-soluble form of the commercial pesticide (DECIS EXPERT, BAYER®) to ensure realistic results. Different concentrations from 2 to 15 mg L−1 were prepared from commercial DLT and used as adsorbates during all experiments. The molecular structure of DLT is shown in Figure 1.

2.2. Synthesis of Activated Carbon (AC)

Prickly pear seeds were obtained as waste from a PPS oil extraction manufacturing industry (Sufetula, CRS NATURAL®, Tunisia). It is a dry residue from the fruit seeds. The seed waste was used as raw material for activated carbon elaboration after a second lab oil extraction using supercritical CO2 at 30 MPa and 50 °C. This biomass was first crushed using a grinder to obtain a particle mean size of 500 µm and then sieved before the chemical activation stage. The process parameters for thermo-chemical activation were set to their optimal values after a parametric study using a surface response experimental design with the Minitab 21.1.1 software. The chemical activation was performed with 1 L of H3PO4 [52] solution with a concentration of 3 M. The experimental protocol was carried out in two stages: impregnation and pyrolysis. The first step consisted of impregnating 200 g of PPSs in a solution of phosphoric acid under reflux conditions at 80 °C for 4 h. The mixture was then stirred at room temperature for 24 h, filtered, and dried in an oven at 80° C for 5 h [53]. In the second step, the impregnated and dried material was subjected to pyrolysis. The process took place in an oven heated at a rate of 20 °C per minute for 40 min, reaching a target temperature of 800 °C. Once the target temperature was reached, it was maintained for 135 min. Subsequently, the sample was cooled for nearly two and a half hours [54,55]. All of the aforementioned steps were performed under a 3 L per minute flow of nitrogen (N2) gas. The sample was then washed with demineralized water until it reached a constant pH, and then finally dried in an oven at 80 °C for 5 h. The resulting product is activated carbon, which is used as an adsorbent in this study.

2.3. Characterization of Activated Carbon

The obtained activated carbon was characterized through a variety of methods, including iodine number, methylene blue number, pHzc, BET analysis, SEM imaging, and determination of surface functionality through the Boehm titration method [56].

2.3.1. Microporosity Approximated According to the Iodine Number and the Methylene Blue Number

The AC was characterized by quantifying the milligrams of iodine and methylene blue adsorbed per gram of AC in an aqueous solution. These tests provide insights into the porosity of activated carbon and its ability to adsorb molecules of different sizes.
A 100 mL solution containing 18.17 µmol L−1 (6 mg L−1) of methylene blue, 0.25 mmolL−1 of iodine, and 0.07 g of activated carbon was prepared. The mixture was stirred for 3 h, and then the absorbance was measured using a UV-visible spectrophotometer (6705 UV/VIS JENWAY, Vernon Hills, IL, USA) at wavelengths equal to 665 nm and 353 nm for the methylene blue and iodine assays, respectively [57,58]. Finally, the adsorption capacities, noted as Q (mg g−1), were determined using Equation (1).
Q = ( C 0 C f ) V m A C
  • C 0 : Initial concentration of iodine (molL−1) or methylene blue (mg L−1).
  • C f : Final concentration of iodine (mol L−1) or methylene blue (mg L−1).
  • V : Volume of solution of iodine or methylene blue (mL).
  • m A C : Mass of activated carbon (g).

2.3.2. Acidic and Basic Surface: Boehm Method

The neutralization method was adopted to determine the acidic and basic functions of the activated carbon surface involved in pollutant retention (the Boehm method). Four 0.02 M solutions of sodium bicarbonate (NaHCO3), sodium carbonate (Na2CO3), sodium hydroxide NaOH, and hydrochloric acid HCl were prepared separately. A quantity of 500 mg of AC was introduced into each solution, which was stirred at 150 rpm (Vibramax 100, Gatersleben, Germany) for 48 h until reaching equilibrium [59,60]. Perkin Elmer (Waltham, MA, USA) FTIR-ATR Spectrum Two was used for infrared (IR) analysis of the AC.

2.3.3. pH of Zero Charge of Surface (pHZC)

The pH of zero charge pHZC is the pH at which the net surface charge is zero [61]. The measurements were conducted in the presence of NaCl (0.1 M) at different pH values ranging from 1 to 12 adjusted using HCl (0.1 M) or NaOH (0.1 M). For each starting pH value, 500 mg of the activated carbon was mixed with 50 mL of electrolyte solution. The equilibrium pH, corresponding to the pHZC point, was measured after 48 h [62].

2.3.4. Brunauer–Emmett–Teller BET Analysis

In order to determine the specific surface of the elaborated AC, the BET (Brunauer–Emmett–Teller) method was applied using a Micromeritics ASAP2020 (Norcross, GA, USA) analyzer in which liquid nitrogen was adsorbed at a temperature of 77 K. This method involves quantifying the amount of nitrogen required to create a monolayer of nitrogen molecules on the sample surface [63].

2.3.5. Scanning Electron Microscopy (SEM) Analysis

The AC surface morphology was assessed through scanning electron microscopy (SEM) analysis using a JSM-7000F JEOL Microscope (Kyoto, Japan). The primary components of the raw activated carbon, including carbon, hydrogen, nitrogen, and sulfur, were identified through elemental analysis using SEM energy dispersive X-ray spectroscopy EDS (EVO AZtec, OXFORD instruments, UK).

2.4. Adsorption Experiments

2.4.1. Determination of Pesticide Elimination Rate R (%)

Different samples were prepared by mixing 20 mL of deltamethrin (with a concentration of 15 mg L−1) with different quantities of activated carbon between 0.03 mg and 0.5 mg. The contact time and temperature were 3 h and 27 °C ± 2, respectively. After stirring, the solution was filtered, and the filtrate was analyzed through High-Performance Liquid Chromatography HPLC at 230 nm. The pesticide elimination rate R (%) was calculated using the following equation [64]:
R % = ( C 0 C e ) C 0 100
  • C 0 : Initial concentration of deltamethrin (mg L−1).
  • C e : Equilibrium concentration of deltamethrin (mg L−1).

2.4.2. Kinetics Adsorption

Adsorption kinetics experiments were carried out by mixing 10 mL of a solution at a constant concentration of pesticide (at 25 °C and pH = 6.4) with 0.2 g of activated carbon at a constant stirring speed of 150 rpm. For both kinetic and isothermal studies, a range of initial deltamethrin concentrations from 2 to 15 mg L−1 were used. The equilibrium concentration of the pesticide was determined using High-Performance Liquid Chromatography (HPLC) with an Agilent (Santa Clara, CA, USA) 1200 instrument. An analytical column with a C18 phase (150 mm × 4.6 mm ID) was used. The mobile phase consisted of acetonitrile and water in an 80:20 ratio, respectively. The injection volume was set at 20 µL, with a flow rate of 0.5 mL min−1, and detection occurred at a wavelength of 230 nm. In order to evaluate the effectiveness of an adsorbate through adsorption equilibrium kinetics studies, two kinetics models, namely, pseudo-first-order (PFO) and pseudo-second-order (PSO) models, were applied to examine the mechanism of the adsorption process. The equations for these two models are presented in Table 1 [65].

2.4.3. Adsorption Equilibrium Models

For the adsorption isotherms analyses, several models, the Freundlich and Langmuir models, were used [66,67]. These models were applied to establish a correlation equation between the adsorption isotherms and the characteristic properties of the adsorbent and the adsorbate. The corresponding equations are summarized in Table 1.

2.4.4. Thermodynamic Study

The thermodynamic study was carried out to determine the influence of temperature on the adsorption of deltamethrin with the elaborated activated carbon. The experiments were established at 303, 313, and 323 K. The thermodynamic parameters for the adsorption processes were calculated using this equation [68]:
L n K i = S ° R H ° R T
where Ki is the constant of the adsorption equilibrium of the initial step, ∆S0 (kJ mol−1 K−1) is the standard entropy, ∆H0 (kJ mol−1) is the standard enthalpy, T is the absolute temperature (K), and R is the gas constant (8.314 J mol−1 K−1). The values of enthalpy (∆H0) and entropy (∆S0) were calculated from the linear regression intercept slope of Ln (Ki) = f (1/T). The standard Gibbs free energy change for the initial adsorption step ∆G0 (kJ mol−1) was determined according to the following equation [69]:
∆G0 = ∆H0 − T∆S0

2.5. Density Functional Theory (DFT)

To determine the retention mechanism of DLT by activated carbon, we employed the density functional theory (DFT), which, through quantum chemistry calculations, allows for the determination of the molecular properties of the lowest energy configuration. Molecular descriptors based on the evaluation of HOMO/LUMO (Highest Occupied Molecular Orbitals/Lowest Unoccupied Molecular Orbitals) from these quantum chemistry calculations provide insights into the reactivity and stability of molecules. The main descriptors are the chemical potential, the hardness, and the global electrophilic index. The chemical potential, μ = H O M O + L U M O 2 , measures the tendency of electron release. A higher value of this parameter implies a lower capacity for retaining electrons. The molecule’s stability and resistance to deformation are characterized by its hardness, η = H O M O + L U M O 2 . A decrease in this parameter corresponds to a lower excitation energy requirement for electron transition from HOMO to LUMO. The ability of the molecule to accept an electron is indicated by the global electrophilicity index, ω = μ 2 2 η . It quantifies the decrease in ligand energy caused by electrons transfer.
All of the abovementioned parameters can help predict, in an adsorption process, the mechanisms of adsorbent/adsorbate interaction.
All calculations were performed on molecular structures of the lowest energy determined with the model B3LYP/6-31G(d,p) at the ground state, which is often used for medium-sized molecular structures, using ORCA 5.0 and GAUSSIAN 09 software for calculations and Avogadro 1.2.0 and GaussView 6 for visualization.
For the molecular energy calculations, the total enthalpy (H) and the free Gibbs energy (G°) were calculated for the optimized geometry corresponding to the lowest energy level. The free Gibbs energy G° was calculated as:
G° = H − T × S
where T is the standard temperature and the entropy term S is the sum of the electronic, vibrational, rotational, and translational ones.
The adsorption energy Eads and the standard free Gibbs energy variation G ° are calculated as a function of the adsorbent adsorbate dimer (DLT-CXP), adsorbate (DLT), and adsorbent (CXP) enthalpies and free Gibbs energies as follows:
Eads = HDLT-CXP − HDLT − HCXP
G ads ° =   G DLT - CXP ° G DLT ° G CXP °

3. Results and Discussion

3.1. Characterization of Activated Carbon

3.1.1. Iodine and Methylene Blue Indices ( Q I 2 , QMB)

The Q I 2 and QMB indices are used for evaluating the pore characteristics of the synthesized carbon material. The measured methylene blue indices value was 8.3 mg g−1, which validates the carbon’s capacity to adsorb large- and medium-sized molecules. On the other hand, the measured iodine index value in this study was 963.5 mg g−1, indicating that this activated carbon can effectively adsorb medium and small molecules.

3.1.2. Boehm Titration

Boehm’s method was used to calculate the functional groups on the surface of an activated carbon that are involved in adsorption. According to this analysis, the surface of activated carbon, as presented in Table 2, had predominantly acidic characteristics. The acidity of the AC is mainly due to the abundance of carboxylic groups, which make up approximately 77% of the total groups, with a quantity equal to 0.688 meq g−1. Similarly, the amount of lactonic groups was equal to 0.128 meq g−1, followed by phenolic groups with 0.08 meq g−1. However, the overall basicity was lower (0.16 meq g−1) than the total acidity (0.896 meq g−1). It should be noted that the development of these acidic and basic functions on the surface of activated carbons varied according to the activating agent used. Acidic functional groups can also be revealed using FTIR and XPS techniques [70,71].
The FTIR-ATR spectrum demonstrated a relatively strong band (green background in Figure 2) in the range of 1650–1350 cm−1 and approximately centered at 1570 cm−1. This band is attributed to the combined stretching vibrations of conjugated C=O groups and aromatic rings in functionalized AC [72]. A slightly lower intensity broad band was observed in the region of 1310–890 cm−1, considered the main spectra fingerprint (grey background), with maxima at 1146 and 1075 cm−1. The existence of phenols was supported by O-H bending (1390 cm−1) and C-O stretching (1165 cm−1) vibrations of phenols [72]. A typical nitrile vibration was also observed at 2165 cm−1. The IR spectra after adsorption displayed slightly more intense vibrations in the fingerprint region compared to the one before the adsorption.

3.1.3. pH of Zero Charge Value

The pHZC of a material is a crucial parameter in surface characterization. This parameter helps determine whether the adsorbent surface is acidic or basic compared to the pH of the solution. When the pH is lower than the pHZC, the surface charge is positive, indicating acidity. However, when the pH is higher than the pHZC, the surface charge is negative, signifying alkalinity. In this study, the pHZC of the activated carbon was equal to 2.5 (Figure 3), which is lower than the solution’s initial pH of 6.8 (pHi). These results indicate that the surface charge of the sorbent was negative. This aligns with the conclusions from the Boehm assay, as the AC presents a surface with an acidic character [73].

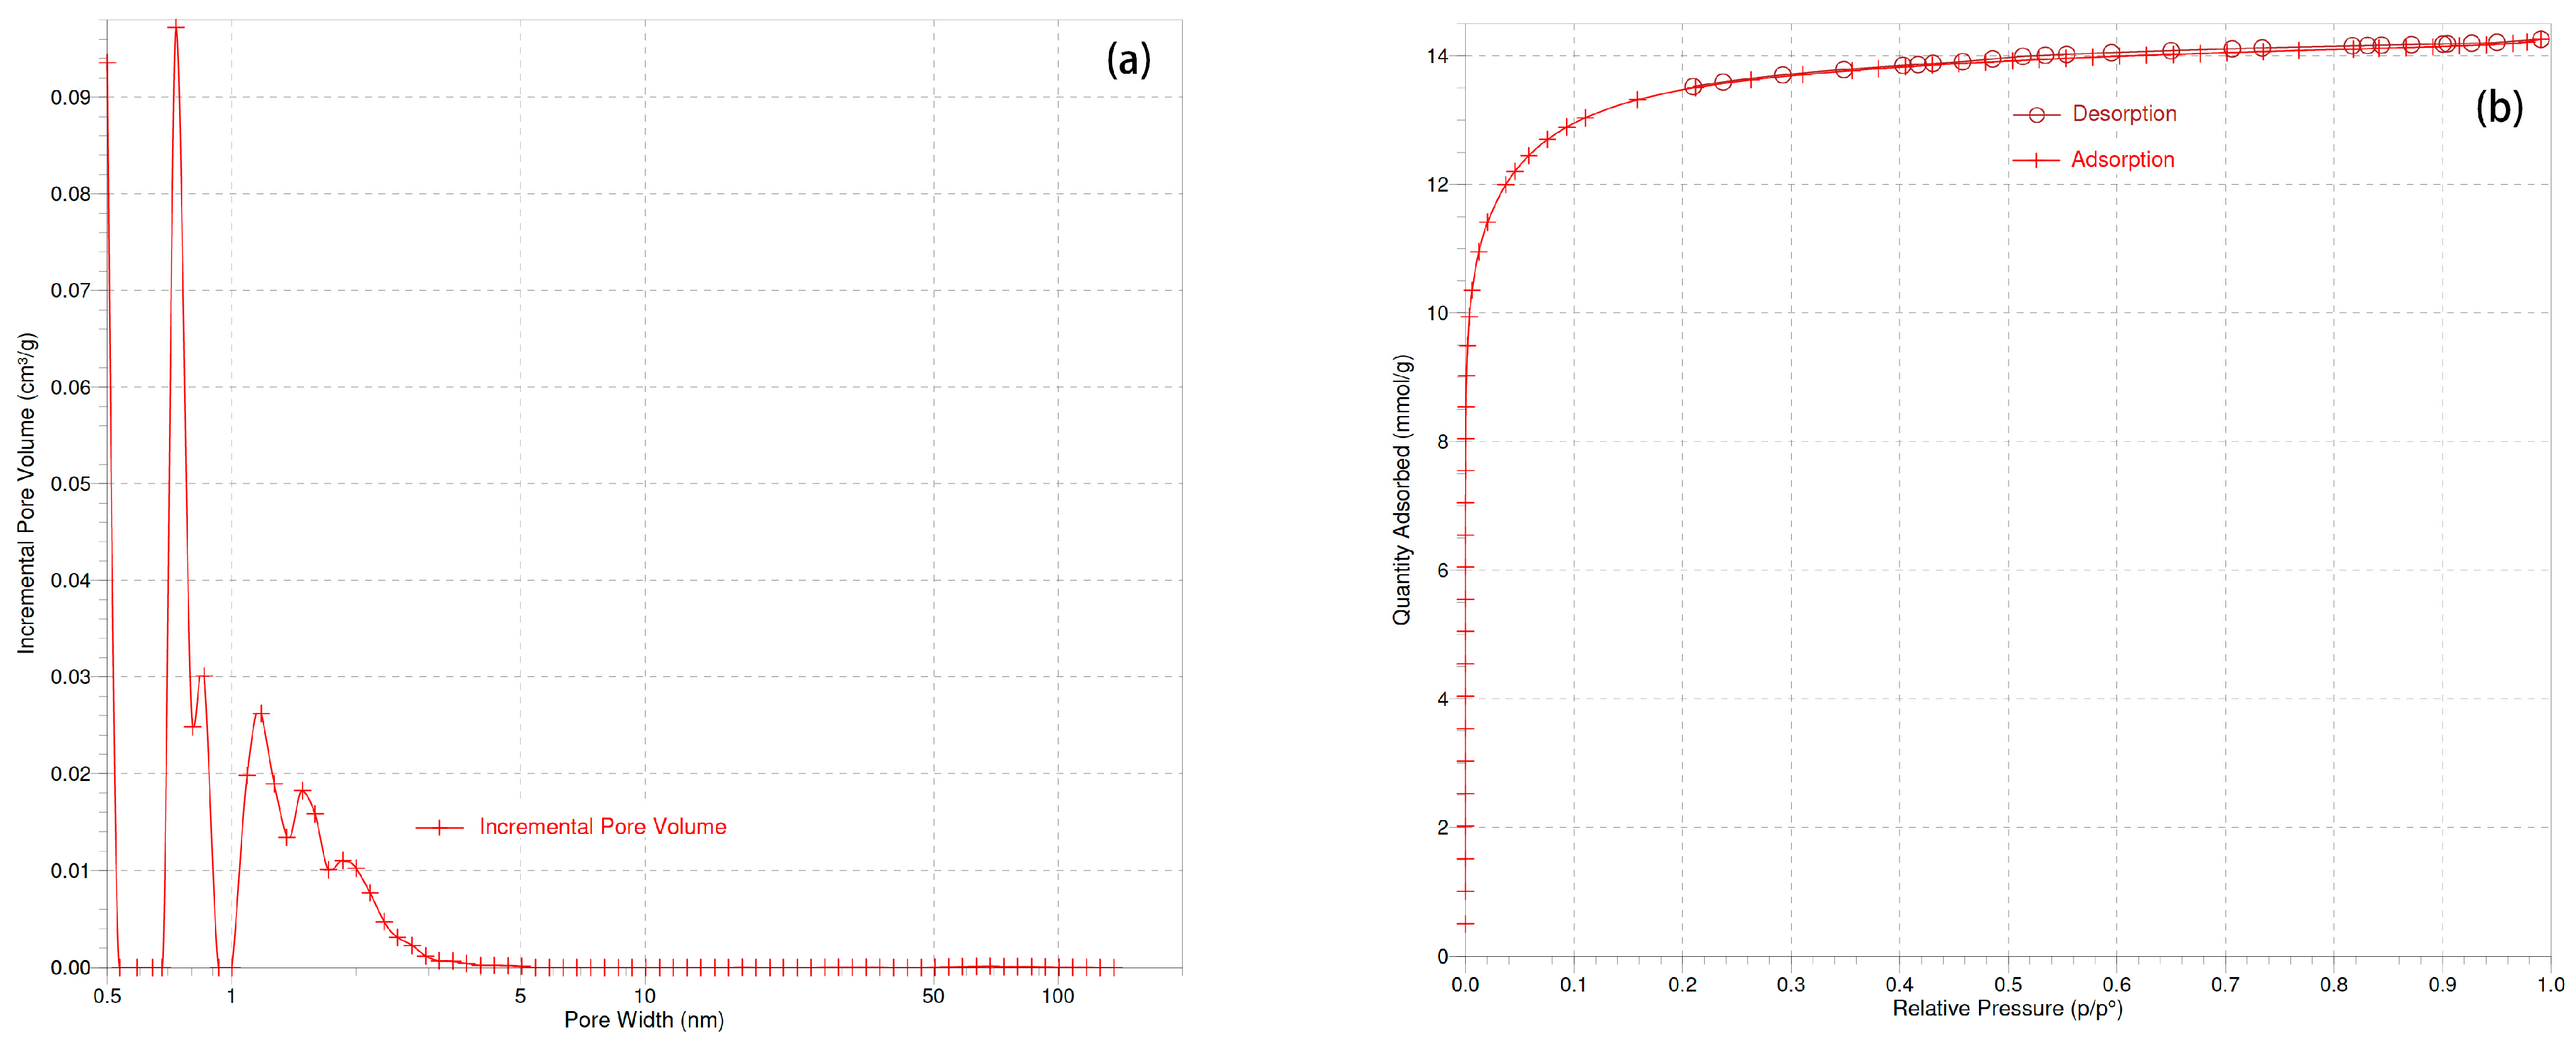
3.1.4. Specific Surface Area: BET Method

The low-temperature (−196 °C) nitrogen adsorption–desorption isotherm is commonly used for physical property analysis. The specific surface area is calculated using the BET method. For our prepared AC, the BET surface was equal to 1161.3 m2 g−1. The Barrett–Joyner–Halenda (BJH) pore size distribution (Figure 4a) clearly indicated a majority of microporosity, with a mean pore width slightly less than 2 nm. This was corroborated by the shape of the type I adsorption–desorption isotherm and the absence of hysteresis (Figure 4b), which is expected in the case of microporous material.

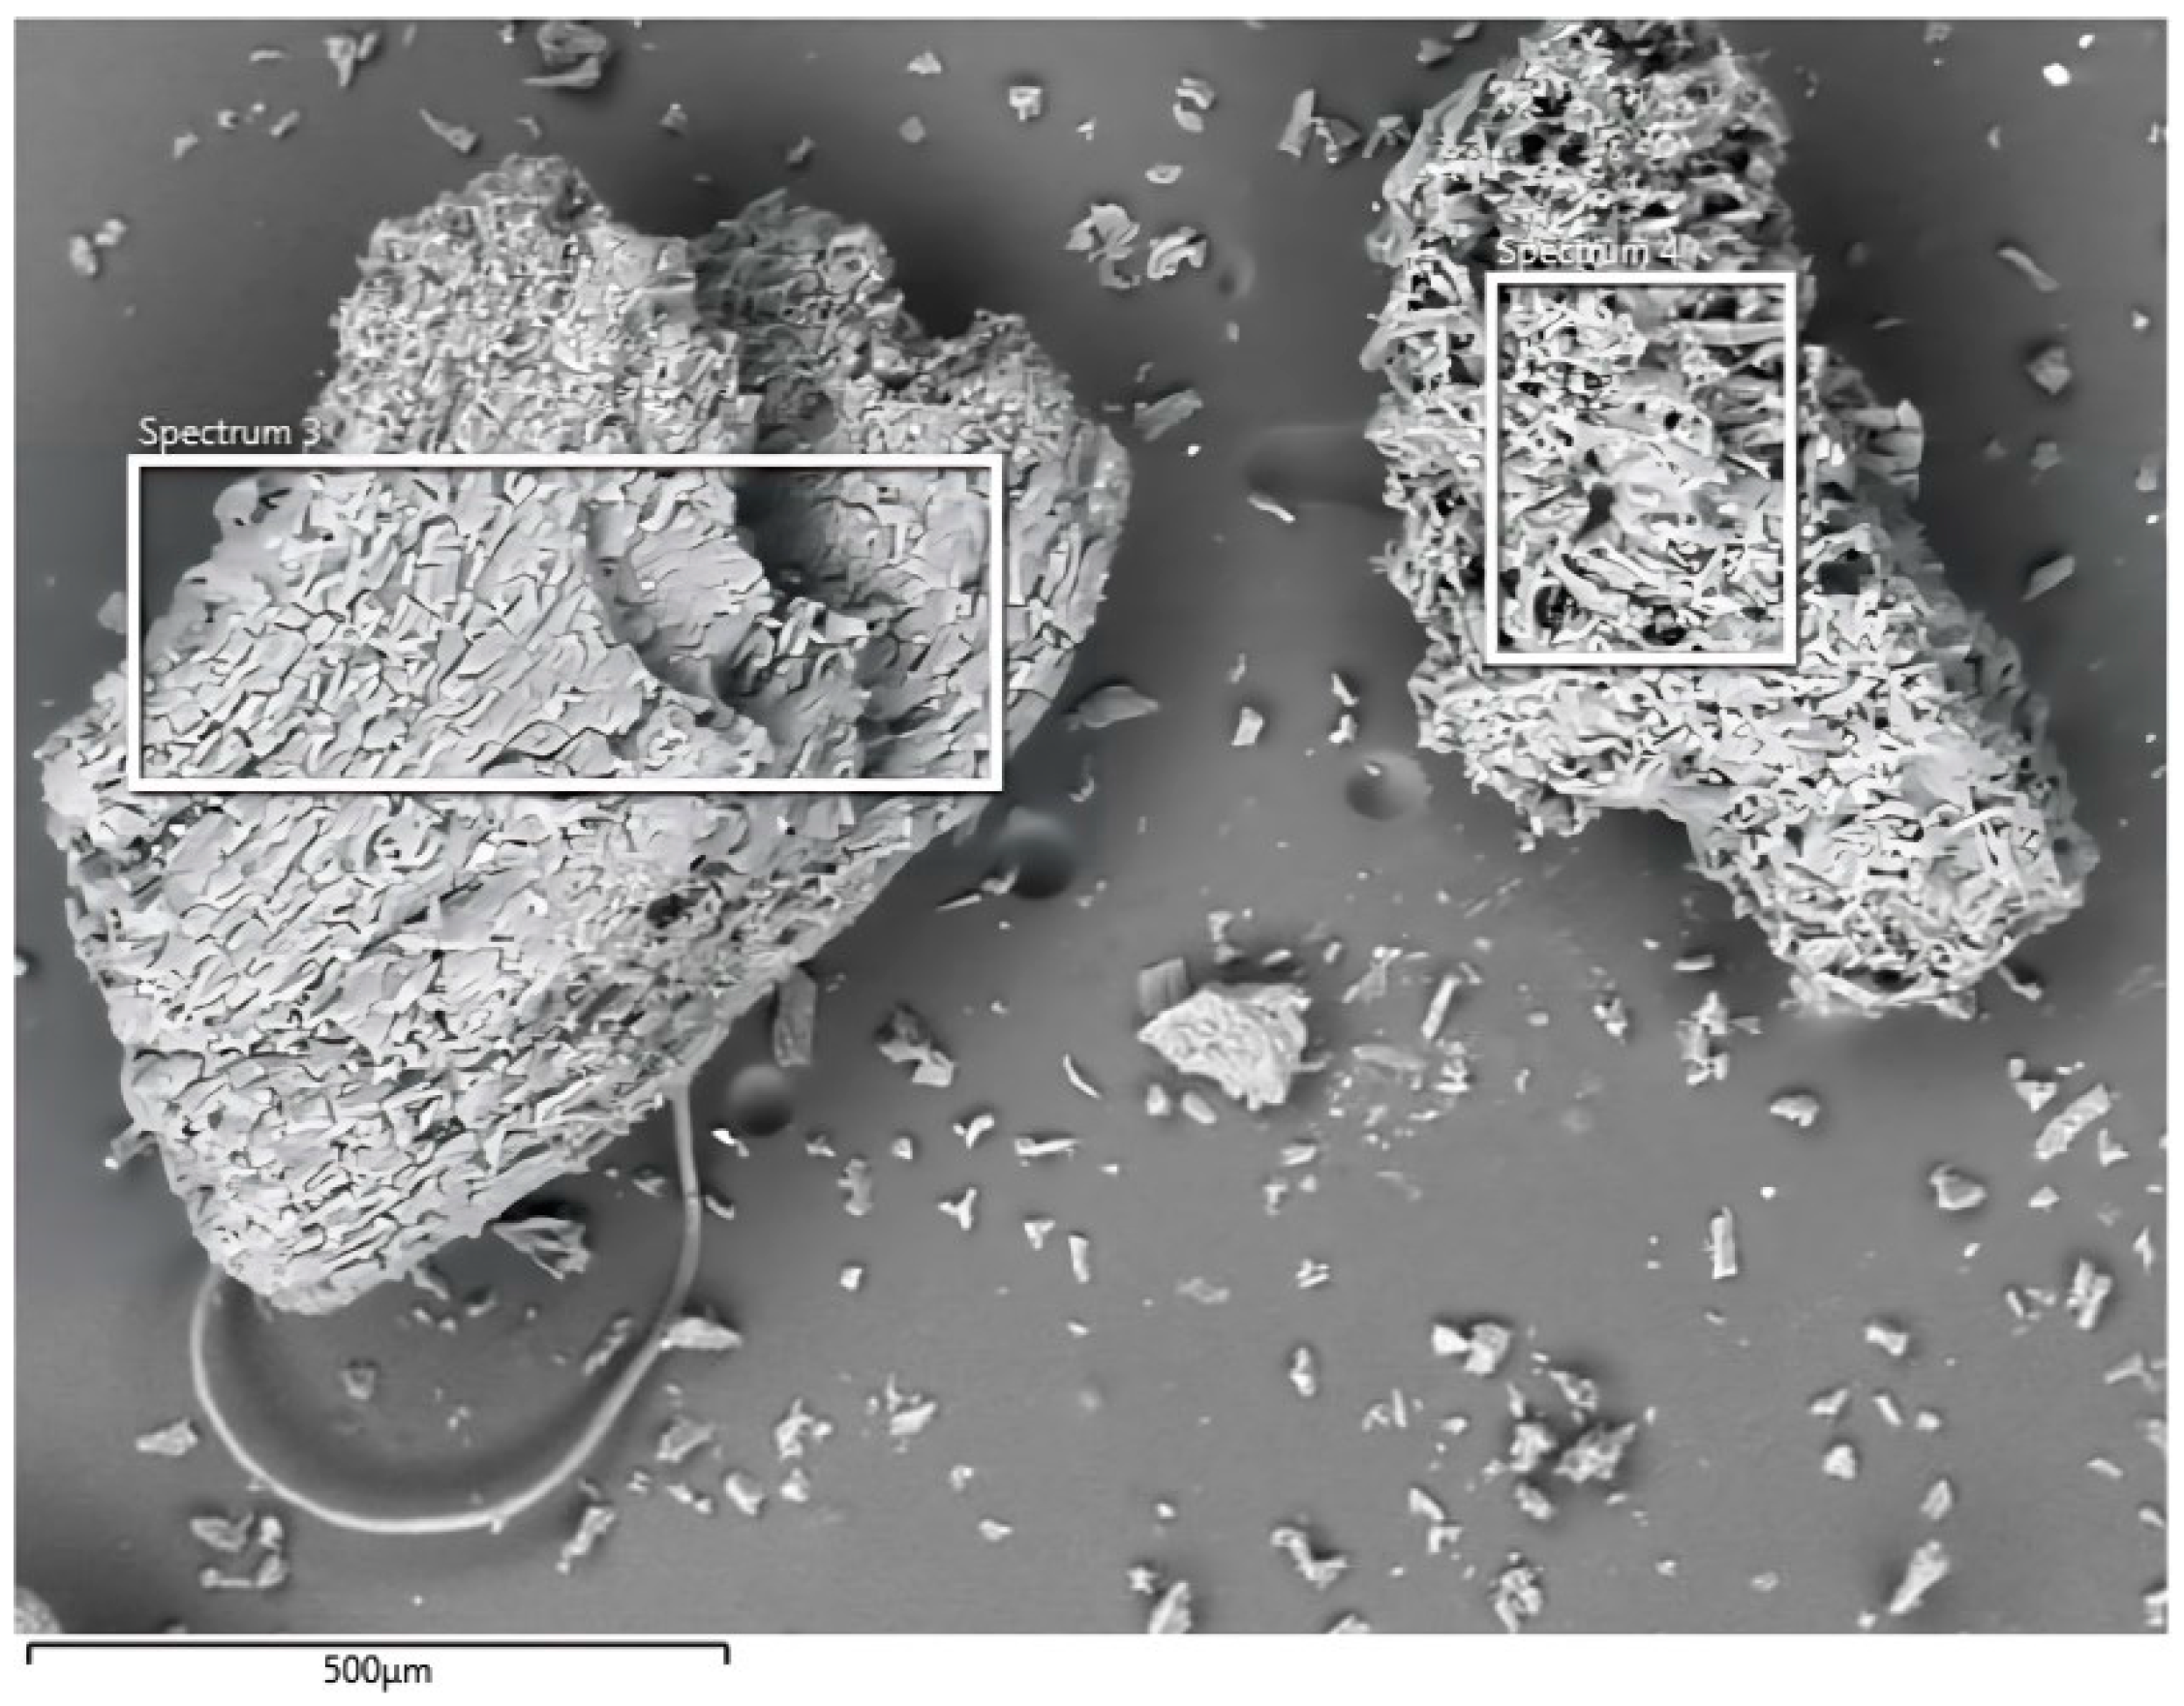
3.1.5. Morphological Study: SEM-EDX Analysis

Scanning electron microscopy (SEM) was used to examine the surface morphology of the AC. Figure 5 illustrates the obtained images of the sample. Note the presence of openings and hollow structures.
The elemental composition of the activated carbon derived from prickly pear seeds is illustrated in Table 3. From the obtained results, it is clear that the predominant elements in the composition were carbon (80%), oxygen (16%), and phosphorus (3%). However, other elements, such as calcium (Ca), silicon (Si), magnesium (Mg), iron (Fe), potassium (K), and sodium (Na), were present in relatively small quantities ranging between 0.02% and 0.23%.

3.2. Adsorption Studies

3.2.1. Mass Effect

To determine the optimum adsorbent mass for reducing the maximum amount of pesticide, the variation in activated carbon mass as a function of the amount of pesticide adsorbed was studied. The results in Figure 6 show that the mass of AC increased with the rate of pesticide adsorption. From 0.2 g upwards, the value of adsorbed pesticide remained stable. Consequently, this value of 0.2 was considered the optimum activated carbon mass that allows for the reduction of the maximum amount of deltamethrin, and it was used throughout this study.

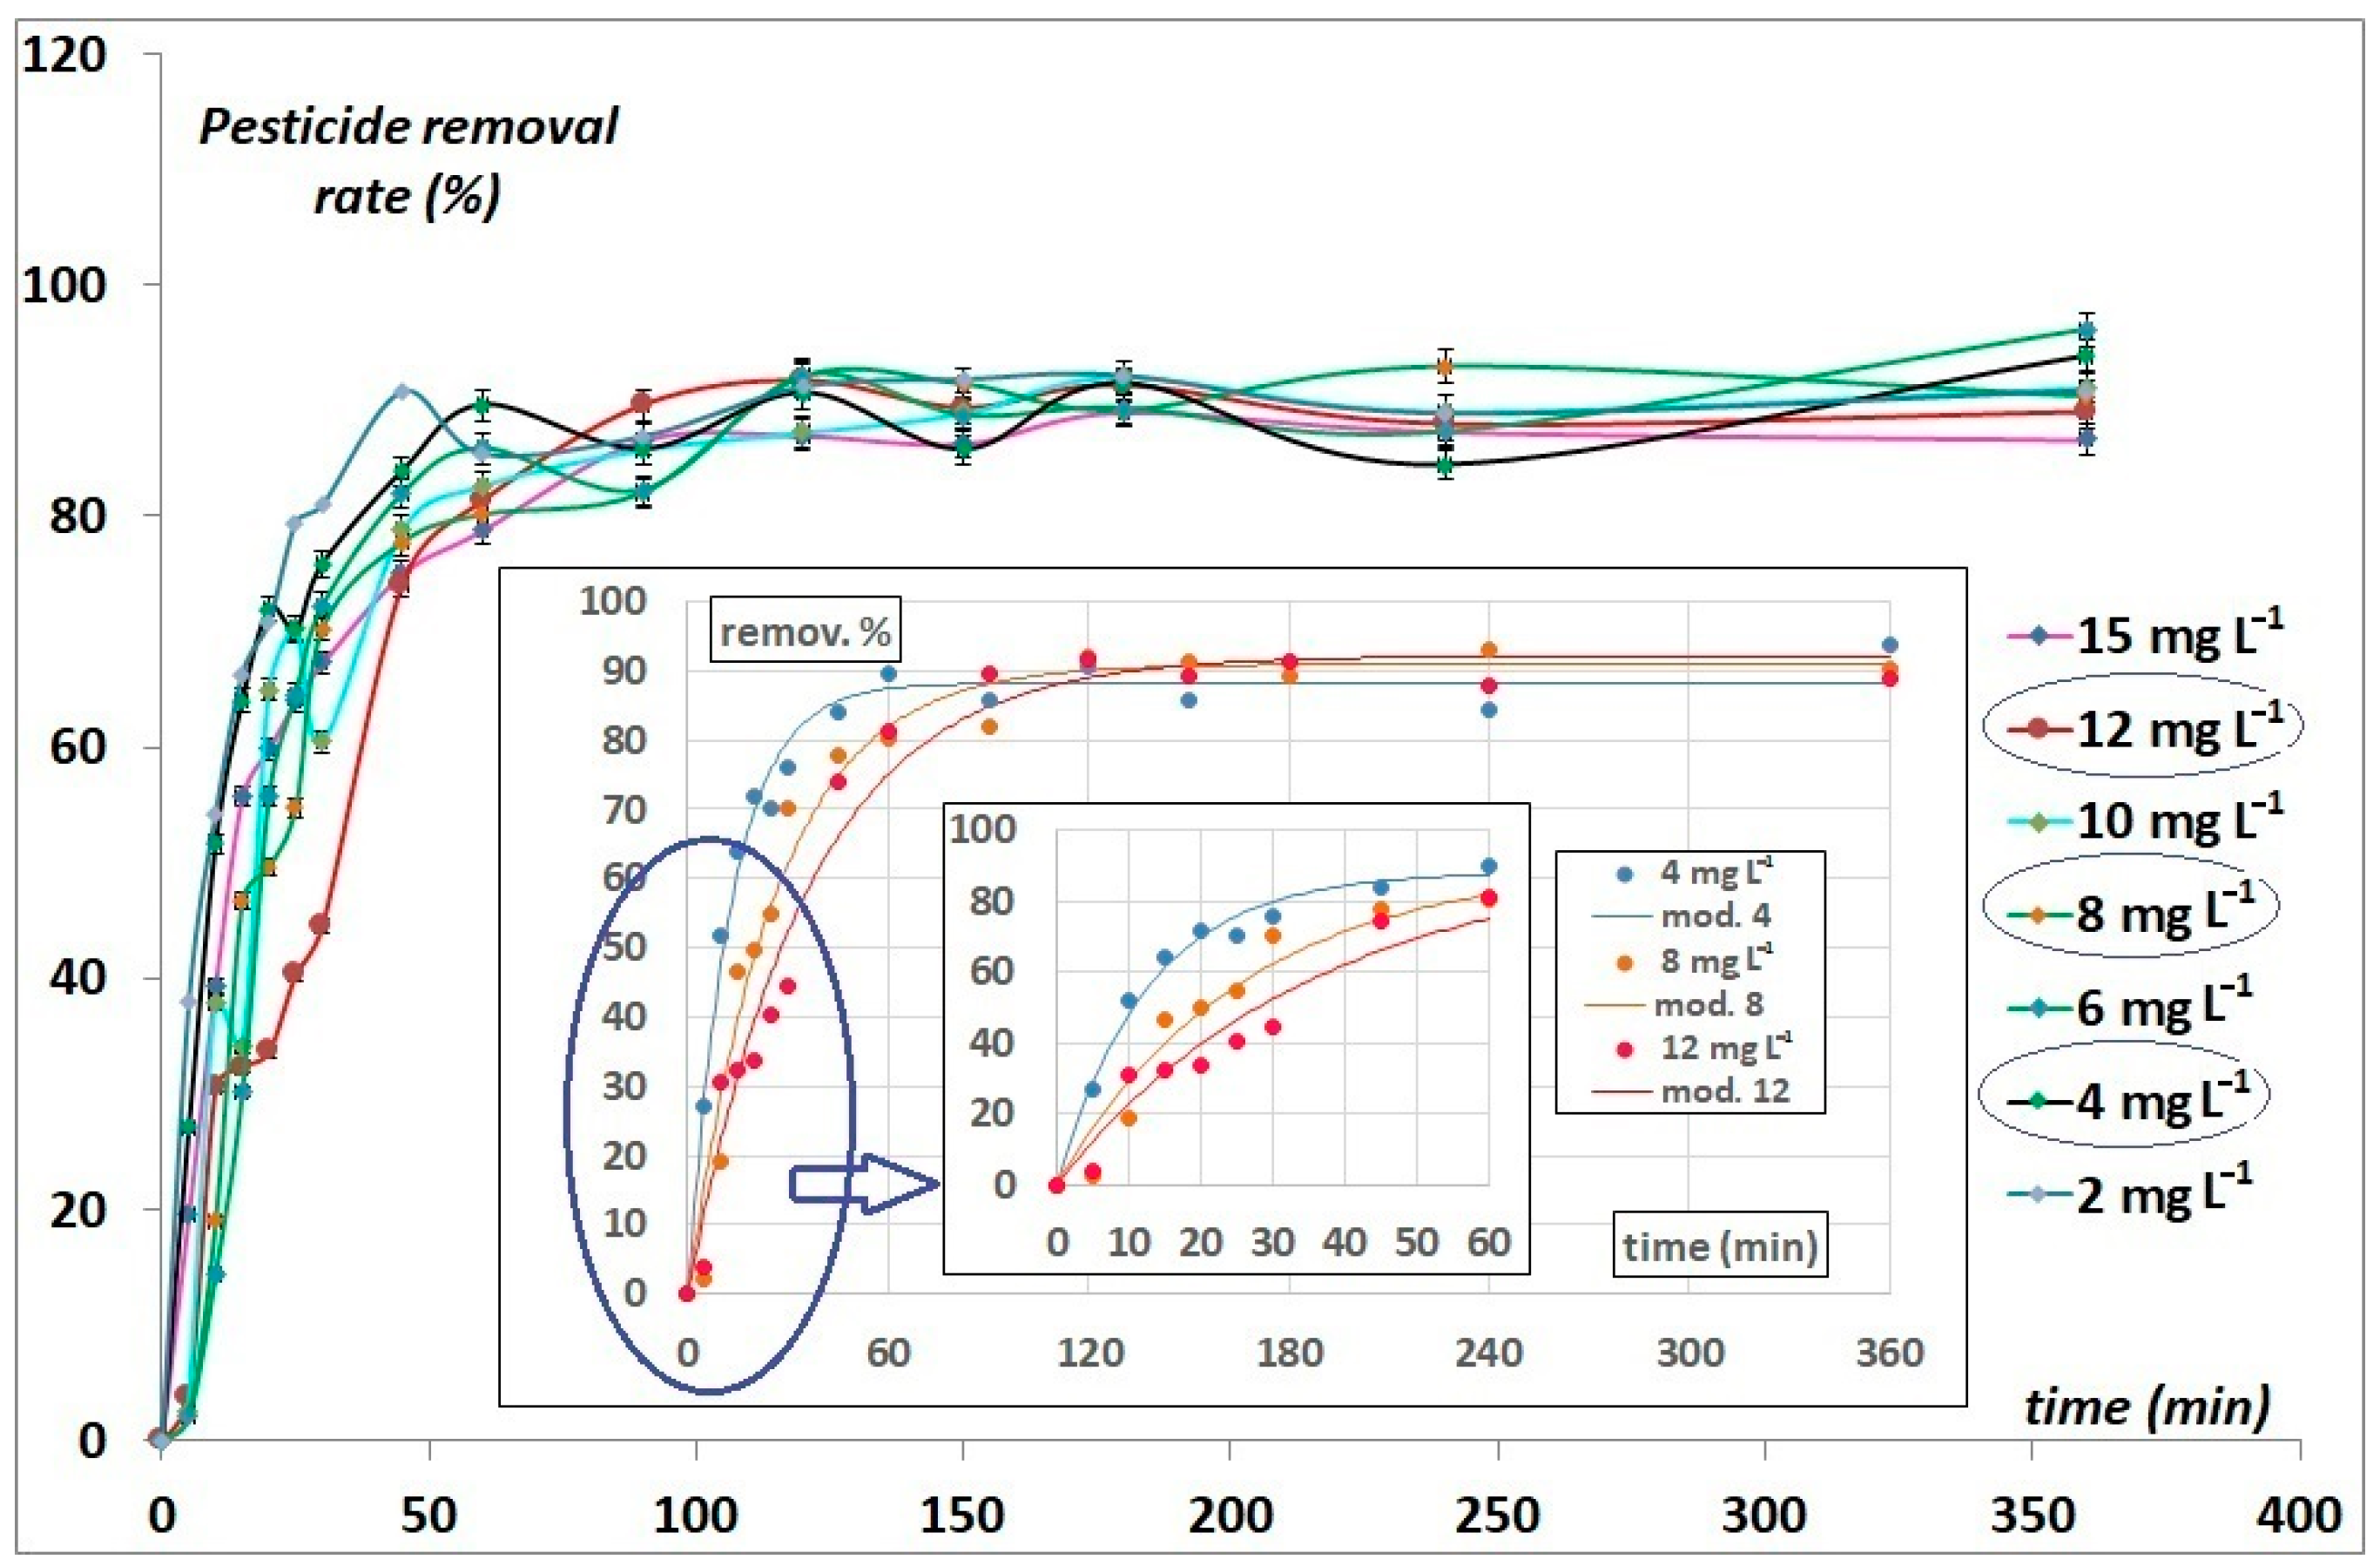
3.2.2. Contact Time Effect

To reach the maximum value of deltamethrin adsorption capacity and to ensure the saturation of all available active sites on the AC surface, the contact time effect using different initial deltamethrin concentrations was studied. The range of initial deltamethrin concentrations was considered to be 2, 4, 6, 8, 10, 12, and 15 mg L−1. Adsorption kinetics were studied for each initial concentration at 360 min. The obtained results are shown in Figure 7. It should be noted that deltamethrin adsorption by activated carbon takes place in two phases. The first phase is considered rapid, occurring between 0 and 60 min, with a rapidly increasing elimination rate reaching 75%. During this phase, lower concentrations have a higher removal rate (Figure 7—zoom). The second, slower phase is characterized by slight variations in the amount adsorbed until reaching equilibrium. The rapid adsorption during the first few minutes of the process is attributed to the number of active sites available on the adsorbent surface, corresponding to the highest process driving force. The number of such sites decreases with time when approaching the equilibrium state, resulting in a deceleration of the adsorption process.

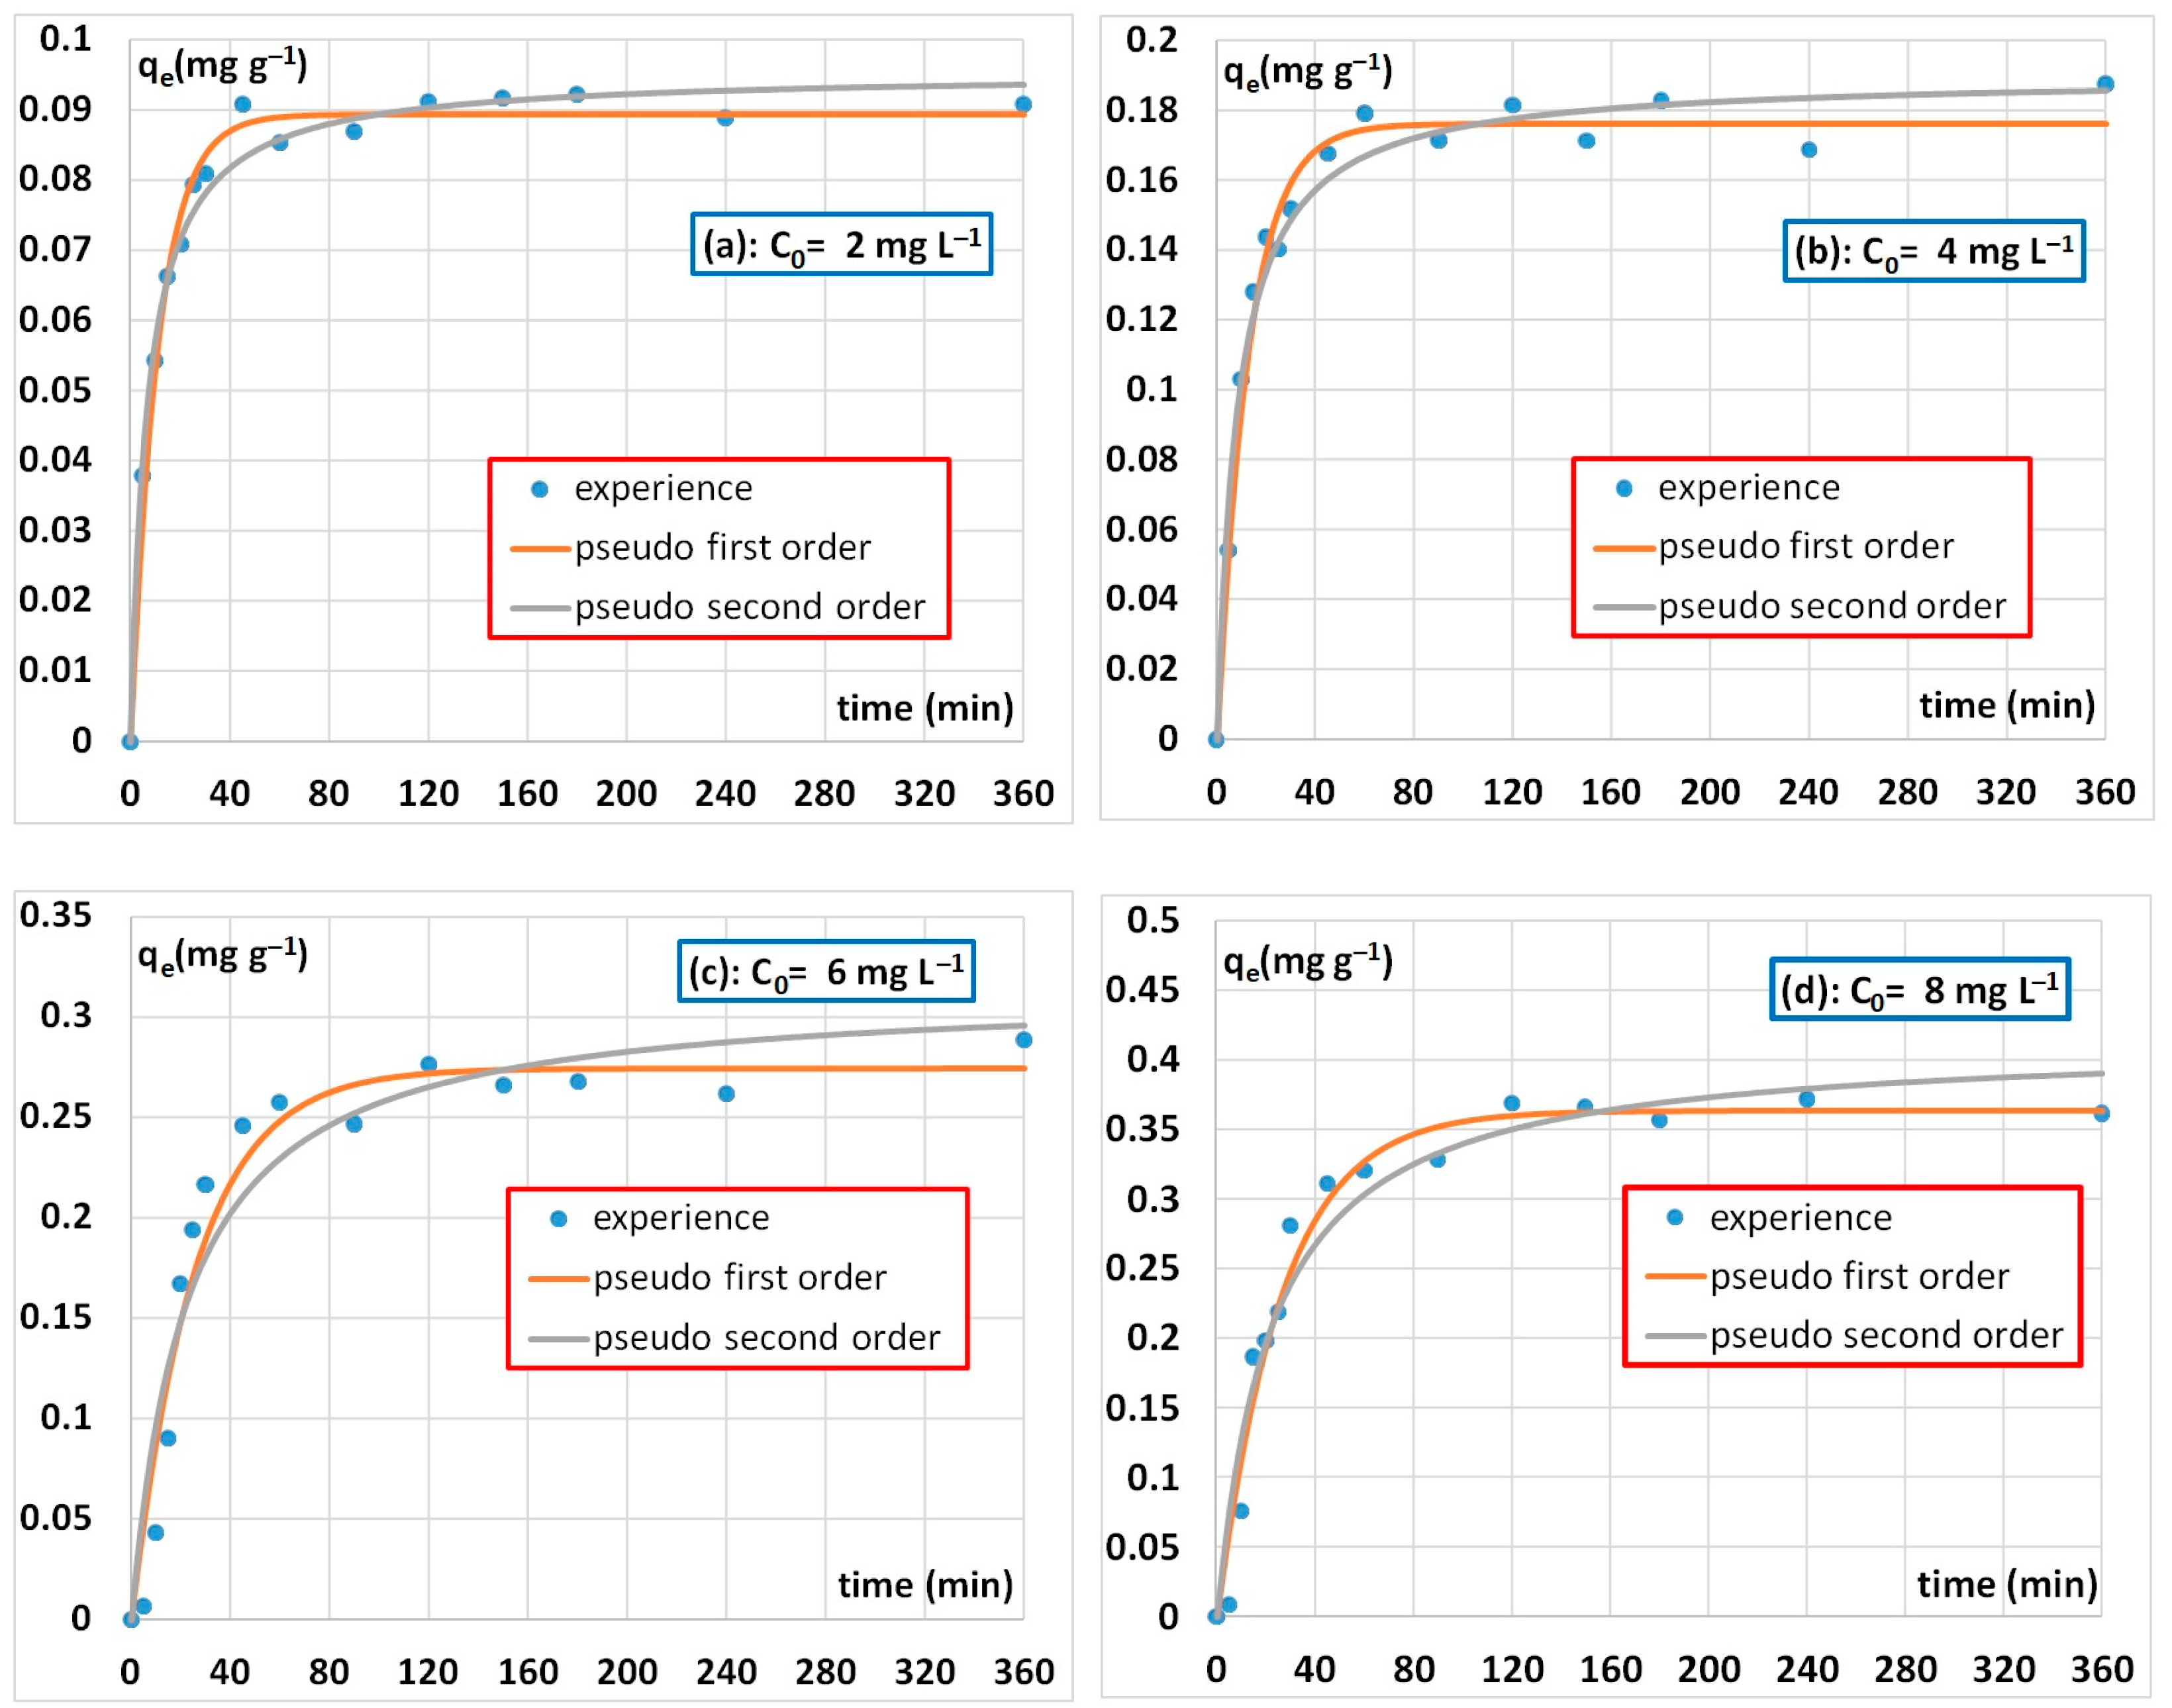
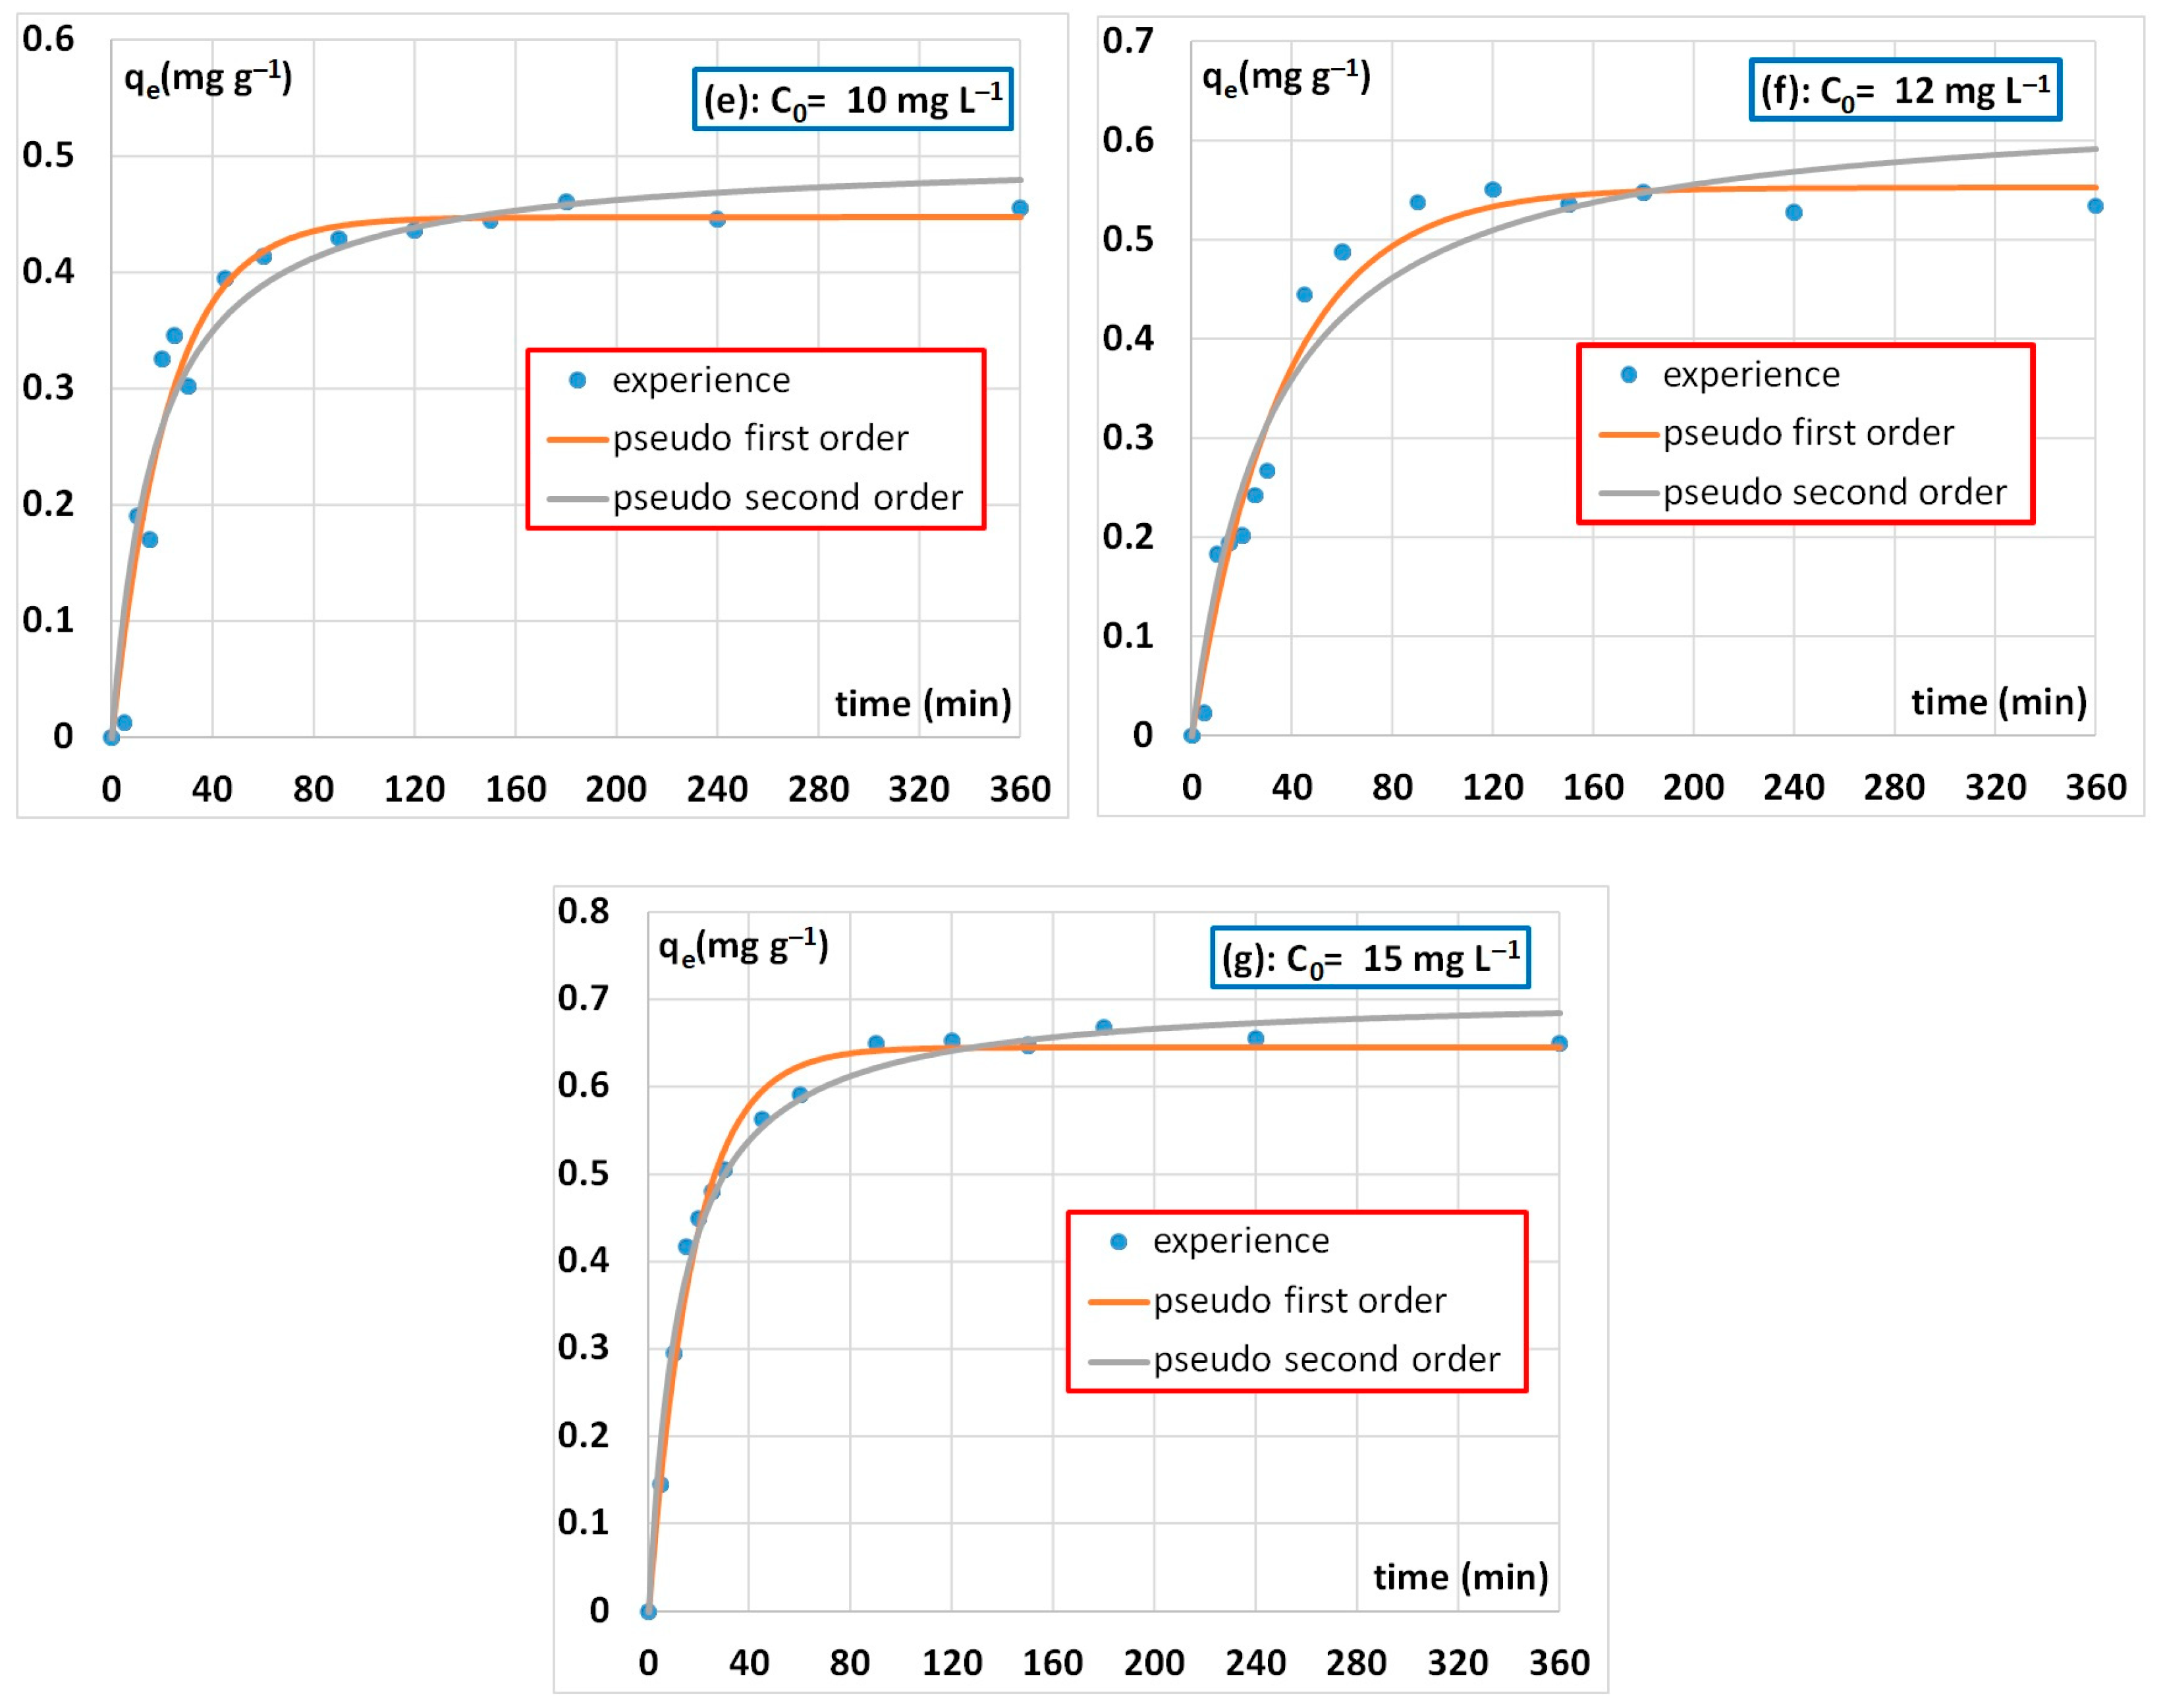
3.2.3. Adsorption Kinetics Results

The effect of adsorption duration was studied for different concentrations of deltamethrin (2, 4, 6, 8, 12, and 15 mg L−1). Kinetic curves are illustrated in Figure 8. The optimal equilibrium time for all studied concentrations was found to be 90 min. However, to ensure that full equilibrium was reached, the experimental data were collected after 6 h. The obtained equilibrium quantity qe (mg g−1) varied between 0.09 and 0.65.
Two kinetic models, namely, the pseudo-first-order model (PFO) [74] and the pseudo-second-order (PSO) model [75], were used to model the kinetics of deltamethrin adsorption onto AC. The modelization curves are presented in Figure 9.
Table 4 summarizes the obtained adsorption constant values of each model and the corresponding correlation coefficients (R2). The obtained results showed that the correlation coefficients (R2) for the two models are almost similar, and they are statistically acceptable.
In this case, a comparison of the results of these two models with the experimental results suggested that the PFO model fit the experimental data slightly better than the PSO model. The retention of the deltamethrin by the AC occurred proportionally to unoccupied, heterogeneous adsorbent sites. The adsorbent microporosity and DLT molecule size also suggest that the pesticide diffusion may be the limiting retention process.

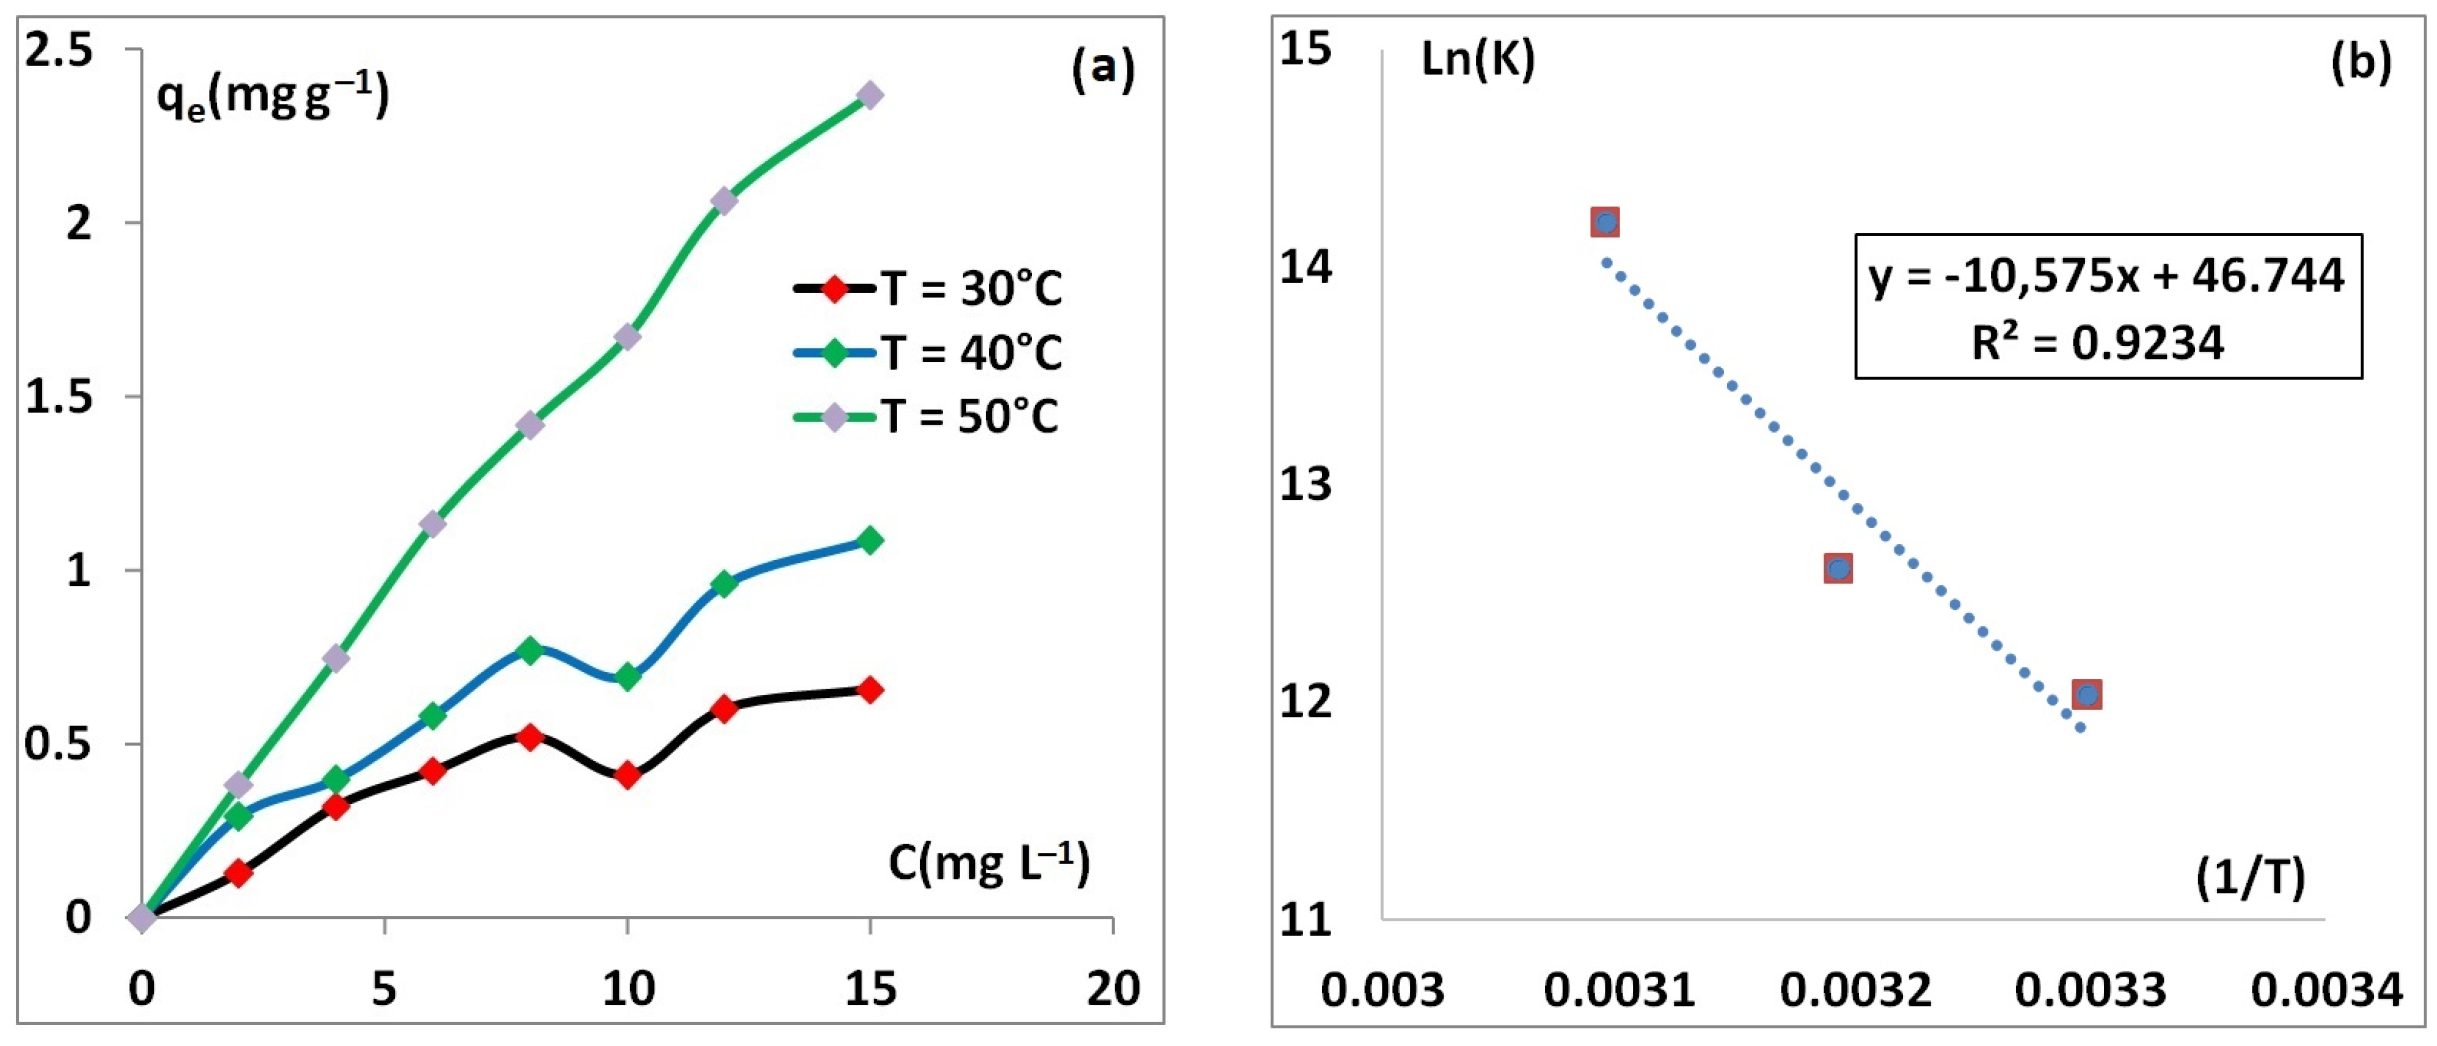
3.2.4. Adsorption Isotherms and Modeling

The adsorption isotherms were assessed in order to evaluate the adsorption capacity of the AC. The experimental data were modeled using Langmuir and Freundlich adsorption models. Indeed, the Langmuir model is based on the hypothesis that the maximum adsorption occurs when all of the retention sites are occupied by a monolayer of adsorbate substance [76]. The Freundlich model is applied to multilayer adsorption on heterogeneous surfaces [77]. The adsorption isotherms are shown in Figure 10, and the parameters of each studied model are summarized in Table 5.
According to the results, we can deduce that the Langmuir model, which is illustrated in Figure 10, presents a good fit with the experimental data and a correlation coefficient R2 > 0.94. However, by comparing the parameters appropriate to each model (Table 6), the Langmuir model is the most appropriate to describe the adsorption of deltamethrin by activated carbon. In this case, the adsorption was carried out on a monolayer surface of the adsorbent. Moreover, the Langmuir constant (KL) value of about 0.7 L mg−1 indicates that there was an interaction of weak binding between the adsorbent and the adsorbate. Thus, the adsorption was favorable, and desorption is possible in order to regenerate the adsorbent for further reuse.

3.2.5. Thermodynamics Study

To investigate the impact of temperature on the adsorption of the pesticide of activated carbon, a thermodynamic study was conducted. The obtained results are shown in Figure 11. From this figure, one can conclude that the increase in temperature had a significant effect on the equilibrium adsorbed quantity of pesticide qe (mg g−1).
The values of enthalpy (∆H0) and entropy (∆S0) of the adsorption, which are supposed to be temperature-independent in the range of 30–50 °C, were deduced from Figure 11b. According to the obtained results, it can be seen that the ∆H0 value was positive, which indicates that the adsorption process of the DLT is an endothermic reaction. The negative value of ∆G0 means that the adsorption of deltamethrin by the produced AC was spontaneous [78]. The classification of adsorption as either a physisorption or chemisorption process is based on the variation of enthalpy, which is a measure of the strength of the interaction between the adsorbent and the adsorbate. In our case, ∆H0 = 87.92 kJ mol−1, which is greater than 40 kJ mol−1 (Table 6). This indicates that the adsorption of deltamethrin by the activated carbon was a chemisorption process.

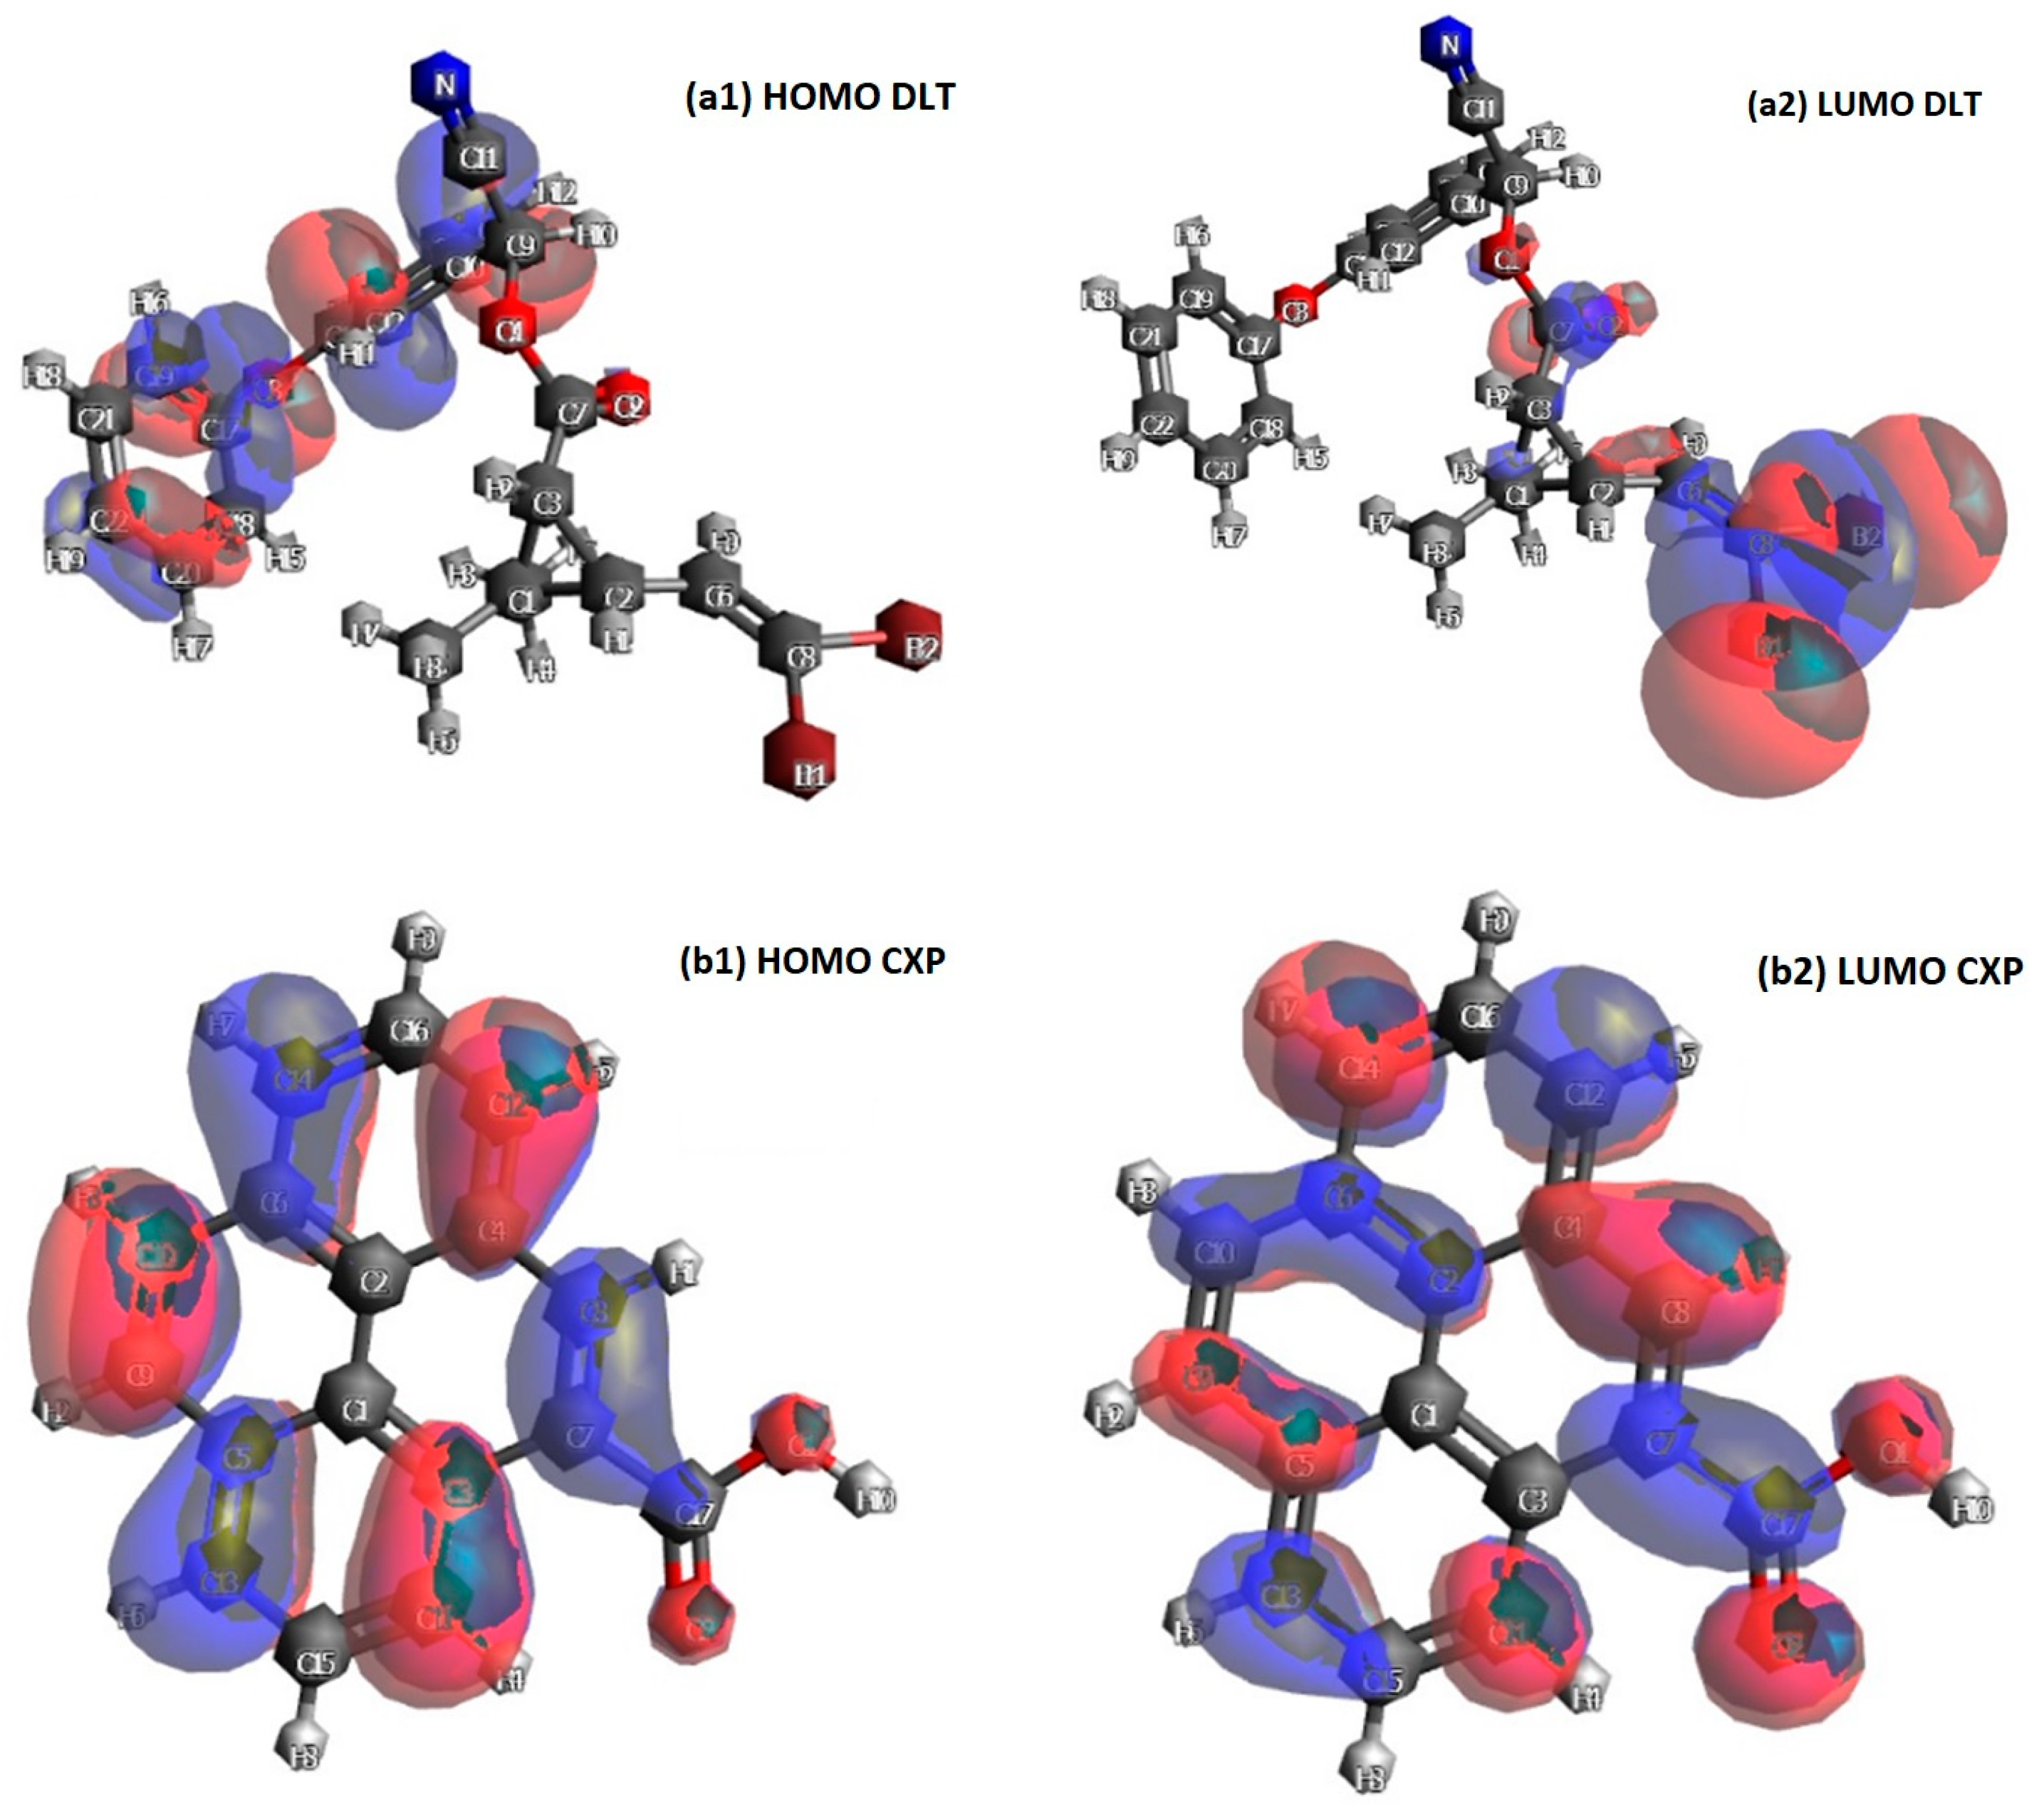
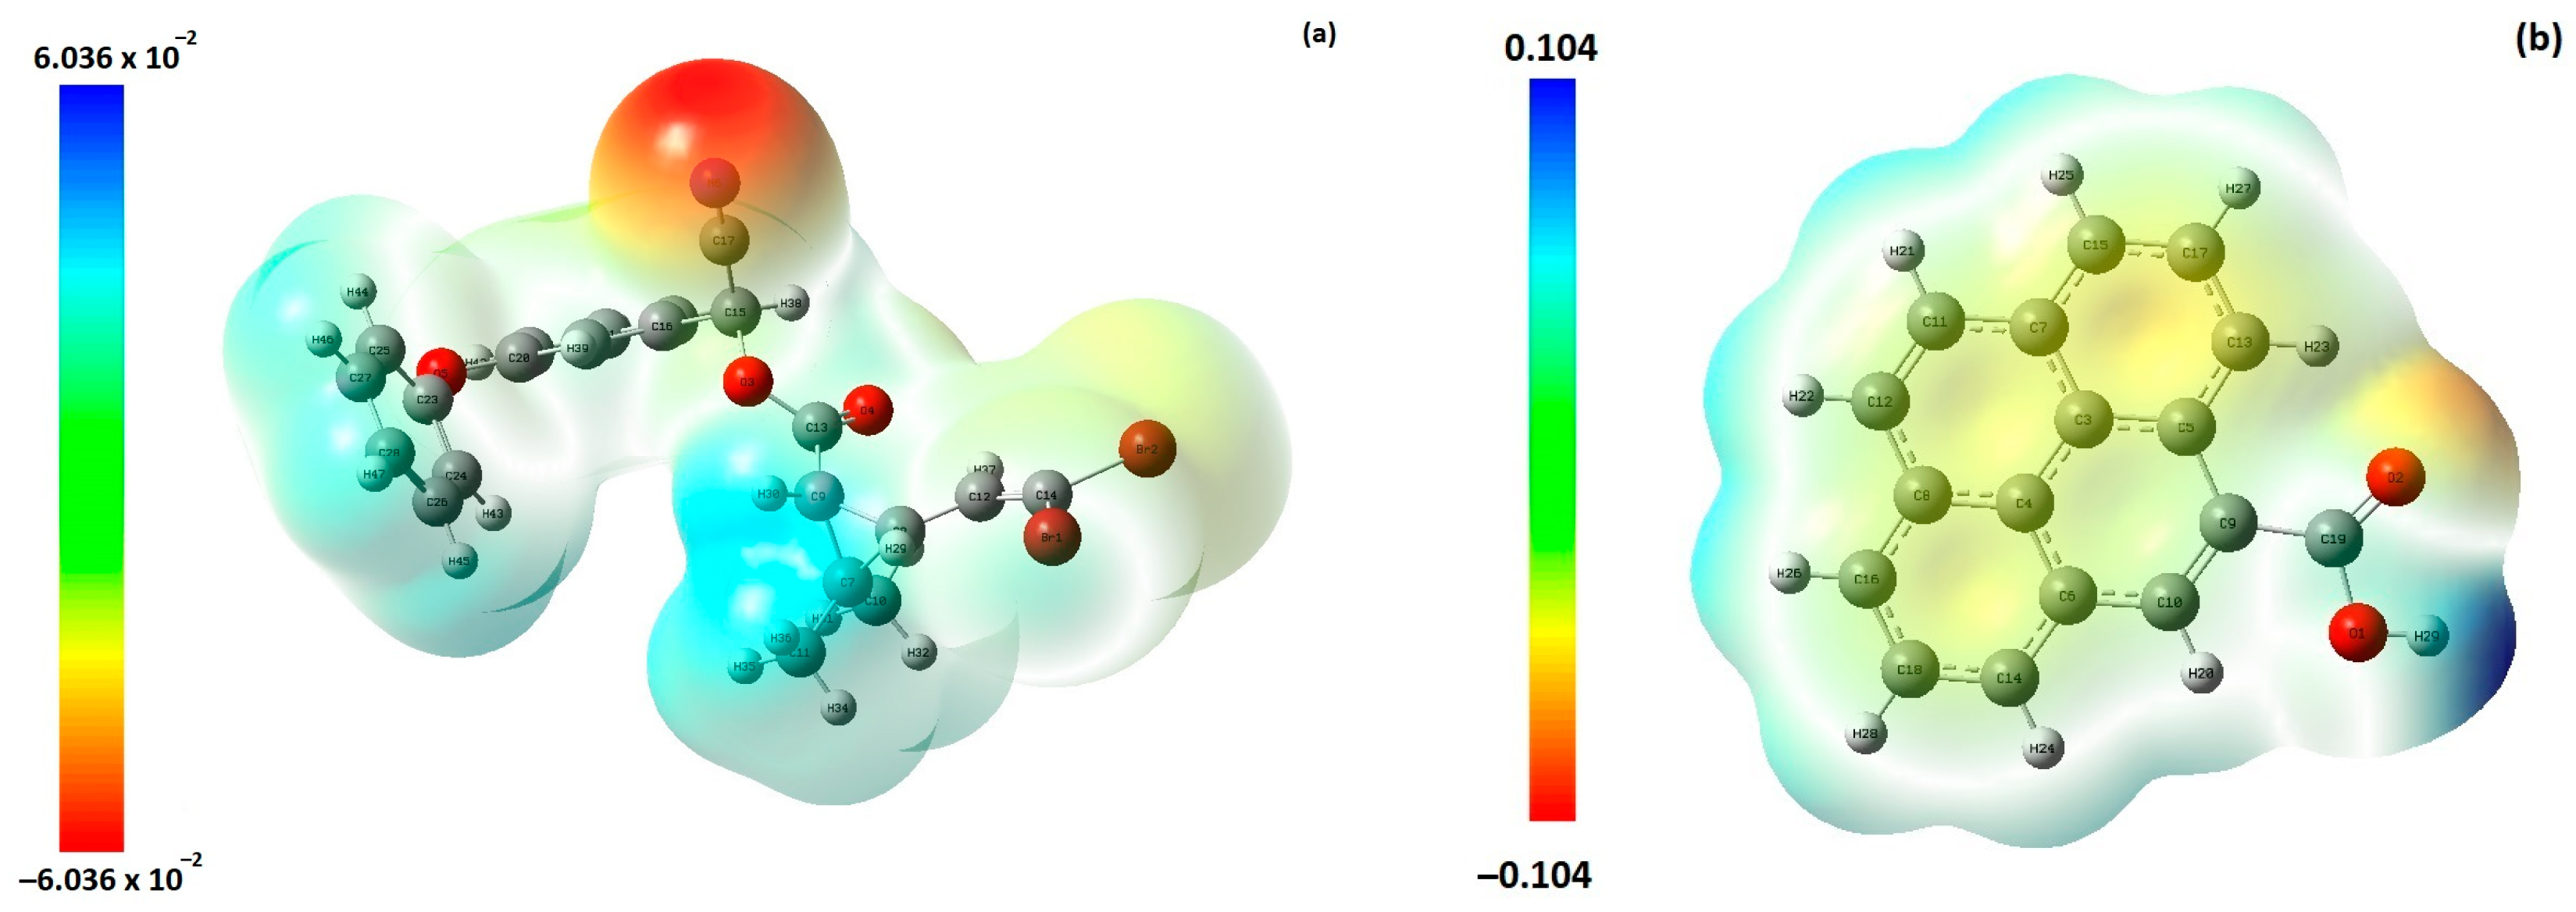
3.3. DFT and Retention Mechanism

To better understand the retention mechanism of DLT by the lab-prepared, activated carbon, we conducted DFT calculations on the adsorbate, adsorbent, and the adsorbate/adsorbent complex. Regarding the adsorbent, and based on a Boehm analysis, we chose to model our activated carbon with a pyrene molecule [79] functionalized with a carboxylic group, namely, carboxypyrene (CXP), which represents the major acidic functions of our adsorbent surface. The elucidation of adsorbate/adsorbent interactions was based on the evaluation of HOMO/LUMO energies of the optimized geometry (Figure 12).
HOMO represents the sites of high electron density, while LUMO represents sites of low electron density. Consequently, the HOMO/LUMO frontier orbitals determine the electron donor/acceptor character of the molecule. Thus, the higher the HOMO energy, the greater the molecule’s ability to donate electrons. Conversely, the lower the LUMO energy, the greater the molecule’s ability to accept electrons. Table 7 illustrates all of the energy calculation results of the studied structures at the B3LYP/6-31G(d,p) level of theory. Figure 12 shows the DLT’s optimized structure at a minimum energy level. The same energy values and structure are found by both the Gaussian and ORCA software.
The HOMO–LUMO GAP energy is related to the stability of molecules, with larger gap energies indicating greater stability. The dimer DLT–CXP GAP energy of 8.65 eV indicates that the complex was more stable than the adsorbate (DLT) 5.13 eV and adsorbent (CXP) 3.50 eV ones. This is the first way DFT confirms the adsorption of DLT–CXP.
The adsorbate/adsorbent frontier orbitals HOMO/LUMO are represented in Figure 13. The derived chemical descriptor values are displayed in Table 8.
The hardness of the dimer DLT–CXP, 4.32 eV, compared to the hardness of its constituents, 2.57 eV for DLT and 1.75 eV for CXP, also confirms the complex’s adsorbate/adsorbent stability and resistance to deformation. The decrease in the dimer energy is also confirmed by the lowest global electrophilicity index, 1.16 eV.
The Molecular Electrostatic Potential (MEP) can help to understand the retention mechanism. It is the electrostatic potential associated with the distribution of electrons and nuclear charges within a molecule. Typically, it is visualized by mapping its values onto the molecular surface using a color-coded scheme. The MEP calculation involves the optimization of molecular geometry, computation of electron density at various points surrounding the molecule, and subsequent determination of the interaction energy between a non-polarizing test charge at a specified point and the molecular charge distribution.
It serves as a condensed repository of information and a valuable tool for understanding the reactivity of molecules towards positively or negatively charged reactants.
The examination of DLT and CXP MEPs revealed excess electron densities around the nitrile group of DLT (red zone in Figure 14a) and a deficiency of the hydroxyl function of the carboxylic group of CXP (blue zone in Figure 14b). This behavior suggests a possible electrostatic interaction localized in those zones. On the other hand, the chemical potential of both DLT and CXP exhibited a high reactivity of both molecules. Their electronegativity, 4.01 and 4.04 eV, respectively, indicates their high reactivity. The reactivity of the dimer DLT–CXP is 3.16 eV, which shows relative stability compared to the reactivity of its constituents.
Based on the DFT calculation results presented in Table 9, the adsorption energy E a d s = 0.44 A . U (Equation (6)), and the standard free Gibbs energy G ads ° = 0.41   eV (Equation (7)). This is compatible, at a molecular scale, with a spontaneous exothermic chemisorption of DLT onto CPX, which is representative of the lab-prepared activated carbon.
Finally, according to the electronic energy stabilization process of the DLT–CXP complex (see animation: https://youtu.be/dLYqVwdQQxU), it appears that the retention of DLT by activated carbon occurs, in part, as follows: the labile hydrogen of the carboxylic acid functions on the surface of the adsorbent interacts electrostatically with the nitrile group of the DLT, which has a basic character. A hydrogen bond was established. This interaction was established by DFT and led to a complex adsorbent–adsorbate conformation of lower energy than each of its constituents.

4. Conclusions

This study describes the development of an unconventional activated carbon from agri-food waste PPS and is conceptualized within the framework of a circular economy.
Physico-chemical characterizations of the activated carbon derived from PPS were carried out. The obtained results are promising and affirm the great adsorption potential of the produced activated carbon. More importantly, the results show that the activated carbon has a microporous character, with a very high specific BET surface area (1161.31 m2 g−1). Moreover, the Boehm assay revealed that the synthesized activated carbon has functional groups that are predominantly acidic rather than basic, which is compatible with the obtained value of pHzc (2.5).
The kinetic models for the adsorption of deltamethrin with activated carbon were also studied. According to the obtained results, the pseudo-first-order model showed the best fit for the experimental data, with a high R2. The equilibrium data were fitted to the Langmuir and Freundlich isothermal models. By comparing the parameters obtained with each model, it can be deduced that the Langmuir model fits very well with the experimental data.
More importantly, the originality of this work lies in the use of DFT to understand the theoretical adsorption mechanism and evaluate its similarity with the experimental results. The results can only further affirm the reliability of this interesting method.

Author Contributions

Conceptualization, A.Z. and H.D.; methodology, H.D.; software, H.D.; validation, A.Z., M.S. and H.D.; formal analysis, A.Z.; investigation, M.S.; resources, H.D.; data curation, H.D.; writing—original draft preparation, M.S.; writing—review and editing, M.S.; visualization, A.Z.; supervision, H.D.; project administration, A.Z. All authors have read and agreed to the published version of the manuscript.

Funding

This research received no external funding.

Institutional Review Board Statement

Not applicable.

Informed Consent Statement

Not applicable.

Data Availability Statement

For privacy reasons, no publicly shared data are available.

Acknowledgments

The authors would like to thank the Tunisian Higher Education and Scientific Research Ministry for their financial support. They also thank Niklas Hedin from Stockholm University, Sweden for the BET and pore size distribution analyses and Sonia Dridi from the University of Monastir, Tunisia for the final review.

Conflicts of Interest

The authors declare no conflicts of interest.

References

  1. Singh, S.; Kumar, V.; Anil, A.G.; Kapoor, D.; Khasnabis, S.; Shekar, S.; Pavithra, N.; Samuel, J.; Subramanian, S.; Singh, J. Adsorption and detoxification of pharmaceutical compounds from wastewater using nanomaterials: A review on mechanism, kinetics, valorization and circular economy. J. Environ. Manag. 2021, 300, 113569. [Google Scholar] [CrossRef] [PubMed]
  2. Acevedo-García, V.; Rosales, E.; Puga, A.; Pazos, M.; Sanromán, M. Synthesis and use of efficient adsorbents under the principles of circular economy: Waste valorisation and electroadvanced oxidation process regeneration. Sep. Purif. Technol. 2020, 242, 116796. [Google Scholar] [CrossRef]
  3. Kasprzyk, M.; Czerwionka, K.; Gajewska, M. Waste materials assessment for phosphorus adsorption toward sustainable application in circular economy. Resour. Conserv. Recycl. 2021, 168, 105335. [Google Scholar] [CrossRef]
  4. Derylo-Marczewska, A.; Blachnio, M.; Marczewski, A.; Swiatkowski, A.; Tarasiuk, B. Adsorption of selected herbicides from aqueous solutions on activated carbon. J. Therm. Anal. Calorim. 2010, 101, 785–794. [Google Scholar] [CrossRef]
  5. Bartram, J. Water and Health in Europe: A Joint Report from the European Environment Agency and the WHO Regional Office for Europe; WHO Regional Office Europe: Copenhagen, Denmark, 2002. [Google Scholar]
  6. Akçay, G.; Akçay, M.; Yurdakoç, K. Removal of 2, 4-dichlorophenoxyacetic acid from aqueous solutions by partially characterized organophilic sepiolite: Thermodynamic and kinetic calculations. J. Colloid Interface Sci. 2005, 281, 27–32. [Google Scholar] [CrossRef]
  7. Rebich, R.; Coupe, R.; Thurman, E. Herbicide concentrations in the Mississippi River Basin—The importance of chloroacetanilide herbicide degradates. Sci. Total Environ. 2004, 321, 189–199. [Google Scholar] [CrossRef] [PubMed]
  8. Reigart, J.R.; Roberts, J.R. Pesticides in children. Pediatr. Clin. N. Am. 2001, 48, 1185–1198. [Google Scholar] [CrossRef]
  9. Salman, J.M.; Njoku, V.; Hameed, B.H. Adsorption of pesticides from aqueous solution onto banana stalk activated carbon. Chem. Eng. J. 2011, 174, 41–48. [Google Scholar] [CrossRef]
  10. Corsini, E.; Liesivuori, J.; Vergieva, T.; Van Loveren, H.; Colosio, C. Effects of pesticide exposure on the human immune system. Hum. Exp. Toxicol. 2008, 27, 671–680. [Google Scholar] [CrossRef]
  11. Dich, J.; Zahm, S.H.; Hanberg, A.; Adami, H.-O. Pesticides and cancer. Cancer Causes Control 1997, 8, 420–443. [Google Scholar] [CrossRef]
  12. Vallack, H.W.; Bakker, D.J.; Brandt, I.; Broström-Lundén, E.; Brouwer, A.; Bull, K.R.; Gough, C.; Guardans, R.; Holoubek, I.; Jansson, B. Controlling persistent organic pollutants–what next? Environ. Toxicol. Pharmacol. 1998, 6, 143–175. [Google Scholar] [CrossRef] [PubMed]
  13. Foo, K.; Hameed, B. Detoxification of pesticide waste via activated carbon adsorption process. J. Hazard. Mater. 2010, 175, 1–11. [Google Scholar] [CrossRef] [PubMed]
  14. Trostanetsky, A.; Quinn, E.; Rapaport, A.; Harush, A.; Gottlieb, D. Efficacy of deltamethrin emulsifiable concentrate against stored-product insects. J. Stored Prod. Res. 2023, 101, 102072. [Google Scholar] [CrossRef]
  15. Arthur, F.H.; Athanassiou, C.G.; Morrison, W.R., III. Mobility of stored product beetles after exposure to a combination insecticide containing deltamethrin, methoprene, and a piperonyl butoxide synergist depends on species, concentration, and exposure time. Insects 2020, 11, 151. [Google Scholar] [CrossRef] [PubMed]
  16. Jiang, Q.; Ao, S.; Ji, P.; Zhou, Y.; Tang, H.; Zhou, L.; Zhang, X. Assessment of deltamethrin toxicity in Macrobrachium nipponense based on histopathology, oxidative stress and immunity damage. Comp. Biochem. Physiol. Part C Toxicol. Pharmacol. 2021, 246, 109040. [Google Scholar] [CrossRef]
  17. Lu, Q.; Sun, Y.; Ares, I.; Anadón, A.; Martínez, M.; Martínez-Larrañaga, M.-R.; Yuan, Z.; Wang, X.; Martínez, M.-A. Deltamethrin toxicity: A review of oxidative stress and metabolism. Environ. Res. 2019, 170, 260–281. [Google Scholar] [CrossRef]
  18. Abdel-Daim, M.; El-Bialy, B.E.; Rahman, H.G.A.; Radi, A.M.; Hefny, H.A.; Hassan, A.M. Antagonistic effects of Spirulina platensis against sub-acute deltamethrin toxicity in mice: Biochemical and histopathological studies. Biomed. Pharmacother. 2016, 77, 79–85. [Google Scholar] [CrossRef]
  19. Yildirim, M.Z.; Benlı, A.Ç.K.; Selvı, M.; Özkul, A.; Erkoc, F.; Kocak, O. Acute toxicity, behavioral changes, and histopathological effects of deltamethrin on tissues (gills, liver, brain, spleen, kidney, muscle, skin) of Nile tilapia (Oreochromis niloticus L.) fingerlings. Environ. Toxicol. Int. J. 2006, 21, 614–620. [Google Scholar] [CrossRef]
  20. Martínez-Escudero, C.; Garrido, I.; Ros, C.; Flores, P.; Hellín, P.; Contreras, F.; Fenoll, J. Remediation of pesticides in commercial farm soils by solarization and ozonation techniques. J. Environ. Manag. 2023, 329, 117062. [Google Scholar] [CrossRef]
  21. de Almeida Lopes, T.S.; Hessler, R.; Bohner, C.; Junior, G.B.A.; de Sena, R.F. Pesticides removal from industrial wastewater by a membrane bioreactor and post-treatment with either activated carbon, reverse osmosis or ozonation. J. Environ. Chem. Eng. 2020, 8, 104538. [Google Scholar] [CrossRef]
  22. Vaya, D.; Surolia, P.K. Semiconductor based photocatalytic degradation of pesticides: An overview. Environ. Technol. Innov. 2020, 20, 101128. [Google Scholar] [CrossRef]
  23. Zhenlu, L.; Dengrong, S.; Changshui, W.; Bo, Y.; Bei, L.; Jingquan, H.; Shaohua, J.; Chunmei, Z.; Shuijian, H. Zeolitic imidazolate framework-67 and its derivatives for photocatalytic applications. Coord. Chem. Rev. 2024, 502, 215612. [Google Scholar]
  24. Malakootian, M.; Shahesmaeili, A.; Faraji, M.; Amiri, H.; Martinez, S.S. Advanced oxidation processes for the removal of organophosphorus pesticides in aqueous matrices: A systematic review and meta-analysis. Process Saf. Environ. Prot. 2020, 134, 292–307. [Google Scholar] [CrossRef]
  25. Bae, J.-Y.; Lee, D.-Y.; Oh, K.-Y.; Jeong, D.-K.; Lee, D.-Y.; Kim, J.-H. Photochemical advanced oxidative process treatment effect on the pesticide residues reduction and quality changes in dried red peppers. Sci. Rep. 2023, 13, 4444. [Google Scholar] [CrossRef]
  26. Moradi, M.; Elahinia, A.; Vasseghian, Y.; Dragoi, E.-N.; Omidi, F.; Khaneghah, A.M. A review on pollutants removal by Sono-photo-Fenton processes. J. Environ. Chem. Eng. 2020, 8, 104330. [Google Scholar] [CrossRef]
  27. Brillas, E. Fenton, photo-Fenton, electro-Fenton, and their combined treatments for the removal of insecticides from waters and soils. A review. Sep. Purif. Technol. 2022, 284, 120290. [Google Scholar] [CrossRef]
  28. Shawaqfeh, A.T. Removal of pesticides from water using anaerobic-aerobic biological treatment. Chin. J. Chem. Eng. 2010, 18, 672–680. [Google Scholar] [CrossRef]
  29. Marczewski, A.W.; Seczkowska, M.; Deryło-Marczewska, A.; Blachnio, M. Adsorption equilibrium and kinetics of selected phenoxyacid pesticides on activated carbon: Effect of temperature. Adsorption 2016, 22, 777–790. [Google Scholar] [CrossRef]
  30. Ma, H.; Zhang, X.-F.; Wang, Z.; Song, L.; Yao, J. Flexible cellulose foams with a high loading of attapulgite nanorods for Cu2+ ions removal. Colloids Surf. A Physicochem. Eng. Asp. 2021, 612, 126038. [Google Scholar] [CrossRef]
  31. Lu, T.; Cao, W.; Liang, H.; Deng, Y.; Zhang, Y.; Zhu, M.; Ma, W.; Xiong, R.; Huang, C. Blow-Spun nanofibrous membrane for simultaneous treatment of emulsified oil/water mixtures, dyes, and bacteria. Langmuir 2022, 38, 15729–15739. [Google Scholar] [CrossRef]
  32. Wang, S.-L.; Tzou, Y.-M.; Lu, Y.-H.; Sheng, G. Removal of 3-chlorophenol from water using rice-straw-based carbon. J. Hazard. Mater. 2007, 147, 313–318. [Google Scholar] [CrossRef] [PubMed]
  33. Baccar, R.; Blánquez, P.; Bouzid, J.; Feki, M.; Sarrà, M. Equilibrium, thermodynamic and kinetic studies on adsorption of commercial dye by activated carbon derived from olive-waste cakes. Chem. Eng. J. 2010, 165, 457–464. [Google Scholar] [CrossRef]
  34. Janković, B.; Manić, N.; Dodevski, V.; Radović, I.; Pijović, M.; Katnić, Đ.; Tasić, G. Physico-chemical characterization of carbonized apricot kernel shell as precursor for activated carbon preparation in clean technology utilization. J. Clean. Prod. 2019, 236, 117614. [Google Scholar] [CrossRef]
  35. Djilani, C.; Zaghdoudi, R.; Djazi, F.; Bouchekima, B.; Lallam, A.; Modarressi, A.; Rogalski, M. Adsorption of dyes on activated carbon prepared from apricot stones and commercial activated carbon. J. Taiwan Inst. Chem. Eng. 2015, 53, 112–121. [Google Scholar] [CrossRef]
  36. de Yuso, A.M.; Rubio, B.; Izquierdo, M.T. Influence of activation atmosphere used in the chemical activation of almond shell on the characteristics and adsorption performance of activated carbons. Fuel Process. Technol. 2014, 119, 74–80. [Google Scholar] [CrossRef]
  37. Dolas, H.; Sahin, O.; Saka, C.; Demir, H. A new method on producing high surface area activated carbon: The effect of salt on the surface area and the pore size distribution of activated carbon prepared from pistachio shell. Chem. Eng. J. 2011, 166, 191–197. [Google Scholar] [CrossRef]
  38. Yang, J.; Qiu, K. Preparation of activated carbons from walnut shells via vacuum chemical activation and their application for methylene blue removal. Chem. Eng. J. 2010, 165, 209–217. [Google Scholar] [CrossRef]
  39. Alothaid, H. Evaluation of cytotoxicity, oxidative stress and organ-specific effects of activated carbon from Al-Baha date palm kernels. Saudi J. Biol. Sci. 2022, 29, 103387. [Google Scholar] [CrossRef]
  40. Ahmad, M.A.; Alrozi, R. Optimization of rambutan peel based activated carbon preparation conditions for Remazol Brilliant Blue R removal. Chem. Eng. J. 2011, 168, 280–285. [Google Scholar] [CrossRef]
  41. Ahmad, M.A.; Alrozi, R. Optimization of preparation conditions for mangosteen peel-based activated carbons for the removal of Remazol Brilliant Blue R using response surface methodology. Chem. Eng. J. 2010, 165, 883–890. [Google Scholar] [CrossRef]
  42. Sun, Y.; Webley, P.A. Preparation of activated carbons from corncob with large specific surface area by a variety of chemical activators and their application in gas storage. Chem. Eng. J. 2010, 162, 883–892. [Google Scholar] [CrossRef]
  43. Bourahla, S.; Nemchi, F.; Belayachi, H.; Belayachi, A.; Harrats, C.; Belhakem, M. Removal of the AO7 dye by adsorption on activated carbon based on grape marc: Equilibrium, regeneration, and FTIR spectroscopy. J. Iran. Chem. Soc. 2023, 20, 669–681. [Google Scholar] [CrossRef]
  44. Wongvitvichot, W.; Thitiprasert, S.; Thongchul, N.; Chaisuwan, T. Metal ion removal using a low-cost coconut shell activated carbon bioadsorbent in the recovery of lactic acid from the fermentation broth. Bioresour. Bioprocess. 2023, 10, 58. [Google Scholar] [CrossRef]
  45. Garg, D.; Kumar, S.; Sharma, K.; Majumder, C. Application of waste peanut shells to form activated carbon and its utilization for the removal of Acid Yellow 36 from wastewater. Groundw. Sustain. Dev. 2019, 8, 512–519. [Google Scholar] [CrossRef]
  46. Du, M.; Zhang, Y.; Wang, Z.; Lv, M.; Xu, Q.; Chen, Z.; Wen, Q.; Li, A. La-doped activated carbon as high-efficiency phosphorus adsorbent: DFT exploration of the adsorption mechanism. Sep. Purif. Technol. 2022, 298, 121585. [Google Scholar] [CrossRef]
  47. Zhou, X.-Y.; Zhou, J.-L.; Guo, R.; Liu, Y.-j.; Yu, Y.-f.; Zhang, B.; Wu, Y.-W.; Zhao, L.; Lu, Q. Effect of flue gas components on the removal of cadmium pollutants by transition metal-modified activated carbon: Density functional theory and thermodynamic study. Fuel 2023, 343, 128011. [Google Scholar] [CrossRef]
  48. Rong, S.; Zhang, L.; Yue, Z.; Song, Z.; Tang, W.; Zhu, X.; Wang, T.; Zhou, X.; Cheng, S.; Xia, X. Directional introduction of pyridine nitrogen functional groups in activated carbon catalysts for the catalytic production of hydrogen: An experimental and DFT calculation. Chem. Eng. J. 2023, 453, 139744. [Google Scholar] [CrossRef]
  49. Naboulsi, A.; El Himri, M.; El Haddad, M. Adsorption mechanism of a pesticide/herbicide mixture on a new eco-friendly activated carbon of Ritama-Monosperma (L.) Boiss used DFT/B3LYP. Biomass Convers. Biorefinery 2023, 13, 13715–13728. [Google Scholar] [CrossRef]
  50. Kan, Y.; Zhang, R.; Xu, X.; Wei, B.; Shang, Y. Comparative study of raw and HNO3-modified porous carbon from waste printed circuit boards for sulfadiazine adsorption: Experiment and DFT study. Chin. Chem. Lett. 2023, 34, 108272. [Google Scholar] [CrossRef]
  51. Zhao, H.; Tang, Z.; He, M.; Yang, X.; Lai, S.; An, K.; Han, S.; Qu, Z.; Zhou, W.; Wang, Z. Effect of oxygen functional groups on competitive adsorption of benzene and water on carbon materials: Density functional theory study. Sci. Total Environ. 2023, 863, 160772. [Google Scholar] [CrossRef]
  52. Liu, H.; Zhang, J.; Zhang, C.; Bao, N.; Cheng, C. Activated carbons with well-developed microporosity and high surface acidity prepared from lotus stalks by organophosphorus compounds activations. Carbon 2013, 60, 289–291. [Google Scholar] [CrossRef]
  53. Kumar, A.; Jena, H.M. Preparation and characterization of high surface area activated carbon from Fox nut (Euryale ferox) shell by chemical activation with H3PO4. Results Phys. 2016, 6, 651–658. [Google Scholar] [CrossRef]
  54. Deng, W.-N.; Li, Y.-H.; Xu, D.-F.; Zhou, W.; Xiang, K.-X.; Chen, H. Three-dimensional hierarchically porous nitrogen-doped carbon from water hyacinth as selenium host for high-performance lithium–selenium batteries. Rare Met. 2022, 41, 3432–3445. [Google Scholar] [CrossRef]
  55. Zeng, G.; Wang, Y.; Lou, X.; Chen, H.; Jiang, S.; Zhou, W. Vanadium oxide/carbonized chestnut needle composites as cathode materials for advanced aqueous zinc-ion batteries. J. Energy Storage 2024, 77, 109859. [Google Scholar] [CrossRef]
  56. Raut, E.R.; Bedmohata, M.A.; Chaudhari, A.R. Study of synthesis and characterization of raw bagasse, its char and activated carbon prepared using chemical additive. Water Sci. Technol. 2023, 87, 2233–2249. [Google Scholar] [CrossRef] [PubMed]
  57. Du, C.; Liu, B.; Hu, J.; Li, H. Determination of iodine number of activated carbon by the method of ultraviolet–visible spectroscopy. Mater. Lett. 2021, 285, 129137. [Google Scholar] [CrossRef]
  58. Shrestha, R.M. Effect of preparation parameters on methylene blue number of activated carbons prepared from a locally available material. J. Inst. Eng. 2016, 12, 169–174. [Google Scholar] [CrossRef]
  59. Goertzen, S.L.; Thériault, K.D.; Oickle, A.M.; Tarasuk, A.C.; Andreas, H.A. Standardization of the Boehm titration. Part I. CO2 expulsion and endpoint determination. Carbon 2010, 48, 1252–1261. [Google Scholar] [CrossRef]
  60. Boehm, H.P. Surface oxides on carbon and their analysis: A critical assessment. Carbon 2002, 40, 145–149. [Google Scholar] [CrossRef]
  61. Noh, J.S.; Schwarz, J.A. Effect of HNO3 treatment on the surface acidity of activated carbons. Carbon 1990, 28, 675–682. [Google Scholar] [CrossRef]
  62. Yağmur, H.K.; Kaya, İ. Synthesis and characterization of magnetic ZnCl2-activated carbon produced from coconut shell for the adsorption of methylene blue. J. Mol. Struct. 2021, 1232, 130071. [Google Scholar] [CrossRef]
  63. de Vargas Brião, G.; da Silva, M.G.C.; Vieira, M.G.A.; Chu, K.H. Correlation of type II adsorption isotherms of water contaminants using modified BET equations. Colloid Interface Sci. Commun. 2022, 46, 100557. [Google Scholar] [CrossRef]
  64. Dehmani, Y.; Lamhasni, T.; Mohsine, A.; Tahri, Y.; Lee, H.-s.; Lgaz, H.; Alrashdi, A.A.; Abouarnadasse, S. Adsorption removal of phenol by oak wood charcoal activated carbon. Biomass Convers. Biorefinery 2022, 1–13. [Google Scholar] [CrossRef]
  65. Cortés, J.-C.; Navarro-Quiles, A.; Santonja, F.-J.; Sferle, S.-M. Statistical analysis of randomized pseudo-first/second order kinetic models. Application to study the adsorption on cadmium ions onto tree fern. Chemom. Intell. Lab. Syst. 2023, 240, 104910. [Google Scholar] [CrossRef]
  66. Karunarathne, H.; Amarasinghe, B. Fixed bed adsorption column studies for the removal of aqueous phenol from activated carbon prepared from sugarcane bagasse. Energy Procedia 2013, 34, 83–90. [Google Scholar] [CrossRef]
  67. Gholamiyan, S.; Hamzehloo, M.; Farrokhnia, A. RSM optimized adsorptive removal of erythromycin using magnetic activated carbon: Adsorption isotherm, kinetic modeling and thermodynamic studies. Sustain. Chem. Pharm. 2020, 17, 100309. [Google Scholar] [CrossRef]
  68. Liu, Y.; Liu, X.; Dong, W.; Zhang, L.; Kong, Q.; Wang, W. Efficient adsorption of sulfamethazine onto modified activated carbon: A plausible adsorption mechanism. Sci. Rep. 2017, 7, 12437. [Google Scholar] [CrossRef]
  69. Shaker, M.A. Dynamics and thermodynamics of toxic metals adsorption onto soil-extracted humic acid. Chemosphere 2014, 111, 587–595. [Google Scholar] [CrossRef]
  70. Puziy, A.; Poddubnaya, O.; Socha, R.; Gurgul, J.; Wisniewski, M. XPS and NMR studies of phosphoric acid activated carbons. Carbon 2008, 46, 2113–2123. [Google Scholar] [CrossRef]
  71. Puziy, A.M.; Poddubnaya, O.I.; Martínez-Alonso, A.; Castro-Muñiz, A.; Suárez-García, F.; Tascón, J.M. Oxygen and phosphorus enriched carbons from lignocellulosic material. Carbon 2007, 45, 1941–1950. [Google Scholar] [CrossRef]
  72. Coates, J. Interpretation of Infrared Spectra, A Practical Approach. In Encyclopedia of Analytical Chemistry; John Wiley & Sons: Hoboken, NJ, USA, 2006. [Google Scholar]
  73. Mbarki, F.; Selmi, T.; Kesraoui, A.; Seffen, M. Low-cost activated carbon preparation from Corn stigmata fibers chemically activated using H3PO4, ZnCl2 and KOH: Study of methylene blue adsorption, stochastic isotherm and fractal kinetic. Ind. Crops Prod. 2022, 178, 114546. [Google Scholar] [CrossRef]
  74. Rodrigues, A.E.; Silva, C.M. What’s wrong with Lagergreen pseudo first order model for adsorption kinetics? Chem. Eng. J. 2016, 306, 1138–1142. [Google Scholar] [CrossRef]
  75. Bujdák, J. Adsorption kinetics models in clay systems. The critical analysis of pseudo-second order mechanism. Appl. Clay Sci. 2020, 191, 105630. [Google Scholar] [CrossRef]
  76. Langmuir, I. The constitution and fundamental properties of solids and liquids. Part I. Solids. J. Am. Chem. Soc. 1916, 38, 2221–2295. [Google Scholar] [CrossRef]
  77. Tseng, R.-L.; Wu, F.-C. Inferring the favorable adsorption level and the concurrent multi-stage process with the Freundlich constant. J. Hazard. Mater. 2008, 155, 277–287. [Google Scholar] [CrossRef]
  78. Sellaoui, L.; Yazidi, A.; Taamalli, S.; Bonilla-Petriciolet, A.; Louis, F.; El Bakali, A.; Badawi, M.; Lima, E.C.; Lima, D.R.; Chen, Z. Adsorption of 3-aminophenol and resorcinol on avocado seed activated carbon: Mathematical modelling, thermodynamic study and description of adsorbent performance. J. Mol. Liq. 2021, 342, 116952. [Google Scholar] [CrossRef]
  79. Supong, A.; Bhomick, P.C.; Baruah, M.; Pongener, C.; Sinha, U.B.; Sinha, D. Adsorptive removal of Bisphenol A by biomass activated carbon and insights into the adsorption mechanism through density functional theory calculations. Sustain. Chem. Pharm. 2019, 13, 100159. [Google Scholar] [CrossRef]
Figure 1. Chemical structure of deltamethrin.
Sustainability 16 00406 g001
Figure 2. FTIR-ATR spectra of the prepared AC before and after DLT adsorption.
Sustainability 16 00406 g002
Figure 3. pHZC of activated carbon.
Sustainability 16 00406 g003
Figure 4. (a) BJH pore size distribution for the activated carbon. (b) Nitrogen adsorption–desorption isotherm.
Sustainability 16 00406 g004
Figure 5. Scanning electron microscopy (SEM) analysis of activated carbon.
Sustainability 16 00406 g005
Figure 6. Mass (g) effect on pesticide removal rate (%).
Sustainability 16 00406 g006
Figure 7. Contact time effect on pesticide removal rate (%).
Sustainability 16 00406 g007
Figure 8. DLT AC adsorption kinetic curves.
Sustainability 16 00406 g008
Figure 9. DLT AC adsorption kinetics modelization (C0(DLT): 2–15 mg L−1).
Sustainability 16 00406 g009aSustainability 16 00406 g009b
Figure 10. The adsorption isotherm models.
Sustainability 16 00406 g010
Figure 11. (a) Temperature effect. (b) Parameters of the thermodynamic equilibrium study.
Sustainability 16 00406 g011
Figure 12. Structure of DLT optimized geometry (minimum energy).
Sustainability 16 00406 g012
Figure 13. Frontier molecular orbitals of (a) DLT and (b) CXP.
Sustainability 16 00406 g013
Figure 14. MEP of (a) DLT and (b) CXP (e/au3 scale).
Sustainability 16 00406 g014
Table 1. Models of adsorption kinetics and isotherms.
Adsorption ModelsUsed ModelsModeling Equation
KineticsPseudo-first-order q t = q e × 1 e K 1 t
Pseudo-second-order q t = K 2 t q e 2 1 + K 2 t q e
IsothermsLangmuir q e = q m a x K L C e 1 + K L C e
Freundlich q e = K F C e 1 / n
Where qe, qt, and qmax are the quantities of pesticides adsorbed (mg g−1), respectively, at equilibrium time, time (t), and maximum quantity of the species fixed. K1 (min−1) is the constant rate for first-order kinetics, K2 (g mg−1 min−1) is the adsorption rate constant, Ce is the residual concentration at equilibrium (mg L−1), KL is the Langmuir constant (L mg−1), KF is the Freundlich constant (mg1−1/n L1/n g−1), and 1/n is the adsorption intensity.
Table 2. Amounts of acidic–basic functional groups of activated carbon.
AdsorbentAcidity Functions (meq g−1)Basicity
Activated carbonCarboxylicLactonicPhenolicTotalTotal
0.6880.1280.080.8960.160
Table 3. Elemental composition analysis of activated carbon.
CompoundCOMgAlSiPKCaNaFe
Weight of compound (%)80.7715.770.040.050.153.540.030.230.020.06
Table 4. PFO and PSO kinetic model parameters of DLT AC adsorption.
C (mgL−1)Pseudo-First-OrderPseudo-Second-Order
qe (mg g−1)K1 (min−1)R2qe (mg g−1)K2 (g mg−1 min−1)R2
20.0890.0910.990.0951.580.99
40.170.0780.970.190.630.97
60.270.0390.950.310.140.91
80.360.0380.970.400.110.95
100.440.0450.950.50.110.93
120.550.0280.970.640.050.94
150.640.0570.990.700.110.99
Table 5. Parameters of isotherm of deltamethrin adsorption.
ModelsParameters of IsothermR2
Langmuirqmax (mg g−1)1.130.942
KL (L mg−1)0.676
Freundlich1/n0.6390.926
KF (mg1−1/n L1/n g−1)0.437
n1.56
Table 6. The thermodynamic parameters.
Temperature (K)ΔG° (kJ mol−1)ΔH° (kJ mol−1)ΔS° (kJ mol−1 K−1)
303−29.8987.920.389
313−33.7
323−37.66
Table 7. HOMO, LUMO, and GAP energies of DLT, CXP, and DLT–CXP complex.
CompoundHOMO (eV)LUMO (eV)GAP (eV)
Deltamethrin−6.57−1.445.13
Carboxypyrene−5.79−2.303.50
Deltamethrin–Carboxypyrene−7.481.168.65
Table 8. Chemical descriptors of DLT, CXP, and DLT–CXP complex.
Compoundµ (eV)µ (eV)µ (eV)
Deltamethrin−4.012.573.13
Carboxypyrene−4.041.754.68
Deltamethrin–Carboxypyrene−3.164.321.16
Table 9. Energy and Gibbs free energy of DLT, CXP, and DLT–CXP complex.
CompoundH (A.U.)G (A.U.)
Deltamethrin−6277.069−6277.154
Carboxypyrene−803.693−803.746
Deltamethrin–Carboxypyrene−7081.2048−7081.3127
Disclaimer/Publisher’s Note: The statements, opinions and data contained in all publications are solely those of the individual author(s) and contributor(s) and not of MDPI and/or the editor(s). MDPI and/or the editor(s) disclaim responsibility for any injury to people or property resulting from any ideas, methods, instructions or products referred to in the content.

