Abstract
Understanding and quantifying the compounding effects of climate change, displacement and socio-vulnerability is crucial for the development and implementation of timely mitigation and adaptation policies. Here, we present a new Climate Displacement and Socio-Vulnerability (CDSV) score over NYC that accounts for several climate hazards (coastal and riverine flooding, heatwaves, hurricanes and winter weather), displacement and social vulnerability metrics with the ultimate goal of identifying those areas where risk of the combination of the three factors is the highest (e.g., hotspots due to compounding effects). To our knowledge, this is the first time that multiple climate hazards have been studied in conjunction with displacement and socio-vulnerability for NYC. We discuss those areas that are exposed to high CDSV values for the different hazards, where multiple hazards show overlapping high values of CDSV and analyze how socio-demographic characteristics have changed over the past two decades. We find that Black and Latin/Hispanic people are exposed to the compounding effects of multiple hazards, especially in areas located in the south Bronx, south Brooklyn and Queens, with maximum CDSV scores reaching values close to ~80 over a scale of 100, and with the increased exposure of Black, Latinx/Hispanix and Asians since the beginning of the century. We find that, except for the case of coastal flooding, the percentage of White people living in areas characterized by CDSV values decreases as CDSV scores increase where the percentage of Black people and Latin/Hispanic people increases, with the latter showing the strongest correlation. We also find a statistically significant relationship between the number of people with asthma and diabetes and the CDSV score in the case of heatwaves.
1. Introduction
Understanding and quantifying the compounding effects of climate change, displacement and social vulnerability is crucial for the development and implementation of timely mitigation and adaptation policies [1,2,3,4]. Climate displacement has been characterized and defined in a variety of ways (e.g., [5,6,7]). Specifically, climate displacement can be defined as forced migration occurring entirely or partially from environmental events or the result of long-term changes in living patterns related to climate change. Connecting displacement and climate or environmental hazards is not a trivial task due to a multitude of environmental and climatic influences that impact the ability to stay in one place [8], the relatively coarse spatial and temporal resolution of currently available displacement datasets [9] and the fact that current assessment models fail to capture the interaction between the socio-economic and climate systems [10].
A popular method for characterizing the relationship between climate and socio-vulnerability consists of the creation of vulnerability indices e.g., [11,12], which attempt to integrate the effects of a combination of multiple factors into a numerical value (e.g., [13,14,15]). For example, Balica et al. [15] developed a Coastal City Flood Vulnerability Index (CCFVI) based on exposure, susceptibility and resilience to coastal flooding and applied it to nine cities around the world, each with different kinds of exposure. Through this index, the authors demonstrated which cities are most vulnerable to coastal flooding with regard to the different system’s components. Additionally, Johnson et al. [16] focused on the development of an extreme heat vulnerability index (EHVI), a fused dataset consisting of census data and remotely sensed variables, which were examined in relation to geocoded mortality data. Moreover, Reckien [17] investigated the use of additive and other techniques on social vulnerability indices calculated for New York City with weighting of the elements of the additive terms based on scientific assessment reports on climate change impacts in New York City.
In this study, we focus on New York City (NYC), motivated in large part by the authors’ work on the Equity Workgroup of the New York City Panel on Climate (NPCC) change. The NPCC is an independent advisory body required by a New York City law to regularly update climate change scenarios and information on climate change impacts in the City. https://climate.cityofnewyork.us/initiatives/nyc-panel-on-climate-change-npcc/ (accessed on 13 December 2023) The NPCC Equity Workgroup undertook this study to enable the City to assess the risk of climate displacement at an appropriate scale, and to determine whether new climate-resilient infrastructure or investments might create or aggravate that risk. The hope is that the City, once this risk is identified at neighborhood level, can take steps to mitigate displacement of socially vulnerable populations.
For this study, we adopt the City’s definition of displacement as the “involuntary movement of an individual or family from their home or neighborhood, whether as the result of eviction, unaffordable housing costs, or poor-quality housing”, as proposed by the New York City (NYC) Department of City Planning, Housing Preservation & Development (https://equitableexplorer.planning.nyc.gov/methods (accessed on 13 December 2023)). As detailed as this definition is, it does not include displacement or gentrification effects resulting from climate change, whether direct or indirect [4,13], nor does it include bluelining [18] or the adverse health effects associated with climate hazards, such as in the case of heatwaves [19].
Building on recent effort of the New York City Panel on Climate Change (NPCC, https://climate.cityofnewyork.us/initiatives/nyc-panel-on-climate-change-npcc/ (accessed on 13 December 2023)) and to support such an effort, we developed a methodology for developing a Climate Displacement and Socio-Vulnerability (CDSV) score over NYC that accounts for climate hazards, displacement risk and social vulnerability metrics based on publicly available datasets. The score combines different data sources that include climate, displacement and socio-economic indices with the ultimate goal of identifying those areas at highest risk from the combination of the three above-mentioned factors (e.g., hotspots due to compounding effects). To our knowledge, this is the first time that multiple climate hazards have been studied in conjunction with displacement risk and socio-vulnerability variables for NYC. Indeed, the existing literature generally focuses on climate and socio-vulnerability for developing climate vulnerability indices. Displacement is rarely accounted for in these indices. We discuss results concerning those areas where computed CDSV values are the highest for different hazards and where multiple hazards show overlapping high values (e.g., compounding effects). We also analyze how socio-demographic characteristics have changed over these areas for the past two decades and discuss linkages between the CDSV score and racial/ethnic and health indicators.
2. Materials and Methods
The CDSV score is based on three dimensions of risk: climate, displacement and socio-vulnerability. Here we introduce the datasets used to build the CDSV score and the methods used for its computation.
2.1. The FEMA National Risk Index (NRI)
The climate dimension is constituted by the Federal Emergency Management Agency (FEMA) National Risk Index (NRI) dataset, part of a recently developed methodology and procedure to identify communities most at-risk to different hazards (https://hazards.fema.gov/nri/ (accessed on 13 December 2023)). Of the 18 natural hazards, we consider the following for the NYC region and for this specific study: (1) Coastal and (2) Riverine Flooding; (3) Heatwaves; (4) Hurricanes and (5) Winter Weather (consisting of winter storm events in which the main types of precipitation are snow, sleet, or freezing rain) at census tract level. We selected these hazards because they have been previously identified as priority climate hazards for the City (https://www.nyc.gov/assets/doh/downloads/pdf/environmental/climate-health-profile-report.pdf (accessed on 13 December 2023)). We anticipate extending our analysis to other hazards in the close future. For computing the CDSV score, we convert the five FEMA NRI rankings of Very Low, Relatively Low, Intermediate, Relatively High and Very High (Figure 1) for the different hazards into numerical values according to the following correspondence: Very Low = 0; Relatively Low = 25; Intermediate = 50; Relatively High = 75 and Very High = 100. We name these values overall as the Climate Score (ClimSc).
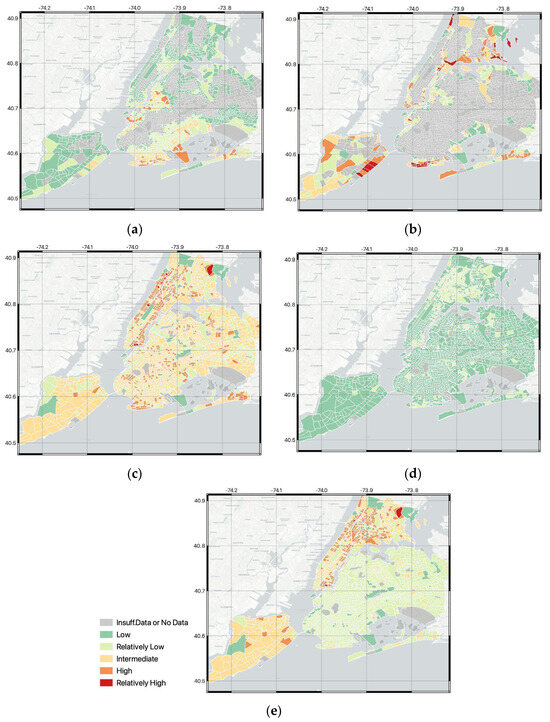
Figure 1.
Risk ranking from the FEMA NRI dataset over NYC for the (a) coastal flooding, (b) riverine flooding, (c) heatwaves, (d) hurricanes and (e) winter weather. Very Low = 0; Relatively Low = 25; Moderately Intermediate = 50; Relatively High = 75; Very High = 100. We name this the Displacement Score (DispSc).
2.2. The New York City Displacement Dataset
The Displacement dimension is obtained from the NYC Department of City Planning’s Displacement Risk Index. This index combines population vulnerability (race/ethnicity, income and the share of a household’s income spent on rent); housing conditions (such as the condition of the housing stock); and market pressure (the conditions that make it harder for lower-income residents to remain or find new housing in the area). More information on the complete set of variables and the methodology used can be found at https://equitableexplorer.planning.nyc.gov/methods (accessed on 13 December 2023). The data exists at the Public Use Microdata Area (PUMA, https://www.census.gov/programs-surveys/geography/guidance/geo-areas/pumas.html (accessed on 13 December 2023)) scale, which generally approximates Community Districts, of which there are 59 in NYC. However, the Displacement Risk index is generated at a smaller geography, Neighborhood Tabulation Areas (NTA, https://data.cityofnewyork.us/City-Government/NTA-map/d3qk-pfyz (accessed on 13 December 2023)). The risk data is then spatially co-registered with the FEMA NRI at census tract level using the correspondence between NTAs and census tracts (Figure 2a). As in the case of FEMA NRI, we convert the displacement risk categories into numerical values using the following correspondence: Very Low = 0; Relatively Low = 25; Intermediate = 50; Relatively High = 75 and Very High = 100. We name these values overall as the Displacement Score (DispSc).

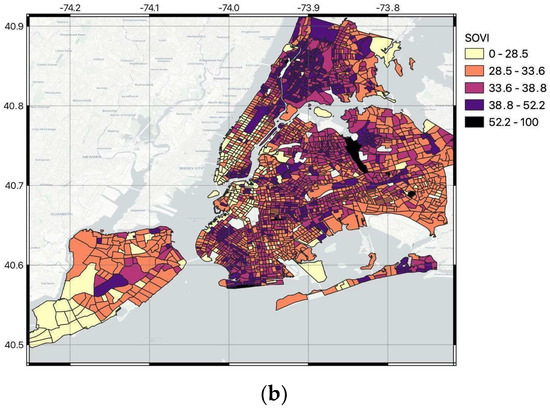
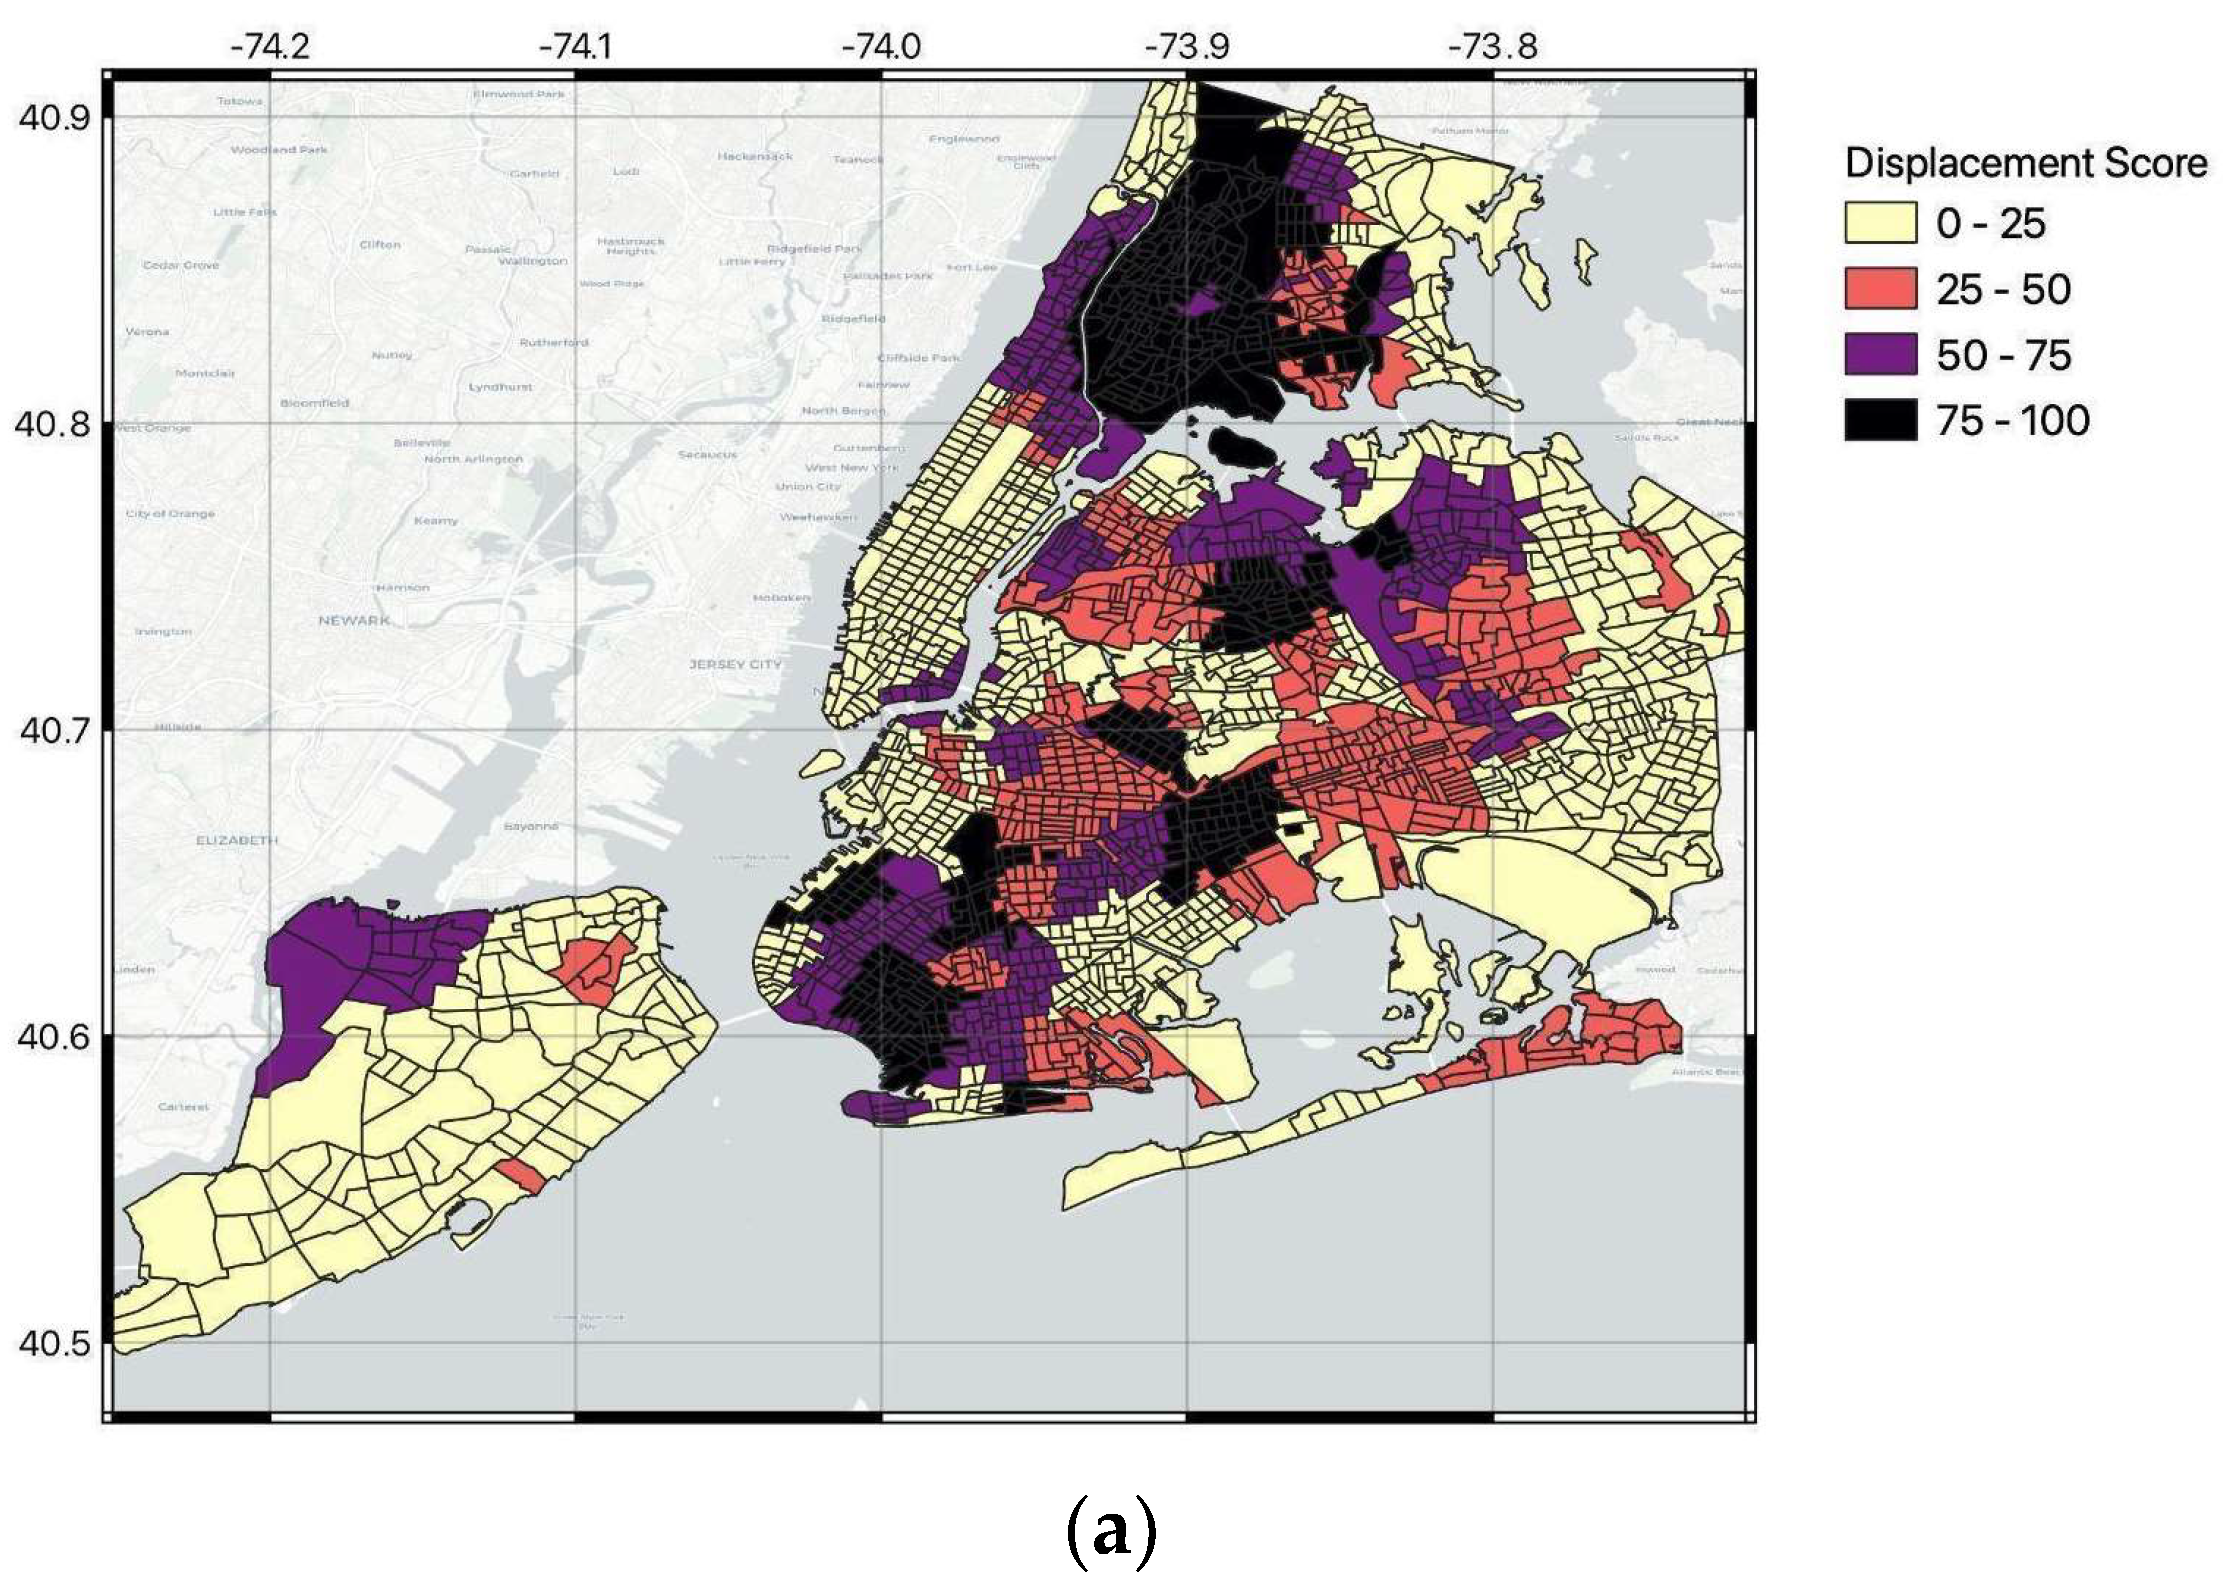
Figure 2.
(a) Displacement and (b) SOVI scores over NYC. The SOVI score is normalized to the NYC values.
2.3. The Social Vulnerability SoVI Dataset
For the social vulnerability dimension, we use the Social Vulnerability Index (SoVI, [20,21]). The SoVI synthesizes 29 socioeconomic variables, which the research literature suggests contributes to reduction in a community’s ability to prepare for, respond to and recover from hazards. The data are compiled and processed by the Hazards and Vulnerability Research Institute at the University of South Carolina and are standardized and placed into a principal components analysis to reduce the initial set of variables into a smaller set of statistically optimized components. More information about the SoVI can be found at https://www.sc.edu/study/colleges_schools/artsandsciences/centers_and_institutes/hvri/data_and_resources/sovi/index.php (accessed on 13 December 2023). For the purpose of this study, we normalize the SoVI value between 0 and 100 over the NYC area (Figure 2b). We name this the socio-vulnerability score (SOVISc).
2.4. Computation of the Climate Displacement and Socio-Vulnerability (CDSV) Score
Additive composite indices have been used in environmental and climate studies (e.g., [21]), though other methods based on multiplicative and non-linear methods also exist (e.g., [22,23]). Here, we focus on an additive normalization approach without weighing [17] to compute the CDSV score, which is based on the summation of values of multiple indicators after these indicators have been normalized to a unitless, comparable scale [24]. We selected this method in the absence of any other information that could provide a way to determine the weights for each factor (e.g., climate, socio-vulnerability, displacement). In order to reduce multicollinearity effects (e.g., [25]), we computed the correlation among the three indices used to build the CDSV score and found a correlation of R2 = 0.24 between DispSc and SOVISc and lower values when considering the ClimSc values, reinforcing our choice for an additive model [24].
For each climate hazard, we compute the CDSV score from the linear combination of the three factors equally weighted as:
where, the subscript i refers to the specific natural hazard (e.g., coastal flood, heatwaves, etc.). The CDSVi score can range between 0 and 100 with 0 being the lowest impact due to the combination of the three factors and 100 being the highest. The CDSV is also complemented by a Climate Displacement and Socio-Vulnerability Rank (CDSV_R) which we obtain by translating the numerical values into categories using k-means classification [26] and adopting the five different classes of Very Low, Low, Intermediate, High and Very High (Figure S1). We do acknowledge the importance of assessing potential margins of errors associated with our index. Nevertheless, at this stage we cannot compute those, because margins of error (MOE) are not yet available for the FEMA NRI.
CDSVi = (ClimSci + DispSc + SOVISc)/3
3. Results
3.1. Spatial Analysis
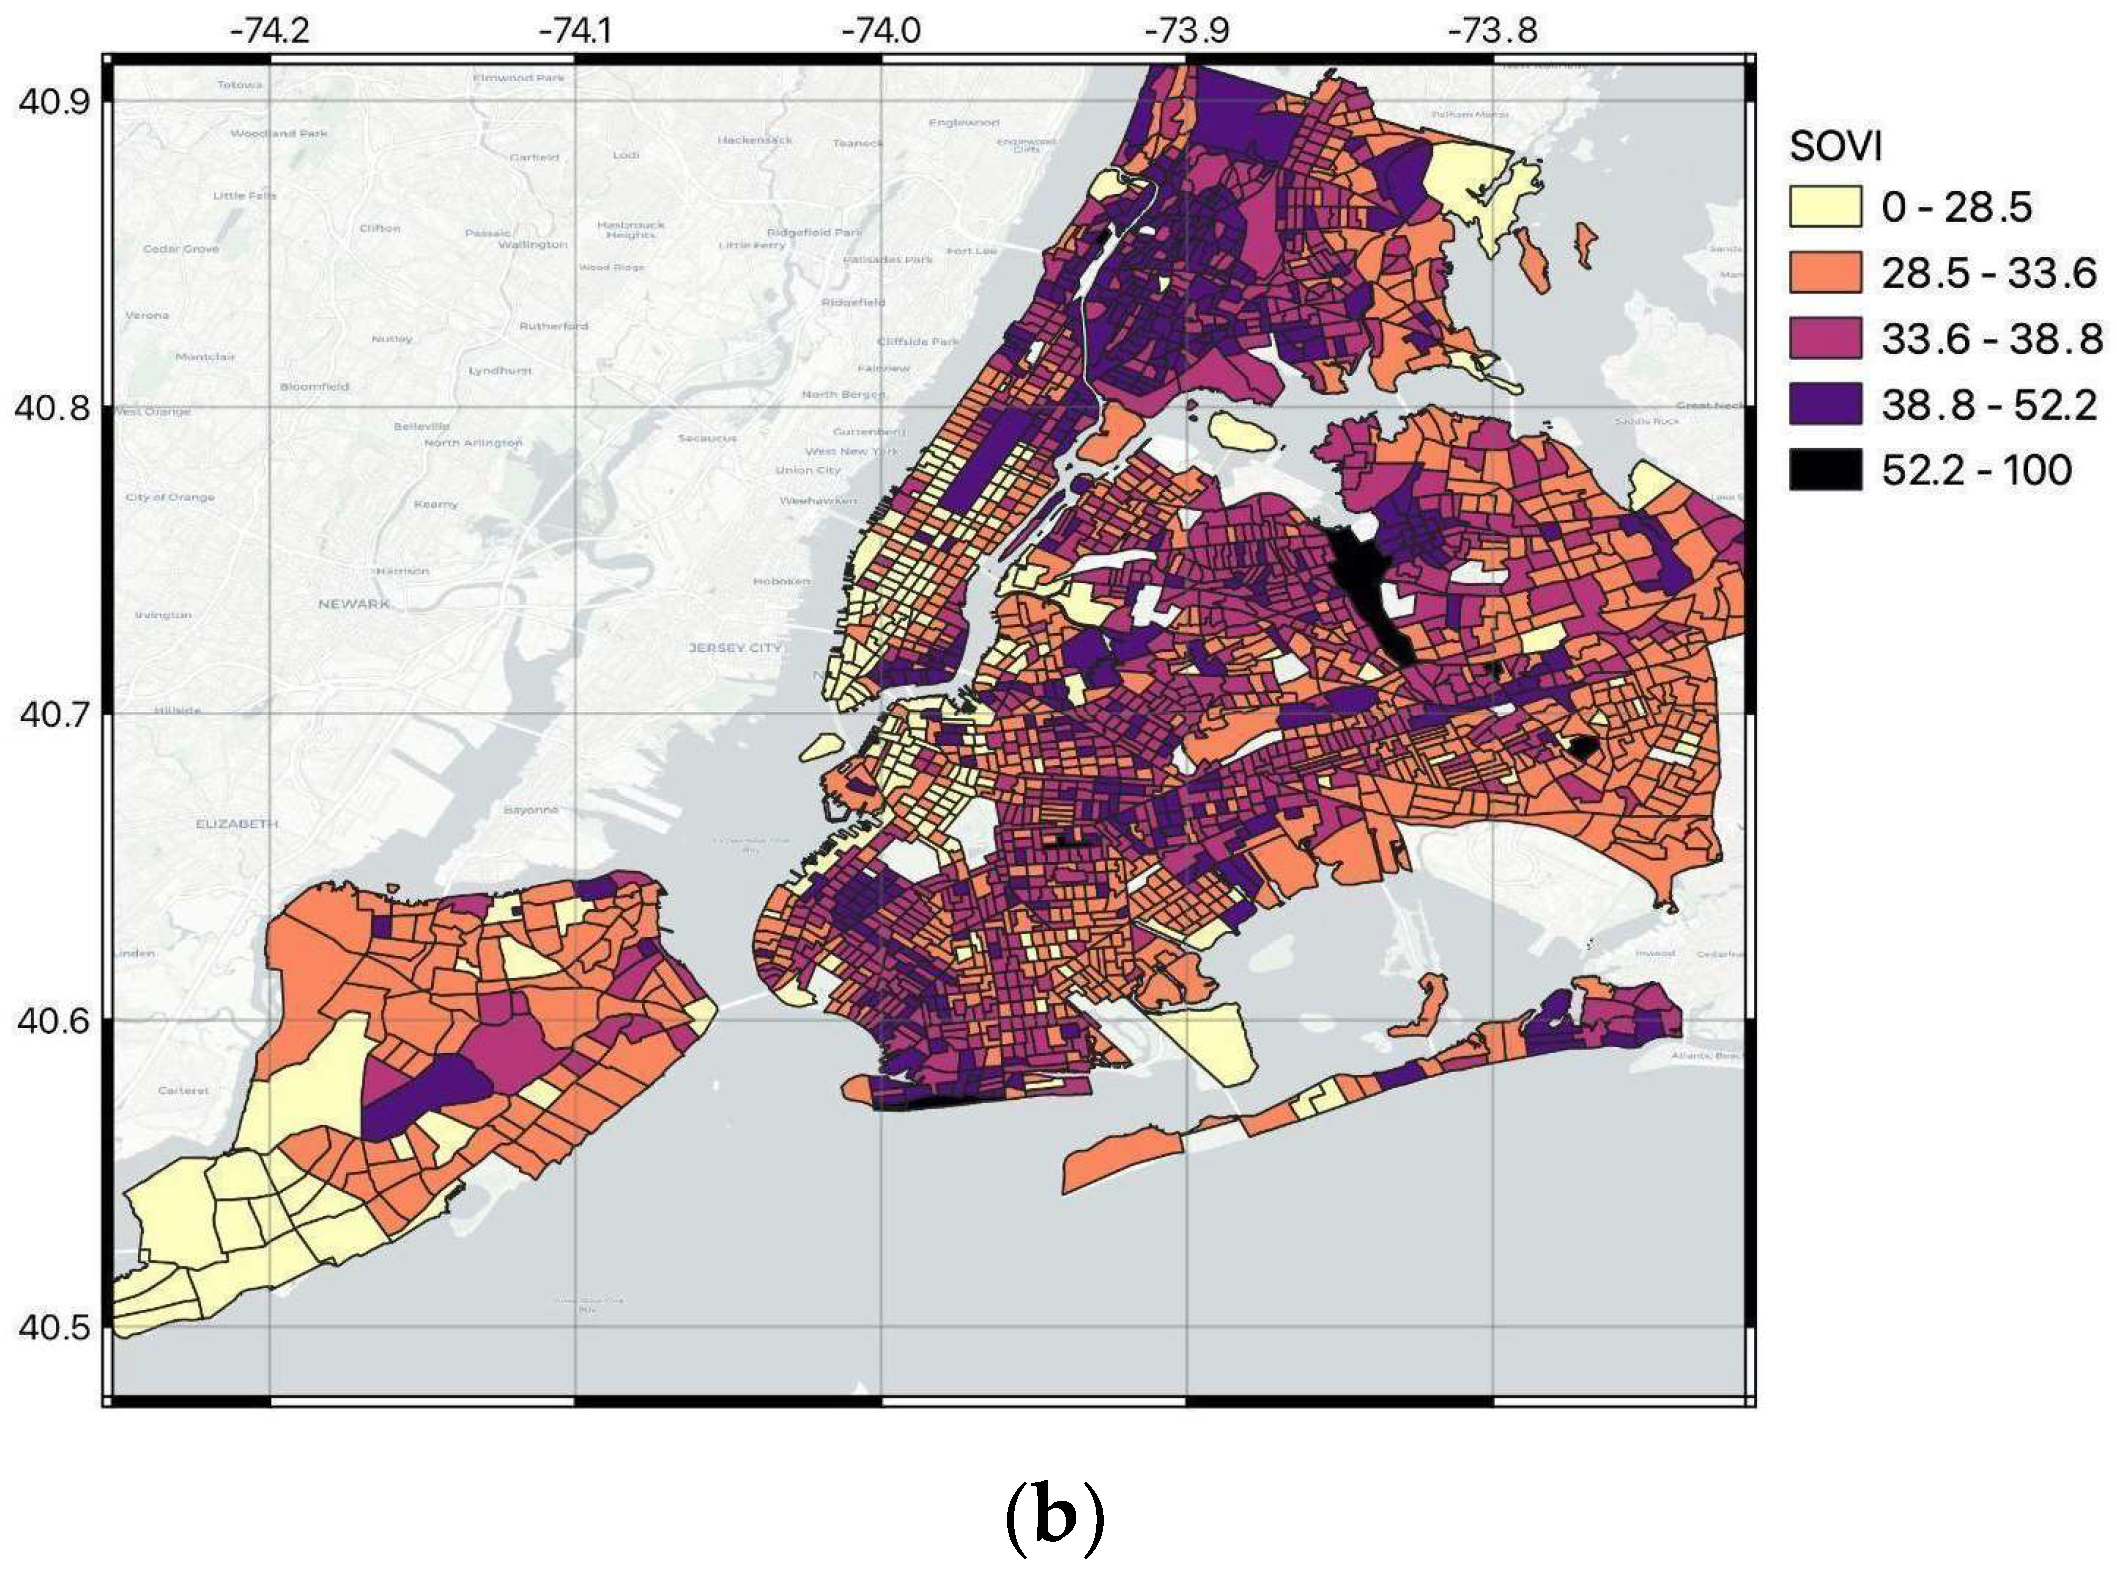
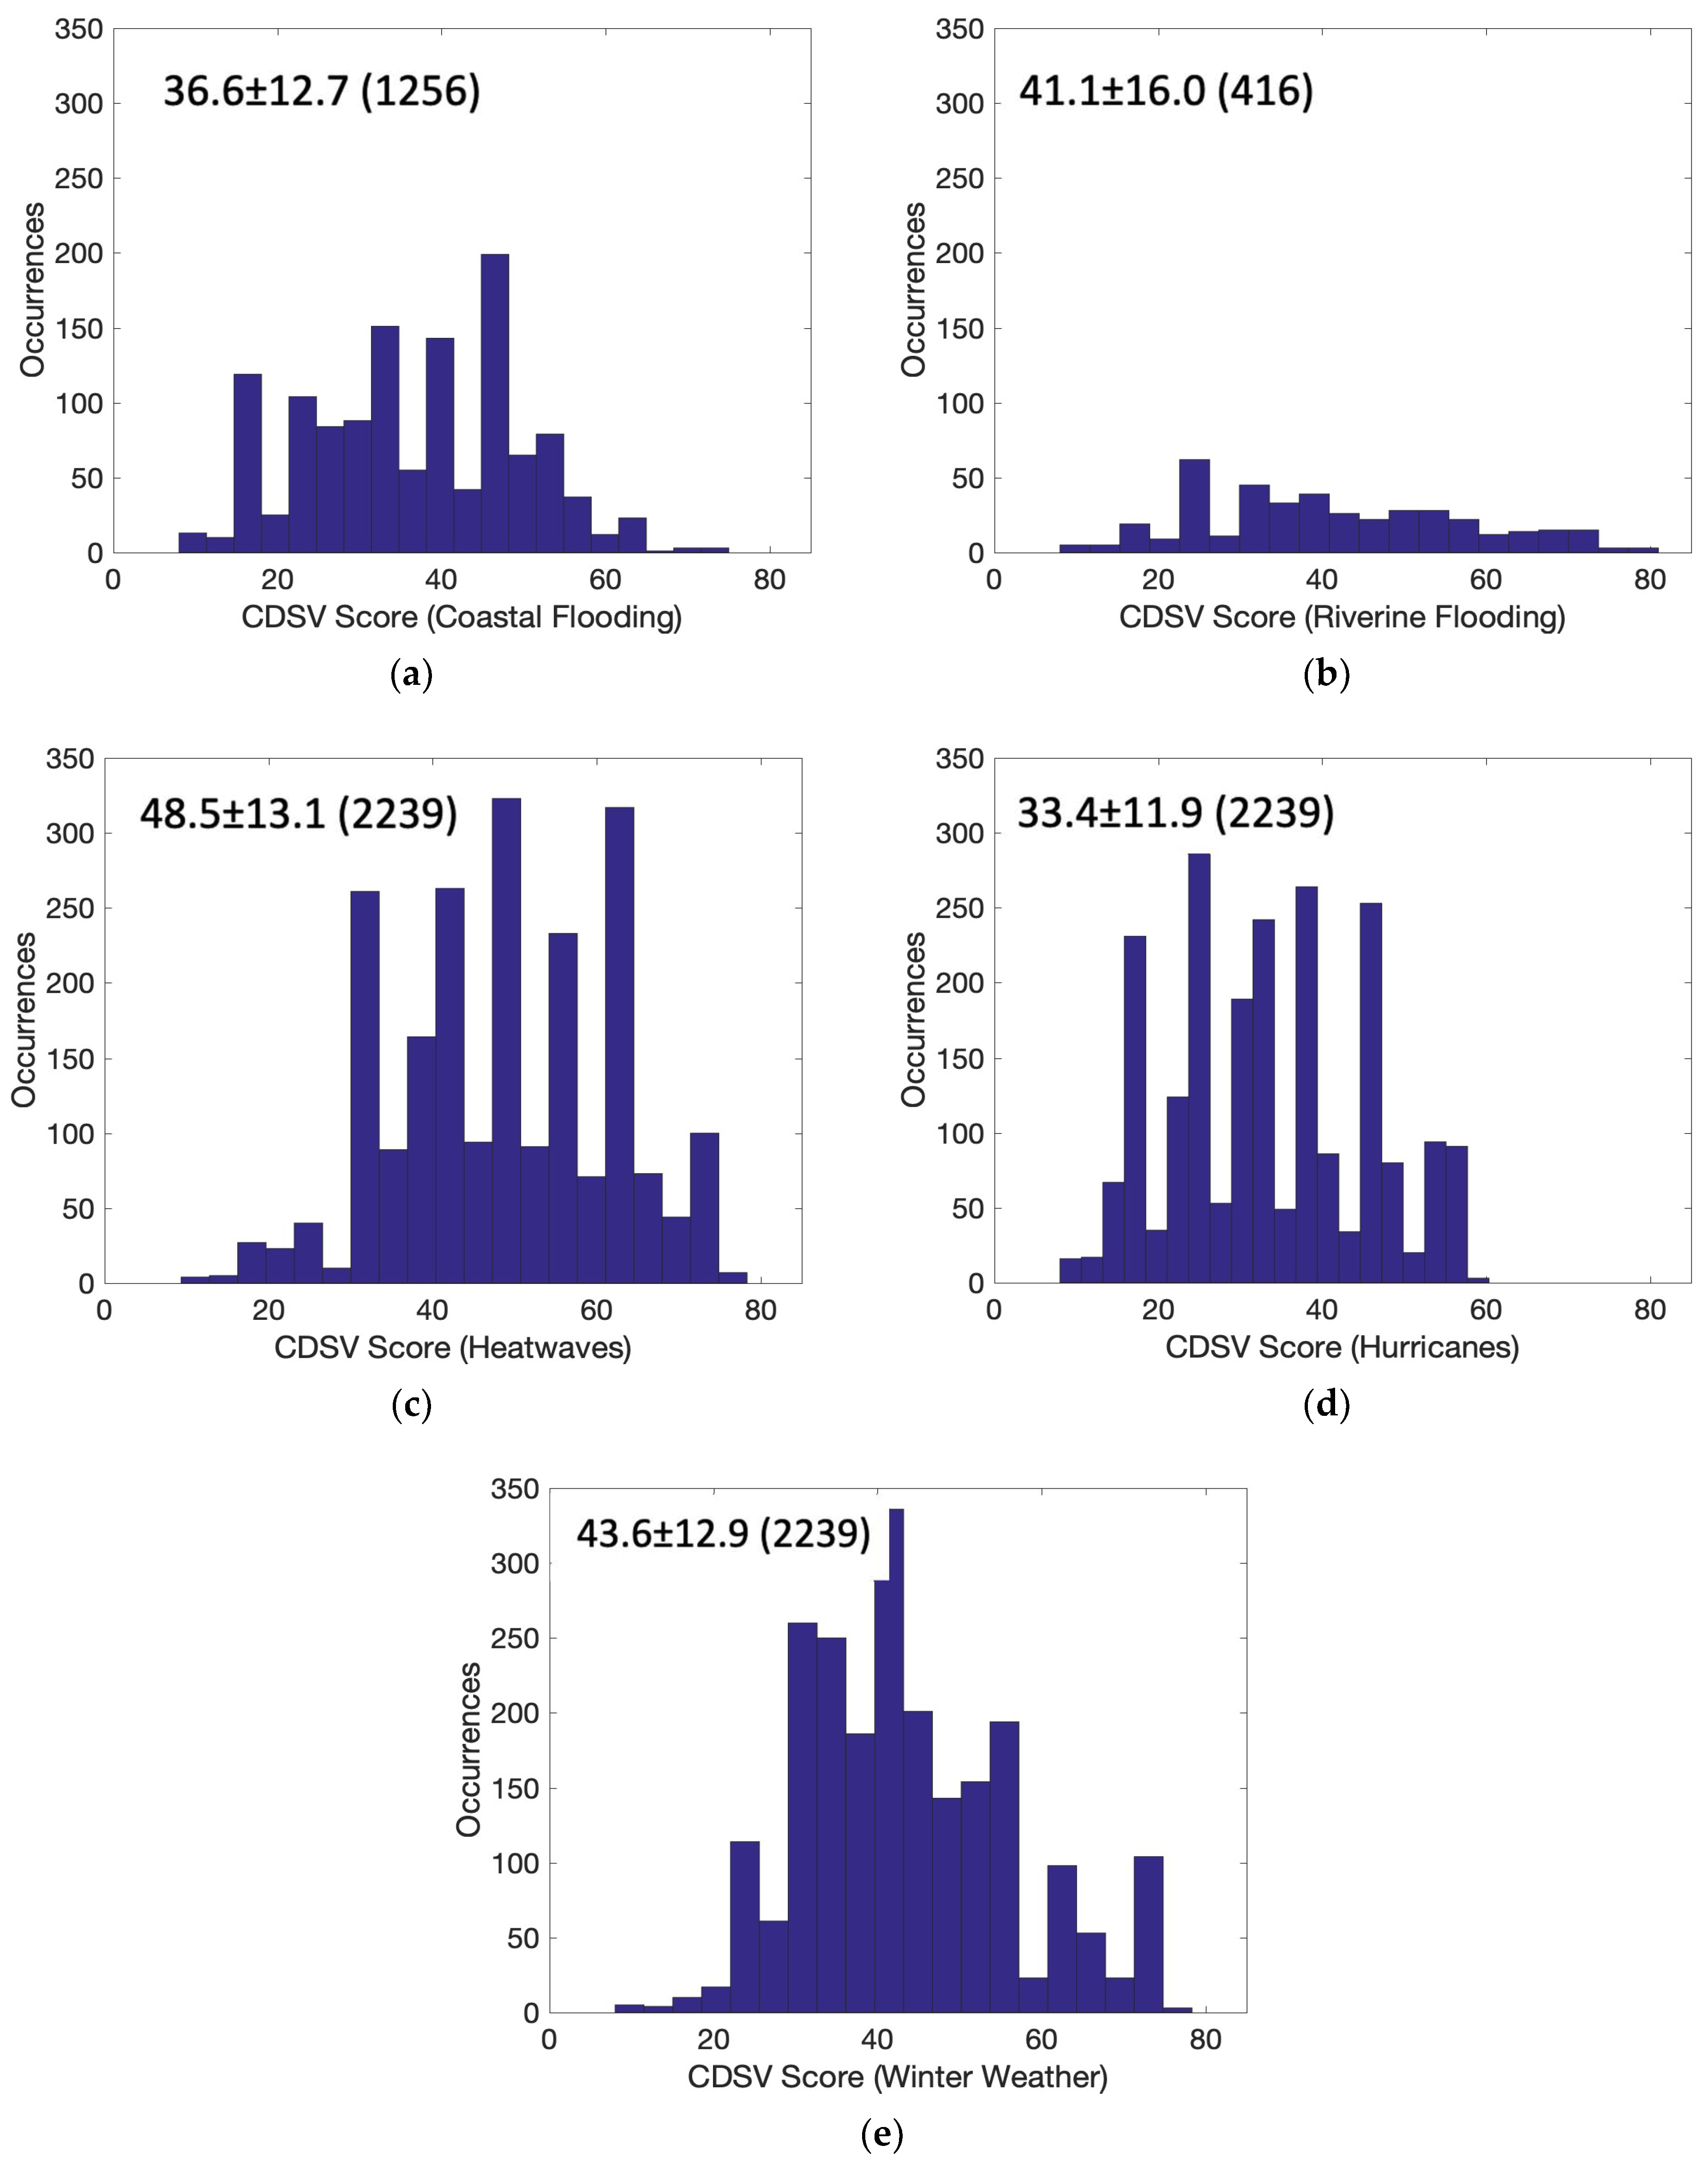
In Figure 3, we show the CDSV scores obtained for coastal (Figure 3a) and riverine flooding (Figure 3b), heatwaves (Figure 3c), hurricanes (Figure 3d) and winter weather (Figure 3e) over NYC. We point out that the maximum values reported in the legend reach the value of 80, despite the CDSV having a maximum value of 100. The reason for this is related to the fact that none of the computed CDSV values exceeds the value of 80 (see Table 1). From the visual inspection of the panels in Figure 3, we also note that areas in the Bronx and Southern Brooklyn are characterized by relatively high CDSV values for several hazards. Moreover, we point out that gray areas in the case of coastal and riverine flooding are associated with the absence of those hazards for inland regions. In order to better understand and quantify the results obtained here, in Figure 4 we show the histograms of the different CDSV scores, together with the mean and standard deviations of the CDSV score for the specific hazard together with the number of samples. The hazard with the highest CDSV mean is heatwaves (48.5 ± 13.1, median = 48.1) though winter weather has a similar value (43.6 ± 12.9, median = 40.7). The hazard with the lowest mean CDSV is hurricanes (33.4 ± 11.9, median = 32.1), slightly lower than the one for coastal flooding (36.6 ± 12.7, median = 37.7). Riverine flooding score shows the largest standard deviation (41.1 ± 16, median = 39.67).

Figure 3.
CDSV score for (a) coastal and (b) riverine flooding, (c) heatwaves, (d) hurricanes and (e) winter weather for the five NYC boroughs. Thick lines and numbers represent PUMA areas and their extent.

Table 1.
Top 10 CDSV values ordered from the largest to smallest for the five hazards and corresponding Federal Information Processing System (FIPS).
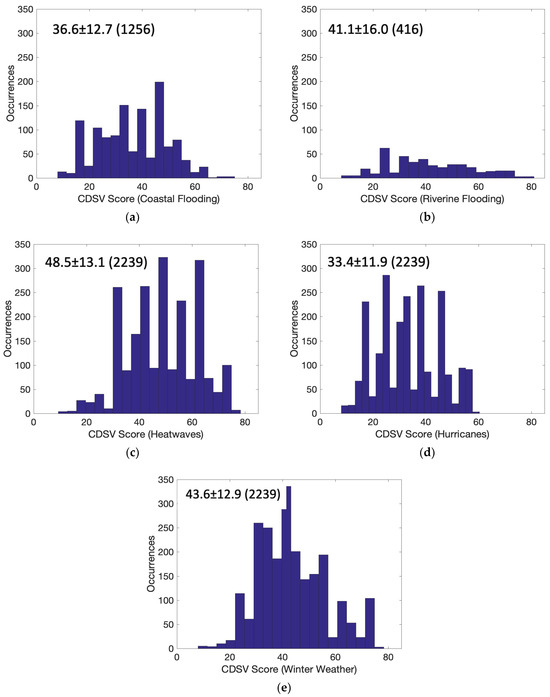
Figure 4.
Histograms of CDSV for (a) coastal and (b) riverine flooding, (c) heatwaves, (d) hurricanes and (e) winter weather over NYC. Numbers in each plot represent the mean and standard deviations of the CDSV score for the specific hazard. Numbers in parentheses show the number of samples (e.g., census tracts) where either data is available or the hazard has been recorded.
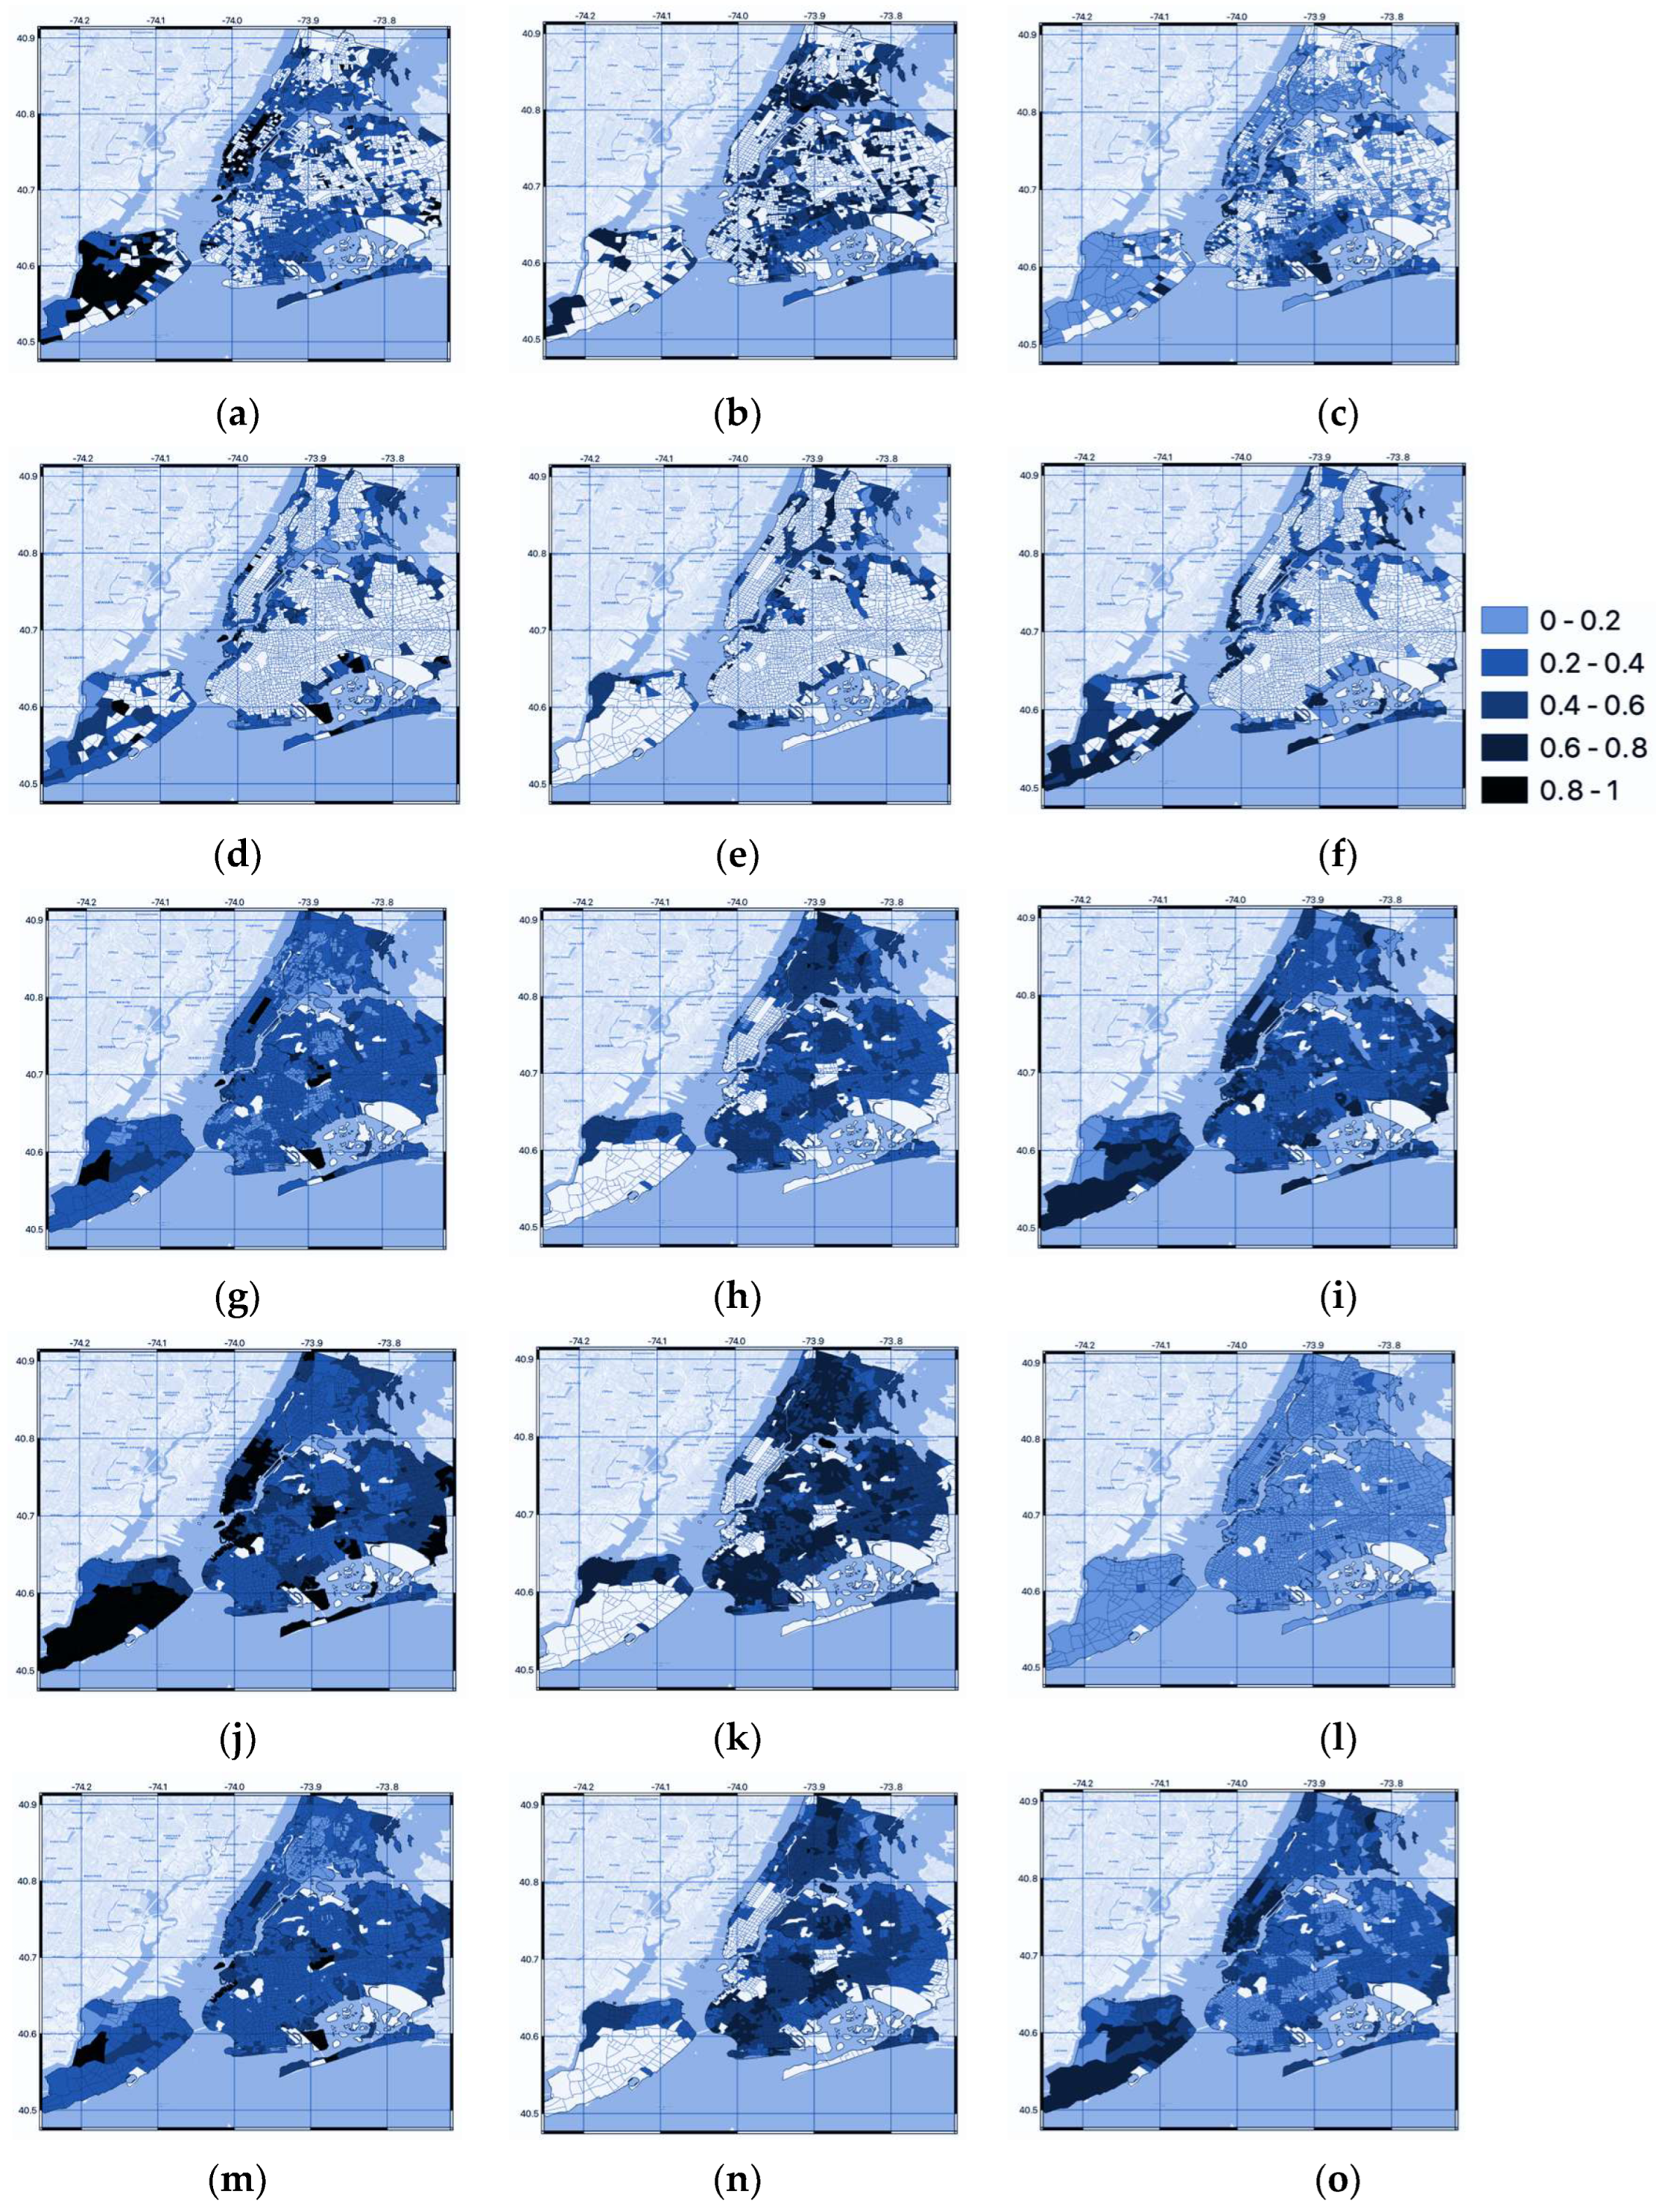
In Figure 5, we report the relative contribution of socio-vulnerability (left column), displacement (middle column) and climate hazards (right column) to the CDSV in the case of the different climate hazards. Values can range between 0 and 1, with low values meaning that the particular factor under consideration weakly contributes to the CDSV and high values, meaning that it is a dominant contributor. For example, we note that the climate component shows a relatively minor role over most of our study areas in the case of hurricanes (Figure 5l), where the socio-economic component plays a large role in south Staten Island and the Lower East Side of Manhattan. On the other hand, in the case of heatwaves, all three factors tend to contribute to the computed CDSV in a more balanced way (Figure 5g,h,l), with displacement playing a negligible role in lower Manhattan and the climate factor playing a larger role in mid-Manhattan and, again, the southern portion of Staten Island.

Figure 5.
Relative contribution (ranging from 0 to 1) of the socio-vulnerability (first column), displacement (mid column) and climate hazards (right column) in the case of coastal (a–c) and riverine (d–f) flooding, heatwaves (g–i), hurricanes (j–l) and winter weather (m–o) to the computed CDSV score.
In order to better identify the location of the areas at highest risk of exposure to the combination of climate, displacement and socio-vulnerability factors, we ordered the top 10 CDSV values for the five hazards (Table 1). In Figure S2, we also show the census tracts where the top 10 CDSV values overlap for the different hazards, together with the number of times when a specific census tract ranks among the top 10 CDSV values for the five hazards reported as a number within each highlighted track. We summarize these results in Table S1, where we also show the socio-economic characteristics available from the 2016 Census data (https://www.census.gov/acs/www/data/data-tables-and-tools/data-profiles/2016/ (accessed on 13 December 2023)).
The tract with the highest occurrences of top 10 CDSV values (Figure S3a, FIPS#36061024302) is located along Harlem River Drive, near the subway station on 155th street. This area is home to the Ralph J Rangel houses of the New York City Housing Authority (NYCHA). The 2016 Census reports 7601 people for this tract with an unemployment rate of 27.7%, a poverty rate of 49.3% and a per capita income (PCI) of USD 10,982. Here, 34% of the residents don’t have a high school diploma, 30.2% are younger than 17 years, 31.8% are single parents and 99.8% belong to a minority, with 85.3% of the population not having a vehicle. As a reference, Table 2 shows the tracts where the number of instances when CVSD belongs to the top 10 values is present. In the table, socio-economic characteristics based on the 2016 Census for the selected tracts are also reported. The tract #36005023704 (Figure S3b) is located in the Bronx, containing the 182–183rd street subway station, and it is home to 4142 people. The PCI is USD 11,675, with more than half of the population (52.4%) living below the poverty level. Similar to the case of the Ralph J Rangel houses, roughly 30% of the population is younger than 17 years of age, with 82.2% not having access to a vehicle. Additionally, as in the previous case, 99.3% of the population belongs to a minority, 91% lives in multi-unit and 31.9% has limited English skills, with 39.2% not having a high school diploma.
Table 2.
Census tracts where the number of instances when CVSD belongs to the top 10 values is present, together with socio-economic characteristics based on the 2016 Census.
A second tract where the number of CDSV top 10 values reaches three instances is located in south-east Manhattan (FIPS#36061000600, Figure S3c). This area is home to 10,765 people (according to the 2016 Census), of which 10.7% are unemployed, 49.8% have no high school diploma, 26.3% are over 65 years of age and 17.9% are below 17 years. The PCI here is slightly higher than the other places, being USD 14,554 and with a percentage of 39.3% of the population living below the poverty level. Similar to other areas ranking high in terms of combined top CDSV values overlapping from multiple hazards, 95.6% of the population belongs to a minority, 81.2% have no vehicle and 43.8% speak limited English.
The census tract located in south Brooklyn (FIPS #36047029400, Figure S3d), also with three top 10 instances, contains 2460 people. In this case, the relative percentage of people belonging to a minority is smaller than in the previous cases (43.9%), with the percentage of people living below the poverty level down to 27.3% and a PCI of USD 22,011, almost doubling the one found for other areas discussed above. Here, the percentage of people with disabilities is relatively high (34.9%) and so is the percentage of people older than 65 years of age.
The last tract where the CDSV has three top 10 values is located along Brighton Beach (36047036002, Figure S3e). This tract hosts 4062 people with a PCI of USD 17,489, an unemployment rate of 15.7% and a percentage of minority of 12.1%.
3.2. Temporal Analysis
Building on data provided by the New York City’s Mayor Office concerning changes in socio-economic and housing conditions for three different periods (2000, 2008–2012 and 2015–2019, https://equitableexplorer.planning.nyc.gov/methods (accessed on 13 December 2023)), we analyze how such conditions have been changing for those areas where relatively high values of CDSV are obtained. For our analysis, we group the CDSV scores into 5 classes using a K-means based approach (Figure S3, [26]). We refer to the 5 classes as Very High, High, Intermediate, Low and Very Low. This analysis can support our understanding of the socio-dynamic processes associated with or driving the combined risk of climate hazards and displacement and the populations at risk.
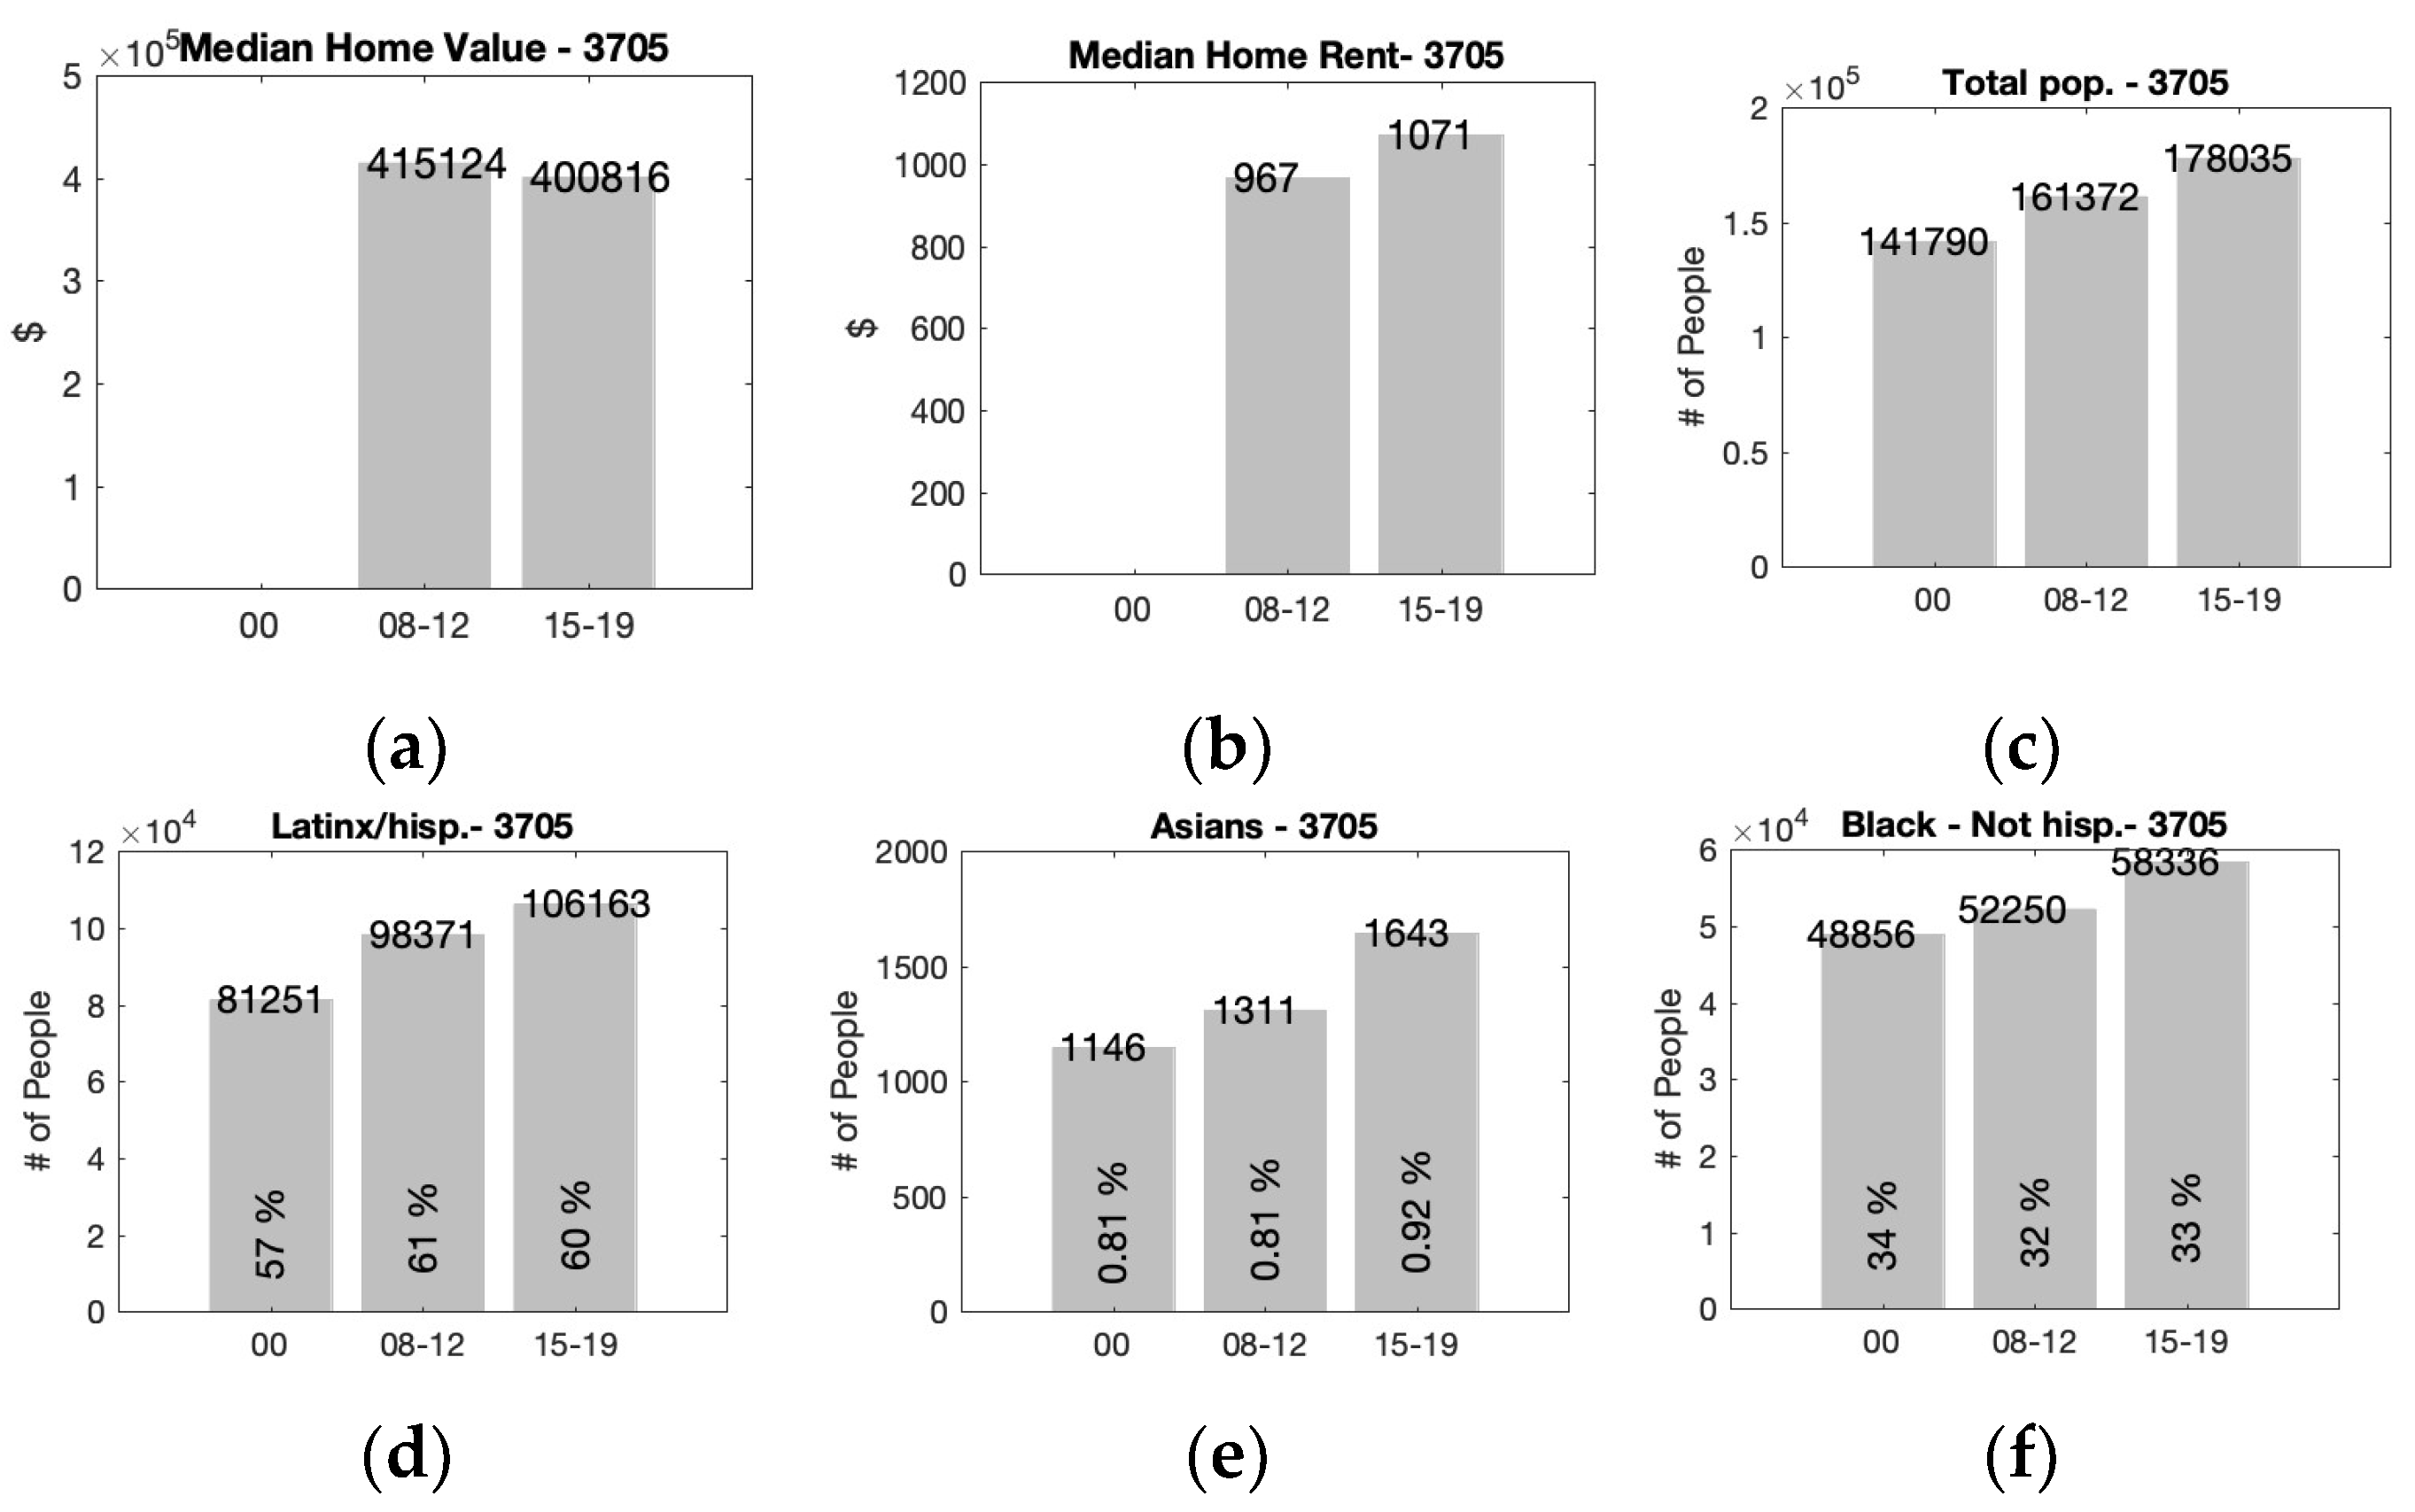
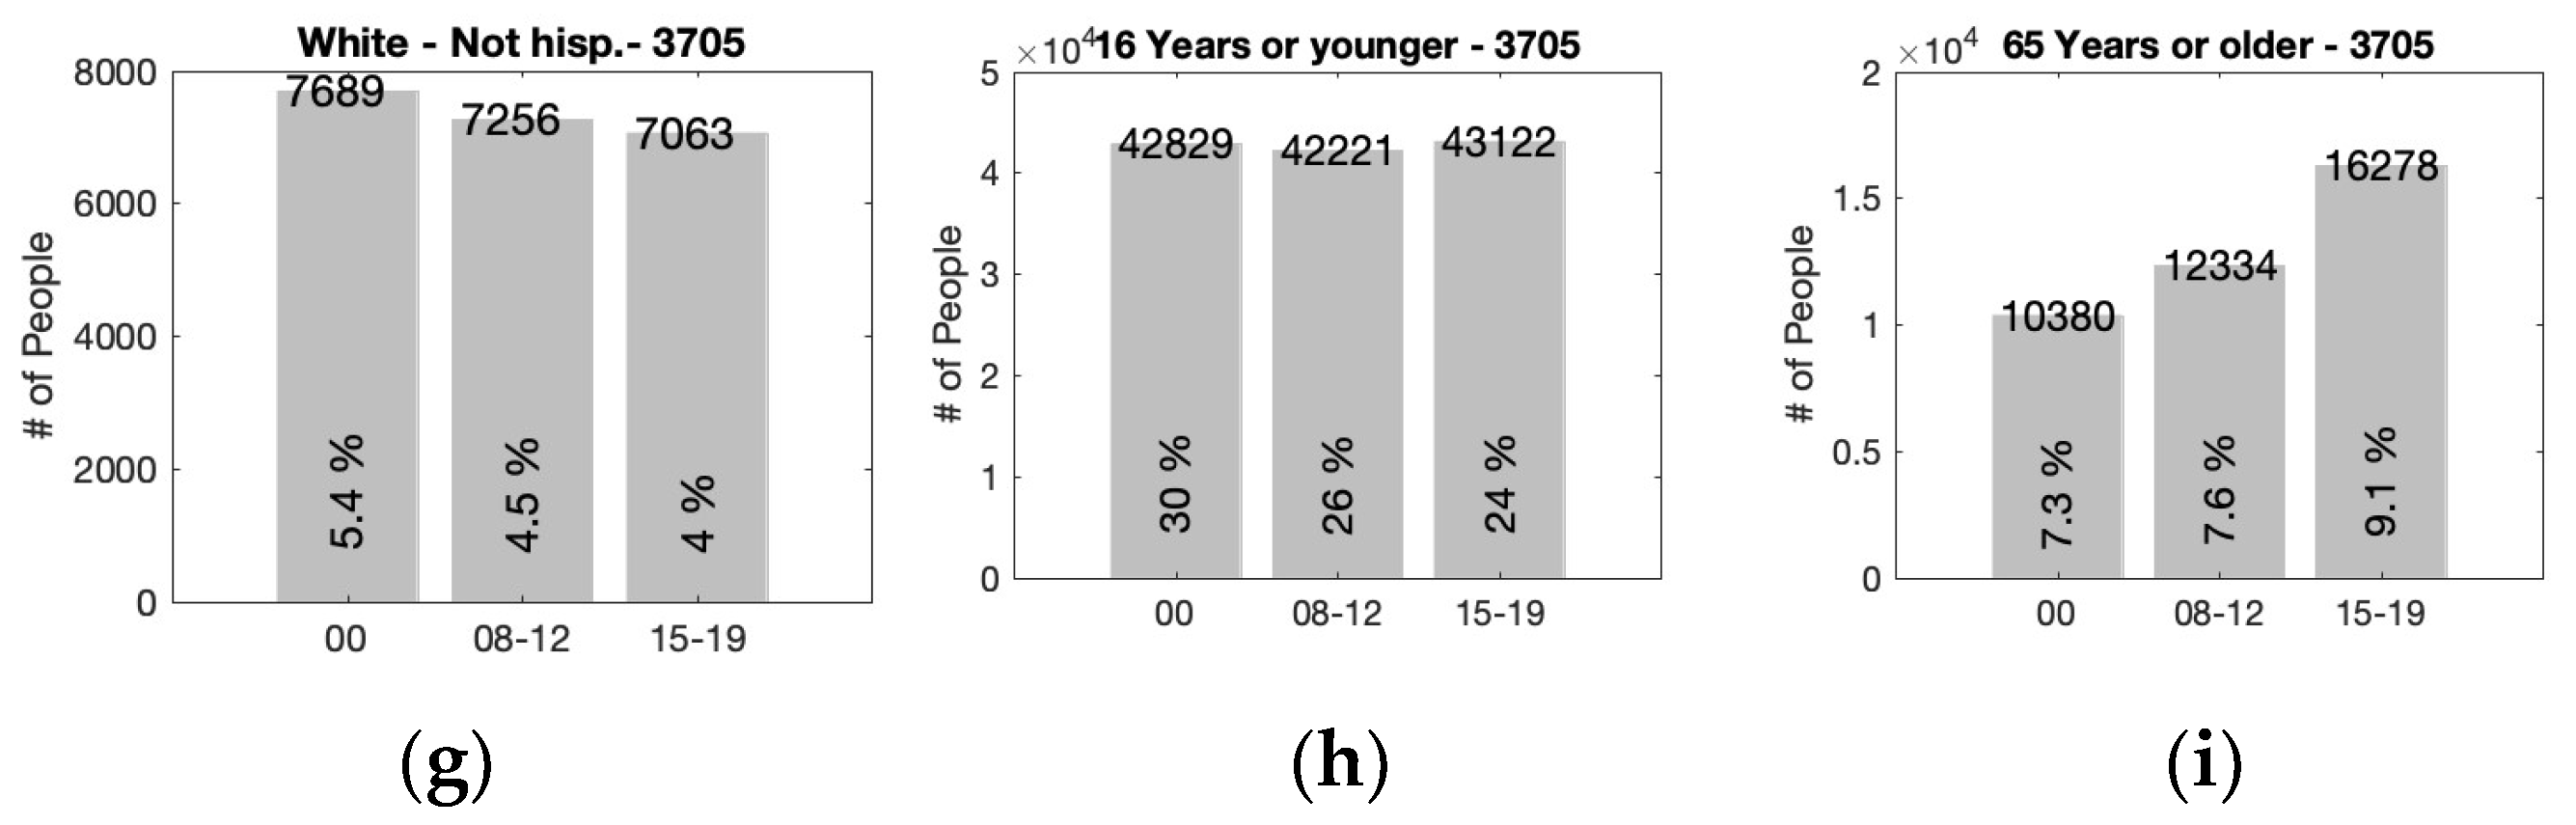
We focus our attention on those areas classified as Very High and High (Figure S3), leading to the identification of the following PUMA regions: #3705 through #3710 in South Bronx; #4017 in South Brooklyn; #4012 in south-east Brooklyn and #4008 in Queens. The areas in the South Bronx show a decrease in the Median Home Value between 2008–2012 and 2015–2019 up to more than 10% (e.g., 3706, Figure 6) and a corresponding increase in rent of the same order of magnitude. These areas are characterized by a high percentage of Latinx/Hispanix (on average above 65%). For the inland areas, the Latinx/Hispanix population has increased up to ~10%, with the increase being smaller for the regions along shorelines (e.g., 3710, Figure S6). For some of the PUMA sectors, such as #3706, the percentage of White people halved between 2000 and 2018 (from 11% to 5.6%), where, for the PUMA #3707 (Figure S4) and 3708 (Figure S5), the percentage of African Americans reduced by 6–8%. The increase in rent and the decrease in home values point to an increased financial stress for the already vulnerable populations living there.


Figure 6.
Changes in (a) total population, (b) number of Black-Not Hispanics, (c) Latinx/Hispanics, (d) Asians, (e) Whites, (f) people who are 16 years or younger, (g) people who are 65 years or older, (h) Median Home Value and (i) Median Home Rent for the years 2000, 2008–2012 and 2015–2019 for PUMA 3706. Percentage values within the gray bars in panels b through g represent the relative percentage of the population for the corresponding class, with respect to the total population.
The PUMA sector in South Brooklyn (4017, Figure S9) shows, differently from the South Bronx areas, an increase in both the median value and the rent. The median value increased by roughly 20% between 2008–2012 and 2015–2019. The increase for rental was a similar order of magnitude. For the PUMA #4017, the Latinx/Hispanic population has doubled from ~8% in 2000% to 16% in 2015–2019 of the total population, similarly to Asians, whose percentage increased from 23% in 2000 to 43% in 2015–2019. For the same region, the number of White people drastically reduced from 65% of the population in 2000 to 36% in 2015–2019.
In the case of PUMA #4008 (Figure S8) the Median Home Value did not considerably change between 2008–2012 and 2015–2019, with a relatively small increase in the Median Home Rent. In this area, we note an increase of the Asian population, which tripled in terms of the number of people and doubled in terms of percentage relative to the total population. Such increase is even more substantial for PUMA #4012 (Figure S7), in south-east Brooklyn, showing an almost doubling of Asians (from ~30,000 to ~55,000), with a change in the relative percentage from 22% to 36%. Differently from PUMA #4008, however, we note a substantial increase in the Median Home Value by 27% from the period 2008–2012 to the period 2015–2019.
3.3. CDSV and Racial, Ethnic and Health Factors
We further investigate the relationships between the CDSV and racial, ethnic and health factors to study potential linkages that could provide suggestions for future policies or recommendations. Health data (e.g., number of adults with asthma and diabetes) and racial/ethnicity data are obtained from the recently released Climate and Economic Justice Screening tool (https://screeningtool.geoplatform.gov/en/downloads#3/33.47/-97.5 (accessed on 13 December 2023)) and spatially co-registered with the CDSV scores at census tract level. We perform data binning to reduce the effects of minor observation errors and divide the CDSV scores into eight equal intervals with each interval containing CDSV values between N and N + 9, with N ranging between 0 and 70. The reason for using only eight bins (rather than 10) is that the maximum CDSV score value we obtain is lower than 80. Once the CDSV data are aggregated, we create boxplots [27] with the x-axis containing the CDSV binned values and the y-axis the corresponding health or racial/ethnicity data.
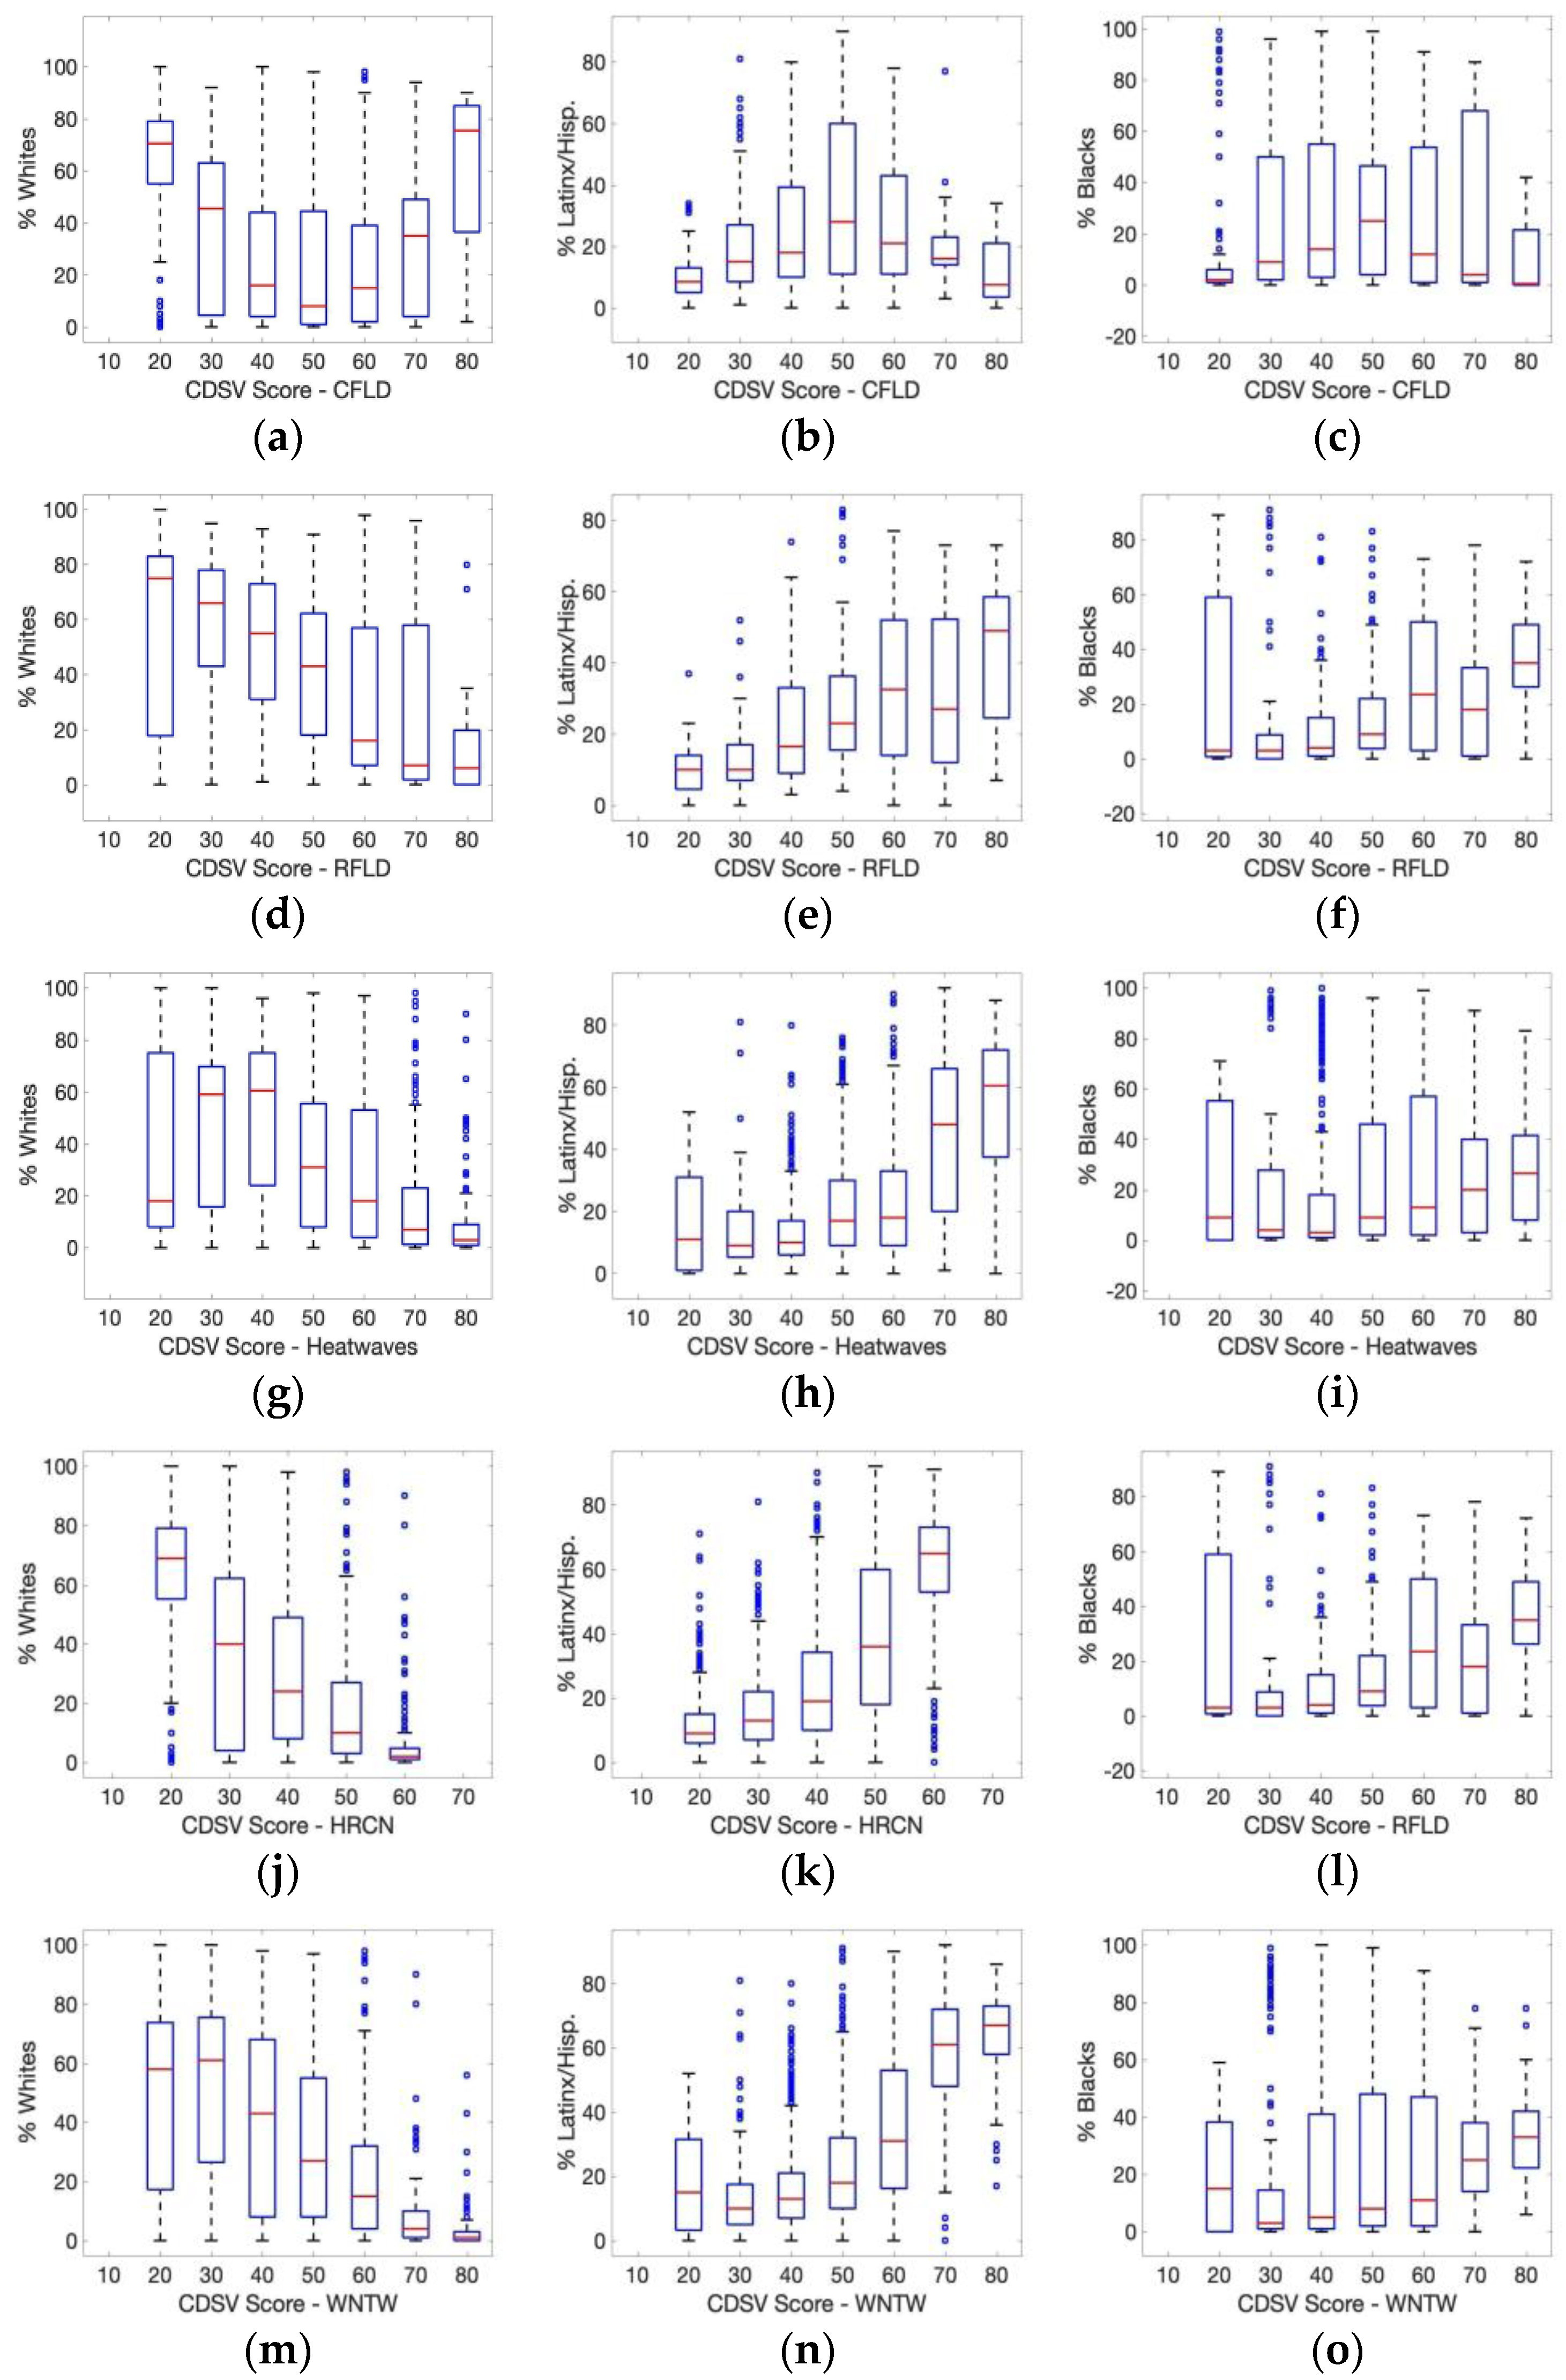
In Figure 7, we report the percentage of White (Figure 7a,d,g,j,m), Latinx/Hispanics (Figure 7b,e,h,k,n) and Black people (Figure 7c,f,i,l,o) as a function of the CVSD scores in the case of costal (Figure 7a–c) and riverine (Figure 7d–f) flooding, heatwaves (Figure 7g–i), hurricanes (Figure 7j–l) and winter weather (Figure 7m–o). In the figure, the red line within each box shows the median values where the top and bottom parts of each box indicate, respectively, the 75th and 25th percentile. Moreover, the horizontal lines at the end of the vertical dashed lines indicate the minimum and the maximum values. Blue dots indicate outliers.
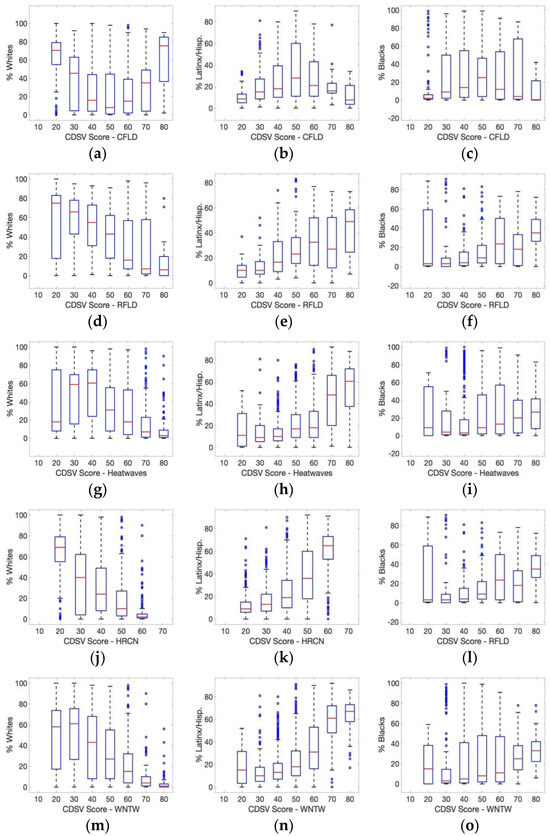
Figure 7.
Boxplots of the percentage of Whites (a,d,g,j,m), Latinx/Hispanics (b,e,h,k,n) and Blacks (c,f,i,l,o) as a function of the CVSD scores in the case of coastal (a–c) and riverine (d–f) flooding, heatwaves (g–i), hurricanes (j–l) and winter weather (m–o). In each panel, the red line indicates the median, the top and bottom part of the box indicate the 75th (top) and 25th (percentile), the horizontal line at the end of the dashed lines indicates the minimum and the maximum. Blue dots indicate outliers. One-third (37.2%) of people are 65 years or older and only 13.4% younger than 17 years. The percentage of people with no high school diploma is relatively low (9.1%) but the percentage of people speaking limited English is relatively high (49.8%).
In the case of riverine flooding (Figure 7d through Figure 7f), we observe a systematic decrease of the median value of the percentage of White people as the CDSV score increases, from ~80% in the case of 10–20 CDSV values down to ~5% in the case of 70–80 CDSV values. This is accompanied by an increase of the percentage of Latin/Hispanic people with median values shifting from ~10% for 10–20 CDSV binned values to ~60% at the maximum. Values also increase in the case of Black people, from ~5% to ~35%.
In the case of heatwaves, the median value of the percentage of White people is minimum for low CDSV values, reaching a peak of ~60% in the case of CDSV binned values between 30 and 40 and dropping considerably after then, reaching values close to 0. In the case of Latin/Hispanic people, the computed median values begin to increase after the CDSV binned values of 30–40, reaching a maximum of ~60% value for the 70–80 values. An increase is also observed in the case of Black people for this hazard, though the maximum reached is ~20%.
The plots concerning hurricanes (Figure 7j through Figure 7l) and winter weather (Figure 7m through Figure 7o) show a pattern similar to the heatwave case, with the median value of the percentage of White people belonging to high CDSV values decreasing with CDSV scores and the percentage of Latin/Hispanic and Black people increasing, with the Latin/Hispanic people reaching the highest values.
We observe that the relationship between CDSV and the median value of the percentage of people belonging to racial/ethnic groups are not statistically significant in the case of coastal flooding (Table S1). This is also true in the case of White people and heatwaves CDSV score. The remaining cases show statistically significant trends between median values and binned CDSV score (either at 95% or 99% level). The percentage of White people exposed to CDSV riverine flooding and winter weather decreases, respectively, by 1.3% (riverine) and by 1.12% (winter weather) per CDSV value. Conversely, the percentage of White people increases by 0.6% every CDSV point. The percentage of Black people increases with increasing CDSV values for all hazards but coastal flooding, with hurricanes showing the largest increase (1.35%/CDSV), followed by riverine flooding (0.52%/CDSV), winter weather (0.34%/CDSV) and heatwaves (0.37%/CDSV). In the case of Latin/Hispanic people, the only negative trend (−0.92%/CDSV) is found in the case of hurricanes. We point out, however, that in this case, the maximum range of CDSV values is 50–60. Trends are similar in the case of winter weather (0.99%/CDSV) and heatwaves (0.84%/CDSV), with a relatively lower value in the case of riverine flooding (0.66%/CDSV).
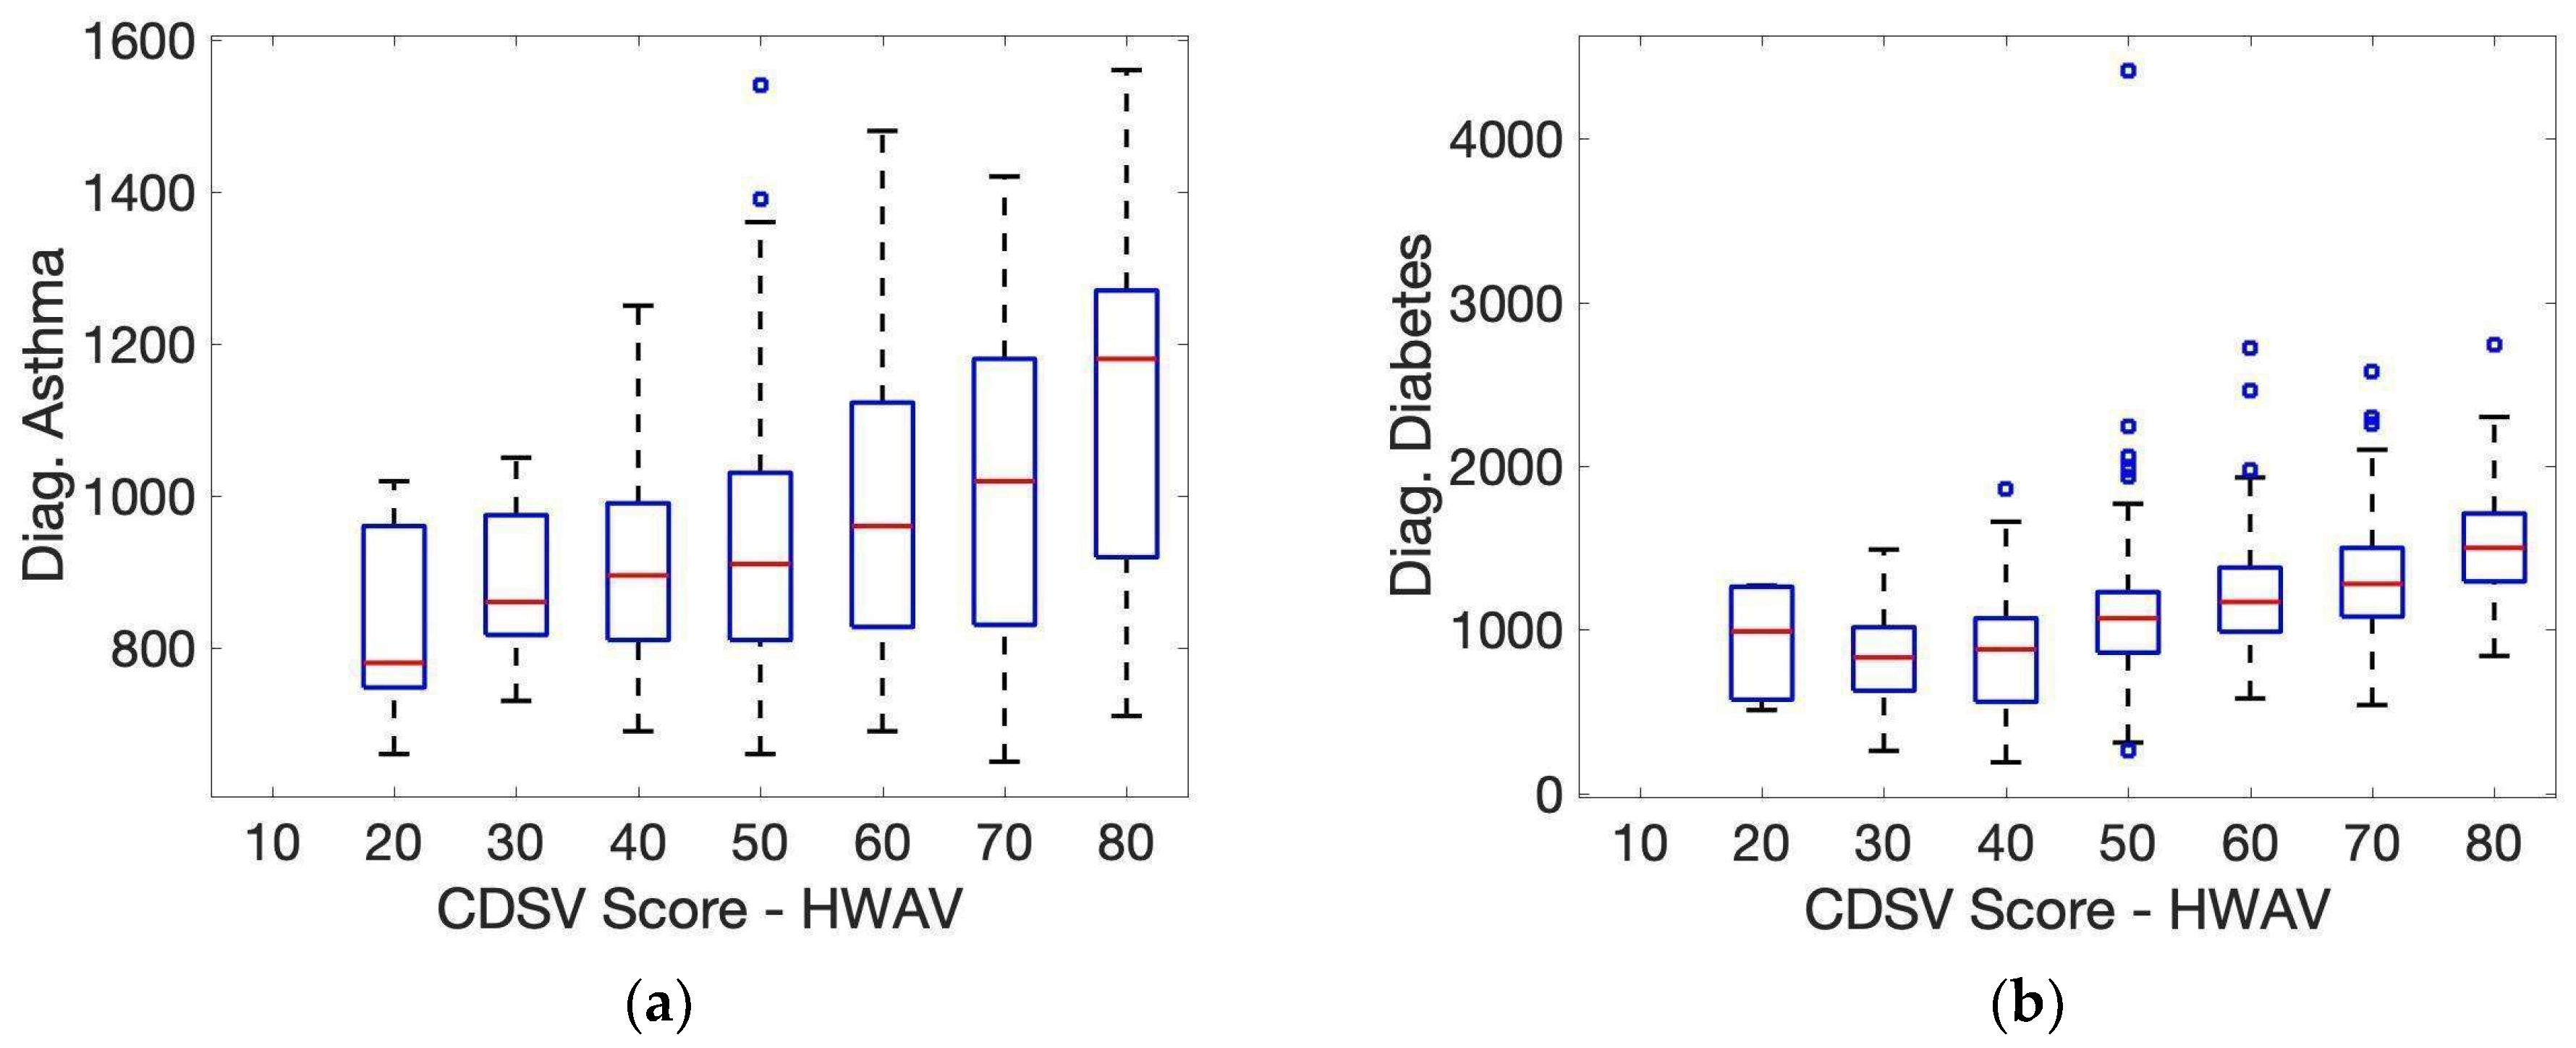
In view of the compounding effects of heatwaves and health [28], which can lead to deteriorating health conditions or premature mortality, we also analyzed the relationships between the CDSV values in the case of heatwaves and the number of people diagnosed with asthma (Figure 8a) and diabetes (Figure 8b). In both cases, we observe a strong relationship between the CDSV-computed values and the median number of people diagnosed with the two illnesses. This highlights the potential risks of compounding effects on health for those who already have poor health conditions in areas where the combination of climate, displacement and socio-vulnerability is the highest. The correlation coefficients between CDSVHeatwaves and median values of people above 18 years of age with asthma and diabetes are R2 = 0.82 (asthma) and R2 = 0.92 (diabetes), both statistically significant at a 99% level (p < 0.01, Table S2). In the case of the two illnesses here considered, we find an increase of 97.1 (diabetes) and 56.5 (asthma) people per CDSV value.
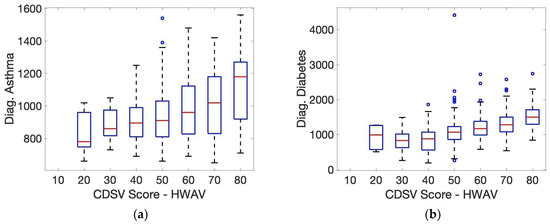
Figure 8.
Boxplots of number of people diagnosed with (a) asthma and (b) diabetes as a function of the CVSD score for the heatwave. In each panel, the red line indicates the median, the top and bottom part of the box indicate the 75th (top) and 25th (percentile), the horizontal line at the end of the dashed lines indicates the minimum and the maximum. Blue dots indicate outliers.
4. Discussion
As explained, in this study, we generated a score that combines data from climate hazards, social-vulnerability factors and displacement risk in NYC. Rather than using a single hazard, we used multiple ones to account for the compounding effects of risks that coexist in many low-income, Latin/Hispanic and Black communities. This compounding analysis is extremely important for identifying and characterizing those areas that are at risk of exposure to multiple climate hazards. Capturing the compounding effects of different risks is also important for policy makers. For example, managed retreat is increasingly utilized as a climate hazard mitigation and adaptation strategy, often through the use of buyout programs funded by federal and state governments. People exposed to flooding might be relocated or might move to areas where the flood risk is lower but where other climate hazard risks (e.g., heatwaves, winter weather) might be higher. Indeed, there is evidence that, particularly in hot housing markets, many people retreating from risky areas have difficulty relocating to less risky areas [29]. Some of the retreating populations, particularly racial and ethnic minorities, move to areas with higher social vulnerability [30] or that are more racially segregated [31]. At the same time, resilience-promoting investments in green infrastructure to address climate risks such as heat flooding can lead to climate gentrification and the displacement of socially vulnerable populations. [32,33].
In this regard, the CDSV score generated for NYC has the potential to guide where and how to target adaptation strategies and resilience investments to avoid or reduce the chance of maladaptation outcomes and climate gentrification. By integrating multiple risks dimensions, the City can overcome some of the limitations of existing vulnerability assessment tools that underestimate the intersectional ways in which so many communities remain vulnerable, despite well-intentioned mitigation and adaptation policies. A limitation to our approach consists of the use of the specific datasets used in this study. In the case of climate data, limitations might be related to the methodology and datasets used by FEMA to generate the NRI database, whose aim is to cover the whole of the United States. The reason for us to choose such a dataset is related to its public availability and the potential for expanding our work to other cities. Focusing on climate data that are specific for NYC might improve the understanding of the spatio-temporal behavior of the CDSV through, for example, increased spatial resolution and accounting for local events that might have been missing from the NRI. Similar considerations might be valid for the socio-vulnerability dataset used in our work, selected also because it is consistent with the one used within the FEMA NRI dataset—and performing a new analysis of CDSV values with alternative datasets would be a useful exercise to understand the robustness of our results.
The assessment of our results in terms of margins of error (MOE) has not been performed in view of the absence of MOEs with the currently available FEMA NRI. This is a crucial aspect that needs to be accounted for to better quantify the robustness of our results. The FEMA NRI team is currently working to build this, and preliminary validation is underway using historical period (Casey Zuzak, Pers. Comm.) We suggest that the results reported in this work might be relatively robust in terms of errors, given that most of our analysis is focused on the areas with the top CDSV values.
We have used a linear unweighted approach to combine the climate, socio-vulnerability and displacement factors. We adopted this method in the absence of other information that could suggest how to compute the weights for a weighted-based approach. Our choice was also driven by our interest in understanding the relative role of each of the three factors on the final score (e.g., we did not want to introduce bias weights on the relative role). Nevertheless, using a weighted approach might be helpful to account for the linkages between displacement and socio-vulnerability. In this regard, it is to better understand the specific methods used to generate the displacement index to untangle the relationships between this index and socio-vulnerability indicators. An alternative might also be represented by the use of machine-learning (ML) approaches to better elucidate the relationships among the different variables here considered.
5. Conclusions
We have developed a Climate, Displacement and Socio-Vulnerability (CDSV) score for multiple climate hazards (coastal and riverine flooding, heatwaves, hurricanes and winter weather) over New York City. Following [13], we have built our scores on publicly available datasets provided by FEMA, by the NYC Dept. of City Planning and by the University of South Carolina. To our knowledge, this is the first time that a multi-hazard score combining the three aspects of climate, displacement and socio-vulnerability is developed and discussed for NYC. We have discussed the relative contribution of each term to the total score over the different areas of NYC and studied how socio-economic and demographic conditions have changed starting in 2000 for those areas where the compounding effect of multiple climate hazards is the highest. Such areas are located in the South Bronx, South Brooklyn and Queens. We have also quantified linkages between the CDSV scores for the different climate hazards and health, as well as racial/ethnic indicators. Specifically, we have looked at the correlation between the CDSV scores with the median values of the percentage of Black, White and Latin/Hispanic people and with the number of adults diagnosed with asthma and diabetes (in the case of heatwaves). Our results indicate that, with the exception of the case of coastal flooding, the percentage of White people decreases as CDSV scores increase where the percentage of Black and Latin/Hispanic people increases, with the latter showing the strongest correlation. Our results also show a statistically significant relationship between the median number of people with asthma and diabetes and the CDSV score in the case of heatwaves.
We have also shown that the population exposed to the combination of climate hazards, displacement and socio-vulnerability has been increasing over the past decades because of changes in socio-demographic factors where CDSV shows the highest values. We found a strong correlation between people belonging to specific racial and ethnic groups and the combined effects of the three factors accounted for in the scores, highlighting the racial reverberations of climate change impacts on those groups who are already carrying the burden of social and racial segregation. This is also true for illnesses such as asthma and diabetes, reinforcing the inter-generational climate justice aspect of climate change, with areas where the combined impacts are greater being home to a high number of ill people.
Our next steps include the extension of the score to other hazards, a sensitivity analysis using different socio-vulnerability data (e.g., CDC SVI, https://www.atsdr.cdc.gov/placeandhealth/svi/index.html (accessed on 13 December 2023)) and the use of machine learning tools to better capture potential linkages between climate, displacement and socio-vulnerability indicators. Meanwhile, we strongly encourage policy makers, city planners and organizations to make use of our results to take prompt action to address climate change as a social justice and health issue and not only from a geophysical perspective.
Supplementary Materials
The following supporting information can be downloaded at: https://www.mdpi.com/article/10.3390/su16010042/s1.
Author Contributions
Conceptualization, M.T., S.F. and A.B.; methodology, M.T.; software, M.T.; formal analysis, all authors; investigation, all authors; writing—original draft preparation, M.T.; writing—review and editing, all; All authors have read and agreed to the published version of the manuscript.
Funding
This research received no external funding.
Institutional Review Board Statement
Not applicable.
Informed Consent Statement
Not applicable.
Data Availability Statement
Data used in this study can be obtained upon request from Tedesco, mtedesco@ldeo.columbia.edu.
Acknowledgments
We would like to thank the Editor and anonymous reviewers for improving the manuscript.
Conflicts of Interest
The authors declare no conflict of interest.
References
- Stoutenburg, J.G. Jane McAdam (ed.), Climate Change and Displacement. Multidisciplinary Perspectives. Eur. J. Int. Law 2011, 22, 1196–1200. [Google Scholar] [CrossRef]
- Marandi, A.; Main, K.L. Vulnerable City, recipient city, or climate destination? Towards a typology of domestic climate migration impacts in US cities. J. Environ. Stud. Sci. 2021, 11, 465–480. [Google Scholar] [CrossRef] [PubMed]
- Aune, K.T.; Gesch, D.; Smith, G.S. A spatial analysis of climate gentrification in Orleans Parish, Louisiana post-Hurricane Katrina. Environ. Res. 2020, 185, 109384. [Google Scholar] [CrossRef] [PubMed]
- Keenan, J.M.; Hill, T.; Gumber, A. Climate gentrification: From theory to empiricism in Miami-Dade County, Florida. Environ. Res. Lett. 2018, 13, 054001. [Google Scholar] [CrossRef]
- Agrawal, A.; Redford, K. Conservation and Displacement. Conserv. Soc. 2009, 7, 1–10. [Google Scholar] [CrossRef]
- Hunter, L.M.; Koning, S.; Fussell, E.; King, B.; Rishworth, A.; Merdjanoff, A.; Muttarak, R.; Riosmena, F.; Simon, D.H.; Skop, E.; et al. Scales and sensitivities in climate vulnerability, displacement, and health. Popul. Environ. 2021, 43, 61–81. [Google Scholar] [CrossRef]
- Hiraide, L.A. Climate refugees: A useful concept? Towards an alternative vocabulary of ecological displacement. Politics 2022, 43, 267–282. [Google Scholar] [CrossRef]
- Miller, J.T.; Vu, A.T. Emerging research methods in environmental displacement and forced migration research. Geogr. Compass 2021, 15, e12558. [Google Scholar] [CrossRef]
- de Sherbinin, A.; Levy, M.; Adamo, S.; MacManus, K.; Yetman, G.; Mara, V.; Razafindrazay, L.; Goodrich, B.; Srebotnjak, T.; Aichele, C.; et al. Global Estimated Net Migration Grids by Decade: 1970–2000; NASA Socioeconomic Data and Applications Center (SEDAC): Palisades, NY, USA, 2015. [Google Scholar] [CrossRef]
- Rising, J.; Tedesco, M.; Piontek, F.; Stainforth, D.A. The missing risks of climate change. Nature 2022, 610, 643–651. [Google Scholar] [CrossRef]
- Nayak, S.; Shrestha, S.; Kinney, P.; Ross, Z.; Sheridan, S.; Pantea, C.; Hsu, W.; Muscatiello, N.; Hwang, S. Development of a heat vulnerability index for New York State. Public Health 2018, 161, 127–137. [Google Scholar] [CrossRef]
- Malakar, K.; Mishra, T. Assessing socio-economic vulnerability to climate change: A city-level index-based approach. Clim. Dev. 2017, 9, 348–363. [Google Scholar] [CrossRef]
- Tedesco, M.; Keenan, J.M.; Hultquist, C. Measuring, mapping, and anticipating climate gentrification in Florida: Miami and Tampa case studies. Cities 2022, 131, 103991. [Google Scholar] [CrossRef]
- Freitas, C.R.; D’avignon, A.L.d.A.; Castro, A.C. Urban social vulnerability and climate change in Rio de Janeiro city associated with population mobility. J. Environ. Policy Plan. 2019, 21, 797–810. [Google Scholar] [CrossRef]
- Balica, S.F.; Wright, N.G.; Van Der Meulen, F. A flood vulnerability index for coastal cities and its use in assessing climate change impacts. Nat. Hazards 2012, 64, 73–105. [Google Scholar] [CrossRef]
- Johnson, D.P.; Stanforth, A.; Lulla, V.; Luber, G. Developing an applied extreme heat vulnerability index utilizing socioeconomic and environmental data. Appl. Geogr. 2012, 35, 23–31. [Google Scholar] [CrossRef]
- Reckien, D. What is in an index? Construction method, data metric, and weighting scheme determine the outcome of composite social vulnerability indices in New York City. Reg. Environ. Chang. 2018, 18, 1439–1451. [Google Scholar] [CrossRef]
- Keenan, J.M.; Bradt, J.T. Underwaterwriting: From theory to empiricism in regional mortgage markets in the U.S. Clim. Chang. 2020, 162, 2043–2067. [Google Scholar] [CrossRef]
- Anderson, G.B.; Oleson, K.W.; Jones, B.; Peng, R.D. Projected trends in high-mortality heatwaves under different scenarios of climate, population, and adaptation in 82 US communities. Clim. Chang. 2018, 146, 455–470. [Google Scholar] [CrossRef]
- Cutter, S.L. The Role of Vulnerability Science in Disaster Preparedness and Response. 2005. Available online: https://www.researchgate.net/publication/268289781_The_Role_of_Vulnerability_Science_in_Disaster_Preparedness_and_Response (accessed on 13 December 2023).
- Cutter, S.L.; Boruff, B.J.; Shirley, W.L. Social Vulnerability to Environmental Hazards. Soc. Sci. Q. 2003, 84, 242–261. [Google Scholar] [CrossRef]
- Beccari, B.; Frison, S.; Smith, J.; Blanchet, K. A Comparative Analysis of Disaster Risk, Vulnerability and Resilience Composite Indicators. PLoS Curr. 2016, 8. [Google Scholar] [CrossRef]
- Zhou, P.; Ang, B.W. Comparing MCDA Aggregation Methods in Constructing Composite Indicators Using the Shannon-Spearman Measure. Soc. Indic. Res. 2009, 94, 83–96. [Google Scholar] [CrossRef]
- Abson, D.J.; Dougill, A.J.; Stringer, L.C. Using Principal Component Analysis for information-rich socio-ecological vulnerability mapping in Southern Africa. Appl. Geogr. 2012, 35, 515–524. [Google Scholar] [CrossRef]
- Sillmann, J.; Aunan, K.; Emberson, L.; Bueker, P.; Van Oort, B.; O’neill, C.; Otero, N.; Pandey, D.; Brisebois, A. Combined impacts of climate and air pollution on human health and agricultural productivity. Environ. Res. Lett. 2021, 16, 093004. [Google Scholar] [CrossRef]
- Wu, J. Advances in K-Means Clustering: A Data Mining Thinking; Springer: Heidelberg/Berlin, Germany, 2012. [Google Scholar]
- Nuzzo, R.L. The Box Plots Alternative for Visualizing Quantitative Data. PM&R 2016, 8, 268–272. [Google Scholar] [CrossRef]
- Madrigano, J.; Ito, K.; Johnson, S.; Kinney, P.L.; Matte, T. A Case-Only Study of Vulnerability to Heat Wave–RelatedMortality in New York City (2000–2011). Environ. Health Perspect. 2015, 123, 672–678. [Google Scholar] [CrossRef] [PubMed]
- Shi, L.; Fisher, A.; Brenner, R.M.; Greiner-Safi, A.; Shepard, C.; Vanucchi, J. Equitable buyouts? Learning from state, county, and local floodplain management programs. Clim. Chang. 2022, 174, 29. [Google Scholar] [CrossRef] [PubMed]
- McGhee, D.J.; Binder, S.B.; Albright, E.A. First, Do No Harm: Evaluating the Vulnerability Reduction of Post-Disaster Home Buyout Programs. Nat. Hazards Rev. 2020, 21, 05019002. [Google Scholar] [CrossRef]
- Elliott, J.R.; Wang, Z. Managed retreat: A nationwide study of the local, racially segmented resettlement of homeowners from rising flood risks. Environ. Res. Lett. 2023, 18, 064050. [Google Scholar] [CrossRef]
- Shokry, G.; Anguelovski, I.; Connolly, J.J.T.; Maroko, A.; Pearsall, H. “They Didn’t See It Coming”: Green Resilience Planning and Vulnerability to Future Climate Gentrification. Hous. Policy Debate 2022, 32, 211–245. [Google Scholar] [CrossRef]
- Triguero-Mas, M.; Anguelovski, I.; Connolly, J.J.T.; Martin, N.; Matheney, A.; Cole, H.V.S.; Pérez-Del-Pulgar, C.; García-Lamarca, M.; Shokry, G.; Argüelles, L.; et al. Exploring green gentrification in 28 global North cities: The role of urban parks and other types of greenspaces. Environ. Res. Lett. 2022, 17, 104035. [Google Scholar] [CrossRef]

Disclaimer/Publisher’s Note: The statements, opinions and data contained in all publications are solely those of the individual author(s) and contributor(s) and not of MDPI and/or the editor(s). MDPI and/or the editor(s) disclaim responsibility for any injury to people or property resulting from any ideas, methods, instructions or products referred to in the content. |
© 2023 by the authors. Licensee MDPI, Basel, Switzerland. This article is an open access article distributed under the terms and conditions of the Creative Commons Attribution (CC BY) license (https://creativecommons.org/licenses/by/4.0/).