Article

Sustainability Unleashed through Innovation: Knowledge-Driven Strategies Igniting Labor Productivity in Small- and Medium-Sized Engineering Enterprises

1
Faculty of Business and Engineering Management, Sir Syed CASE Institute of Technology, Islamabad 44000, Pakistan
2
Business and Hospitality, Torrens University, Adelaide, SA 5000, Australia
*
Author to whom correspondence should be addressed.
Sustainability 2024, 16(1), 424; https://doi.org/10.3390/su16010424
Submission received: 2 October 2023 / Revised: 11 December 2023 / Accepted: 24 December 2023 / Published: 3 January 2024

Abstract

:
This research is focused on knowledge-based performance drivers, which are often intertwined with intellectual capital (IC); specifically, the value-added intellectual coefficient (VAIC) and its profound influence on labor productivity (LP), with the pivotal inputs of training and research and development (R&D) as moderating, in the realm of small- and medium-sized (engineering) enterprises (SMEs). The aim is to offer this as a sustainable model for practical implementation to empower engineering managers, donors, and policy researchers. The motivation catalyzes more informed decision-making investing in human or structural capital. It attempts to foster sustainable growth and societal stability through job creation within the knowledge-intensive engineering sector of developing countries. Methodologically, the research draws upon statistical analysis, employing Pearson’s correlation, multivariate regression, and model testing executed through specialized statistical software. The World Bank Enterprise Survey Instrument was used to collect data on 213 aviation-related firms. Primary data were collected for the years 2013–2022. Several hypotheses were developed between the variables expected to relate positively, because intellectual capital, training, and research and development should lead to better labor productivity. The findings revealed the critical issue of the misallocated investments in structural capital that this model brought forth. Furthermore, the notable contribution to national intellectual capital (NIC) studies is the significant VAIC value of 4.58 and an impressive labor productivity value of 6.78 within the knowledge-intensive ecosystem of SMEs. More insightful findings were the modest 17% positive variation attributable to the VAIC on LP, accompanied by an absence of significant influence exerted by training and R&D on this relationship. While underscoring the model’s overall validity, this intriguing discovery emphasizes the impact of intangibles on knowledge firms’ overall sustainability calculations, specifically structural capital, which accounts for a substantial 31% of labor productivity. The practical implication is that this model can be used to expose long-term financial performance hiccups through intellectual capital measures. The novelty is employing the labor productivity metric sourced from the engineering literature instead of the customary asset productivity (ATO) ratio from the IC literature.

1. Introduction

Knowledge-based performance drivers (KBPDs), often referred to as intellectual capital (IC) [1], encompass specific attributes that contribute to sustained performance and labor productivity through value-added activities within small- and medium-sized enterprises (SMEs) in developing countries. The central research posits that knowledge-intensive firms may struggle to achieve long-term sustainability in developing countries despite investments in crucial areas, such as human capital, structural capital, research and development (R&D), and training.
Low Human Development and Global Innovation Index scores are closely interrelated in developing countries [2,3]. The consequence is that knowledge-intensive firms in these nations face a significant challenge: the inability to compete effectively due to the lack of skill development and knowledge acquisition [4]. This deficiency [5] ultimately results in reduced performance and productivity, with dire consequences for developing societies.
Small- and medium-sized enterprises (SMEs) are major job creators in the developing world [6], so research into this category of organization is highly sought after.
Since the motivation is to find solid reasons why knowledge SMEs are underperforming in the developing world despite the hard-earned investments in the critical inputs of human capital, structural capital, training, and research and development, this research is a step toward a sustainable society.
Here, it must be mentioned that even developed societies require corporate social responsibility–knowledge (CK) in their firms to last long term. CK is a flatter structure, while open communication, relationship capital, and trust within and outside are all intangibles [7,8]. An example is the consistent CK record of Blackstone Group, which is what protected the asset giant in crises.
Coming back to the frame of emerging nations, knowledge-based performance drivers, including research and development (R&D) and training, play pivotal roles in a knowledge-driven economy [9]. Other critical factors contributing to performance and productivity in knowledge-intensive settings encompass information and communication technology (ICT), innovation, networking, education, skill development, absorptive capacity, access to market information, and technological advancements. These elements constitute subsets of human, structural, and financial capital. These knowledge-based performance drivers significantly enhance human capital (HC), structural capital (SC), and employed capital (CE) [10].
Moreover, it is worth noting that HC, SC, and CE represent components of intellectual capital, which, in turn, serves as a vital element within the value-added intellectual coefficient (VAIC). Notably, the VAIC serves as a performance efficiency metric [11,12] that effectively captures the knowledge-based performance drivers prevalent in knowledge-intensive firms.
When we delve deeper into the context, the value-added intellectual coefficient (VAIC), focusing on knowledge-based performance drivers impacting labor and capital productivity becomes comparable to labor productivity (LP). This comparison offers insights into the effectiveness of these drivers in optimizing the overall productivity.
In the context of developing countries, engineering firms represent an ideal microcosm for the study of knowledge management [13]. These entities serve as fertile grounds for productivity and employment. Furthermore, enhancing the performance and productivity in knowledge-intensive engineering firms necessitates establishing conducive organizational systems [14] that foster the growth of intellectual capital.
R&D is still valid today in the innovative industry 4.0 [15] and fintech [16] of developing countries because it sometimes reveals a paradox [17]. Similarly, the validity of the training variable needs to be scrutinized because it holds interest for engineering managers who are already on a tight budget.
The significance of this research lies in revealing that incorrect investments in structural capital, R&D, and training jeopardizes long-term sustainability. The presentation of specific numerical values for intellectual capital performance and labor productivity within the knowledge sector is of particular significance and an effort that has yet to be accomplished. This research addresses the puzzling issue of why critically essential inputs, such as human capital, structural capital, employed capital, training, and R&D [18], fail to translate into the sustainability of firms. Without firms performing efficiently and being productive, creating jobs becomes an insurmountable challenge. The novelty of this research lies in departing from the usual practice of measuring productivity using asset turnover (ATO), which may not be the most suitable metric when human elements are involved. Instead, this study employs the labor productivity metric commonly used in engineering firms.
The research scope aims to augment the existing, albeit limited, body of knowledge in national intellectual capital (NIC) studies within a developing country’s knowledge-intensive SME sector of aviation engineering. To clarify further, the primary research domain that comes to the fore is knowledge productivity, within which knowledge management (KM) and intellectual capital are integral components. Additionally, this research emphasizes the investigation of intellectual capital and its impact on firm performance and labor productivity.
Therefore, the primary objective is to identify the precise knowledge attributes that foster improved firm performance, heightened productivity, and enhanced value addition within a developing nation such as Pakistan.
The research questions addressed in this research are:
(a)
What constitutes the accurate metrics for knowledge-based performance drivers (KBPDs)? The prevailing challenge resides in the existence of multiple pivotal variables within knowledge management (KM) and several theoretical models available for selection, contingent upon the contextual requirements, aimed at achieving knowledge-based performance and productivity. For instance, critical KM variables, such as technology, structure, and organizational culture [19], do not necessarily align directly with performance enhancement for value creation. Furthermore, various theoretical models [20] regarding knowledge productivity are available in the literature. Consequently, identifying the precise variables associated with value addition, performance, productivity, and intellectual capital is paramount for researchers.
(b)
How do human capital, structural capital, and employed capital contribute to labor productivity, particularly in the presence of essential inputs from research and development (R&D) and training? While this question has been scrutinized in the context of small- and medium-sized enterprises (SMEs) within developing countries, and amid the backdrop of industry 4.0 [21], these evaluations have predominantly emanated from the vantage points of the Human Capital Index [22] and the innovation perspective [23]. However, this inquiry needs to be thoroughly examined from the lens of intangible and financial productivity and performance.
(c)
How does the model governing the inputs of intellectual capital (encompassing structural capital, human capital, and employed capital) impact labor productivity, particularly in moderating factors like R&D and training? Given the significance of this question to engineering managers and capital investors, numerous researchers have endeavored to simplify firms’ potential utilization of knowledge through their unique models [24].
The primary contribution of this research lies in its significant advancement of the field of national intellectual capital (NIC) studies by assigning concrete values to the value-added intellectual coefficient and labor productivity within the context of critical knowledge-based SMEs, specifically within the aviation ecosystem. This multifaceted ecosystem encompasses the aerospace, electronics, electrical fabrication, assembly, R&D, and engineering design sectors in a developing country. The uniqueness of this research manifests through its exploration of the previously uncharted territory of comparing the dimensions of labor productivity with intellectual capital in this manner. Moreover, this research claims a more extensive sample size, a greater diversity within knowledge-intensive engineering SMEs, the incorporation of pivotal variables, and cluster representation. These attributes set it apart from a study coauthored by Dr. Bontis [25], conducted within the pharmaceutical sector and the single-cluster electric/electronic industry [26]. Typically, labor productivity (LP) studies have remained confined to the construction sector; however, this research effectively transcends these boundaries.
The content outline of this study is thoughtfully structured, commencing with an exhaustive literature review that systematically extracts the cornerstone variables and the attributes related to knowledge productivity from the domains of knowledge management and intellectual capital research. These variables are expected to wield significant influence over both performance and productivity. Subsequently, a conceptual framework is introduced, highlighting a critical gap in the existing body of knowledge concerning intellectual capital and firm performance. This research proceeds with collecting primary data, meticulously gathered through a rigorously validated instrument, from an eventual pool of 70 knowledge-intensive aviation engineering SMEs. The ensuing data analysis employs robust statistical methods, including regression, correlation, and descriptive statistics, ultimately revealing significant findings that contribute to the body of knowledge in this field.
In summary, this research explores knowledge-based performance drivers (KBPDs) and intellectual capital in SMEs in developing countries, focusing on their impact on sustainability. It is motivated by the challenge of low Human Development and Innovation indices, hindering competitiveness due to skill and knowledge gaps. Key performance drivers, including R&D and training, are investigated, with a link between intellectual capital and the value-added intellectual coefficient (VAIC) being explored. Engineering firms in developing nations serve as a microcosm for understanding knowledge management. The study introduces specific numerical values for intellectual capital performance and labor productivity, addressing a critical gap in knowledge.

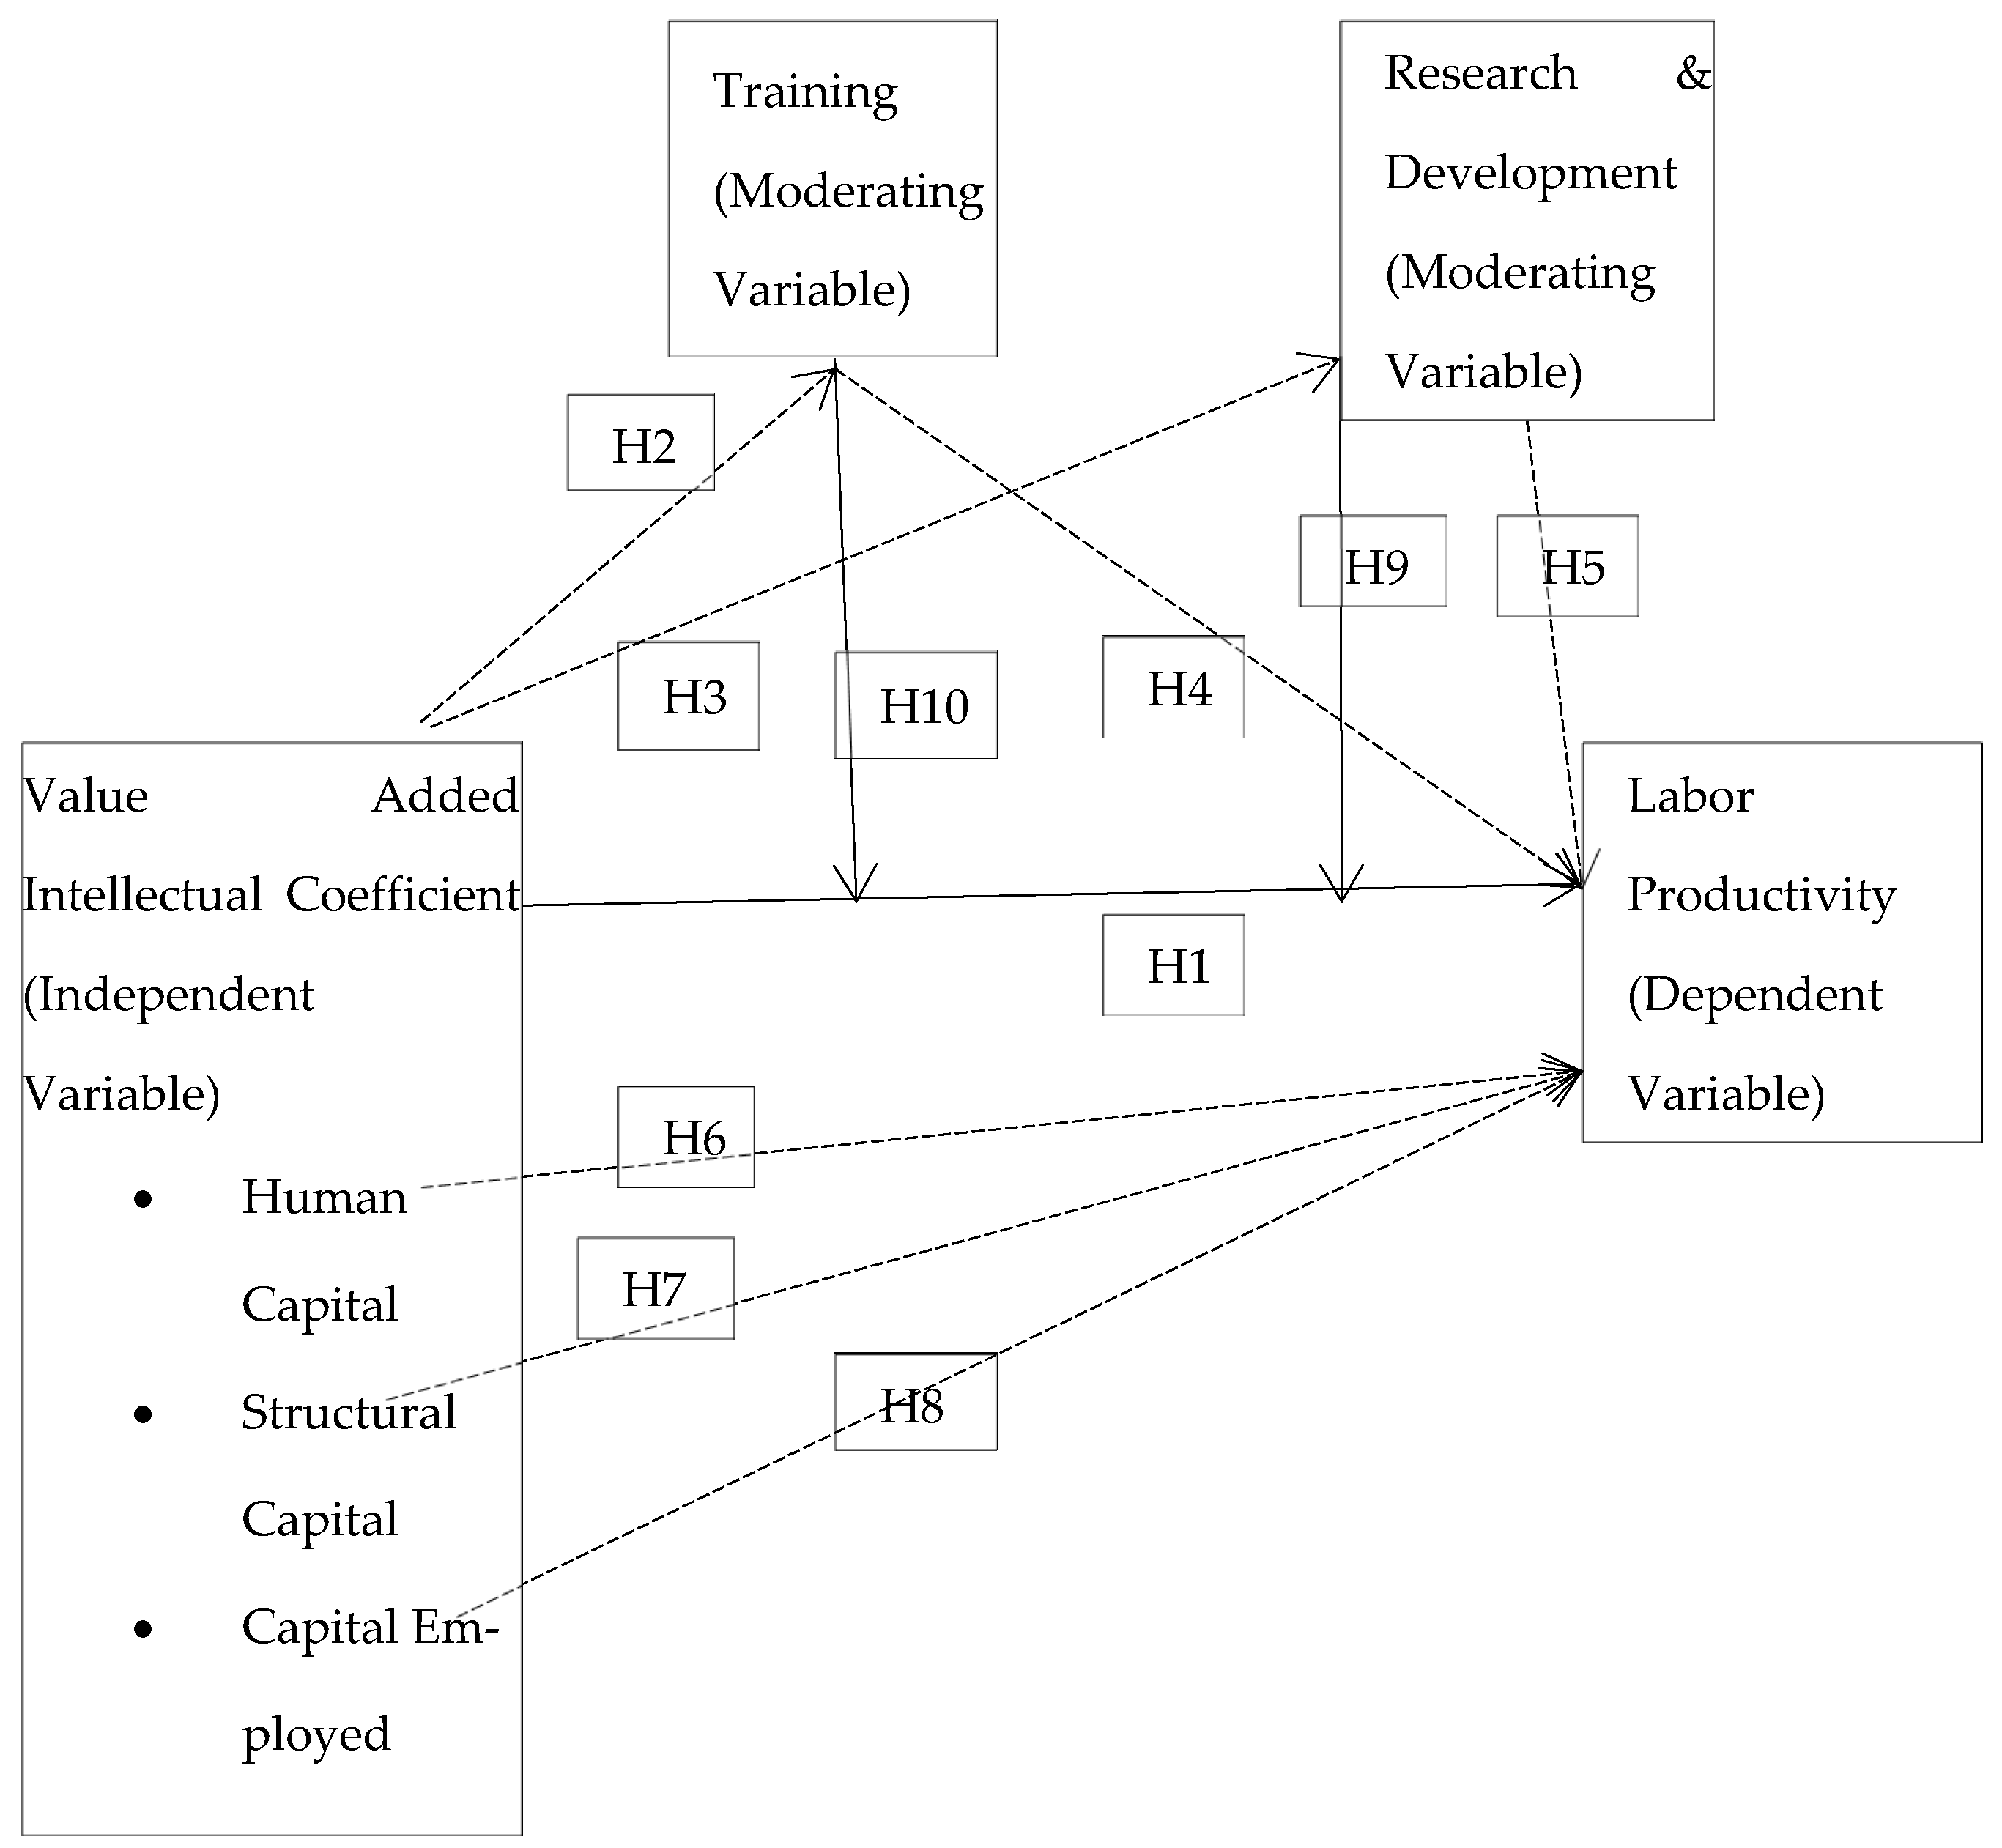
2. Theoretical Framework

Value creation represents the ultimate goal for knowledge firms, as articulated by the public [27]. In the context of knowledge, value is intricately linked to the efficient utilization of intellectual capital, a concept central to our study. The efficient utilization of intellectual capital is paramount for enhancing performance and productivity within knowledge-intensive firms, driving them toward sustained success. Key parameters prevalent in the knowledge management and intellectual capital literature need to be defined to establish a solid foundation for the research and bridge the gap in the existing literature. These parameters help frame the context in which knowledge management (KM) is pivotal in organizational knowledge and value-creation processes [28]. Furthermore, intellectual capital (IC) is a crucial metric for measuring knowledge-based outcomes. The research delves into the concept of knowledge productivity (KP), which encompasses identifying, absorbing, and applying knowledge to enhance capabilities and innovate operational processes, products, and services. This process inherently relies on intellectual capital, positioning KM and IC as integral components of KP. As posited by Svieby [29], knowledge management embodies the essence of intellectual capital [1]. While knowledge studies encompass critical factors like information and communication technology (ICT), innovation, networking, education, skill development, absorptive capacity, market information, quality, and technology, the research focuses on those factors directly contributing to intellectual capital, performance, and productivity. Just the absorptive capacity of a firm and its interaction with R&D and innovation [30] has the potential to reveal long-term firm sustainability. By focusing on critical factors around the knowledge worker, this study aims to shed light on the intricate relationship between these concepts and their significant impact on knowledge-intensive firms. This elucidation serves as the foundation for the subsequent exploration of knowledge-based performance drivers (KBPDs) and their role in firm sustainability.

2.1. Underlying Theory and Gap

There has always been a debate about introducing “Design theory”, which involves prescription-driven results, into engineering management, and this research is an effort in that direction [31].
Figure 1 shows that knowledge performance is part of design-based research (DBR) [32] and is being used in tandem with the resource-based view (RBV) theory. DBR is “a systematic yet flexible methodology that improves practices through analysis, design, development, and implementation” [33]. Meanwhile, resource-based view (RBV) is the intangible nonsubstitutable realm of knowledge performance by labor [34]. (Intangible assets include human capital, goodwill, brand recognition, IPRs, patents, trademarks, copyrights, and knowledge gained from systematic R&D, and training. Knowledge itself is an intangible asset, and so is intellectual capital. On the other hand, tangible assets are land, vehicles, equipment, and inventory, but not finances. Finances are financial assets). DBR and RBV have also been used together in research [35].
The concept of Knowledge Productivity [36] is a crucial link to the resource-based view (RBV) in the context of this research. Knowledge productivity revolves around efficiently utilizing knowledge and intellectual capital within an organization to enhance its performance and productivity. Given this, RBV is a well-established theory that focuses on the fact that competition is a derivate of valuable resources. In essence, this research bridges the gap between knowledge productivity, as highlighted by Stam 2007, and the resource-based view theory, offering empirical evidence on how knowledge and intellectual capital can drive superior firm performance and productivity, aligning with the core principles of RBV.

2.2. Analysis of Relevant Literature

Literature references in Table 1 relate to techniques for measuring IC, and Table 2 relates to previous significant studies on the VAIC, LP, R&D, and training used together.

2.3. Studies on VAIC, LP, R&D, and Training

The information in Table 2 explains significant studies on the VAIC, LP, R&D, and training, the primary focus of the framework under research.

2.4. The Relationship between the VAIC with Labor Productivity, R&D, and Training

Now that the specific area of the proposed research has been identified as intellectual capital, VAIC, LP, training, and R&D, further motivation to use these variables must be discussed.
The value-added intellectual coefficient is a firm performance measuring tool previously used in the service sector [53]. However, due to its intellectual capital component, it is also being used in technical engineering firms [54].
Then, the VAIC not only captures the performance of a knowledge-intensive firm, but it also has labor as a major component [55], as indicated in Pulic’s definition of the VAIC:
“Defined simply as value added divided by Intellectual Capital. Value Added is the difference between sales and all inputs, except labor expenses.”
[48]
Alternatively, labor productivity is the ratio of the total output (goods or services) to the number of person-hours that produce the output. No significant study compared the VAIC with labor productivity, because one definition of LP is limited to the construction literature stream [56]. Various researchers [57] in the knowledge-intensive firms’ performance field have recently compared labor productivity with intellectual capital and coined it as value-added productivity [58], but not necessarily in the engineering sectors.
Moving ahead, human capital, structural capital, and new technologies that are critical factors in IC and VAIC, are also part of the numerators and denominators in the labor productivity formula, so investigating this relationship makes sense.
Now, coming to the VAIC’s benefits:
  • The VAIC uses audited secondary data, most of which are publicly available and authentic.
  • It measures knowledge-based performance drivers, which are synonymous with the intellectual capital efficiency (ICE).
  • It measures the firm performance and gives a finite value to be compared inter- and intrapopulation.
  • The VAIC defines R&D and training as fundamental performance drivers.
  • The VAIC measures the efficiency of intellectual and financial capital, which is a bonus.
Structural capital, on the other hand, is the supportive infrastructure for human capital [59]. Correlation and regression results on the human (or labor) critical attributes of IC will help further firm performance studies.
Lastly, although R&D and training, a well-researched area of intellectual capital [48], can be covered under human capital (HC), this model’s explanatory power increases when R&D funding and training are kept as moderating variables.
In conclusion, the selection of variables, such as intellectual capital, the VAIC, labor productivity, training, and R&D, is underpinned by their significance in evaluating the performance and productivity of knowledge-intensive firms. The VAIC’s adaptability from the service to technical engineering sectors, its alignment with labor components, and its capacity to measure knowledge-based performance drivers make it a compelling choice. Furthermore, the inclusion of human capital, structural capital, and technological factors within labor productivity analysis strengthens the research’s foundation. Lastly, recognizing the role of R&D and training as moderating variables enhances the model’s explanatory power.
Figure 2 explains and summarizes the theoretical framework:

2.5. Research Gap

As indicated in Pulic’s definition of the VAIC, the research gap in this field is that the labor dimension of intellectual capital performance studies has not been researched extensively, especially on the national intellectual capital (NIC) level. Furthermore, the research could improve the IC framework by combining capital information with R&D and performance metrics for various industries and countries. Also, alternative research methodologies may be considered, like surveys or case studies on the organizational and contextual specific variables influencing the relationship between IC and efficiency, financial performance, and nonfinancial performance [60].
The most important thing is what needs to be investigated or what motivates firms to want to measure their intellectual capital. Secondly, does the company management believe the labor and capital markets will respond favorably to better reports on firm IC? Lastly, is better reporting on IC likely to favorably impact productivity and improve efficiency [61]?
Then, a review of 3500 high-quality journal papers [62] concluded that national intellectual capital studies (NIC) is a research gap, highlighting that:
(a)
Rembe and Israel initially performed NIC in Sweden in 1999. Later on, IC assessments were followed in Denmark and Norway by Malhotra in 2003. In 2004, Bontis modified the components of IC from an organizational level to a national level (NIC).
(b)
Fifty-one per cent of the studies readopted the concepts of other authors; twenty-eight per cent developed a new concept, and twenty-one per cent did not refer to any mentioned multiple concepts. The concept of IC is chiefly adopted at the organizational level, followed by the regional and national levels.
(c)
A total of 13.5% of all studies used the VAIC.
(d)
A total of 11 of a group of 777 studies involved the NIC.
OECD (2011, 2013, and 2016) studies highlight that investment in intangible assets has contributed to the increase in labor productivity in developed economies, such as the United States (USA), Japan, and the European Union (EU). Furthermore, the World Bank estimates that most of these nations derive most of their wealth from intellectual capital. The proposed research might reveal some valuable and unexpected insights into intangibles and financial assets in the context of a developing country.
Therefore, this link between labor productivity and intellectual capital has to be investigated at the NIC level, especially in developing societies.

3. Methodology

Figure 3 provides the conceptual framework:
A rigorous authentication process was undertaken to validate the conceptual framework for this study. An extensive literature review was conducted to align the framework with established theories and concepts in the field. Additionally, feedback from subject matter experts was sought, providing valuable insights into the framework’s appropriateness and relevance. These steps ensured that the framework accurately represented the underlying theory, constructs and definitions (Table 3), enhancing its validity and robustness for the study.
Table 4 provides further explanation of the VAIC.
Figure 4 explains how the VAIC is measured through IC efficiency and employed capital efficiency.
Labor productivity descriptions adapted from Sumanth, 1994; Hunnula, 2002; Kumar, 2006, are used, i.e.,
Total Productivity = Total Output (total sales)/Input (labor, material, fixed cap, working cap, energy, Overheads)
The labor productivity and VAIC values helped to develop a merit list of small- and medium-sized engineering enterprises for donors and engineering managers.
The following hypotheses were chosen to investigate the conceptual framework thoroughly.
Hypothesis 1.
The VAIC correlates positively with labor productivity.
Antihypothesis 1.
The VAIC does not significantly correlate positively with labor productivity.
Hypothesis 2.
The VAIC correlates positively with training.
Antihypothesis 2.
The VAIC does not significantly correlate positively with training.
Hypothesis 3.
The VAIC correlates positively with R&D.
Antihypothesis 3.
The VAIC does not significantly correlate positively with R&D.
Hypothesis 4.
Training correlates positively with labor productivity.
Antihypothesis 4.
Training does not significantly correlate positively with labor productivity.
Hypothesis 5.
R&D positively affects labor productivity.
Antihypothesis 5.
R&D does not significantly positively affect labor productivity.
Hypothesis 6.
HC correlates positively with labor productivity.
Antihypothesis 6.
HC does not significantly correlate positively with labor productivity.
Hypothesis 7.
SC relates positively to labor productivity.
Antihypothesis 7.
SC does not significantly relate positively to labor productivity.
Hypothesis 8.
CE relates positively to labor productivity.
Antihypothesis 8.
CE does not significantly relate positively to labor productivity.
Hypothesis 9.
R&D positively moderates the relationship between the VAIC and labor productivity.
Antihypothesis 9.
R&D does not significantly positively moderate the relationship between the VAIC and labor productivity.
Hypothesis 10.
Training positively moderates between the VAIC and labor productivity.
Antihypothesis 10.
Training does not significantly positively moderate the relationship between the VAIC and labor productivity.
Research Design: This research is a quantitative, descriptive, epistemological study using Pearson’s correlation, partial least squares (PLS) regression, and multivariate regression with model testing in the data analysis. The strategy of the research is akin to the Venkatraman, 1998 [68], “fit as moderating” scheme.
Knowledge-Intensive SME Criteria: Every country has its own SME classification criteria. SMEs were selected based on adapted criteria for uniformity in the proposed research. Table 5 explains the criteria:
Instrument: The World Bank’s Enterprise Survey (ES) instrument [69] was adapted (to collect specific data) for the value-added intellectual coefficient and labor productivity, keeping in view the data required for measuring intangibles, as mentioned in contemporary Bontis [70] and Blundell–Bond [71] instruments, and was circulated to firms that met the adapted SME criterion (Table 2). This instrument has a well-refined firm-level subsection that provides all the necessary inputs on performance and productivity [72,73,74].
Data: Primary data were acquired by collecting responses on the instrument form from the management [75] of the aviation engineering SME firms for 2013–2022, as is the usual practice in performance studies [72]. These data were refined by comparing them with secondary data from the annual financial statements that are publicly available online. The data collection type is related to assets, liabilities, and financial data.
Factor loadings and Cronbach’s alpha were calculated to test the reliability and validity. The Cronbach’s alpha reliability was 0.71 (>0.7 [76]). PLS was used to confirm the factor loadings score, which was greater than 0.6 (>0.5 [77]).
Use of Annual Financial Statements: The value-added intellectual coefficient, using authentic financial statements, is an effective way to measure the SME performance in a knowledge environment; the market capitalization method (MCM) does not provide this. This technique is precedented in a study [4] on the VAIC, market-to-book value, and corporate performance (return on assets, revenue growth, and employee productivity) for 4254 Taiwanese firms.
Population: These data represent the essential knowledge firms’ clusters in the aviation engineering (aerospace, electronics, electrical fabrication, assembly, R&D, and engineering design) ecosystem in Pakistan, i.e., Islamabad, Lahore, Wah, and Karachi.
Sampling Method: Cluster sampling was conducted on the aviation ecosystem firms’ clusters in Rawalpindi, Lahore, and Karachi.
Sample Size: The population size for knowledge-intensive, aviation-related SMEs registered with the Ministry of Production was 213, but only 87 companies responded with usable data. Data from 70 companies (32% of the population size plus some extra for rejections) provided a reasonable t-test, which was not significantly different from the z-test at a normal distribution.
Statistical Techniques: Table 6 defines the statistical techniques used.
The PLS technique, sometimes known as the “second-gen multivariate analysis” [78], allows investigators to examine an array of relationships simultaneously, a considerable advantage over first-generation multivariate analysis; therefore, it was chosen here.

4. Results and Discussion

In Figure 5, the plot of average value-added intellectual coefficient and labor productivity increase values for ten years for each firm shows reasonably healthy returns (>3.0 [79]) of 4.58 VAIC and 6.78 LP. Some firms have implausibly high returns >25.0, and have been removed from the descriptive calculations.
Considering the context of this study, the resultant graph of VAIC in Figure 5, seen in the context of Figure 6, shows relatively high intellectual capital efficiency.
Figure 6 shows the intellectual capital efficiency (ICE) vs. capital employed efficiency (CEE) for each firm averaged out for ten years. Both curves do not correspond, indicating that human capital, structural capital, and employed capital perform differently and require in-depth forensics.
Intellectual capital efficiency is consistently high for every firm compared to financial efficiency. This result means that intangibles form a significant part of the firms’ value addition, which includes human capital as a significant part. Emerging knowledge economies [34] are now focusing on this subdomain to acquire better leads on improving firm performance.
Moving forward, specific tables, PLS for hypothesis testing (Table 7), descriptive statistics (Table 8), Pearson’s correlation for the strength of the relationships (Table 9), and multivariate regression for the model testing (Table 10), were generated to draw inferences and findings.
Table 7. PLS regression results summary table and hypothesis not rejected/rejection.
IVMVDVLatent FactorX VarCumm X VarY VarCumm Y Var (R-Sq.)Adj R-Sq.SigHypothesis Not Rejected/Reject
VAIC LP1110.1690.1690.1680.000Not Rejected
VAIC-Trg1110.0120.0120.0110.003Not Rejected
VAIC-Rnd1110.0290.0290.0150.056Rejected
Trg-LP1110.030.030.0290.000Not Rejected
RnD-LP1110.0360.0160.0110.054Rejected
HC-LP1110.0430.0430.0420.005Not Rejected
SC-LP1110.310.310.3090.000Not Rejected
CE-LP1110.0140.0140.0120.008Not Rejected
VAICRndLP1110.1440.1440.130.053Rejected
VAICTrgLP1110.1840.1840.1830.058Rejected
Mean and standard deviations of independent and dependent variables are calculated to arrive at one value for each of VAIC and LP (increase).
Table 8. Descriptive statistics involving the main IV and DV.
NMinimumMaximumMeanStd. Deviation
VAIC7000.0329940697.084531608.187797769711.51223896556
LP7000.0431778951.2270765912.179026121210.88981383452
Table 9. The correlation matrix shows the strength of the relationship between variables.
VAICLPRnDTrgHCSC
VAICPearson’s correlation10.411 **0.0540.111 **−0.0360.227 **
Sig. (2-tailed) 0.0000.1560.0030.3480.000
N700700700700700700
LPPearson’s correlation0.411 **1−0.0600.174 **0.208 **0.557 **
Sig. (2-tailed)0.000 0.1130.0000.0000.000
N700700700700700700
RnDPearson’s correlation0.054−0.06010.383 **0.317 **0.148 **
Sig. (2-tailed)0.1560.113 0.0000.0000.000
N700700700700700700
TrgPearson’s correlation0.111 **0.174 **0.383 **10.306 **0.366 **
Sig. (2-tailed)0.0030.0000.000 0.0000.000
N700700700700700700
HCPearson’s correlation−0.0360.208 **0.317 **0.306 **10.605 **
Sig. (2-tailed)0.3480.0000.0000.000 0.000
N700700700700700700
SCPearson’s correlation0.227 **0.557 **0.148 **0.366 **0.605 **1
Sig. (2-tailed)0.0000.0000.0000.0000.000
N700700700700700700
CEPearson’s correlation0.0070.118 **0.0150.316 **0.154 **0.246 **
Sig. (2-tailed)0.8540.0020.6830.0000.0000.000
N700700700700700700
** Correlation is significant at 0.01 level.
Table 10. Multivariate testing shows a model with the VAIC leading to LP, while R&D and training moderate this relationship, which is valid in the engineering SMEs of a developing country.
ModelVariables EnteredVariables RemovedMethod
1Trg, VAIC, HC, CE, RnD, SC, VAIC_RnD, VAIC_TrgbEnter
Dependent Variable: LP
ModelRR SquareAdjusted R SquareStd. Error of the Estimate
10.653 a0.4270.4208.29242554979
ANOVAa
ModelSum of SquaresdfMean SquareFSig.
1Regression35,376.89884422.11264.3080.000 b
Residual47,516.14669168.764
Total82,893.044699
Coefficients
ModelUnstandardized CoefficientsStandardized CoefficientsTSig.
BStd. ErrorBeta
1(Constant)8.3610.498 16.7810.000
VAIC0.2950.0320.3129.0840.000
VAIC_RnD0.1250.0110.1272.2770.053
VAIC_Trg0.1540.0150.1601.8280.058
HC0.2340.0210.2231.3280.005
SC0.4570.0490.44310.7280.000
CE0.5790.0570.5242.0690.008
RnD0.2610.0220.2411.1970.054
Trg0.2540.0250.2480.9590.000
a. Dependent Variable: LP; b. Predictors: (Constant), Trg, VAIC, HC, CE, RnD, SC, VAIC_RnD, VAIC_Trg.
PLA is also relevant here [80], as this is applied research with models and interaction constructs.

4.1. Hypothesis Testing Results

Hypothesis testing results using partial least squares (PLS) regression have been tabulated in Table 7, but each result will be discussed here.
The H1 hypothesis is not rejected, which postulates that the VAIC positively correlates with labor productivity, as R2 is 0.000, and the variation in the VAIC explains 16.9% of the variation in LP.
Then, H2 hypothesis is also not rejected which postulates that the VAIC positively relates to Training. This deduction is due to the p-value being 0.003, with an R2 = 0.11, which means any change in the VAIC explains an 11% change in training. These results could mean that training needs to be adequately directed toward knowledge systems or financial efficiency.
Hypothesis 3, which postulates that the VAIC correlates positively with R&D, is rejected because the significance is 0.056. This shows that research funds need to enable knowledge workers to create value through intangibles or financial instruments.
H4 postulates that training positively relates to labor productivity, and has not been rejected. This deduction is because the p-value is 0.000 and the R2 is 0.029. This change in training explains the 29% variation in labor productivity, indicating that training funds help knowledge workers increase output with the same input.
H5 hypothesis is rejected because it says that R&D is positively related to labor productivity, as the p-value is 0.054 > 0.05 and the R2 is 0.011, which means that the variation in research explains just an 11% change in productivity, which is too low. This result could indicate that the resources dedicated to research may need to be increased or could be misdirected.
Furthermore, H6, which states at HC positively correlates to LP, is not rejected because the significance is 0.005, and a 4% change in LP explains the change in HC.
H7 is also not rejected, which means that SC relates positively to LP because the significance is 0.000. SC explains a high 31% change in LP, which indicates proficient procurement and usage of firms’ structural assets by knowledge workers.
H8, which says CE correlates positively with LP, is also not rejected, since the p-value is 0.008 and the R2 is 0.014. The change in CE is not explained by a major change in LP (1.4%)
The two main hypotheses, the VAIC correlates positively with LP, while the R&D moderates (H9) and training moderates (H10) have both been rejected, because the p-values are higher than 0.05, at 0.53 and 0.58, respectively. This shows that, although individual training contributes to LP while moderating between value creation and LP, neither R&D nor training affect the positive change in LP. The deduction is that this model of knowledge companies does not require investment in people and knowledge.

4.2. Descriptive Statistics

A mean score of 8.19 for the VAIC and 12.17 for LP (Table 8), with very high standard deviations of 11.5 and 10.88, respectively, is misleading due to unusual spikes in the data, as seen in Figure 5. Removing the unexplainable spike in the VAIC and LP values, the average VAIC of engineering firms comes out to be 4.58 and LP 6.78. The industry standard of the VAIC in Pakistan for banking is 3.05, and insurance is 4.05 [81].

4.3. Pearson’s Correlation

At a significance value of 0.01, the VAIC has a relationship with LP, Trg, and SC. The VAIC does not have a significant relationship with R&D and HC. The strength of the VAIC relationship was moderately positive with LP (r = 0.411) and less significantly positive with SC (r = 0.22). The VAIC with Trg was negligibly positive (r = 0.11). This result means that value addition and productivity have a markedly positive relationship, with the structure provided to knowledge workers a close second.

4.4. Multivariate Regression Model Testing

Overall, the VAIC, HC, SC, CE, VAIC_Trg, VAIC_R&D, Trg, and R&D model accounts for a significant (R2 = 0.427, p = 0.000) variance in LP. Individually, the VAIC, HC, SC, CE, and Trg can each explain the change in LP (p < 0.5), but not R&D (p = 0.054), VAIC_Trg (p = 0.053), and VAIC_R&D (p = 0.058). This result means that the kind of investment engineering managers are making in R&D does not explain changes in productivity, and neither does the VAIC when seen in conjunction with training and R&D. This could mean the investment in Trg and R&D are misdirected or are not required in engineering SMEs of this configuration.

5. Findings and Conclusions

5.1. Findings

The average VAIC value for Pakistan’s knowledge-intensive engineering SMEs (aerospace, electronics, electrical fabrication, assembly, and engineering design) is 4.58 (Figure 5), and the labor productivity increase from 2013 to 2022 is 6.78% per annum. In comparison, the overall VAIC value for nonfinancial firms is 4.913, and for India, it is 5.13 [82]. Furthermore, the overall LP value for Pakistan is a 1.3% increase per annum [83].
The value-added returns on intellectual capital in engineering SME firms in Pakistan are consistently higher than the value-added returns on employed capital (Figure 6).
The VAIC explains a 17% variation in LP, which is less-significantly positive (Table 7).
The VAIC (and its attributes, HC, SC, and CE) and moderating variables, training and R&D, explain changes in LP, except for R&D individually and R&D/training as moderating variables (Table 7).
SC and training explain a moderate positive variation in LP at 31% and 29%, respectively. HC explains a negligible 4% change in LP (Table 7).
The VAIC is correlated positively with LP (moderate), SC (less significant), and training (negligibly positive), but not with R&D and HC (Table 9).
Overall, the model of the VAIC (and its attributes, HC, SC, CE) corresponds to LP, while training and R&D are moderating, but not R&D individually (Table 9).
These findings explain the importance of intellectual capital, notably structural capital and training, in enhancing labor productivity within knowledge-intensive engineering SMEs. The positive correlation between the VAIC and LP highlights the value of intellectual capital management in driving productivity gains. However, the limited impact of R&D individually suggests the need for a holistic approach, with training and SC playing pivotal roles in achieving sustainable growth and productivity within this sector.

5.2. Conclusions

As the study’s conclusions, contributions, and implications are intimately related, they will be discussed in the same section.
In today’s time, knowledge-based performance drivers (KBPDs) are none other than the performance and productivity variables of intellectual capital, like human capital, structural capital, relationship capital, and employed capital. The first implication is, therefore, that it would be incorrect to assume that developing countries [84] that have yet to transition to a knowledge economy due to their typically low Human Development and Innovation Indices can do so without a constant focus on tacit productivity. Intellectual capital performance measurements apply to developing countries, even if they are not visible [85,86] in financial measurements. Therefore, this study adds to the growing literature on the national intellectual capital of crucial knowledge-intensive engineering SME industries in developing countries.
Additionally, labor productivity is closely related to intellectual capital, which is part of its definition. It is also more representative of human capital inputs and can be used as a valid IC performance metric. Researchers in emerging economies are exploring the integration of labor productivity into intellectual capital for the same reason [58]. This result is the second contribution to the existing literature.
The novelty of using the labor productivity metric, typically used in civil engineering literature, instead of the usual asset productivity (ATO) ratio from the intellectual capital firms’ performance literature, gives us better insight into nonfinancial human productivity and has not been performed before. Since the motivation of the research was to reveal practical results for engineering managers to best utilize human capital, this unique innovation in firm performance and intellectual capital study achieves just that. This crossover opens up an interesting way of furthering this model of research by involving more intellectual capital metrics and productivity metrics, like total factor productivity (TFP) [87].
The VAIC measures the intellectual capital efficiency and value addition, which are the primary measures of the sustainability of firms through knowledge-oriented activities. The third contribution is that value creation by directing investment towards human capital is likely the only guarantee of long-term sustainability. This conclusion may be why researchers in emerging economies compare human capital’s effect on performance [59] and productivity [88] instead of the complete spectrum of VAIC attributes: human capital, structural capital, relationship capital, and employed capital.
Although knowledge-intensive firms seem sustainable on paper, with a reasonably high VAIC performance value (4.58), a comparison with productivity numbers shows that this value addition does not lead to significantly higher productivity (17% strength or relationship). This result is despite a healthy LP growth rate per annum (6.78%) in this aviation ecosystem as compared to the overall country average of 1.3%. This result points to the deeper problem of not integrating intellectual performance measures with financial performance ones, thereby distorting the performance results, as Pulic [38] explained in knowledge-intensive industries. Hence, this model can help detect financial and value-added performance indicator distortions in the SMEs of developing countries of this configuration, which is also the fourth contribution.
The model of increasing firm performance (VAIC) and productivity (LP), while R&D and training are moderating, is marginally valid. However, R&D and training do not explain the changes in LP while moderating, although training does so individually. This result also points to the fact that engineering managers must invest training funds in human capital, leading to increased productivity. The practical contribution is for engineering management practitioners in developing countries to decide early on [89] in the firm lifecycle whether they desire exponentially increasing profits in the long term that come from the consistent direction of R&D and training funds towards the human capital (also called innovation [90]) or reaping low-hanging fruit as a production unit (and limiting the R&D and training funding). The theoretical contribution that R&D and training investments marked as innovation capital [91], and not focused on human capital, may be the reason for developing countries’ R&D paradox [84].
Furthermore, this model can be developed further by expanding it across countries [92] and industries to get a snapshot of the long-term sustainability of an SME ecosystem at that moment in time.
Even in geographical settings with underdeveloped innovation ecosystems, firm performance gain mostly comes from employed capital [93], not from intellectual capital, although not in this case. Therefore, practitioners may want to study the IC or CE versus performance data before deciding on investment in training or R&D.
Investigating the results further confirms that value addition through knowledge, especially the quality structure and training provided to employees, has a moderately positive effect on productivity. Conversely, productivity does not gain from investments currently being made in human capital and R&D. This paradox of R&D in knowledge-intensive firms has already appeared in some firms’ clusters in other nations, but not in engineering firms specifically—which is the fifth contribution to the literature.
Alternatively, this counterintuitive finding on human capital can only be explained by inappropriate investments in structure and training. At the same time, the quality of knowledge workers suffers in the context of engineering SMEs in Pakistan. This conclusion is a practical indication for engineering managers, policymakers, and donors interested in sustainable performance and productivity for developing countries.
Therefore, human capital, training, and research and development activities in knowledge-intensive SMEs in this developing country suffer from appropriate spending, which leads to profitability but not productivity.
The practical contribution is that both the value-added intellectual coefficient and labor productivity metrics can be used in tandem to form a merit list of knowledge-intensive engineering SMEs that are likely to succeed in the long term as a compendium for donors and engineering managers.
The final contribution is that, in developing countries with a nascent financial market ecosystem, the customary use of market capitalization values is not essential in determining the knowledge management potential of engineering firms; the VAIC and LP metrics used in tandem can provide reasonably accurate figures of performance and productivity.

5.3. Limitations

Although these implications and the contributions of this study can be utilized in developing country settings as a reference for researchers to build their own model, since the study is at the national intellectual capital level, the results can be fully utilized in cross-country and cross-industry settings when the study is built to that level.

5.4. Future Work

To enhance the explanatory value of the productivity variable, in future research, the following proven equations [94] may be used.
Q = ALαKβ.
Here, Q is the output in terms of the value; K is capital; L is the person-hours utilized by labor; α and β are elasticity symbols; A is the role of technology.
A functional variant of this equation can also be:
Y = ALα K β.
Here, Y is the value-added output.
Since the log function allows regression, applying log functions gives us a helpful productivity equation.
Ln A = −x = e−x = z.
Regressions run on these equations will help determine the elasticity of labor (L) and capital (K). The exponential function models the relationship between the dependent and independent variables.
In future research on national intellectual capital studies, with more resources available, the variables under study can be expanded to include return on assets (ROAs), return on equity (RoE), and asset turnover (ATO), which measure performance and productivity, respectively. Also, latent productivity results can be improved by measuring the total factor productivity (TFP) [95].

Author Contributions

Conceptualization, methodology, software, analysis, and data curation, W.I.K.; resources, M.O.M.; editing, and supervision, A.A. All authors have read and agreed to the published version of the manuscript.

Funding

This research received no external funding.

Institutional Review Board Statement

Not applicable.

Informed Consent Statement

Not applicable.

Data Availability Statement

Publicly available datasets were analyzed in this study. This data can be found here: http://ieee-dataport.org/documents/aviation-engineering-sme-ecosystem, accessed pm 1 October 2023.

Conflicts of Interest

The authors declare no conflicts of interest.

References

  1. Valuing Investments in Intellectual Capital: International Journal of Technology Management: Vol 18, No. 5–8. Available online: https://www.inderscienceonline.com/doi/10.1504/IJTM.1999.002779 (accessed on 29 June 2021).
  2. The Connenction between Global Innovation Index and Economic Well-Being Indexes|Applied Studies in Agribusiness and Commerce. Available online: https://ojs.lib.unideb.hu/apstract/article/view/6514 (accessed on 24 November 2023).
  3. Building a Knowledge Economy in South Africa|South African Journal of Science. Available online: https://journals.co.za/doi/abs/10.10520/EJC96995 (accessed on 15 June 2022).
  4. Chen, M.-C.; Cheng, S.-J.; Hwang, Y. An empirical investigation of the relationship between intellectual capital and firms’ market value and financial performance. J. Intellect. Cap. 2005, 6, 159–176. [Google Scholar] [CrossRef]
  5. Marimuthu, M.; Arokiasamy, L.; Ismail, M. Human Capital Development and Its Impact on Firm Performance: Evidence from Developmental Economics. J. Int. Soc. Res. 2009, 2. Available online: http://scholars.utp.edu.my/id/eprint/12047 (accessed on 1 October 2023).
  6. Wang, Y. What are the biggest obstacles to growth of SMEs in developing countries?–An empirical evidence from an enterprise survey. Borsa Istanb. Rev. 2016, 16, 167–176. [Google Scholar] [CrossRef]
  7. The Impact of Corporate Social Responsibility (CSR) Knowledge on Corporate Financial Performance: Evidence from the European Banking Industry. Available online: https://www.iris.unicz.it/handle/20.500.12317/77030 (accessed on 24 November 2023).
  8. Gangi, F.; Salerno, D.; Meles, A.; Daniele, L.M. Do Corporate Social Responsibility and Corporate Governance Influence Intellectual Capital Efficiency? Sustainability 2019, 11, 1899. [Google Scholar] [CrossRef]
  9. Eid, R. The Association between Intellectual Capital and Performance of Bahraini Listed Firms. 2018. Available online: https://www.semanticscholar.org/paper/The-Association-between-Intellectual-Capital-and-of-Eid/a063b3dfc927905e368bc419c69012724ed79234 (accessed on 15 June 2022).
  10. Bontis, N.; Keow, W.C.C.; Richardson, S. Intellectual capital and business performance in Malaysian industries. J. Intellect. Cap. 2000, 1, 85–100. [Google Scholar] [CrossRef]
  11. Venugopal, D.; Nambi, S.T.; Lakshmanan, M. A Data Envelopment Analysis Approach to Performance Efficiency of Intellectual Capital–Case of Titan Company Limited #. SDMIMD J. Manag. 2018, 9, 1–8. [Google Scholar] [CrossRef]
  12. Ge, F.; Xu, J. Does intellectual capital investment enhance firm performance? Evidence from pharmaceutical sector in China. Technol. Anal. Strateg. Manag. 2021, 33, 1006–1021. [Google Scholar] [CrossRef]
  13. Kefela, G.T. Knowledge-based economy and society has become a vital commodity to countries. Int. NGO J. 2010, 5, 160–166. [Google Scholar]
  14. O’Regan, N.; Ghobadian, A. The importance of capabilities for strategic direction and performance. Manag. Decis. 2004, 42, 292–313. [Google Scholar] [CrossRef]
  15. Gashenko, I.V.; Khakhonova, N.N.; Orobinskaya, I.V.; Zima, Y.S. Competition between human and artificial intellectual capital in production and distribution in Industry 4.0. J. Intellect. Cap. 2020, 21, 531–547. [Google Scholar] [CrossRef]
  16. Ullah, A.; Pinglu, C.; Ullah, S.; Qian, N.; Zaman, M. Impact of intellectual capital efficiency on financial stability in banks: Insights from an emerging economy. Int. J. Financ. Econ. 2023, 28, 1858–1871. [Google Scholar] [CrossRef]
  17. Hsu, S.T.; Cohen, S.K. Revisiting the R&D investment-performance relationship: The moderating effects of factor market characteristics. J. Eng. Technol. Manag. JET-M 2020, 57, 101570. [Google Scholar]
  18. Griffiths, W.; Webster, E. What governs firm-level R&D: Internal or external factors? Technovation 2010, 30, 471–481. [Google Scholar] [CrossRef]
  19. Allameh, S.M.; Zare, S.M.; Davoodi, S. mohammad reza Examining the impact of KM enablers on knowledge management processes. Procedia Comput. Sci. 2011, 3, 1211–1223. [Google Scholar] [CrossRef]
  20. Khan, M.; Luintel, K.B. Sources of Knowledge and Productivity: How Robust Is the Relationship? OECD: Paris, France, 2006. [Google Scholar]
  21. Sima, V.; Gheorghe, I.G.; Subić, J.; Nancu, D. Influences of the Industry 4.0 Revolution on the Human Capital Development and Consumer Behavior: A Systematic Review. Sustainability 2020, 12, 4035. [Google Scholar] [CrossRef]
  22. Lin, H.; Li, R.; Hou, S.; Li, W. Influencing factors and empowering mechanism of participation in e-commerce: An empirical analysis on poor households from Inner Mongolia, China. Alex. Eng. J. 2021, 60, 95–105. [Google Scholar] [CrossRef]
  23. Wadho, W.; Chaudhry, A. Innovation and firm performance in developing countries: The case of Pakistani textile and apparel manufacturers. Res. Policy 2018, 47, 1283–1294. [Google Scholar] [CrossRef]
  24. Yuan, B.; Xia, H.; Guo, C. An evaluation index system for intellectual capital evaluation based on machine learning. Alex. Eng. J. 2021, 60, 1519–1524. [Google Scholar] [CrossRef]
  25. Qurashi, I.A.; Khalique, M.; Ramayah, T.; Bontis, N.; Yaacob, M.R. Impact of intellectual capital on innovation in pharmaceutical manufacturing SMEs in Pakistan. Int. J. Learn. Intellect. Cap. 2020, 17, 61–76. [Google Scholar] [CrossRef]
  26. Khalique, M.; Shaari, J.A.N.; Isa, A.H.M.; Ageel, A. Role of Intellectual Capital on the Organizational Performance of Electrical and Electronic SMEs in Pakistan. Int. J. Bus. Manag. 2011, 6, p253. [Google Scholar] [CrossRef]
  27. Pulic, A.; Kolakovic, M. Value creation efficiency in the new economy. Glob. Bus. Econ. Rev. 2003, 5, 111–128. [Google Scholar] [CrossRef]
  28. Freeze, R.D.; Kulkarni, U. Knowledge management capability: Defining knowledge assets. J. Knowl. Manag. 2007, 11, 94–109. [Google Scholar] [CrossRef]
  29. Sveiby, K.-E. Methods for Measuring Intangible Assets. 2018. Available online: https://harisportal.hanken.fi/sv/publications/methods-for-measuring-intangible-assets (accessed on 1 October 2023).
  30. Cohen, W.M.; Levinthal, D.A. Absorptive Capacity: A New Perspective on Learning and Innovation. Adm. Sci. Q. 1990, 35, 128–152. [Google Scholar] [CrossRef]
  31. Aken, J.E. Management Research Based on the Paradigm of the Design Sciences: The Quest for Field-Tested and Grounded Technological Rules. J. Manag. Stud. 2004, 41, 219–246. [Google Scholar] [CrossRef]
  32. Reimann, P. Design-Based Research. In Methodological Choice and Design: Scholarship, Policy and Practice in Social and Educational Research; Markauskaite, L., Freebody, P., Irwin, J., Eds.; Methodos Series; Springer: Dordrecht, The Netherlands, 2011; pp. 37–50. ISBN 978-90-481-8933-5. [Google Scholar]
  33. Wang, F.; Hannafin, M.J. Design-based research and technology-enhanced learning environments. Educ. Technol. Res. Dev. 2005, 53, 5–23. [Google Scholar] [CrossRef]
  34. Bhattacharjee, S.; Akter, R. Intellectual capital efficiency and firm performance: Evidence from an emerging knowledge-economy. Int. J. Learn. Intellect. Cap. 2022, 19, 30–52. [Google Scholar]
  35. Sukardi, S.; Wildan, W.; Subhani, A. Resource-Based View Experiential Learning Model Design: Towards Strengthening Vocational High School Students’ Entrepreneurial Competencies. In Proceedings of the 4th International Conference on Vocational Education and Technology, IConVET 2021, Singaraja, Bali, Indonesia, 27 November 2021. [Google Scholar] [CrossRef]
  36. Stam, C.D. Knowledge Productivity: Designing and Testing a Method to Diagnose Knowledge Productivity and Plan for Enhancement. 2007. Available online: https://research.utwente.nl/en/publications/knowledge-productivity-designing-and-testing-a-method-to-diagnose (accessed on 24 February 2022).
  37. Valizadeh Morady, M. Intellectual capital measuring methods. Eur. Online J. Nat. Soc. Sci. 2013, 2, 755–762. [Google Scholar]
  38. Pulic, A. Intellectual capital–does it create or destroy value? Meas. Bus. Excell. 2004, 8, 62–68. [Google Scholar] [CrossRef]
  39. Does Intellectual Capital Efficiency Improve Firm Performance in BRICS Economies? A Dynamic Panel Estimation|Emerald Insight. Available online: https://www.emerald.com/insight/content/doi/10.1108/MBE-12-2015-0055/full/html?skipTracking=true (accessed on 13 October 2022).
  40. Hussi, T.; Ahonen, G. Managing intangible assets—A question of integration and delicate balance. J. Intellect. Cap. 2002, 3, 277–286. [Google Scholar] [CrossRef]
  41. Edvinsson, L.; Malone, M.S. Intellectual Capital: The Proven Way to Establish Your Company’s Real Value by Measuring Its Hidden Brainpower; New Ed edition; PIATKUS BOOKS: London, UK, 1998; ISBN 978-0-7499-1850-7. [Google Scholar]
  42. Roos, G.; Roos, J. Measuring your company’s intellectual performance. Long Range Plann. 1997, 30, 413–426. [Google Scholar] [CrossRef]
  43. Salojärvi, S.; Furu, P.; Sveiby, K.-E. Knowledge management and growth in Finnish SMEs. J. Knowl. Manag. 2005, 9, 103–122. [Google Scholar] [CrossRef]
  44. Guimon, J. MERITUM and Danish Guidelines for Reporting on Intangibles: A Comparative Study. IUP J. Account. Res. Auidt Pract. 2009, 8, 17–29. [Google Scholar]
  45. Rohana, N.; Razak, A. The Relationship of Intellectual Capital, Innovation and Organizational Performance: A Preliminary Study in Malaysian SMEs. 2018. Available online: https://www.macrothink.org/journal/index.php/ijmis/article/download/15/17 (accessed on 1 October 2023).
  46. Bykova, A.; Molodchik, M. Applying the VAIC Model to Russian Industrial Enterprises; Social Science Research Network: Rochester, NY, USA, 2012; Available online: https://papers.ssrn.com/abstract=2001341 (accessed on 25 January 2018).
  47. Barkat, W.; Beh, L.-S. Influence of Intellectual Capital Dimensions on Knowledge Process Capability and Organizational Performance. Asian J. Sci. Res. 2018, 11, 308–318. [Google Scholar] [CrossRef]
  48. Bassi, L.J.; Van Buren, M.E. Valuing investments in intellectual capital. Int. J. Technol. Manag. 1999, 18, 414–432. [Google Scholar] [CrossRef]
  49. Török, Á.; Tóth, J.; Balogh, J. Push or Pull? The nature of innovation process in the Hungarian food SMEs. J. Innov. Knowl. 2018, 4, 234–239. [Google Scholar] [CrossRef]
  50. Ma, H.R.; Lee, C.-J.; Oh, D.H. Identification of R&D Paradox after the Global Financial Crisis: Korean Case Focusing on the Smart Convergence and Conventional Industries. Sci. Technol. Soc. 2022, 27, 213–232. [Google Scholar] [CrossRef]
  51. Ortega-Argilés, R.; Vivarelli, M.; Voigt, P. R&D in SMEs: A Paradox? Small Bus. Econ. 2009, 33, 3–11. [Google Scholar]
  52. Latif, M.; Malik, M.; Aslam, S. Intellectual capital efficiency and corporate performance in developing countries: A comparison between Islamic and conventional banks of Pakistan. Interdiscip. J. Contemp. Res. Bus. 2012, 4, 405–420. [Google Scholar]
  53. Ståhle, P.; Ståhle, S.; Aho, S. Value added intellectual coefficient (VAIC): A critical analysis. J. Intellect. Cap. 2011, 12, 531–551. [Google Scholar] [CrossRef]
  54. Iazzolino, G.; Laise, D. Value added intellectual coefficient (VAIC): A methodological and critical review. J. Intellect. Cap. 2013, 14, 547–563. [Google Scholar] [CrossRef]
  55. Pulic, A. VAICTM an accounting tool for IC management. Int. J. Technol. Manag. 2000, 20, 702–714. [Google Scholar] [CrossRef]
  56. Shehata, M.E.; El-Gohary, K.M. Towards improving construction labor productivity and projects’ performance. Alex. Eng. J. 2011, 50, 321–330. [Google Scholar] [CrossRef]
  57. Chen, F.-C.; Liu, Z.-J.; Kweh, Q.L. Intellectual capital and productivity of Malaysian general insurers. Econ. Model. 2014, 36, 413–420. [Google Scholar] [CrossRef]
  58. Phusavat, K.; Comepa, N.; Sitko-Lutek, A.; Ooi, K. Productivity management: Integrating the intellectual capital. Ind. Manag. Data Syst. 2013, 113, 840–855. [Google Scholar] [CrossRef]
  59. Tran, N.P.; Vo, D.H. Human capital efficiency and firm performance across sectors in an emerging market. Cogent Bus. Manag. 2020, 7, 1738832. [Google Scholar] [CrossRef]
  60. Chowdhury, L.A.M.; Rana, T.; Azim, M.I. Intellectual capital efficiency and organisational performance: In the context of the pharmaceutical industry in Bangladesh. J. Intellect. Cap. 2019, 20, 784–806. [Google Scholar] [CrossRef]
  61. Petty, R.; Guthrie, J. Intellectual capitalliterature review: Measurement, reporting and management. J. Intellect. Cap. 2000, 1, 155–176. [Google Scholar] [CrossRef]
  62. Pedro, E.; Leitão, J.C.; Alves, H. Back to the Future of Intellectual Capital Research: A Systematic Literature Review. Manag. Decis. 2018, 56, 2502–2583. [Google Scholar] [CrossRef]
  63. Pulic, A. Measuring the performance of intellectual potential in knowledge economy. In Proceedings of the 2nd McMaster Word Congress on Measuring and Managing Intellectual Capital by the Austrian Team for Intellectual Potential; McMaster University: Hamilton, ON, Canada, 1998; pp. 1–20. [Google Scholar]
  64. Pulic, A. Basic Information on VAICTM. 1999. Available online: https://www.vaic-on.net (accessed on 1 October 2023).
  65. Pulic, A. The principles of intellectual capital efficiency-A brief description. Croat. Intellect. Cap. Cent. Zagreb 2008, 76. [Google Scholar]
  66. Pulic, A. MVA and VAIC Analysis of Randomly Selected Companies from FTSE 250; Austrian Intellectual Capital Research Center: Graz, Austria, 2000. [Google Scholar]
  67. Dunn, J.; Laing, G.; Hughes-Lucas, S. Applying the VAICTM model to Australian hotels. J. Intellect. Cap. 2010, 11, 269–283. [Google Scholar] [CrossRef]
  68. Venkatraman, N. The Concept of Fit in Strategy Research: Toward Verbal and Statistical Correspondence. Acad. Manag. Rev. 1989, 14, 423–444. [Google Scholar] [CrossRef]
  69. “Enterprise Surveys Indicators Data-World Bank Group”, World Bank. Available online: https://www.enterprisesurveys.org/en/enterprisesurveys (accessed on 10 November 2022).
  70. Bontis, N. Intellectual capital: An exploratory study that develops measures and models. Manag. Decis. 1998, 36, 63–76. [Google Scholar] [CrossRef]
  71. Blundell, R.; Bond, S.; Windmeijer, F. Estimation in dynamic panel data models: Improving on the performance of the standard GMM estimator. In Nonstationary Panels, Panel Cointegration, and Dynamic Panels; Baltagi, B.H., Fomby, T.B., Carter Hill, R., Eds.; Advances in Econometrics; Emerald Group Publishing Limited: Bingley, UK, 2001; Volume 15, pp. 53–91. ISBN 978-1-84950-065-4. [Google Scholar]
  72. Adegboye, A.C.; Iweriebor, S. Does Access to Finance Enhance SME Innovation and Productivity in Nigeria? Evidence from the World Bank Enterprise Survey. Afr. Dev. Rev. 2018, 30, 449–461. [Google Scholar] [CrossRef]
  73. Dollar, D.; Hallward-Driemeier, M.; Mengistae, T. Investment Climate and Firm Performance in Developing Economies. Econ. Dev. Cult. Chang. 2005, 54, 1–31. [Google Scholar] [CrossRef]
  74. Costamagna, R.; Idrovo Carlier, S.; Mendi, P. Initial informality as an obstacle to intellectual capital acquisitions: Empirical evidence from Latin America. J. Intellect. Cap. 2019, 20, 472–487. [Google Scholar] [CrossRef]
  75. Larsen, H.T.; Bukh, P.N.; Mouritsen, J. Intellectual Capital Statements and Knowledge Management: “Measuring”, “Reporting”, “Acting”. Aust. Account. Rev. 1999, 9, 15–26. [Google Scholar] [CrossRef]
  76. Nunnally, J.C. An Overview of Psychological Measurement. In Clinical Diagnosis of Mental Disorders; Wolman, B.B., Ed.; Springer: Boston, MA, USA, 1978; pp. 97–146. ISBN 978-1-4684-2492-8. [Google Scholar]
  77. Chin, W.W. Commentary: Issues and Opinion on Structural Equation Modeling. MIS Q. 1998, 22, vii–xvi. [Google Scholar]
  78. Fornell, C. A Second Generation of Multivariate Analysis: Classification of Methods and Implications for Marketing Research. 2006. Available online: https://deepblue.lib.umich.edu/bitstream/handle/2027.42/35621/b1408124.0001.001.pdf?sequence=2 (accessed on 1 October 2023).
  79. Sharma, P. Enterprise Value and Intellectual Capital: Study of BSE 500 Firms. Account. Financ. Res. 2018, 7, 123. [Google Scholar] [CrossRef]
  80. A Partial Least Squares Latent Variable Modeling Approach for Measuring Interaction Effects: Results from a Monte Carlo Simulation Study and an Electronic-Mail Emotion/Adoption Study|Information Systems Research. Available online: https://pubsonline.informs.org/doi/10.1287/isre.14.2.189.16018 (accessed on 25 November 2023).
  81. Bukhari, S.M.B.R.; Shoaib, M.; Nasir, A. Sustainable Growth and Profitability in the Pakistani Insurance Sector: An Intellectual Capital Perspective. Glob. Econ. Rev. 2021, VI, 131–148. [Google Scholar] [CrossRef]
  82. Ali, S.; Murtaza, G.; Hedvicakova, M.; Jiang, J.; Naeem, M. Intellectual capital and financial performance: A comparative study. Front. Psychol. 2022, 13, 967820. [Google Scholar] [CrossRef]
  83. Gul, S.; Khan, A.G.; Ajmair, M. Relationship between Human Capital and Labour Productivity. Pak. Soc. Sci. Rev. 2022, 6, 663–677. [Google Scholar] [CrossRef]
  84. The Effects of Intangible Assets on Firm Performance: An Empirical Investigation on Selective Listed Manufacturing Firms in DSE, Bangladesh|Emerald Insight. Available online: https://www.emerald.com/insight/content/doi/10.1108/AJB-11-2018-0065/full/html (accessed on 25 November 2023).
  85. Marti, J.M.V.; do Rosário Cabrita, M. Advancing the Intellectual Capital Theory- Some Ways Forward. Eur. Conf. Knowl. Manag. 2023, 24, 1399–1409. [Google Scholar] [CrossRef]
  86. Viedma, J. ICBS: Intellectual Capital Benchmarking Systems. J. Intellect. Cap. 2001, 2, 148–165. [Google Scholar] [CrossRef]
  87. Alhassan, A.L.; Asare, N. Intellectual capital and bank productivity in emerging markets: Evidence from Ghana. Manag. Decis. 2016, 54, 589–609. [Google Scholar] [CrossRef]
  88. Habib, M.; Abbas, J.; Noman, R. Are human capital, intellectual property rights, and research and development expenditures really important for total factor productivity? An empirical analysis. Int. J. Soc. Econ. 2019, 46, 756–774. [Google Scholar] [CrossRef]
  89. Manasserian, T.; Yang, X.; Lim, Y.T.; Seo, S.-Y. New Realities for International Trade and Political Implications for the Emerging Economies. J. Korea Res. Assoc. Int. Commer. 2007, 6, 67–84. [Google Scholar]
  90. González, X.; Miles-Touya, D.; Pazó, C. R&D, worker training and innovation: Firm-level evidence. Ind. Innov. 2016, 23, 694–712. [Google Scholar] [CrossRef]
  91. Qingdao Agricultural University, School of Management; Xu, J.; Liu, F. Korea University Business School The Impact of Intellectual Capital on Firm Performance: A Modified and Extended VAIC Model. J. Compet. 2020, 12, 161–176. [Google Scholar] [CrossRef]
  92. Phusavat, K.; Comepa, N.; Sitko-Lutek, A.; Ooi, K.-B. Interrelationships between intellectual capital and performance: Empirical examination. Ind. Manag. Data Syst. 2011, 111, 810–829. [Google Scholar] [CrossRef]
  93. Maji, S.G.; Goswami, M. Intellectual capital and firm performance in emerging economies: The case of India. Rev. Int. Bus. Strategy 2016, 26, 410–430. [Google Scholar] [CrossRef]
  94. Sarwar, S.Z.; Ishaque, A.; Ehsan, N.; Pirzada, D.S.; Nasir, Z.M. Identifying productivity blemishes in Pakistan automotive industry: A case study. Int. J. Product. Perform. Manag. 2012, 61, 173–193. [Google Scholar] [CrossRef]
  95. Wang, X.; Wang, L.; Wang, S.; Fan, F.; Ye, X. Marketisation as a channel of international technology diffusion and green total factor productivity: Research on the spillover effect from China’s first-tier cities. Technol. Anal. Strateg. Manag. 2021, 33, 491–504. [Google Scholar] [CrossRef]
Figure 1. Knowledge productivity [36] explains the resource-based view (RBV)’s critical stages and how enterprise knowledge shapes performance and productivity through knowledge management and intellectual capital streams.
Sustainability 16 00424 g001
Figure 2. Theoretical framework.
Sustainability 16 00424 g002
Figure 3. Conceptual framework.
Sustainability 16 00424 g003
Figure 4. VAIC tree diagram [67] explaining how the VAIC is measured through the IC efficiency and employed capital efficiency.
Sustainability 16 00424 g004
Figure 5. Average value-added intellectual coefficient value over ten years for each of the 70 knowledge-intensive engineering SMEs.
Sustainability 16 00424 g005
Figure 6. ICE/CEE chart for each firm average (10-year average).
Sustainability 16 00424 g006
Table 1. Analysis of the literature involves the description of various intellectual capital measuring approaches [29,37,38].
IC Measuring MethodAnalysis and Relevance to the Proposed Research
Market Value to Book Value Ratio (MV/BV)Shows how much the firm is valued beyond its financial strength. Since other external factors influence intellectual capital, this technique was not chosen.
Balanced Score Card (BSC)The BSC metric shows the value growth at each firm’s stage from a financial, customer, and internal process perspective. Stage-wise results of IC were not required in the proposed research.
Skandia Navigator Skandia Navigator measures intellectual capital through five components: financial, customer, process, renewal, development, and human. In the developing world, acquiring accurate data for these components is difficult.
Economic Value Added (EVA) The EVA is related to budgeting, financial planning, goal targeting, stock pricing, and incentive compensation, but does not cater to gains of good project management or intellectual capital. EVA is primarily a financial performance measure.
Direct Intellectual Capital (DIC) methodThe DIC method gives monetary value to intangibles, but is nonfinancial (contextual) and specific to each organization, so it cannot work in the proposed research.
Value-Added Intellectual Coefficient (VAIC)The VAIC provides a definite value to intellectual capital efficiency, i.e., the firm performance of each firm, which other approaches do not [39]. Additionally, labor productivity gives a definite value productivity to each firm as well.
Market Capitalization (MC) and Return on Asset (ROA) methods MC and ROA are just two metrics available to measure the firm performance. Since developing countries’ financial markets are unstable and do not reflect the correct market value of firms, this technique was not used in the proposed research.
Ahonen, Edvinsson, and Roos [40,41,42] have discussed intangibles and firm performance in highly cited researchThis highly cited research aimed not to find a definite intellectual capital measuring tool, but to contribute to the existing knowledge of intangibles.
Table 2. Significant studies comparing the VAIC, LP, training, and R&D.
Reference of Significant StudiesRelevance to Proposed Research
Knowledge management and growth in Finnish SMEs [43] measuring intangibles to understand and improve innovation management (MERITUM) [44] is similar to a Malaysian study on SMEs [45]The proposed study presents actual comparable numbers on intellectual capital performance and productivity and uses knowledge management variables that deal with knowledge productivity, called knowledge-based performance drivers.
The value-added intellectual coefficient is used to quantify KBPDs’ performance effects.
N. Bontis, W. C. C. Keow, and S. Richardson [10] compare intellectual capital components with firm performance, mostly financiallyThe proposed research compares intellectual capital plus employed capital with productivity.
Annie Brookings, Goran Roos., Thomas Stewart and Nick Bontis emphasized the human factor in intellectual capital, so the VAIC was compared to labor productivity.
Bykova and Molodchik [46] compared the VAIC with labor productivity, firm size, sales growth, and profitability in the Russian industryBecause the proposed research is based on knowledge-oriented industry data, R&D and training were added to the investigation.
Barkat and Beh [47] investigated VAIC attributes and organizational performance in the textile sector of the same developing country as the proposed researchThe proposed research uses the VAIC for performance measurement and labor productivity for productivity values in knowledge-intensive engineering SMEs.
R&D and training have been identified as critical factors for IC in a landmark study by Bassi and Buren [48]. Furthermore, several studies on SMEs [49,50,51] found that R&D spending negatively correlates with innovation and value addition in the developing worldThe proposed research investigates the R&D spending paradox and training in knowledge-intensive engineering SMEs because these factors cannot be ignored.
Studies on the performance and productivity of knowledge-intensive firms in a developing country like Pakistan have been limited to the pharmaceutical [28], electronics [26], textile [47], and banking [52] fields.The proposed research is more of a population cluster representative, i.e., it has data from more knowledge-intensive engineering firms from diverse geographical areas, is more rigorous, as it includes findings on training and R&D, and provides practical articulation to theoretical concepts on firm performance in developing countries at the national intellectual capital (NIC) level.
Table 3. Details of the operational definitions of the variables used in this study.
VariableHow to CalculateMeasuresRationale
VAICThe sum of IC and employed capital efficiencyRepresents knowledge-based intellectual capital performance The VAIC gives a definite value to intangible assets
Labor ProductivitySynonymous with productivity. It is output/inputThe most vital productivity component (labor)LP is the productivity most relevant to IC
TrainingPrimary data from the ES World Bank survey questionnaire. Secondary data from annual financial reportsTraining investment Vital prerequisites for HC and SC
R&DPrimary data from the ES World Bank survey instrument. Secondary data from annual financial reportsR&D investment in laborVital prerequisites for SC
Table 4. The VAIC attributes and formulas.
Various ConstituentsFormulaElaboration
Value-Added (VA)VA = OP + EC + D + AVA is the value added
OP is the operating profit
EC is the employee cost expenses
D is for depreciation
A is for amortization
Intellectual Capital (IC)IC = EC + SC
SC = VA − HC
OP is the earnings minus taxes
Depreciation is (Cost—Residual Value)/useful life
Amortization is the asset cost minus the residual value of the lifetime
Human Capital Efficiency (HCE)HCE = VA/HC
Structural Capital Efficiency (SCE)SCE = SC/VA
Intellectual Capital Efficiency (ICE)ICE = HCE + SCE
Capital Employed Efficiency (CEE)CEE = VA/CECE is for the total assets—current liabilities
Value-Added Intellectual Coefficient (VAIC)VAIC = HCE + SCE + CEEPulic’s VAIC formula [27,38,63,64,65,66]
Table 5. SME criteria adapted from several countries.
CriteriaCriteria FinalizedSMEDA BangladeshIndiaUSA/Canada/EU
Employees<250<250>250 (Industry Policy 2010)-500–1000
Turnover/revenuesUSD 43 M<USD 1.6 M--USD 37–48 M
Fixed assets, plants, and machines minus buildings and land<USD 0.66<USD 0.66 M<USD 1.74 M<USD 1.15 M-
Table 6. The justification for choosing the SPSS-PLS statistical technique for the analysis of the data.
TechniqueUsage
Generalized method of moments (GMM)This method equates sample moments to parameter estimates, which was unnecessary here.
Partial least squares (PLS-SEM)A small representative sample was used, but only a few interdependencies were expected in this research.
Data envelopment analysis (DEA)Data envelopment analysis involves decision-making; therefore, it was not necessary for this research.
TobitThe dependent variable is not skewed in one direction; Tobit was unnecessary.
Stochastic frontier analysis (SFA)The SFA cannot consider multiple inputs and outputs.
SPSS- PLSSuitable for this research, as descriptive data were available to find a causal relationship with Pearson’s correlation.
Disclaimer/Publisher’s Note: The statements, opinions and data contained in all publications are solely those of the individual author(s) and contributor(s) and not of MDPI and/or the editor(s). MDPI and/or the editor(s) disclaim responsibility for any injury to people or property resulting from any ideas, methods, instructions or products referred to in the content.

