Article

How Can the Blue Economy Contribute to Inclusive Growth and Ecosystem Resources in Asia? A Comparative Analysis

1
Economical and Management College, West Anhui University, Lu’an 237012, China
2
School of Information Technology & Engineering, Guangzhou College of Commerce, Guangzhou 511363, China
3
Department of Management Sciences, Virtual University of Pakistan, Faisalabad Campus, Faisalabad 38000, Pakistan
4
Department of Economics, Virtual University of Pakistan, Faisalabad 38000, Pakistan
*
Author to whom correspondence should be addressed.
Sustainability 2024, 16(1), 429; https://doi.org/10.3390/su16010429
Submission received: 1 November 2023 / Revised: 26 November 2023 / Accepted: 12 December 2023 / Published: 3 January 2024

Abstract

:
This study investigated the impact of economic, environmental, and social indicators on inclusive growth in 19 member countries of the Asian Cooperation Dialogue from 1995 to 2021. This research employed the Driscoll–Kraay standard error regression technique. The findings reveal that the impact of independent variables on inclusive growth differs significantly among three distinct income categories: lower-middle-income countries (LMYCs), upper-middle-income countries (UMYCs), and high-income countries (HYCs). One of the primary contributions of this research is the provision of empirical evidence concerning the role played by fishery and aquaculture production in fostering inclusive growth in the Asian context. This research also highlights the trade-offs between economic development and environmental sustainability in terms of trade openness; agriculture, forestry, and fishing; the ecological footprint; and renewable energy utilization. Enhancing inclusive growth in Asia requires improving fishery and aquaculture management, diversifying economic activities, reducing the ecological footprint, and increasing renewable energy utilization. This paper suggests some future work directions for extending the analysis to other regions and indicators. The paper also suggests some policy implications for fostering inclusive growth in Asia through regional cooperation, capacity building, technology transfer, and green financing.

1. Introduction

The Asian Cooperation Dialogue (ACD) is a significant framework for enhancing cooperation and integration among Asian countries [1]. Its primary importance lies in fostering economic, technical, and cultural collaboration across the diverse nations of Asia. By promoting mutual understanding and shared development goals, the ACD helps to strengthen economic growth, cultural exchange, and political stability in the region. It serves as a platform for addressing regional challenges, such as economic disparities, environmental issues, and security concerns, through collective efforts and dialogue. The ACD’s role in facilitating inter-Asian partnerships and connectivity is crucial for the long-term prosperity and unity of the Asian continent [2].
The vastness of the ocean, covering over 70% of the Earth’s surface, is more than a mere geographical feature; it is a pivotal component for human welfare and the health of our planet [3]. It is a lifeline for over three billion individuals who rely on marine and coastal resources, not just for sustenance but also for their livelihoods and economic stability. In 2010, the ocean’s contribution to the world’s gross value added was approximately 2.5%, amounting to a staggering 1.5 trillion in us dollars, underlining its significant role in global economic dynamics [3].
Furthermore, the ocean is an integral player in climate regulation. It absorbs around 30% of human-made carbon dioxide emissions and 90% of the additional heat caused by greenhouse gases. The richness of its biodiversity cannot be overstated, with over 230,000 known marine species and potentially millions more undiscovered, showcasing an incredible array of life forms and ecological complexity [4].
However, this vital ecosystem is under threat due to various human-induced challenges [4]. Issues such as overfishing, unregulated fishing practices, pollution, habitat destruction, invasive species, ocean acidification, and rising sea levels pose severe risks. These challenges have profound implications not just environmentally but also economically and socially, impacting sustainable development on multiple fronts. For instance, overfishing and illegal fishing activities deplete fish stocks, affecting the food security and income of fishing communities. Pollution, particularly from plastics, damages marine ecosystems and impacts human health. Habitat destruction, like coral bleaching and mangrove degradation, lessens the resilience of coastal areas. The consequences of ocean acidification and rising sea levels are severe, threatening the survival and adaptability of marine life and coastal communities [5].
To navigate these challenges while leveraging the ocean’s potential for sustainable development, the concept of the blue economy has gained prominence. This holistic approach aims to balance economic growth with environmental stewardship and social equity. It spans various sectors, including fisheries, aquaculture, maritime transport, renewable energy, tourism, and climate change adaptation, aiming to sustainably utilize ocean resources while conserving the marine environment and enhancing human well-being. The blue economy aligns with global frameworks like the 2030 Agenda for Sustainable Development, particularly Sustainable Development Goal 14 on Life below Water, the Paris Agreement on Climate Change, and the Convention on Biological Diversity [6].
Inclusive growth is a concept that encompasses both the pace and the pattern of economic growth, which are interlinked and must be addressed together [7,8,9]. The aim of inclusive growth is to ensure the equitable distribution of the benefits from economic advancement across society, offering opportunities for all, especially disadvantaged and marginalized groups. It posits that social cohesion and environmental sustainability can coexist with economic prosperity [10]. The fisheries sector, encompassing fishing, aquaculture, and related activities, stands as a potential contributor to inclusive growth. Millions of individuals worldwide, particularly in developing nations, rely on the fisheries industry for sustenance, income, and trade. Researchers estimate that in 2018, global fish production reached 179 million tonnes, with aquaculture accounting for 82.1 million tonnes and capture fisheries accounting for 96.4 million tonnes. In the same year, the industry employed 59.5 million people, including 20.5 million in aquaculture and 39 million in capture fisheries [11].
Additionally, fish and fish products provided 7% of total protein intake in 2017 and 17% of animal protein consumed globally. However, the fisheries sector faces numerous challenges, such as overfishing, illegal practices, habitat degradation, climate change, pollution, diseases, market fluctuations, trade barriers, and socioeconomic disparities, which undermine its inclusivity and sustainability [12]. Collaborative efforts involving stakeholders at local, national, regional, and global levels are imperative to devise comprehensive solutions. Encouraging the establishment of inclusive and sustainable aquaculture systems can enhance food security, nutrition, income generation, and environmental conservation [13]. Inclusive growth can be assessed using indicators like income inequality, the poverty rate, the human development index, the coverage of social protection, and gender equality [14].
Total fishery production (TFP) serves as an explanatory variable encompassing the combined contributions of capture fisheries and aquaculture production within a country. It signifies the fisheries sector’s impact on dimensions like food security, nutrition, income generation, livelihoods, and trade. Its dynamics can be influenced by various factors, including natural resources, climate fluctuations, environmental degradation, market volatility, trade hindrances, and policy interventions. Aquaculture production constitutes an autonomous variable representing the cultivation of aquatic organisms like fish [15], crustaceans, mollusks, and plants. It is one of the fastest-growing segments in global food production. It carries the potential to bolster food security, improve nutrition, boost income, and contribute to environmental conservation [16].
Agriculture, forestry, and fishing (AFF) represent an independent variable capturing the value added by these sectors to a country’s gross domestic product (GDP). It reflects the significance of these sectors in terms of economic development [17], rural livelihoods, natural resource management, and efforts related to climate change mitigation and adaptation. Its performance can be shaped by factors such as land utilization, water availability, soil quality, biodiversity, technological advancements, innovation, market accessibility, and policy backing [18]. Capital–labor (CL) acts as an independent variable signifying the ratio of capital stock to the labor force within a country or region [19]. It offers insights into the level of capital intensity and labor productivity prevalent in an economy. It can exert an influence over an economy’s potential for economic growth, income distribution, employment generation, and structural transformation. Its determination hinges on factors like the investment rate, savings rate, depreciation rate, population growth rate, human capital development, technological advancements, and institutional quality [20].
Trade openness (TO), another variable, quantifies the extent to which a country or region integrates with the global economy. It can be measured by indicators such as trade intensity (the ratio of exports plus imports to GDP), trade diversification (the variety of export products and markets), trade liberalization (a reduction in trade barriers), and trade facilitation (the simplification of trade procedures) [21]. It shows positive effects on economic growth, efficiency, innovation, competition, and consumer welfare, but it also shows negative effects on income inequality, environmental degradation, social disruption, and policy autonomy [22]. The ecological footprint (EF) is an independent variable that represents the amount of biologically productive land and water area required to produce the goods and services consumed by a person or a population and to absorb their waste. It reflects the environmental impact and sustainability of human activities [23]. It can be compared with biocapacity (the productive area available within a region or the world) to assess the ecological deficit or surplus of a person or a population. It can be influenced by factors such as consumption patterns, production methods, resource efficiency, waste management, population size, and lifestyle choices. Renewable energy utilization (REU) is an independent variable that represents the share of renewable energy sources (such as solar, wind, hydro, biomass, geothermal, and tidal) in total energy consumption [24]. It signifies the role of renewable energy in bolstering energy security, promoting diversification, ensuring affordability, expanding access, and safeguarding the environment.
While there is growing literature on the blue economy, several gaps remain, particularly in the context of Asia. First, few studies offer a comparative analysis of how blue economy practices impact inclusive growth across different Asian countries, each with unique economic, environmental, and social backgrounds. Second, few studies have holistically examined the relationship between various aspects of the blue economy, such as fishery and aquaculture production, trade openness, and the ecological footprint, and their collective impact on inclusive growth. Third, the dynamics between economic activities and environmental sustainability in the context of the blue economy have not been extensively explored, particularly concerning renewable energy utilization and its role in sustainable fisheries and aquaculture.
The aim of this study is to analyze how the blue economy can contribute to inclusive growth in 19 Asian Cooperation Dialogue member countries using a comparative approach. This was achieved by examining the interrelations between various economic, environmental, and social indicators, such as fishery and aquaculture production, agriculture, forestry, fishing, capital–labor, trade openness, the ecological footprint, and renewable energy utilization. Most studies used GDP per capita in the empirical analysis to analyze the nexus between growth and the environment. However, it is necessary to consider the concept of inclusive growth in the context of growth–environment. Moreover, most studies used CO2 emissions to reflect environmental degradation.
Thus, the current study makes important contributions to the literature. First, it offers a comprehensive comparative assessment of the economic, environmental, and social performance of 19 ACD members and provides policy recommendations for enhancing the blue economy in Asia. Second, it underscores the need for improved governance, management, and cooperation in ocean resources and activities, highlighting opportunities in emerging sectors and emphasizing the importance of balancing economic, environmental, and social aspects for equitable and inclusive benefits from the ocean. Third, this is the first study that considered the variable of inclusive growth instead of traditional growth measures in the context of growth–energy–environment. Fourth, it explored the impact of GDP per person employed and used it as an indicator of inclusive growth. Fifth, it used the ecological footprint as a proxy for the environment instead of CO2 emissions.
This paper is organized as follows: Section 2 reviews the literature on the concept, scope, and measurement of the blue economy and the existing studies on the relationship between the blue economy and IG. Section 3 describes the data sources, variables, and methodology used in the paper. Section 4 presents the results and discussion of the panel data analysis. Section 5 concludes the paper and provides policy implications and recommendations.

2. Literature Review

AFF are three interrelated sectors that produce food, fiber, fuel, and other goods from natural resources [25]. Agriculture refers to the cultivation of crops and livestock on land; forestry refers to the management of trees and forests for various purposes; and fishing refers to the harvesting of wild or farmed aquatic organisms from water bodies. AFF can support IG by providing food security and nutrition for billions of people; generating income and employment for hundreds of millions of people; contributing to foreign exchange earnings and trade balance through exports [26]; enhancing rural development and poverty reduction; fostering innovation and technology adoption; preserving cultural heritage and traditional knowledge; enhancing resilience to shocks and disasters; and maintaining ecosystem services such as carbon sequestration, water regulation, and biodiversity conservation. However, AFF can also hinder IG if they are not conducted in a sustainable and equitable way [27]. AFF can cause environmental degradation, such as soil erosion, deforestation, desertification, water scarcity [28], pollution, greenhouse gas emissions, and loss of biodiversity. They can also create social problems, such as land conflicts, inequality, exploitation, marginalization, and human rights violations [29].
Capital–labor, i.e., CL, is a term that refers to the two main factors of production in an economy: capital and labor [30]. Capital is the stock of physical assets such as machinery, equipment, buildings, and infrastructure that are used to produce goods and services [31]. Labor is the human input that provides skills, knowledge, effort, and time to produce goods and services. CL can influence IG by affecting the quantity and quality of output and income in an economy. CL can enhance IG by increasing productivity and efficiency; promoting innovation and technological progress; creating more and better jobs; improving wages and living standards; stimulating investment and savings; enhancing human capital development and education; reducing poverty and inequality; and strengthening social protection and welfare systems [32]. However, CL can also undermine IG if there are market failures or institutional barriers that prevent the optimal allocation or utilization of CL resources. CL can hamper IG by creating unemployment or underemployment; worsening income distribution or social mobility; causing market distortions or rent-seeking behavior; creating environmental externalities or public bads; eroding human capital or social capital; and increasing vulnerability or insecurity [33].
Trade openness, i.e., TO, is a measure of the degree to which an economy is integrated with the global market through trade and investment [34]. TO can affect IG by influencing the availability and affordability of goods and services in an economy. TO can foster IG by expanding market access and opportunities; enhancing competition and efficiency; lowering prices and increasing consumer welfare; encouraging diversification and specialization; facilitating technology diffusion [35] and learning; promoting economic growth and development; supporting regional integration and cooperation; and contributing to global public goods and governance. However, TO can also pose challenges for IG if there are trade barriers or imbalances that distort trade flows or outcomes [36]. TO can hinder IG by exposing an economy to external shocks or volatility; creating trade deficits or surpluses; causing trade diversion or displacement; generating winners and losers; creating adjustment costs or distributional effects; and affecting environmental sustainability or social cohesion [37].
Ref. [38] argued that the European Green Deal (EGD) is a significant initiative by the European Union aiming for a carbon-neutral, socially inclusive economy. Focused on the EU’s Southern Neighborhood, it promises substantial impacts on energy, agriculture, trade, climate action, and the circular economy. The EGD is poised to drive investment in renewable energy, reduce emissions, and foster green diplomacy, creating opportunities for funding green projects and infrastructures. This strategy not only aligns with environmental sustainability but also promotes job creation, green growth, and sustainable development. The emphasis on sustainable agriculture, food systems, and a circular economy underscores its comprehensive approach. The EGD stands out for its potential to establish a market for green products, making it a mutually beneficial endeavor for the EU and its Southern Neighbors and a model for global environmental efforts.
Ref. [39] investigated the impact of digital infrastructure development on inclusive growth in forty-four Sub-Saharan African nations from 2000 to 2020. The research employed the Driscoll–Kraay method to mitigate cross-sectional dependence and Newey–West standard errors to correct for issues associated with errors. The research utilized the component scores of four digital infrastructure indicators to assess their impact on inclusive growth, which guarantees the fair allocation of resources within an economy. Inclusionary development in Sub-Saharan Africa is bolstered by the number of adults with fixed telephone and mobile cellular subscriptions, fixed broadband subscribers, and internet users, according to the study’s findings. Additionally, the results demonstrate that digital infrastructures contribute to greater inclusive growth in Sub-Saharan African economies, regardless of the countries’ income level (low, middle, or upper). It is suggested that policymakers increase their financial commitments to human capital and digital infrastructure to foster more inclusive economic expansion.
Ref. [40] discussed emerging control measures for biogenic amines in fresh fish and fishery products. The authors further argued that the presence of biogenic amines in fresh fish and products of the fishing industry is a major safety concern. Histamine ingestion has been identified as the etiological agent in several food poisoning incidents that occur annually. Additionally, it has been established that cadaverine, putrescine, and tyramine are potentiators of histamine poisoning. The primary cause of biogenic amine accumulation in fresh fish and fishery products has been identified as the proliferation of bacteria that possess amino acid decarboxylase activity. This growth is facilitated by unhygienic storage conditions and lax temperature regulation. Consequentially, the efficacy of conventional and contemporary methods for regulating the accumulation of biogenic amines has been the subject of extensive research. The objective of this review article is to synthesize and improve the current understanding of the capacity of conventional and emerging control strategies, as well as the biogenic amine content of fresh fish and fishery products.
Ref. [41] described the promotion of the diversification of cultivated fish species as a strategy to augment aquaculture output in Nigeria. The author further reported that aquaculture yields approximately 50% of the world’s fish consumption and is the most rapidly expanding industry in the food industry. Fish constitutes a significant source of animal protein in Africa. While it is recognized that there is a need to augment farmed fish production to compensate for the decline in capture fisheries, aquaculture endeavors on the continent have not produced equivalent outcomes. The achievement documented in Nigerian aquaculture is predicated on the successful cultivation of the African catfish. However, it has been demonstrated that the cultivation of various species or species products is positively correlated with a high level of productivity and resilience in the aquaculture industry. Consequently, increased diversification of agricultural systems and species may be beneficial for aquaculture in Nigeria, given that it would enable the most efficient use of the nation’s abundant natural resources. Numerous indigenous fish species that are amenable to cultural domestication have been identified. A substantial amount of scientific investigation and cooperation among key actors—including governmental bodies, private enterprises, research establishments, and scientists—are necessary to ensure the prosperous cultivation of these species, like the established catfish industry in Nigeria.
Ref. [42] discussed a scoping literature review that was undertaken to assess the scope and characteristics of the existing research in this field. The inclusion criteria for the articles comprised English-language, peer-reviewed journal articles that were published after 1989, addressed AgFF workers in high-income countries, and provided data on sleep patterns and work schedules in relation to health and safety. The authors said that limited research has examined the effects of sleep deprivation and extended work hours on AgFF employees. A total of 8350 articles were identified for a review of their titles and abstracts. Out of the total number of articles (307), 96 satisfied all inclusion criteria (67 percent in agriculture, 25 percent in fishing/seafood processing, and 8 percent in forestry). There is some evidence in the literature that fatigue contributes to AgFF-related fatalities, injuries, and ailments. Workers who are older, younger, foreign-born, or female or who are employed by small organizations or work extended hours (40+ hours) may be more susceptible to injuries and illnesses related to fatigue. Relatively few studies have developed or assessed risk management interventions.
Ref. [43] revealed the discontinuities in infrastructure: labor, capital, and technological advancement. The author further elaborated on various concepts, such as the “age of AI”, “industry 4.0”, and “the fourth industrial revolution”, endeavoring to establish an entirely new technological paradigm. Should the clamor be believed? This paper examines techno-economic and institutional discontinuities by expanding the scope of the debate through the application of neo-Schumpeterian and regulation theory. This paper posits two arguments by examining these discontinuities: first, that growth regimes as indicators of new paradigms are not always tenable, and second, that (infra) structural discontinuities exist between the ICT/post-Fordist era and the AI/platform era. A unique institutional logic, a regime of accumulation (RA), and the method of social regulation (MSR) characterize platformization. The clusters of institutional and technological changes that underpin this transition have not been adequately addressed in the economic geography and related literature. By redefining the transition in terms of (infra) structural discontinuity, this paper identifies technological and institutional changes in the regulation of capitalist accumulation by synthesizing neo-Schumpeterian and regulation theory.
Ref. [44] discussed a literature review of green finance, trade openness, and natural resources. The author further exposed that, in recent times, environmental and business studies have begun to place greater emphasis on green finance on account of its critical role in mitigating climate change and excessive greenhouse gas emissions. China, being a highly industrialized nation, has a high pollution production index. Moreover, this nation’s increased industrialization and pollution are substantially influenced by its trade openness. There is a prevailing belief that through the implementation of green finance theories and the enforcement of appropriate trade openness measures to regulate the flow and trade of natural resources between nations, it is possible to diminish the magnitude of detrimental environmental footprints while simultaneously improving environmental quality and sustainability. Consequently, by employing a vector autoregression (VAR) model on data spanning from 1981 to 2020, this research paper establishes a substantial correlation between the utilization of natural resources and the levels of trade openness and green finance. Moreover, it has been discovered that the utilization of coal, oil, and other pollution-causing fuels has significant adverse effects on green finance, suggesting that such fuels can reduce green finance. Likewise, gas and oil consumption were discovered to be significant predictors of the nation’s trade openness. There is a suggestion that gas usage should be increased due to its minimal pollution output and potential to steer trade toward a more sustainable trajectory. Table 1 shows the literature review on Blue Economy and ecosystem.

3. Materials and Methods

This research collected data from various sources, including the World Bank, the International Monetary Fund (IMF), and the World Development Indicators (WDI). The dataset encompasses information from 19 member nations of the Asia Cooperation Dialogue (ACD): Bangladesh, Brunei Darussalam, Cambodia, China, India, Indonesia, Iran, Japan, Kazakhstan, South Korea, Kuwait, Malaysia, Pakistan, Philippines, Qatar, Saudi Arabia, Singapore, Thailand, and the United Arab Emirates [55]. The central variable is inclusive growth (ING). The research explored several independent factors, including total fishery production (TFP), aquaculture output (AP), agriculture, forestry, and fishing (AFF), capital (K), labor (L), trade openness (TOP), ecological footprint (EF), and renewable energy utilization (RE). In accordance with the underlying theoretical framework, the subsequent model illustrates the relationship between the variables:
E F i t = f ( I N G i t , T F P i t , A P i t , T O P i t , R E N i t , A F P i t , L i t , k i t )
where ING represents inclusive growth (GDP per person employed); EF serves as a proxy for the environment and signifies the total ecological footprint per capita (gha), as per GFN (2022); TFP shows total fishery production in metric tonnes; AP represents aquaculture production in metric tons; TOP shows trade openness as a percentage of GDP; REN shows renewable energy utilization (RE) (% of total final energy use); AFP represents agriculture, forestry, and fishing (AFF) (% of GDP); L represents labor (L) (in millions); and k represent capital (K) (in USD). To account for outliers and address the heteroscedastic variance concern, Equation (1) is modified into a double-log model, which unveils the elasticity coefficient within the model [56]:
l n E F i t = β 0 + β 1 i   l n I N G i t + β 2 i   l n T F P i t + β 3 i l n T O P i t + β 4 i l n A P i t          + β 5 i l n I N R E N i t + β 6 i l n A F P i t + β 7 i l n L i t + β 8 i l n K i t + ϵ i t  
In this context, β0 represents the constant, while the symbols β1 to β8 represent the regression estimates for explanatory variables, with the error term denoted by ε.

3.1. Justification of Independent Variables

Total Factor Productivity (TFP) and Inclusive Growth (IG): Enhanced fishery production (FP) has the potential to improve food security, nutrition, income, and trade, particularly benefiting poor and marginalized populations. Nonetheless, FP can also entail environmental and social repercussions, such as overfishing, habitat degradation, pollution, and socioeconomic disparities [57]. Consequently, the connection between TFP and IG hinges on how FP is sustainably managed and equitably distributed.
Aquaculture Production (AP) and Inclusive Growth (IG): AP can make a valuable contribution to IG by strengthening food security, nutrition, income generation, and environmental conservation [58]. Nevertheless, AP encounters its own set of challenges, including disease outbreaks, pollution concerns, competition for land and water resources, social disputes, and governance issues. The interrelation between AP and IG is contingent upon sustainable and inclusive development and regulations.
Agriculture, Forestry, and Fishing (AFF) and Inclusive Growth (IG): AFF can play a pivotal role in advancing IG through its contributions to economic development, rural livelihoods, natural resource management, and efforts related to climate change mitigation and adaptation [59].
Capital–Labor (CL) and Inclusive Growth (IG): CL has the potential to bolster IG by enhancing economic growth prospects, improving income distribution, creating employment opportunities, and facilitating structural transformation within an economy [60]. Nevertheless, CL also confronts challenges relating to factors like investment rates, savings rates, depreciation rates, population growth rates, human capital development, technological advancements, and institutional quality. Consequently, the interconnection between CL and IG relies on the productive and inclusive allocation and utilization of CL resources.
TO and IG: TO can contribute to IG by enhancing economic growth, efficiency, innovation, competition, and consumer welfare [61]. However, TO can also have negative effects on income inequality, environmental degradation, social disruption, and policy autonomy. Therefore, the nexus between TO and IG depends on how TO is balanced and complemented with other policies in a fair and inclusive way.
EF and IG: EF can affect IG by reflecting the environmental impact and sustainability of human activities [62]. A high EF can indicate a high consumption of natural resources and a high generation of waste, which can harm the environment and reduce opportunities for future generations. Therefore, the nexus between EF and IG depends on how EF is reduced and offset in a responsible and inclusive way.
REU and IG: REU can contribute to IG by enhancing energy security, diversification, affordability, access, and environmental protection. However, REU can also face challenges such as natural resource endowment, technological development, cost competitiveness, policy incentives, public awareness, and social acceptance [63]. Therefore, the nexus between REU and IG depends on how REU is promoted and supported in a sustainable and inclusive way.

3.2. Econometric Methods

The empirical examination encompassed a range of assessments, which were categorized as follows: 1. pre-estimation diagnostic tests, 2. descriptive analysis, 3. cointegration analysis, 4. unit root evaluations, and 5. regression estimation [64].

3.2.1. Panel Heteroscedasticity Test

Heteroscedasticity is a problem that occurs when the error terms in a linear regression analysis do not have constant variance. This assumption is violated mainly by outliers in the data. As a result, OLS estimates are distorted [65]. Researchers suggested a modified test statistic for heteroscedasticity to explore the association between the residual variance and the explanatory variables in a linear regression model [66]. This study applied the modified LM test for heteroscedasticity [67].

3.2.2. Panel Autocorrelation Test

Panel data can exhibit autocorrelation, which is a correlation between the values of the same variables based on related objects. Its presence gives inefficient and biased standard errors. This study used the Wooldridge autocorrelation test [68].

3.2.3. Panel Unit Root (CIPS) Test

The subsequent step in the econometric process involves determining the integration order. When dealing with CD [69], it is advisable to employ second-generation unit root tests to identify the integration order. The next phase is to verify the right order of integration because the non-stationarity of the variables might lead to fictitious and meaningless forecasts, and it is essential to utilize a stationary time series with time-independent statistical characteristics [70]. To check the correct integration order, this study employed a 2nd-generation test for CD in the panel. An appropriate test is augmented cross-sectional IPS (CIPS), which is [71].
C I P S = 1 N i = 1 N t ~ i
where t ~ i is the OLS t-ratio of bi in the above regression [72]. It served as a test for the null hypothesis, and since it was rejected, it seems likely that the underlying series is stationary [73].

3.2.4. Panel Cointegration Test of Westerlund

The present research used [74]’s cointegration test in accordance with [75] due to CD. It was used to verify the existence of a long-run relationship between the variables [76]. This concept was introduced in [77]. CD requires using a 2nd-generation cointegration test such as the Westerlund test [78]. It is a crucial requirement to confirm the long-run relationship among variables. The long-run relationship implies the cointegration between two or more variables [79]. This test is based on structural dynamics rather than residual dynamics; therefore, the mathematical expression is as follows [80]:
V R = i = 1 N t = 1 T E ^ i t 2 R ^ i 1
V R = i = 1 N t = 1 T E ^ i t 2 i = 1 N R ^ i 1

3.2.5. Long-Run Estimation Method

In panel data analysis, error components may encounter various problems, like CD, heteroscedasticity, and autocorrelation [81], especially for models in which N > T [82]. Serial correlation and heteroscedasticity are also responsible for issues like inflated R2 [83]. So, the coefficient estimates using general regression may lead to misleading inferences. To avoid inefficiency and inconsistency, a linear dynamic model is widely used in panel data analysis to address serial correlation and unobserved heterogeneity [84]. This study applied the Driscoll and Kraay (D/K) standard error approach, a robust standard error estimation method. It is a non-parametric technique that estimates pooled OLS regression models to find coefficients in the panel data. It gives consistent and robust estimates, even with the existence of CD [85]. It assumes that heteroscedasticity affects the error structure and correlation between the panel’s cross-sectional units. It is well calibrated because (a) CD exists, (b) it can handle missing observations, and (c) it can be applied to both balanced and unbalanced panels [86]. In this work, a linear regression model was used to apply the Driscoll and Kraay standard errors. First, the explanatory variables and errors were used to calculate the mean values. Second, these averages were used in weighted heteroscedasticity, as described by [87], to produce robust standard residuals [88].
  y i . t = x i , t β + ε i , t   i = 1 , 2 , , Ν , t = 1 , 2 , , Τ
where   y i . t is the dependent variable, x i , t is the independent variable, the initial element of the vector is 1, and the unknown coefficients are displayed with a (K + 1) 1 vector. The subscripts i , t show time and countries [89].

4. Results

4.1. Descriptive Analysis

Table 2 gives the statistics of seven indicators for three income groups. The indicators are ING (GDP per person employed), TFP (total fish catch and aquaculture production in metric tonnes), AP (fish farming production in metric tonnes), TOP (sum of exports and imports as a percentage of GDP), AFF (value added of agriculture, forestry, and fishing as a percentage of GDP), EF (amount of biologically productive land and water required to meet the consumption demands of a population in global hectares per capita), and RE (share of renewable energy sources in total final energy use in percentage). The table shows that HYCs have the highest mean ING (12.545), TFP (6.586513), and EF (2.543). UMYCs have the highest mean AP (2.6166512) and TOP (99.56). HYCs have the highest mean (44.673) and LMYCs have the lowest mean (16.751) for RE.
Figure 1 shows the graphical picture of the Blue Economy.
The trend diagrams (Figure 2, Figure 3, Figure 4, Figure 5 and Figure 6) show the performance of the selected variables in ACD over time.

4.2. Preliminary Tests

Table 3 shows the results of some pre-estimation tests for LMYCs, UMYCs, and HYCs. The problems are cross-sectional dependence, slope heterogeneity, heteroscedasticity, and autocorrelation. Cross-sectional dependence exists, which means that countries are dependent on each other in this globalized world. The results of two tests for slope heterogeneity show that the slope coefficients across countries are not equal. Modified Wald and Breusch–Pagan/Cook–Weisberg tests show that the variance of the error terms is not constant across countries. Autocorrelation means that the error terms are correlated across countries. This implies that there is significant autocorrelation in each panel.
Table 4 shows the results of the CIPS test for three groups of countries: LMYCs, UMYCs, and HYCs. The results show that most of the variables are non-stationary at level but become stationary at the first difference for all groups. This implies that the variables exhibit a random or unpredictable trend. For instance, lnIG demonstrates greater stability in UMYCs compared to both LMYCs and HYCs at the initial level with the intercept and trend. Similarly, lnTFP is more stable in LMYCs than in UMYCs when examined at the initial level with the intercept and trend. Furthermore, the results underscore variations in the level of stability across the three income groups.
Table 5 shows the results of the panel cointegration test. It shows that the test statistic is significant at 1%, which means that there exists a long-run relationship between the selected variables.

4.3. Regression Results

The primary aim of this research paper is to scrutinize the influence of a range of economic, environmental, and social indicators on the concept of inclusive growth within the context of 19 Asian Cooperation Dialogue member nations. Table 6 displays the outcomes of Driscoll–Kraay standard error regression for three distinct country groups: LMYCs, UMYCs, and HYCs. For LMYCs, all of the coefficients are negative except for lnTFP and lnAP, which are positive. All of the coefficients are statistically significant except for lnTFP, which is significant at 5%. This means that an increase in total fishery production and aquaculture production leads to an increase in inclusive growth, while an increase in trade openness, agriculture, forestry, and fishing, and renewable energy utilization leads to a decrease in inclusive growth for LMYCs. The R-squared is 0.566, which means that the model explains 56.6% of the variation in inclusive growth for LMYCs. For UMYCs, all of the coefficients are positive except for lnAFP and lnRE, which are negative. All of the coefficients are statistically significant except for lnTFP, which is significant at 5%. This means that an increase in inclusive growth, total fishery production, and aquaculture production leads to an increase in inclusive growth, while an increase in agriculture, forestry, and fishing and renewable energy utilization leads to a decrease in inclusive growth for UMYCs. For HYCs, all of the coefficients are positive except for lnTFP and lnRE, which are negative. All of the coefficients are statistically significant except for lnTFP, which is not significant at all. This means that an increase in inclusive growth and aquaculture production leads to an increase in inclusive growth, while an increase in total fishery production and renewable energy utilization leads to a decrease in inclusive growth for HYCs. The F-statistic is high, and the probability is low, which means that the model is statistically significant for HYCs. The R-squared is 0.360, which means that the model explains 36% of the variation in inclusive growth for HYCs.
For LMYCs, the analysis unveils that TFP and AP yield a positive and statistically significant effect on ING, while TOP, AFF, and RE result in a negative and statistically significant impact on ING. This suggests that an upsurge in fishery and aquaculture production can bolster inclusive growth, whereas an increase in trade openness, agricultural activities, and renewable energy utilization can diminish the prospects of inclusive growth within LMYCs. In the case of UMYCs, the results point to a positive and statistically significant impact on ING stemming from ING itself, TFP, and AP, whereas AFF and RE exhibit a negative and statistically significant influence on ING. In essence, this signifies that the enhancement of inclusive growth, alongside increased fishery and aquaculture production, can be conducive to fostering inclusive growth within UMYCs. Conversely, an escalation in agricultural and forestry activities, as well as the utilization of renewable energy sources, may hamper inclusive growth within this income group. For HYCs, the investigation uncovers a positive and statistically significant association between ING and AP, while TFP and RE exhibit negative and statistically significant associations with ING. This suggests that augmenting both inclusive growth and aquaculture production can bolster inclusive growth within the high-income category. However, an increase in fishery production and the utilization of renewable energy sources may act as deterrents to inclusive growth in this group. Additionally, this paper highlights the intricate trade-offs between economic development and environmental sustainability as they relate to trade openness; agriculture, forestry, and fishing; the ecological footprint; and renewable energy utilization. This paper concludes by offering policy implications geared toward the enhancement of inclusive growth in Asia, encompassing aspects such as the improved management of fisheries and aquaculture, the diversification of economic activities, a reduction in the ecological footprint, and an increased focus on renewable energy utilization.

5. Discussion

This section delves into the primary discoveries of the research paper, which investigates the effects of diverse economic, environmental, and social indicators on inclusive growth among 19 member nations of the Asian Cooperation Dialogue, spanning the years from 1995 to 2021. The core objective of this research endeavor is to scrutinize the repercussions of a range of economic, environmental, and social indicators on the concept of inclusive growth. These indicators encompass a spectrum of variables, including total fishery production (TFP), aquaculture production (AP), agriculture, forestry, and fishing (AFF), trade openness (TOP), the ecological footprint (EF), and renewable energy (RE).
These findings reveal that the influence of the independent variables on the dependent variable, which, in this case, is inclusive growth (ING), varies among the three distinct income groups [90]. For LMYCs, the analysis unveils that both TFP and AP yield a positive and statistically significant effect on ING, whereas TOP, AFF, and RE result in a negative and statistically significant impact on ING. This implies that augmenting fishery and aquaculture production can contribute to the enhancement of inclusive growth, whereas increased trade openness, agricultural, forestry, and fishing activities, and the utilization of renewable energy sources may impede inclusive growth within LMYCs [91]. In the case of UMYCs, the results indicate a positive and statistically significant impact on ING emanating from ING itself, TFP, and AP, while AFF and RE exhibit a negative and statistically significant influence on ING. This signifies that the augmentation of inclusive growth, alongside increased fishery and aquaculture production, can be conducive to fostering inclusive growth within UMYCs. Conversely, an escalation in agricultural and forestry activities, as well as the utilization of renewable energy sources, may have the opposite effect, hindering inclusive growth within this income group [92].
For HYCs, the analysis uncovers a positive and statistically significant association between ING and AP, while TFP and RE exhibit negative and statistically significant associations with ING. This suggests that augmenting both inclusive growth and aquaculture production can bolster inclusive growth within the high-income category. However, an increase in fishery production and the utilization of renewable energy sources may negatively affect inclusive growth. This signifies the model’s capacity to provide valuable insights [93].
This paper suggests some policy implications for enhancing inclusive growth in Asia by improving fishery and aquaculture management, diversifying economic activities, reducing the ecological footprint, and increasing renewable energy utilization. The findings of this research paper are consistent with some of the existing literature on the relationship between fishery and aquaculture production and inclusive growth in Asia. For instance, one study found that fishery production has a positive impact on economic growth in Bangladesh, while another found that aquaculture production has a positive impact on economic growth in China. Both investigations similarly reveal that trade openness exerts a detrimental influence on economic growth within these nations. One study corroborates this pattern by illustrating the constructive impact of fishery production on economic growth in Pakistan, while another concurs by underscoring the favorable impact of aquaculture production on economic growth in India [94]. Importantly, both studies reiterate the adverse effect of trade openness on economic growth in these specific countries [95].
Nonetheless, it is worth noting that certain outcomes of this research diverge from select preexisting literature pertaining to the relationship between fishery and aquaculture production and the concept of inclusive growth in the Asian context. For instance, one study pinpoints a negative impact of fishery production on economic growth in Vietnam, whereas another identifies a detrimental influence of aquaculture production on economic growth in South Korea [96]. Strikingly, both investigations concur on the positive influence of trade openness on economic growth within their respective countries. Furthermore, one study ascertains the positive impact of fishery production on economic growth in Indonesia, in contrast to another one that attests to the affirmative impact of aquaculture production on economic growth in Japan. Intriguingly, both studies align in reporting a positive correlation between trade openness and economic growth in their respective nations. These discrepancies between the findings of this research paper and the existing body of literature may be attributed to several factors.
The findings of this research paper have some important policy implications. First, policymakers should promote sustainable fishery and aquaculture practices that can increase productivity and profitability without compromising environmental quality and social equity. This can be achieved by implementing effective regulations, incentives, and monitoring systems to prevent overfishing, pollution, and conflicts among stakeholders. Secondly, it is imperative for policymakers to promote economic diversification to lessen reliance on the agricultural, forestry, and fishing sectors, which not only offer limited value but also entail significant environmental costs. This objective can be realized through the active support of industrialization, urbanization, and the development of the service sector, all of which have the potential to generate increased employment opportunities and diverse income streams for the population. Thirdly, policymakers must prioritize reducing the ecological footprint, as this measure can effectively counteract environmental degradation and the adverse effects of climate change that pose a substantial threat to inclusive growth. Achieving this goal necessitates the implementation of green growth strategies that enhance resource efficiency and environmental preservation through a combination of technological innovation and alterations in behavior. Fourthly, policymakers ought to boost the utilization of renewable energy sources to curtail the consumption of fossil fuels and mitigate the emissions of greenhouse gases, both of which can be detrimental to inclusive growth.

6. Conclusions

This research study has explored the effects of a range of economic, environmental, and social indicators on the concept of inclusive growth within the context of 19 member countries of the Asian Cooperation Dialogue. The study underscored the inherent trade-offs between economic development and environmental sustainability in relation to trade openness, agriculture, forestry, fishing, the ecological footprint, and the utilization of renewable energy. In conclusion, the research posits that the enhancement of inclusive growth in Asia demands concerted efforts toward the improved management of fisheries and aquaculture, the diversification of economic activities, a reduction in ecological footprints, and the increased utilization of renewable energy. The paper also recognizes certain limitations and challenges in the analysis, including concerns related to data availability and quality, model specification, endogeneity, and causality. Consequently, the study suggests potential avenues for future research, including extensions of the analysis to encompass additional regions and indicators. It also recommends the incorporation of dynamic panel data models and causality tests.
There are some recommendations for future research that can extend and improve the analysis and findings of this study. First, future research can use more updated and reliable data sources for some of the indicators, such as the ecological footprint and renewable energy utilization, which may enhance the reliability and validity of the results. Second, future research can include more variables that may affect inclusive growth, such as institutional quality, human capital, innovation, etc., which may enrich the explanatory power and policy relevance of the model. Third, future research can apply more sophisticated methods to address the potential endogeneity, reverse causality, or omitted variable bias issues, such as instrumental variable estimation, panel vector autoregression, or panel data causality tests, which may establish a more robust causal relationship between the independent and dependent variables.

Author Contributions

B.G. and C.Z.: conceptualization; D.W. and W.X.: methodology, formal analysis, investigation, data curation, and writing—original draft preparation; Q.A. and M.A.M.: original draft, visualization, and analysis. All authors have read and agreed to the published version of the manuscript.

Funding

1. Fund name: Policy Mechanism Research of Scale Prevention and Control of Agricultural Nonpoint Source Pollution—the Case of Huaihe basin planting industry (fund number: WGKQ2021075). 2. Fund name: Research on the Lotka-Volterra model of enterprise aggregate population from Huai’an Zhenchuan Transportation Co., Ltd. (fund number: WXXYHD2023). 3. Fund information: The Impact of Market Integration Development on Regional Employment Structure in Hefei Metropolitan Area: Internal Mechanism, Empirical Evidence and Policy Optimization (fund number: 2022AH051664).

Informed Consent Statement

The participating farmers were made fully aware of the purpose and nature of the information being sought from them before the formal interview process.

Data Availability Statement

The data presented in this study are available on request from the corresponding author.

Conflicts of Interest

The authors declare no conflicts of interest.

Nomenclature

(IG) Inclusive Growthgrowth
(FP) Fishery Productionproduction
(AP)Aquaculture Productionproduction
(AFF) Agriculture, Forestryforestry, and Fishingfishing
(CL) Capital Labour–labor
(TO) Trade Opennessopenness
(EF) Ecological Footprintfootprint
(REU)Renewable Energy Utilizationenergy utilization

References

  1. Bunyavejchewin, P.; Nimmannorrawong, P. The asia cooperation dialogue (acd): Formation and development. Ritsumeikan J. Asia Pac. Stud. 2017, 35, 18–29. [Google Scholar]
  2. Brennig, J.J. The Textile Trade of Seventeenth-Century Northern Coromandel: A Study of a Pre-Modern Asian Export Industry; The University of Wisconsin-Madison: Madison, WI, USA, 1975. [Google Scholar]
  3. Fleming, L.E.; Maycock, B.; White, M.P.; Depledge, M.H. Fostering human health through ocean sustainability in the 21st century. People Nat. 2019, 1, 276–283. [Google Scholar] [CrossRef]
  4. Frierson, P. The Last Atoll: Exploring Hawaii’s Endangered Ecosystems; Trinity University Press: San Antonio, TX, USA, 2012. [Google Scholar]
  5. Burkett, V.; Davidson, M. Coastal Impacts, Adaptation, and Vulnerabilities; Springer: Cham, Switzerland, 2012. [Google Scholar]
  6. Ntona, M.; Morgera, E. Connecting SDG 14 with the other Sustainable Development Goals through marine spatial planning. Mar. Policy 2018, 93, 214–222. [Google Scholar] [CrossRef]
  7. Cichowicz, E.; Rollnik-Sadowska, E. Inclusive growth in CEE countries as a determinant of sustainable development. Sustainability 2018, 10, 3973. [Google Scholar] [CrossRef]
  8. Hampton, M.P.; Jeyacheya, J.; Long, P.H. Can tourism promote inclusive growth? Supply chains, ownership and employment in Ha Long Bay, Vietnam. J. Dev. Stud. 2018, 54, 359–376. [Google Scholar] [CrossRef]
  9. Rouzet, D.; Sánchez, A.C.; Renault, T.; Roehn, O. Fiscal Challenges and Inclusive Growth in Ageing Societies; OECD: Paris, France, 2019. [Google Scholar]
  10. Mirzoev, T.; Tull, K.I.; Winn, N.; Mir, G.; King, N.V.; Wright, J.M.; Gong, Y.Y. Systematic review of the role of social inclusion within sustainable urban developments. Int. J. Sustain. Dev. World Ecol. 2022, 29, 3–17. [Google Scholar] [CrossRef]
  11. Aldaco, R.; Ruiz, I.; Margallo, M.; Laso, J.; Hoehn, D. Deliverable Title: D4. 1.1 State of the Art Report of the Seafood Sector in the European Atlantic Area. 2020. Available online: https://neptunus-project.eu/wp-content/uploads/2021/05/D4.1.1-Report-Neptunus-State-of-the-art.pdf (accessed on 31 October 2023).
  12. Naylor, R.L.; Hardy, R.W.; Buschmann, A.H.; Bush, S.R.; Cao, L.; Klinger, D.H.; Little, D.C.; Lubchenco, J.; Shumway, S.E.; Troell, M. A 20-year retrospective review of global aquaculture. Nature 2021, 591, 551–563. [Google Scholar] [CrossRef]
  13. Valenti, W.C.; Kimpara, J.M.; Preto, B.d.L.; Moraes-Valenti, P. Indicators of sustainability to assess aquaculture systems. Ecol. Indic. 2018, 88, 402–413. [Google Scholar] [CrossRef]
  14. Picatoste, X.; Novo-Corti, I.; Tirca, D.M. Human Development Index as an Indicator of Social Welfare. In No Poverty; Springer: Cham, Switzerland, 2021; pp. 449–459. [Google Scholar]
  15. Ojea, E.; Lester, S.E.; Salgueiro-Otero, D. Adaptation of fishing communities to climate-driven shifts in target species. One Earth 2020, 2, 544–556. [Google Scholar] [CrossRef]
  16. Ouattara, N.; Zeufack, A.G. Unlocking East Asian Markets to Sub-Saharan Africa. In Africa in the New Trade Environment Market Access in Troubled Times; World Bank: Washington, DC, USA, 2022; pp. 135–185. [Google Scholar]
  17. Batrancea, L.M.; Rathnaswamy, M.M.; Rus, M.-I.; Tulai, H. Determinants of economic growth for the last half of century: A panel data analysis on 50 countries. J. Knowl. Econ. 2022, 14, 2578–2602. [Google Scholar] [CrossRef]
  18. Kremen, C.; Merenlender, A.M. Landscapes that work for biodiversity and people. Science 2018, 362, eaau6020. [Google Scholar] [CrossRef] [PubMed]
  19. Mansour, S.; Al-Awadhi, T.; Al Nasiri, N.; Al Balushi, A. Modernization and female labour force participation in Oman: Spatial modelling of local variations. Ann. GIS 2022, 28, 229–243. [Google Scholar] [CrossRef]
  20. Lee, J.W. Convergence success and the middle-income trap. Dev. Econ. 2020, 58, 30–62. [Google Scholar] [CrossRef]
  21. Sanguinetti, P.; Moncarz, P.; Vaillant, M.; Allub, L.; Juncosa, F.; Barril, D.; Cont, W.; Lalanne, Á. Pathways to Integration: Trade Facilitation, Infrastructure, and Global Value Chains; CAF: Beasain, Spain, 2022. [Google Scholar]
  22. Korinek, A.; Stiglitz, J.E. Artificial intelligence and its implications for income distribution and unemployment. In The Economics of Artificial Intelligence: An Agenda; University of Chicago Press: Chicago, IL, USA, 2018; pp. 349–390. [Google Scholar]
  23. Świąder, M.; Szewrański, S.; Kazak, J.K.; Van Hoof, J.; Lin, D.; Wackernagel, M.; Alves, A. Application of ecological footprint accounting as a part of an integrated assessment of environmental carrying capacity: A case study of the footprint of food of a large city. Resources 2018, 7, 52. [Google Scholar] [CrossRef]
  24. Usman, M.; Balsalobre-Lorente, D.; Jahanger, A.; Ahmad, P. Are Mercosur economies going green or going away? An empirical investigation of the association between technological innovations, energy use, natural resources and GHG emissions. Gondwana Res. 2023, 113, 53–70. [Google Scholar] [CrossRef]
  25. El-Ramady, H.; Brevik, E.C.; Bayoumi, Y.; Shalaby, T.A.; El-Mahrouk, M.E.; Taha, N.; Elbasiouny, H.; Elbehiry, F.; Amer, M.; Abdalla, N. An overview of agro-waste management in light of the water-energy-waste nexus. Sustainability 2022, 14, 15717. [Google Scholar] [CrossRef]
  26. Barrett, C.B. Overcoming global food security challenges through science and solidarity. Am. J. Agric. Econ. 2021, 103, 422–447. [Google Scholar] [CrossRef]
  27. Muraca, B.; Neuber, F. Viable and convivial technologies: Considerations on Climate Engineering from a degrowth perspective. J. Clean. Prod. 2018, 197, 1810–1822. [Google Scholar] [CrossRef]
  28. Meckling, J.; Allan, B.B. The evolution of ideas in global climate policy. Nat. Clim. Change 2020, 10, 434–438. [Google Scholar] [CrossRef]
  29. Sovacool, B.K.; Hook, A.; Martiskainen, M.; Brock, A.; Turnheim, B. The decarbonisation divide: Contextualizing landscapes of low-carbon exploitation and toxicity in Africa. Glob. Environ. Change 2020, 60, 102028. [Google Scholar] [CrossRef]
  30. Nawaz, K.; Lahiani, A.; Roubaud, D. Natural resources as blessings and finance-growth nexus: A bootstrap ARDL approach in an emerging economy. Resour. Policy 2019, 60, 277–287. [Google Scholar] [CrossRef]
  31. Dombi, M. Modeling the material stock of manufactured capital with production function. Resour. Conserv. Recycl. 2018, 138, 207–214. [Google Scholar] [CrossRef]
  32. Beegle, K.; Honorati, M.; Monsalve, E. Reaching the poor and vulnerable in Africa through social safety nets. Realiz. Full Potential Soc. Saf. Nets Afr. 2018, 1, 49–86. [Google Scholar]
  33. Group, W.B. Democratic Republic of Congo Systematic Country Diagnostic: Policy Priorities for Poverty Reduction and Shared Prosperity in a Post-Conflict Country and Fragile State; World Bank: Washington, DC, USA, 2018. [Google Scholar]
  34. Arvin, M.B.; Pradhan, R.P.; Nair, M. Uncovering interlinks among ICT connectivity and penetration, trade openness, foreign direct investment, and economic growth: The case of the G-20 countries. Telemat. Inform. 2021, 60, 101567. [Google Scholar] [CrossRef]
  35. Weidenfeld, A. Tourism diversification and its implications for smart specialisation. Sustainability 2018, 10, 319. [Google Scholar] [CrossRef]
  36. Sheng, L. The World Trade Organization and the Digital Economy Partnership Agreement: Analog Trade Rules in a Digital Era. In Big Tech Firms and International Relations: The Role of the Nation-State in New Forms of Power; Springer: Cham, Switzerland, 2022; pp. 93–114. [Google Scholar]
  37. Franko, P. The Puzzle of Latin American Economic Development; Rowman & Littlefield: Lanham, MD, USA, 2018. [Google Scholar]
  38. Sandri, S.; Hussein, H.; Alshyab, N.; Sagatowski, J. The European green deal: Challenges and opportunities for the Southern Mediterranean. Mediterr. Politics 2023, 23, 1–12. [Google Scholar] [CrossRef]
  39. Hasan, M.M.; Adnan, A. Nexus between environmental sustainability, energy intensity and food security: Evidence from emerging economies. J. Bus. Socio-Econ. Dev. 2023, 3, 1–16. [Google Scholar] [CrossRef]
  40. Arulkumar, A.; Paramithiotis, S.; Paramasivam, S. Biogenic amines in fresh fish and fishery products and emerging control. Aquac. Fish. 2023, 8, 431–450. [Google Scholar] [CrossRef]
  41. Oboh, A. Diversification of farmed fish species: A means to increase aquaculture production in Nigeria. Rev. Aquac. 2022, 14, 2089–2098. [Google Scholar] [CrossRef]
  42. Davis, K.; Drey, N.; Gould, D. What are scoping studies? A review of the nursing literature. Int. J. Nurs. Stud. 2009, 46, 1386–1400. [Google Scholar] [CrossRef]
  43. Sun, P. Unleashing the Power of 5GtoB in Industries; Springer: Cham, Switzerland, 2021. [Google Scholar]
  44. Wu, H. Trade openness, green finance and natural resources: A literature review. Resour. Policy 2022, 78, 102801. [Google Scholar] [CrossRef]
  45. Raitzer, D.; Wong, L.C.; Samson, J.N. Myanmar’s agriculture sector: Unlocking the potential for inclusive growth. In Asian Development Bank Economics Working Paper Series; Asian Development Bank: Mandaluyong, Philippines, 2015; No. 470. [Google Scholar]
  46. Bentes, B.; Isaac, V.J.; Espírito-Santo, R.V.d.; Frédou, T.; Almeida, M.C.d.; Mourão, K.R.M.; Frédou, F.L. Multidisciplinary approach to identification of fishery production systems on the northern coast of Brazil. Biota Neotrop. 2012, 12, 81–92. [Google Scholar] [CrossRef]
  47. Isaac, V.; Santo, R.; Bentes, B.; Frédou, F.; Mourão, K.; Frédou, T. An interdisciplinary evaluation of fishery production systems off the state of Pará in North Brazil. J. Appl. Ichthyol. 2009, 25, 244–255. [Google Scholar] [CrossRef]
  48. Rauniyar, G.; Kanbur, R. Inclusive growth and inclusive development: A review and synthesis of Asian Development Bank literature. J. Asia Pac. Econ. 2010, 15, 455–469. [Google Scholar] [CrossRef]
  49. Zepeda, C.; Jones, J.; Zagmutt, F. Compartmentalisation in aquaculture production systems. Rev. Sci. Tech. 2008, 27, 229–241. [Google Scholar] [CrossRef] [PubMed]
  50. Chapman, L.J.; Husberg, B. Agriculture, forestry, and fishing sector. J. Saf. Res. 2008, 39, 171–173. [Google Scholar] [CrossRef]
  51. Yankovyi, O.; Goncharov, Y.; Koval, V.; Lositska, T. Optimization of The Capital-Labor Ratio on The Basis of Production Functions in The Economic Model of Production. Sci. Bull. Natl. Min. Univ. 2019, 4, 134–140. [Google Scholar] [CrossRef]
  52. Hye, Q.M.A.; Lau, W.-Y. Trade openness and economic growth: Empirical evidence from India. J. Bus. Econ. Manag. 2015, 16, 188–205. [Google Scholar] [CrossRef]
  53. Gössling, S.; Hansson, C.B.; Hörstmeier, O.; Saggel, S. Ecological footprint analysis as a tool to assess tourism sustainability. Ecol. Econ. 2002, 43, 199–211. [Google Scholar] [CrossRef]
  54. Kuang, Y.; Zhang, Y.; Zhou, B.; Li, C.; Cao, Y.; Li, L.; Zeng, L. A review of renewable energy utilization in islands. Renew. Sustain. Energy Rev. 2016, 59, 504–513. [Google Scholar] [CrossRef]
  55. Gan, Q. The Effect of Change in Main Economic Factors in China and OECD Countries. Ph.D. Thesis, Szent István Egyetem, Gödöllő, Hungary, 2018. [Google Scholar]
  56. Gujarati, D.N. Basic Econometrics; Prentice Hall: Hoboken, NJ, USA, 2022. [Google Scholar]
  57. Mansfield, B. “Modern” industrial fisheries and the crisis of overfishing. In Global Political Ecology; Routledge: New York, NY, USA, 2010; pp. 98–113. [Google Scholar]
  58. Gill, M.; Singh, J.; Gangwa, K. Integrated farming system and agriculture sustainability. Indian J. Agron. 2009, 54, 128–139. [Google Scholar] [CrossRef]
  59. Schmidt, O.; Padel, S.; Levidow, L. The bio-economy concept and knowledge base in a public goods and farmer perspective. Bio-Based Appl. Econ. 2012, 1, 47–63. [Google Scholar]
  60. Goga, S.; Mondliwa, P. Structural transformation, economic power, and inequality in South Africa. In Structural Transformation in South Africa; Oxford University Press: Oxford, UK, 2021; pp. 165–188. [Google Scholar]
  61. Singham, S.A.; Abbott, A.F. Trade, Competition and Domestic Regulatory Policy: Trade Liberalisation, Competitive Markets and Property Rights Protection; Taylor & Francis: Oxford, UK, 2023. [Google Scholar]
  62. Tilman, D. The ecological consequences of changes in biodiversity: A search for general principles. Ecology 1999, 80, 1455–1474. [Google Scholar] [CrossRef]
  63. Altenburg, T.; Rodrik, D. Green Industrial Policy: Accelerating Structural Change towards Wealthy Green Economies; German Institute of Development and Sustainability (IDOS): Bonn, Germany, 2017. [Google Scholar]
  64. Onakoya, A.; Johnson, B.; Ogundajo, G. Poverty and trade liberalization: Empirical evidence from 21 African countries. Econ. Res.-Ekon. Istraživanja 2019, 32, 635–656. [Google Scholar] [CrossRef]
  65. Ilori, O.O.; Tanimowo, F.O. Heteroscedasticity Detection in Cross-Sectional Diabetes Pedigree Function: A Comparison of Breusch-Pagan-Godfrey, Harvey and Glejser Tests. Int. J. Sci. Manag. Res. 2022, 5, 150–163. [Google Scholar] [CrossRef]
  66. Wiedermann, W.; Artner, R.; von Eye, A. Heteroscedasticity as a basis of direction dependence in reversible linear regression models. Multivar. Behav. Res. 2017, 52, 222–241. [Google Scholar] [CrossRef] [PubMed]
  67. Matsushita, Y.; Otsu, T. A jackknife Lagrange multiplier test with many weak instruments. Econom. Theory 2022, 1–24. [Google Scholar] [CrossRef]
  68. Adeabah, D.; Gyeke-Dako, A.; Andoh, C. Board gender diversity, corporate governance and bank efficiency in Ghana: A two stage data envelope analysis (DEA) approach. Corp. Gov. Int. J. Bus. Soc. 2019, 19, 299–320. [Google Scholar] [CrossRef]
  69. Khan, A.; Hussain, J.; Bano, S.; Chenggang, Y. The repercussions of foreign direct investment, renewable energy and health expenditure on environmental decay? An econometric analysis of B&RI countries. J. Environ. Plan. Manag. 2020, 63, 1965–1986. [Google Scholar]
  70. Khetarpal, K.; Riemer, M.; Rish, I.; Precup, D. Towards continual reinforcement learning: A review and perspectives. J. Artif. Intell. Res. 2022, 75, 1401–1476. [Google Scholar] [CrossRef]
  71. Hassan, T.; Song, H.; Kirikkaleli, D. International trade and consumption-based carbon emissions: Evaluating the role of composite risk for RCEP economies. Environ. Sci. Pollut. Res. 2022, 29, 3417–3437. [Google Scholar] [CrossRef] [PubMed]
  72. Shaik, S. Analyzing Crime Dynamics and Investigating the Great American Crime Decline. Ph.D. Thesis, The University of Toledo, Toledo, OH, USA, 2022. [Google Scholar]
  73. Moulder, R.G.; Boker, S.M.; Ramseyer, F.; Tschacher, W. Determining synchrony between behavioral time series: An application of surrogate data generation for establishing falsifiable null-hypotheses. Psychol. Methods 2018, 23, 757. [Google Scholar] [CrossRef]
  74. Westerlund, J. Testing for error correction in panel data. Oxf. Bull. Econ. Stat. 2007, 69, 709–748. [Google Scholar] [CrossRef]
  75. Balli, E.; Sigeze, C.; Manga, M.; Birdir, S.; Birdir, K. The relationship between tourism, CO2 emissions and economic growth: A case of Mediterranean countries. Asia Pac. J. Tour. Res. 2019, 24, 219–232. [Google Scholar] [CrossRef]
  76. Khanal, A. The role of ICT and energy consumption on carbon emissions: An Australian evidence using cointegration test and ARDL long-run and short-run methodology. Int. J. Energy Econ. Policy 2021, 11, 441–449. [Google Scholar] [CrossRef]
  77. Hatemi-J, A. Hidden panel cointegration. J. King Saud Univ.-Sci. 2020, 32, 507–510. [Google Scholar] [CrossRef]
  78. Mehmood, U. Examining the role of financial inclusion towards CO2 emissions: Presenting the role of renewable energy and globalization in the context of EKC. Environ. Sci. Pollut. Res. 2022, 29, 15946–15954. [Google Scholar] [CrossRef]
  79. Fromentin, V. The long-run and short-run impacts of remittances on financial development in developing countries. Q. Rev. Econ. Financ. 2017, 66, 192–201. [Google Scholar] [CrossRef]
  80. Akadiri, A.C.; Gungor, H.; Akadiri, S.S.; Bamidele-Sadiq, M. Is the causal relation between foreign direct investment, trade, and economic growth complement or substitute? The case of African countries. J. Public Aff. 2020, 20, e2023. [Google Scholar] [CrossRef]
  81. Bakry, W.; Mallik, G.; Nghiem, X.-H.; Sinha, A.; Vo, X.V. Is green finance really “green”? Examining the long-run relationship between green finance, renewable energy and environmental performance in developing countries. Renew. Energy 2023, 208, 341–355. [Google Scholar] [CrossRef]
  82. Dellink, R.; Chateau, J.; Lanzi, E.; Magné, B. Long-term economic growth projections in the Shared Socioeconomic Pathways. Glob. Environ. Change 2017, 42, 200–214. [Google Scholar] [CrossRef]
  83. Ade, M.; Rossouw, J.; Gwatidzo, T. Determinants of tax revenue performance in the Southern African Development Community (SADC). In Economic Research Southern Africa, Working Paper; 2018; No. 762; Available online: https://econrsa.org/wp-content/uploads/2022/06/working_paper_762_final.pdf (accessed on 31 October 2023).
  84. Tugcu, C.T. Panel data analysis in the energy-growth nexus (EGN). In The Economics and Econometrics of the Energy-Growth Nexus; Elsevier: Amsterdam, The Netherlands, 2018; pp. 255–271. [Google Scholar]
  85. Ali, U.; Shan, W.; Wang, J.-j.; Amin, A. Outward foreign direct investment and economic growth in China: Evidence from asymmetric ARDL approach. J. Bus. Econ. Manag. 2018, 19, 706–721. [Google Scholar] [CrossRef]
  86. Lv, Y.; Si, C.; Zhang, S.; Sarwar, S. Impact of urbanization on energy intensity by adopting a new technique for regional division: Evidence from China. Environ. Sci. Pollut. Res. 2018, 25, 36102–36116. [Google Scholar] [CrossRef] [PubMed]
  87. Rahman, M.M.; Alam, K. Life expectancy in the ANZUS-BENELUX countries: The role of renewable energy, environmental pollution, economic growth and good governance. Renew. Energy 2022, 190, 251–260. [Google Scholar] [CrossRef]
  88. Ren, D.; Zhang, W.; Ding, Y.; Shen, R.; Jiang, Z.; Lu, X.; Li, X. In situ fabrication of robust cocatalyst-free CdS/g-C3N4 2D–2D step-scheme heterojunctions for highly active H2 evolution. Sol. Rrl 2020, 4, 1900423. [Google Scholar] [CrossRef]
  89. McNown, R.; Sam, C.Y.; Goh, S.K. Bootstrapping the autoregressive distributed lag test for cointegration. Appl. Econ. 2018, 50, 1509–1521. [Google Scholar] [CrossRef]
  90. Jayatilleke, K. Challenges in implementing surveillance tools of high-income countries (HICs) in low middle income countries (LMICs). Curr. Treat. Options Infect. Dis. 2020, 12, 191–201. [Google Scholar] [CrossRef]
  91. Siles, J.; Prebble, M.; Wen, J.; Hart, C.; Schuttenberg, H. Advancing Gender in the Environment: Gender in Fisheries-A Sea of Opportunities; IUCN and USAID: Washington, DC, USA, 2019. [Google Scholar]
  92. Raihan, A.; Tuspekova, A. Dynamic impacts of economic growth, energy use, urbanization, agricultural productivity, and forested area on carbon emissions: New insights from Kazakhstan. World Dev. Sustain. 2022, 1, 100019. [Google Scholar] [CrossRef]
  93. Sour, O.; Maliki, S.B.; Benghalem, A. Modelling the Interconnection Between Technological Leadership and the Level of Use of Information and Communication Technologies. Bus. Ethics Leadersh. 2023, 7, 62–72. [Google Scholar] [CrossRef]
  94. Muriithi, L.N. Adoption of Selected Climate Smart Agriculture Technologies among Smallholder Farmers in Lower Eastern Kenya. Ph.D. Thesis, University of Embu, Embu, Kenya, 2021. [Google Scholar]
  95. Canh, P.N.; Schinckus, C.; Dinh Thanh, S. What are the drivers of shadow economy? A further evidence of economic integration and institutional quality. J. Int. Trade Econ. Dev. 2021, 30, 47–67. [Google Scholar] [CrossRef]
  96. Yoshida, Y.; Lee, H.S.; Trung, B.H.; Tran, H.-D.; Lall, M.K.; Kakar, K.; Xuan, T.D. Impacts of mainstream hydropower dams on fisheries and agriculture in lower Mekong Basin. Sustainability 2020, 12, 2408. [Google Scholar] [CrossRef]
Figure 1. Graphical representation of Blue economy (Source: climatechangenews.com, accessed on 1 November 2023).
Sustainability 16 00429 g001
Figure 2. Trend of inclusive growth in ACD (1995–2021).
Sustainability 16 00429 g002
Figure 3. Trend of fishery production in ACD (1995–2021).
Sustainability 16 00429 g003
Figure 4. Trend of aquaculture production in ACD (1995–2021).
Sustainability 16 00429 g004
Figure 5. Trend of agriculture, forestry, and fishing in ACD (1995–2021).
Sustainability 16 00429 g005
Figure 6. Trend of renewable energy in ACD (1995–2021).
Sustainability 16 00429 g006
Table 1. Literature on Blue Economy, Inclusive Growth, and Ecosystem.
Author(s) Variables MethodologyFindings
[45]Inclusive growthMixed methods The agricultural industry in Myanmar has a lot of untapped potential for promoting fair economic growth, but it requires targeted investments, better infrastructure, and long-term planning to address productivity issues and properly use its competitive advantages.
[46]Fishery productionField SurveysA multidisciplinary approach was used to classify 20 different fishery production systems into 10 different groups based on ecological, economic, social, technological, and political factors, showing the complexity of artisanal fishing in the area and providing useful information for customized management and development strategies.
[47]Fishery production systemGrouping AnalysisThe “RAPFISH” methodology was used to evaluate 20 fishery production systems off the coast of Pará, Brazil, and three main groups were identified: industrial and semi-industrial fisheries that show economic and social sustainability, large-scale artisanal fisheries that show ecological sustainability, and small-scale artisanal fisheries. Some of the recommendations are reducing industrial fishing activities, implementing licensing quotas, funding research for semi-industrial and large-scale artisanal fisheries, offering financial incentives for small-scale artisanal fisheries, and encouraging stakeholder involvement in decision making.
[48]Inclusive growthContent analysis While a consensus definition of inclusive growth is still hard to find, it is clear from a review of ADB’s well-founded knowledge products that it is generally understood to mean “growth with equal opportunities”, including economic, social, and institutional aspects. Major suggestions emphasize the need for interdisciplinary strategies, such as encouraging sustainable economic growth, guaranteeing fair political involvement, and supporting social safety nets and capacity-building initiatives to promote inclusive growth and development.
[49]Aquaculture productionCase studies The research emphasizes that while compartmentalization offers a promising strategy for disease management, its successful implementation in aquaculture depends on aligning with the specific production system and disease epidemiology, implying that it may not be universally applicable, and underscores the importance of integrating HACCP principles for effective biosecurity in compartmentalized systems. Moreover, the study explores the valuable role of compartmentalization in addressing and managing aquaculture disease emergencies.
[50]Agriculture, forestry, and fishingCase studies, SLRThe study indicates that worker protection in the agriculture, forestry, and fishing (AgFF) sector is considerably limited, with regulatory protections weaker than in other industrial sectors and enforcement being insufficient. The vulnerability of AgFF workers is aggravated by immigration policies, and the sector’s workforce has historically experienced legal “exceptionalism,” resulting in the exclusion of many regulatory protections specifically designed to secure workers in other industries.
[51]Capital–laborMathematical analysis The study confirms the presence of a unique marginal rate of technological substitution under optimal capital–labor conditions and establishes a practical procedure for finding the optimal capital–labor ratio in any two-factor production function, grounded in microeconomic theory, where the marginal rate of technological substitution is set to one unit, relying on an accurate representation of key enterprise dynamics.
[52]Trade opennessNew endogenous growth modelThe study introduces a novel trade openness index and employs a multifaceted approach, revealing that while human and physical capital positively influence long-term economic growth in India, trade openness has a negative long-term impact, with short-term positive effects, and Granger causality tests support the existence of trade-openness-led and human-capital-led growth hypotheses.
[53]Ecological footprint Statistical analysis The study presents a methodological framework for calculating ecological footprints associated with leisure tourism in the Seychelles, highlighting the environmental impact of air travel, and raises important questions about the potential role of long-distance travel in safeguarding biodiversity, emphasizing the need for sustainable tourism practices.
[54]Renewable energy utilizationSystematic literature review (SLR)The study provides a comprehensive overview of island energy resources, investigates the current utilization status and development potential of various renewable energy sources for island power grids, and presents advanced technologies and strategies to improve the penetration of renewables, highlighting the increasing importance of sustainable energy solutions for island communities.
Table 2. Descriptive statistics.
PanelMeanMinMaxSd. Dev.Source
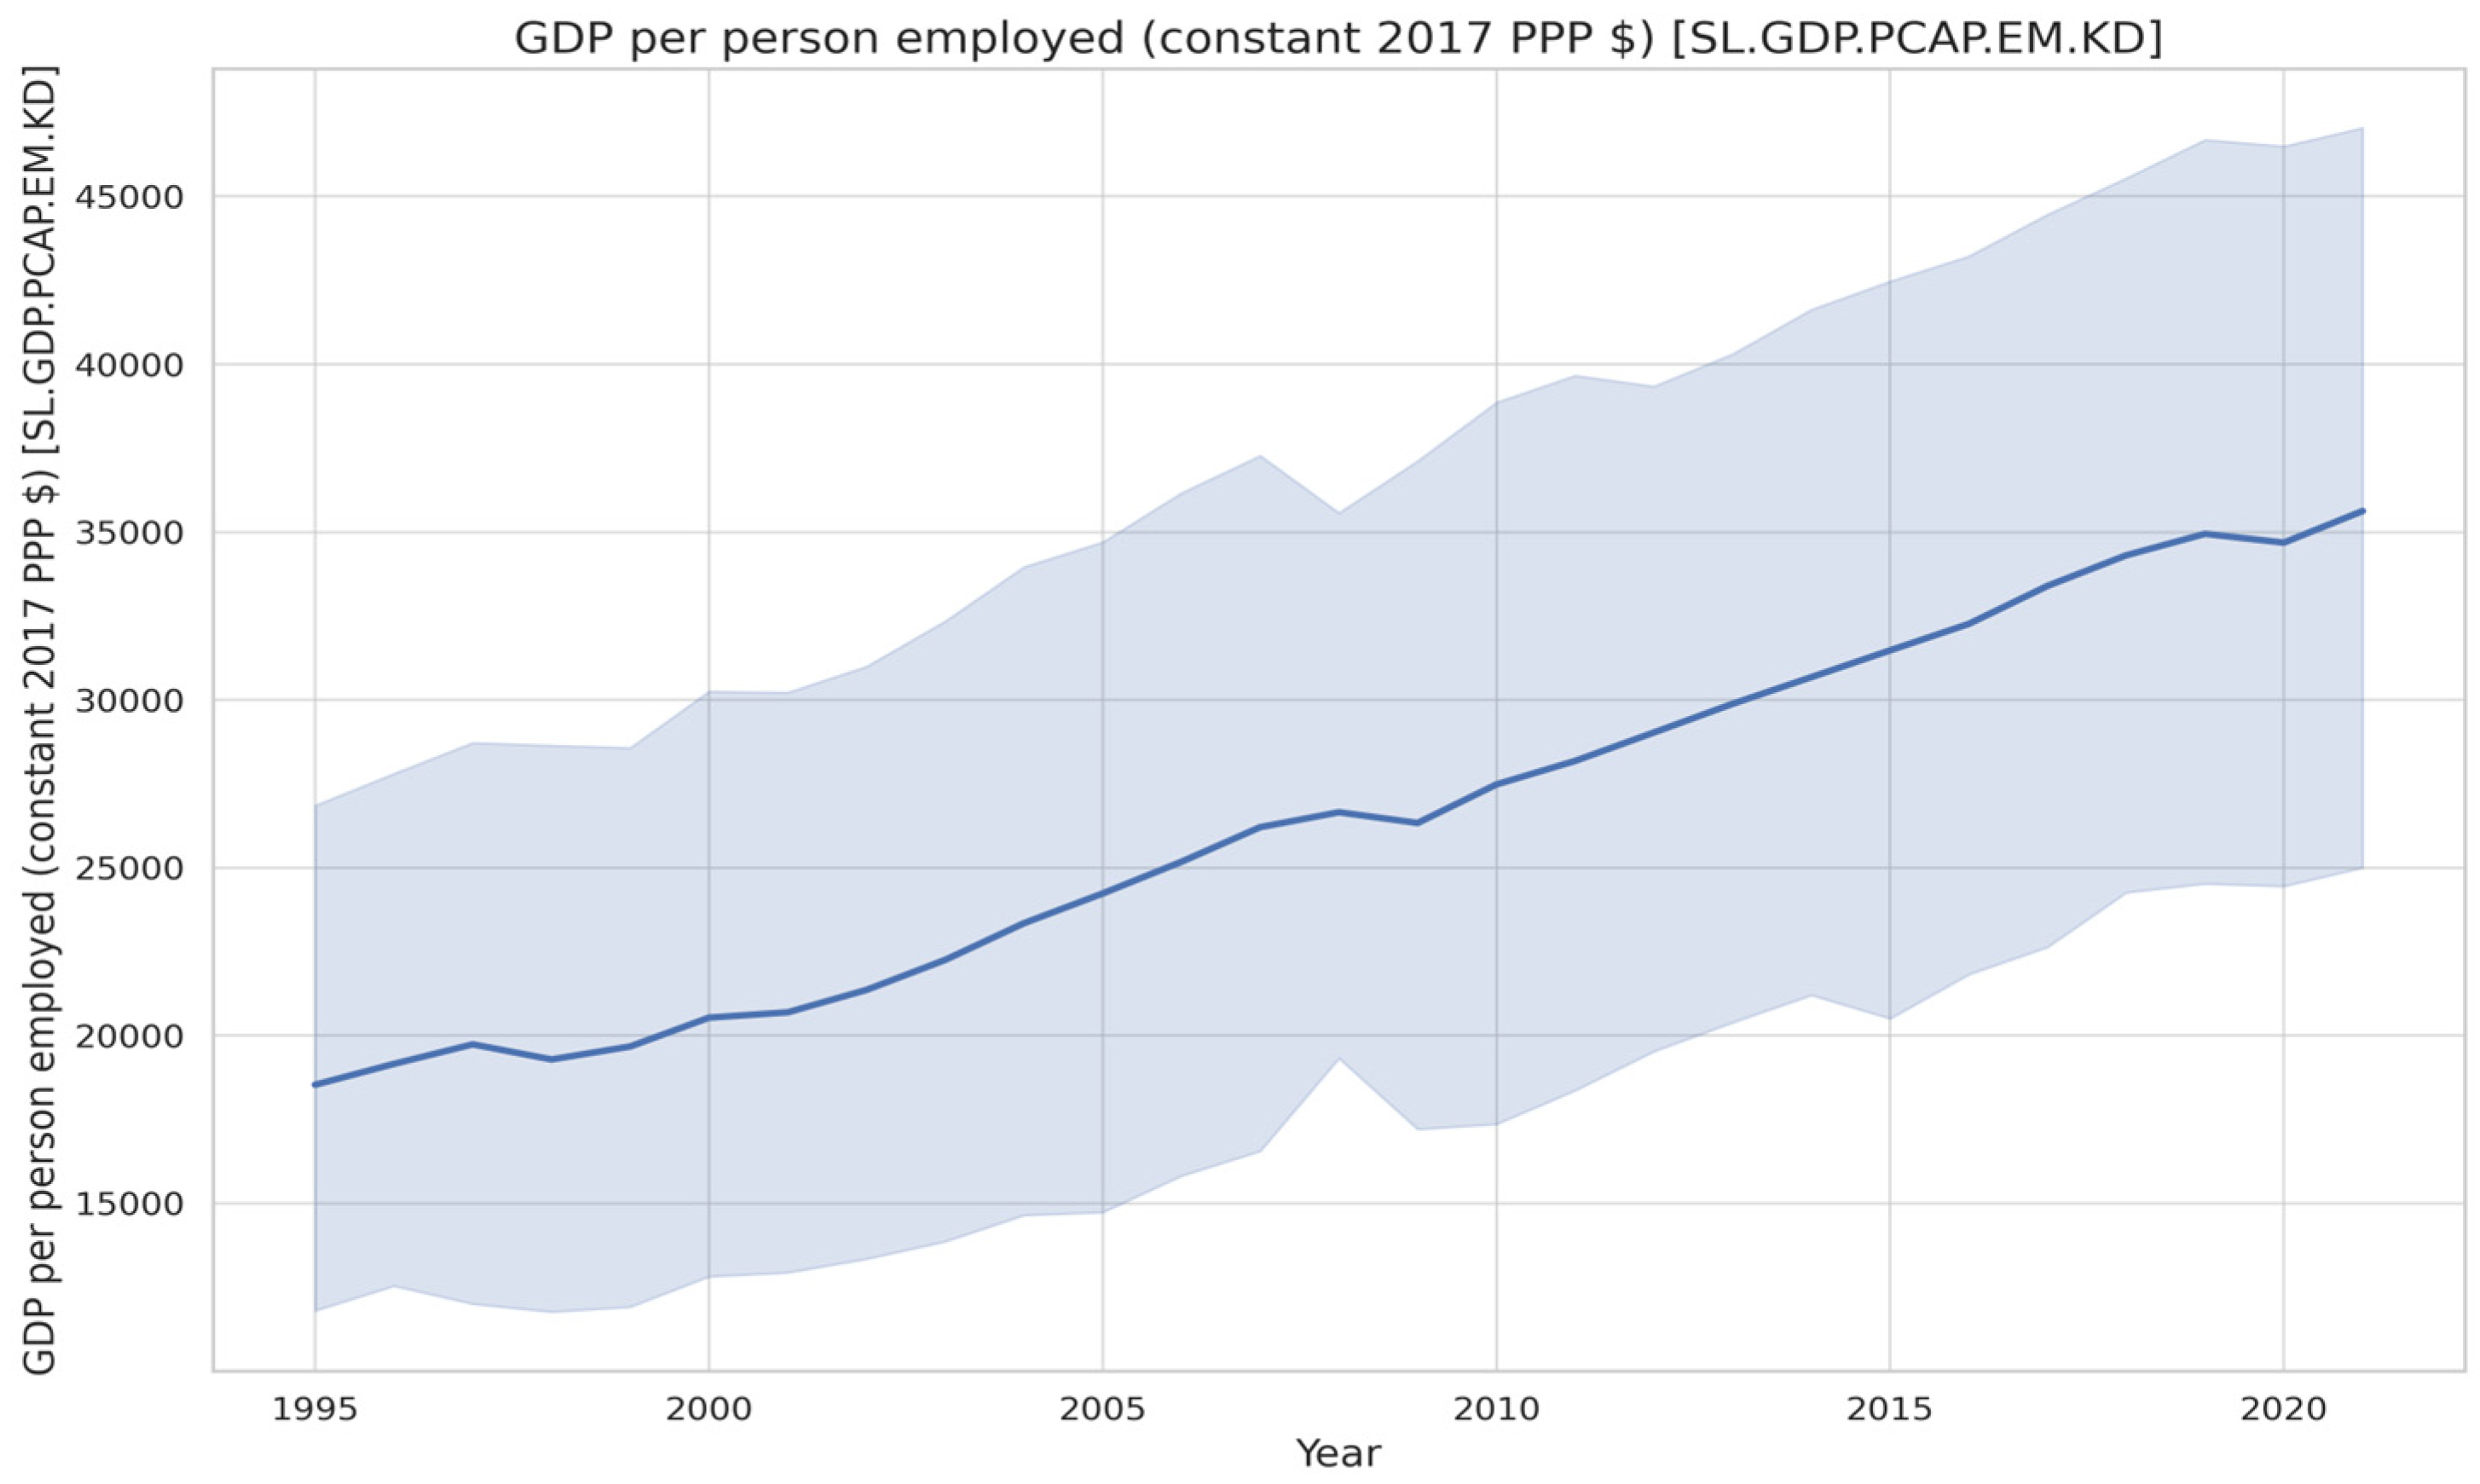
Inclusive growth (ING) (GDP per person employed)
LMYCs8.7156.2349.7680.456W.D.I.
UMYCs11.8659.24512.5640.501
HYCs12.54511.23113.4530.392
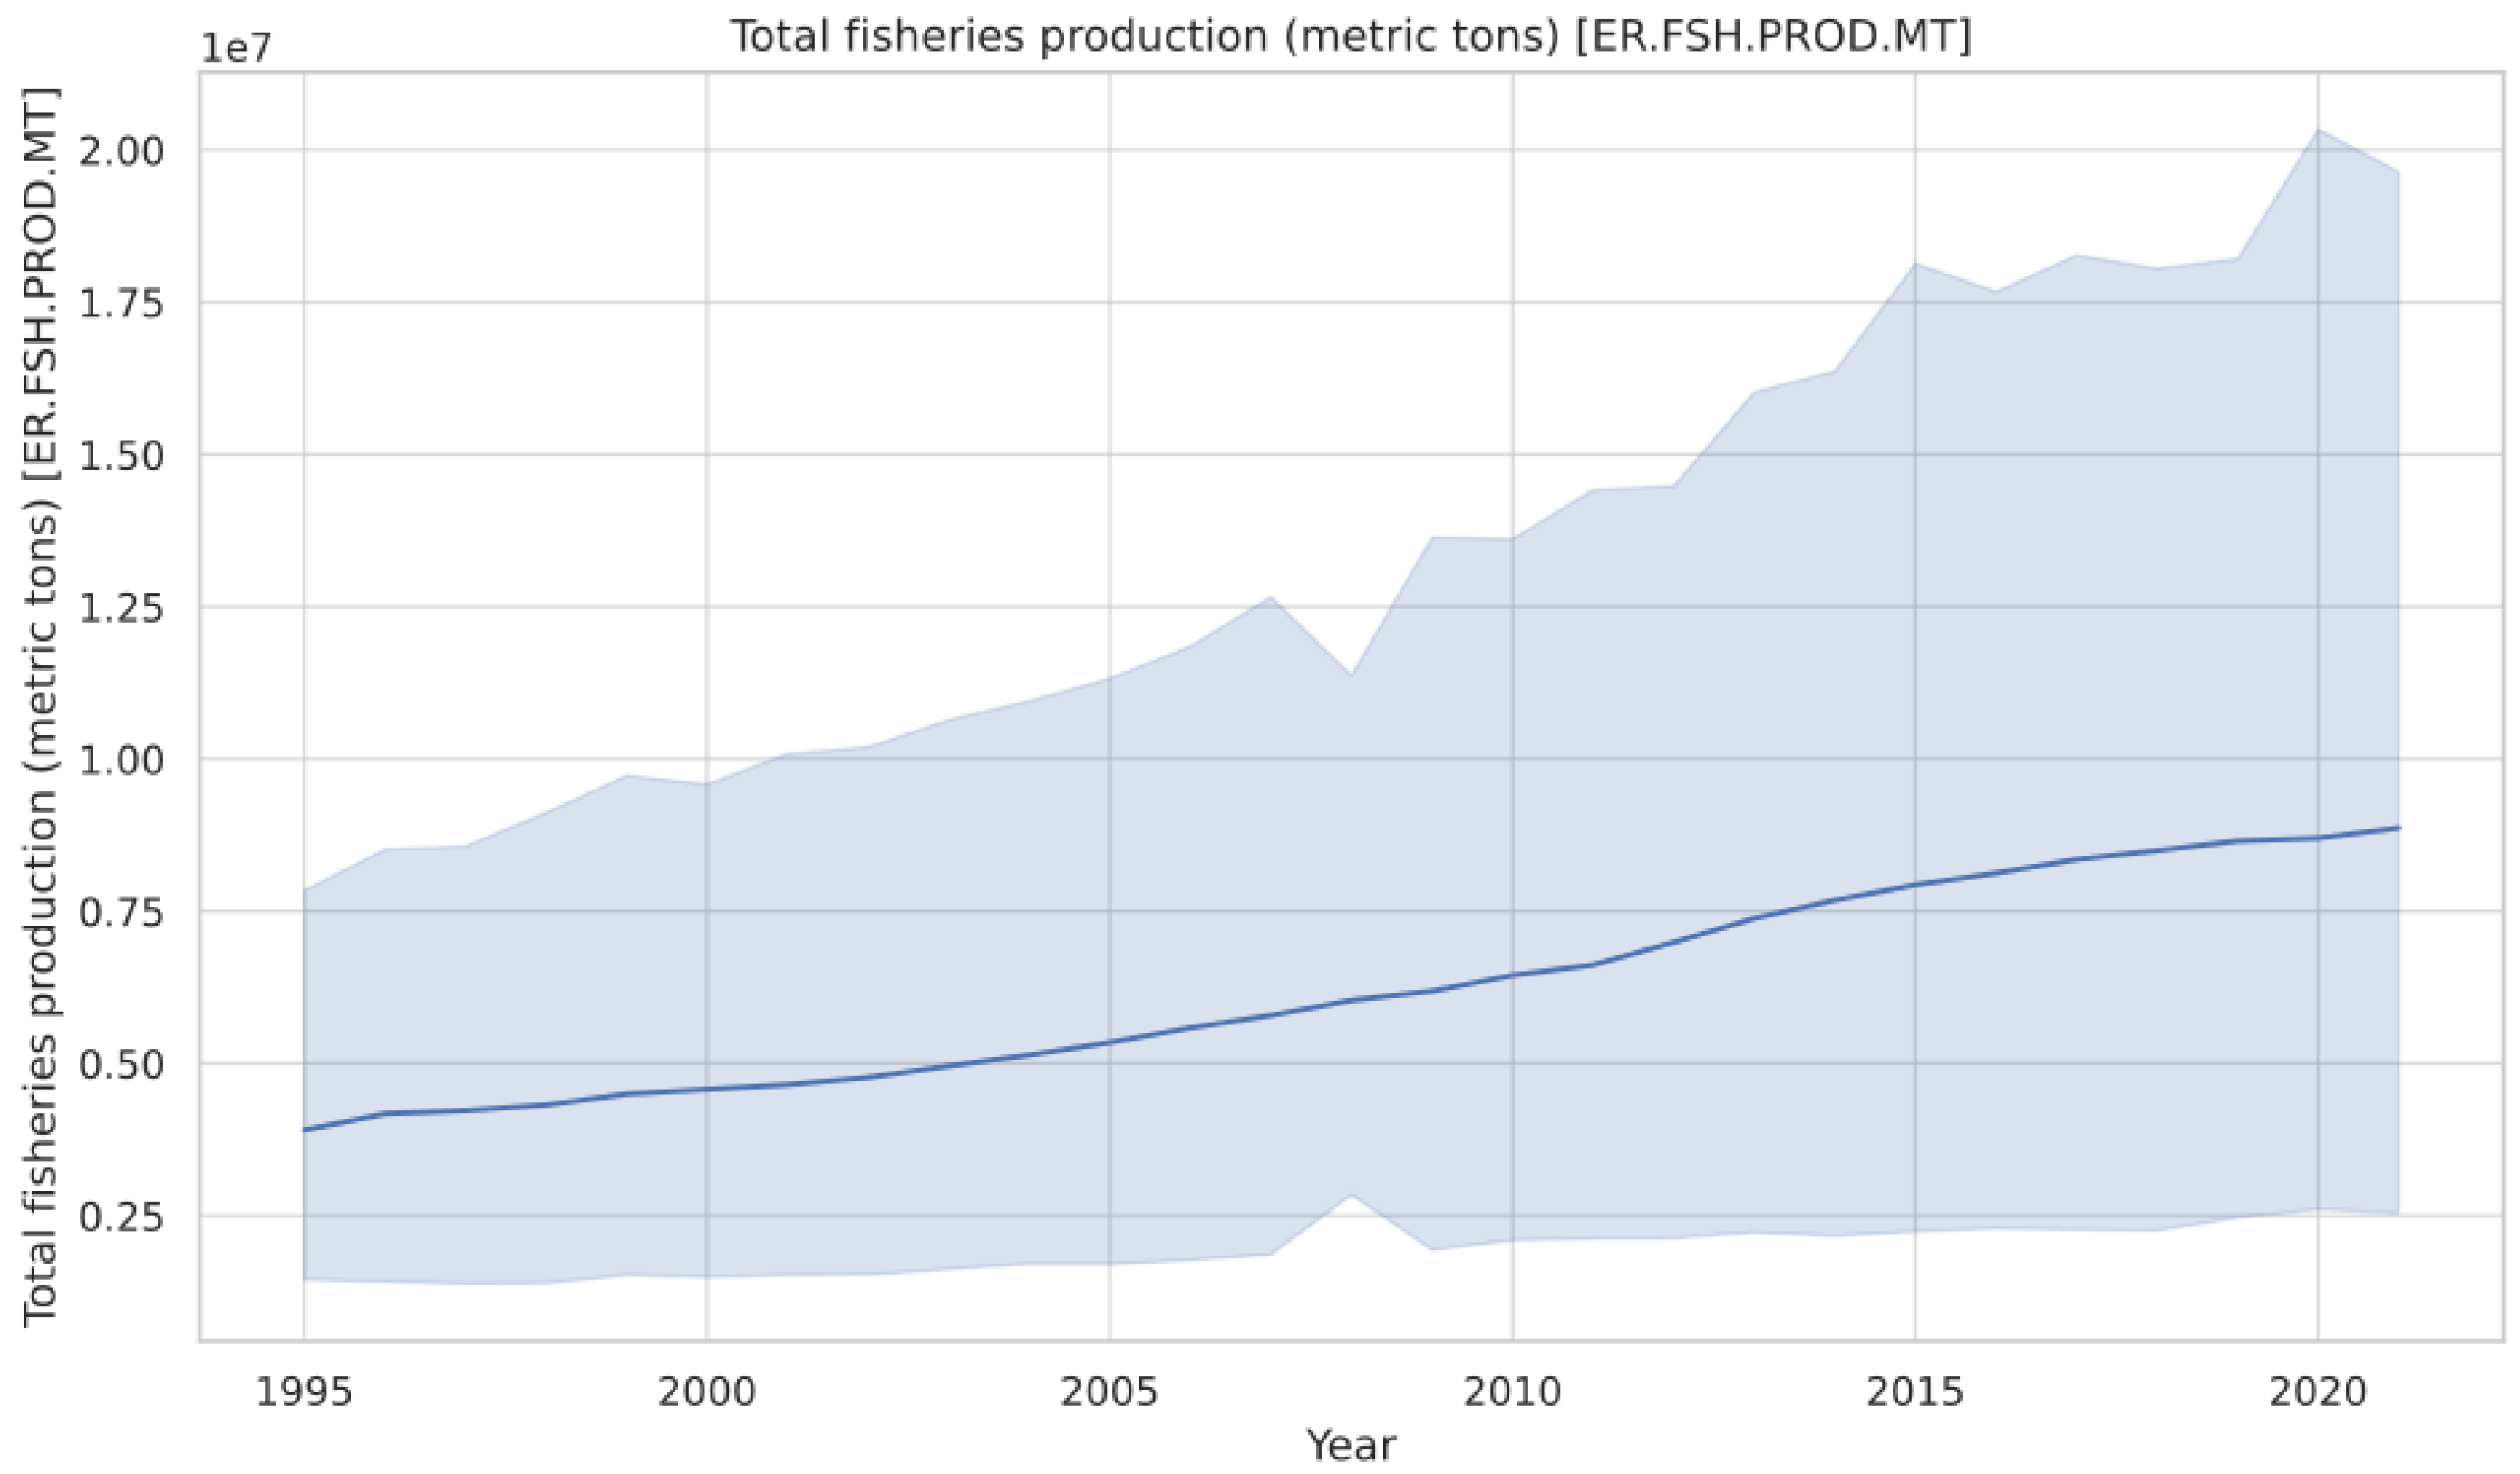
Total fishery production (TFP) (metric tonnes)
LMYCs4.1342041.806724.6154170.43924W.D.I.
UMYCs5.3528022.6492455.6101050.356066
HYCs6.5865134.4455685.607460.026144
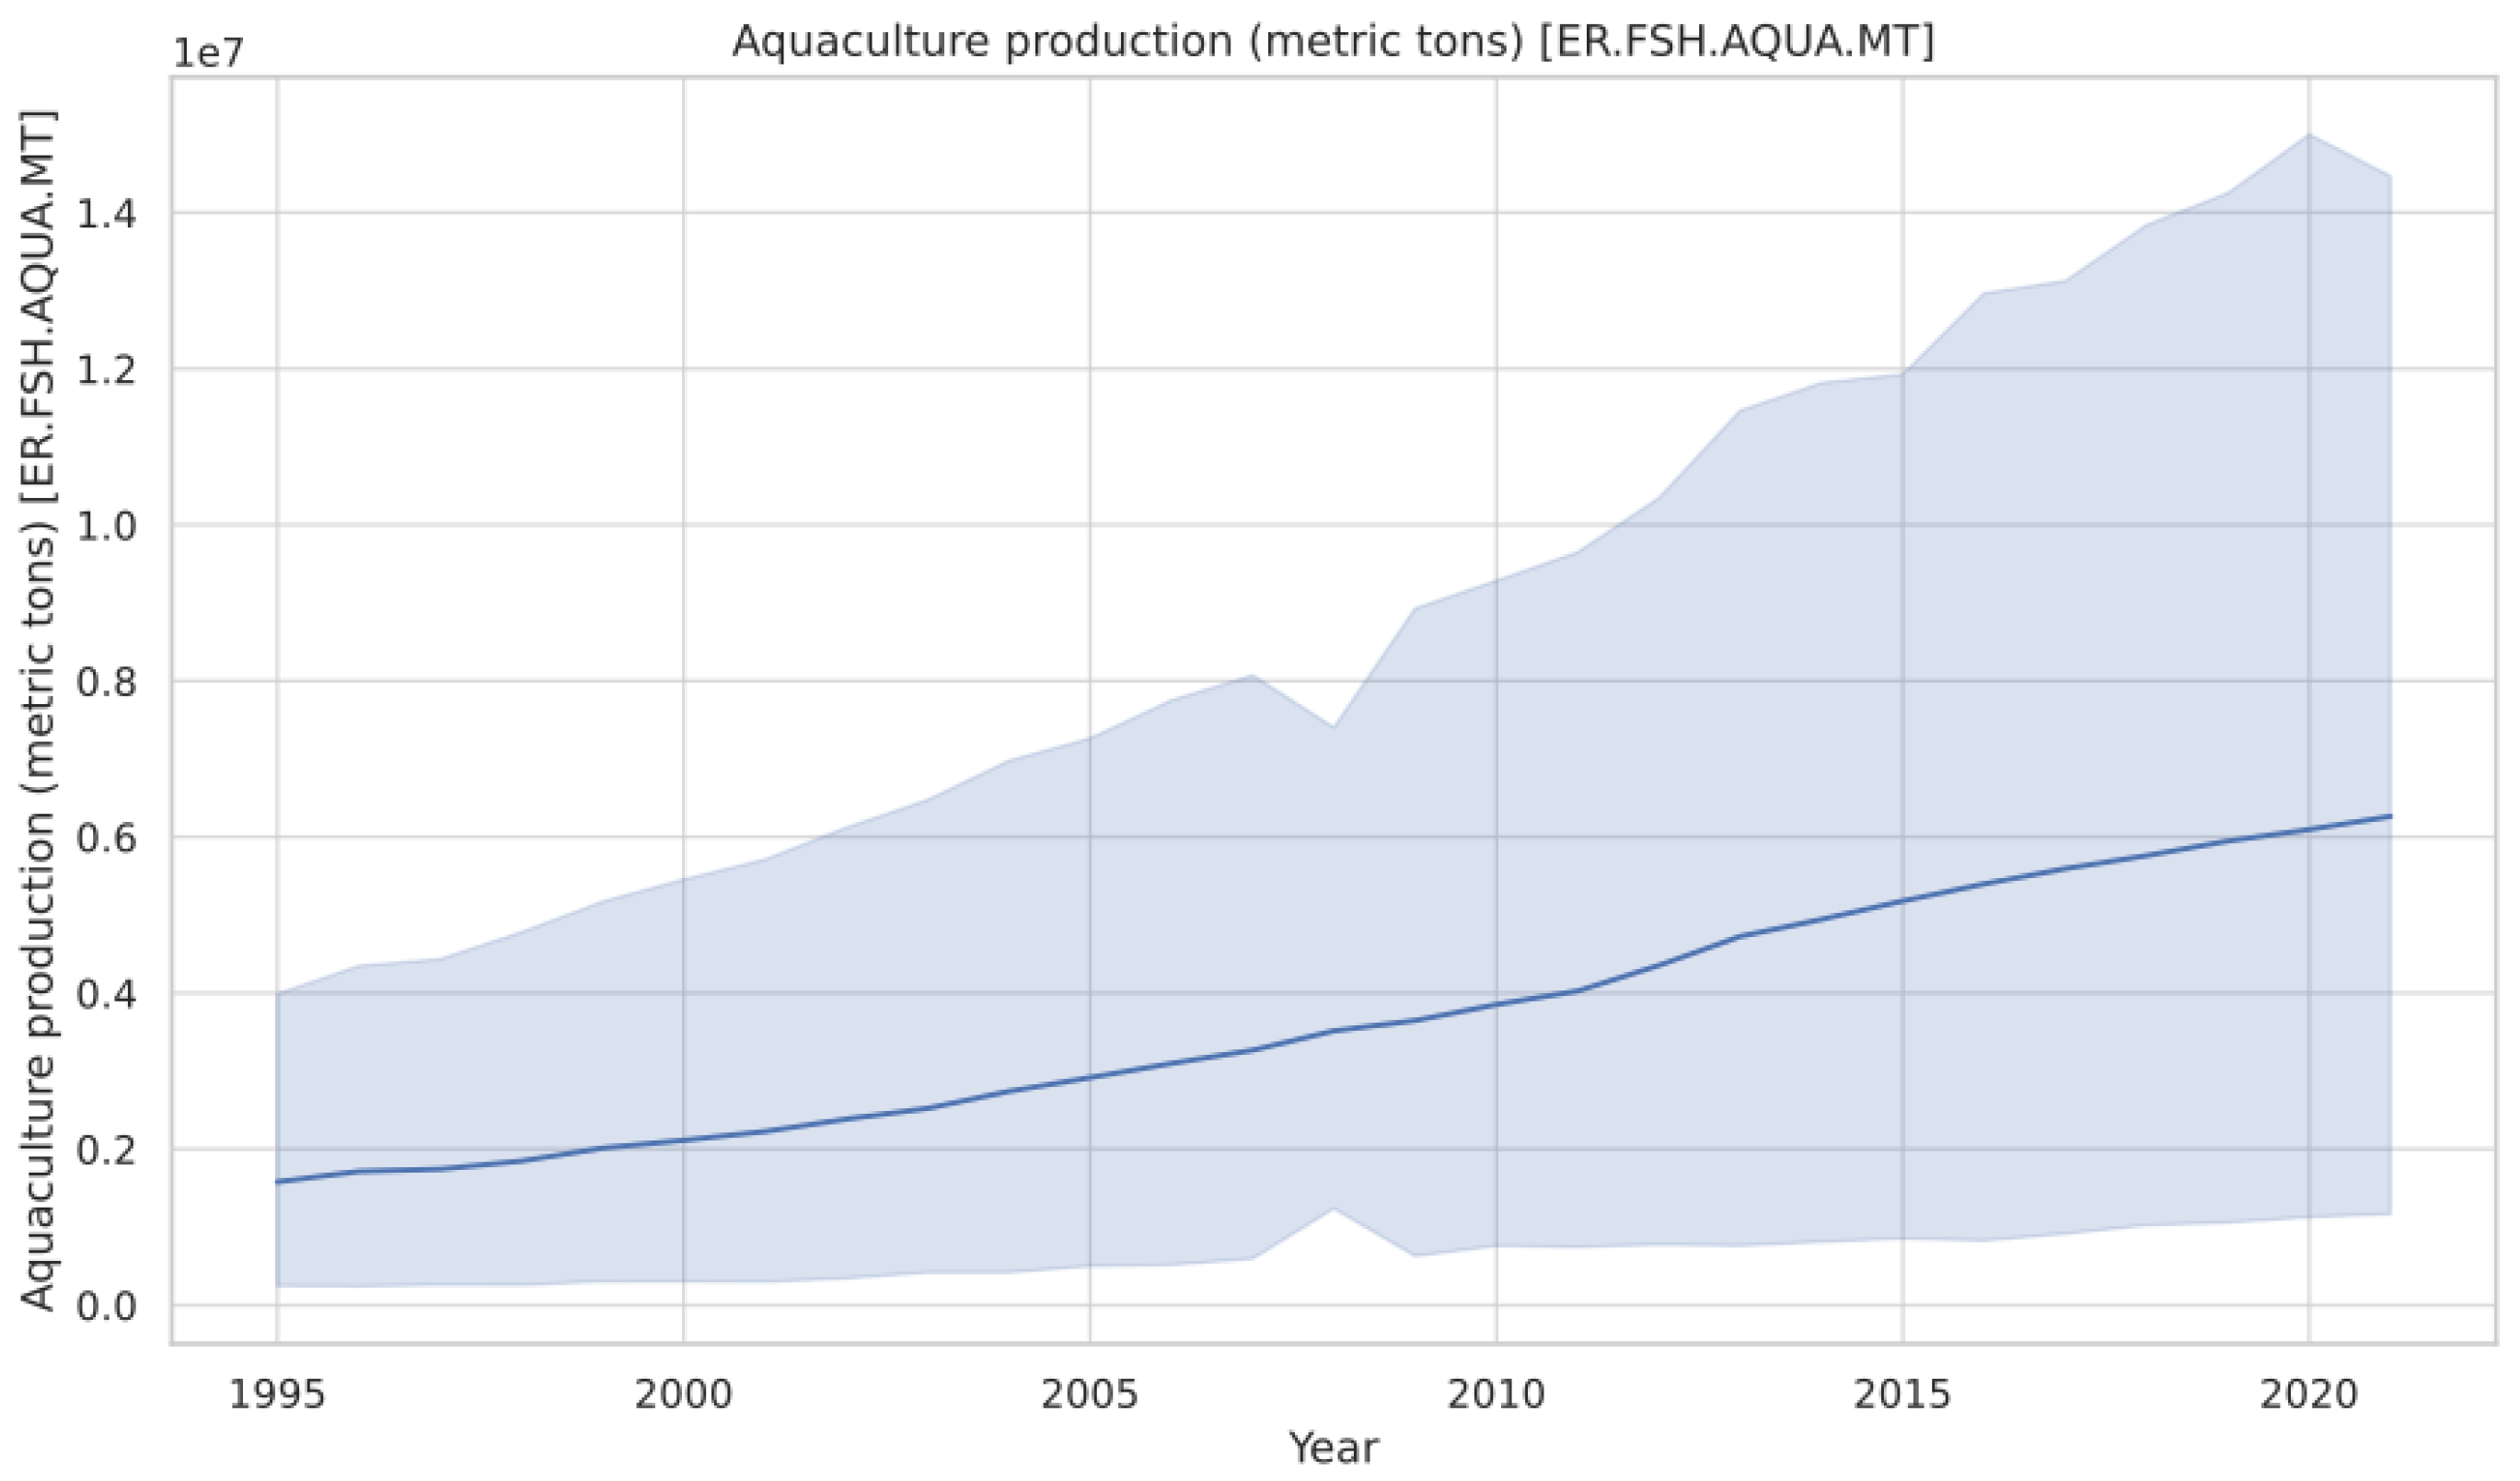
Aquaculture production (AP) (metric tonnes)
LMYCs2.6166512−10.942383.782191.261692W.D.I.
UMYCs1.169859−6.255584.298761.237899
HYCs0.9107528−7.1985356.1072071.59848
Trade openness (TOP) (% of GDP)
LMYCs99.5614.564423.23465.563W.D.I.
UMYCs76.75413.522218.54334.677
HYCs73.2340.154178.35433.453
Agriculture, forestry, and fishing (AFF) (% of GDP)
LMYCs1.322114−3.9630779.1696291.40004W.D.I.
UMYCs2.24804−3.9629277.5101151.55605
HYCs1.282795−4.0124424.8547781.386042
Total ecological footprint (EF) (global hectares per capita)
LMYCs1.603−0.8233.4210.664W.D.I.
UMYCs2.312−1.0653.5460.654
HYCs2.543−0.2343.2130.590
Renewable energy utilization (RE) (% of total final energy use)
LMYCs16.7510.00082.65416.152W.D.I.
UMYCs25.6871.26386.04518.432
HYCs44.6730.01592.66128.654
Table 3. Results of pre-estimation tests.
ProblemTestLower MiddleUpper MiddleHigh Income
Test.statProb.Test.stat.Prob.Test.stat.Prob.
Cross S.DBreusch and Pagan LM1254 ***0.00873.6 ***0.0002264 ***0.000
Pesaran LM adj19.94 ***0.00018.33 ***0.00054.58 ***0.000
Pesaran CD6.107 ***0.0008.127 ***0.00012.52 ***0.000
Slope heterogeneity23.671 ***0.000 26.940 ***0.00024.025 ***0.000
^ adj28.449 ***0.00032.378 ***0.000 31.37 ***0.000
HeteroscedasticityModified Wald
Breusch–Pagan/Cook–Weisberg
Wooldridge
21,889.68 *
14.06 ***
0.000
0.000
11,466.28 *
7.55 ***
0.000
0.000
32,884.53 *
44.82 ***
0.000
0.000
Autocorrelation 228.93 ***0.00012.786 ***0.000208.76 ***0.000
Note: *, *** significant at 1% and 10% percent respectively.
Table 4. Results of CIPS test.
VariablesLower MiddleUpper MiddleHigh Income
At level (intercept and trend)
lnIG−2.074−2.699 **−2.466
lnTFP−3.166 ***−1.813−2.998 ***
lnAP−3.616 ***−3.777 ***−3.870 ***
lnTOP−2.782 ***−2.332−2.051
lnAFP−1.998−1.988−2.164
LNEF−3.063 ***−2.552−3.457 ***
LNRE−2.156 ***2.8992.443 **
At first difference (only with intercept)
lnIG−3.522 ***−3.817 ***−4.047 ***
lnTFP−4.818 ***−3.426 ***−3.787 ***
lnAP−5.286 ***−5.595 ***−5.726 ***
lnTOP−4.365 ***−4.094 ***−3.775 ***
lnAFP−4.239 ***−3.968 ***−4.504 ***
LNEF−3.22 ***3.456 ***3.111 ***
LNRE−4.165 ***−3.707 ***−3.251 ***
Note: ** Significant at 5% and *** significant at 1%.
Table 5. Westerlund cointegration result.
PanelVariance Ratio
Statis.Prob.
LMYCs3.485 **0.0005
UMYCs4.283 ***0.0000
HYCs4.223 ***0.0000
Note: ** Significant at 5%; *** Significant at 1%.
Table 6. Results of Driscoll–Kraay standard error regression.
VariableLower MiddleUpper MiddleHigh Income
Coff.Std. Er.Prob.Coff.Std. Er.Prob.Coff.Std. Er.Prob.
lnIG−0.535 ***0.0550.0000.682 ***0.0530.0000.736 ***0.6890.001
lnTFP0.077 **0.0150.0590.0990.006 **0.086−0.0150.0040.128
lnAP0.232 ***0.0310.0000.053 **0.0330.0550.222 ***0.0410.008
lnTOP0.345 ***0.0900.0060.544 ***0.2480.0002.296 ***0.0830.002
lnAFP0.788 **0.0040.080−0.889 **0.0090.0170.023 ***0.0110.007
LnRE−0.345 ***0.0050.030−0.576 ***0.0030.0120.896 ***0.0100.005
F-Stat177.44 *** (0.000)134.29 *** (0.000)81.89 *** (0.000)
R20.5660.6780.360
Note: ** Significant at 5% and *** significant at 1%.
Disclaimer/Publisher’s Note: The statements, opinions and data contained in all publications are solely those of the individual author(s) and contributor(s) and not of MDPI and/or the editor(s). MDPI and/or the editor(s) disclaim responsibility for any injury to people or property resulting from any ideas, methods, instructions or products referred to in the content.

