Article

Evaluation of Incinerator Performance and Policy Framework for Effective Waste Management and Energy Recovery: A Case Study of South Korea

1
National Institute of Environmental Research (NIER), Hwangyeong-ro 42, Incheon 22689, Republic of Korea
2
Environmental Health Technology Institute (EHTI), Heojun-ro, Seoul 20226, Republic of Korea
*
Author to whom correspondence should be addressed.
Sustainability 2024, 16(1), 448; https://doi.org/10.3390/su16010448
Submission received: 3 November 2023 / Revised: 26 December 2023 / Accepted: 28 December 2023 / Published: 4 January 2024
(This article belongs to the Special Issue Sustainable Waste Management in the Context of Circular Economy)

Abstract

:
Waste incineration is a crucial component of waste management as it is the final stage of circular utilization and the initial phase of disposal. Effective waste management prioritizes energy recovery from waste and substantial waste volume reduction while committing to minimizing air pollutant emissions, particularly nitrogen oxides (NOx). This study involves an in-depth analysis of operational data from 44 incineration facilities in South Korea spanning 5 years, supplemented by empirical measurements from 14 sites. This study aimed to assess three key aspects of these incineration facilities: (1) waste volume reduction characteristics, (2) energy recovery capabilities, and (3) NOx emission reduction performance. We examined how these elements interact within the policy framework governing incinerator management in South Korea. Quantitatively, incinerating 100 tons of municipal waste resulted in a gain of 338.7 m3 in landfill capacity and recovery of 637.5 GJ of energy in the form of heat or electricity. Notably, South Korean incineration facilities significantly extend the lifespan of landfill sites, aligning closely with the objectives of the South Korean Ministry of Environment’s “No More Direct Landfilling of Household Waste Policy”. This positive outcome is further reinforced by the “Incineration Tax Reduction Policy”, which incentivizes active efforts toward energy recovery during incineration. Our study provides decision-makers with valuable insights for achieving a harmonious equilibrium between environmental sustainability and resource utilization, thereby contributing to the continuous improvement of policies aimed at South Korea’s vision of achieving a circular economy.

1. Introduction

Efficient urban solid waste management is pivotal for advancing toward a sustainable circular economy. Countries vary in their progress toward achieving a circular economy, with policies tailored to their unique conditions, including income levels [1]. Korea has been actively pursuing a circular economy society [2], outlining waste management priorities in the Environmental Act of Korea. These priorities focus on (1) resource conservation, (2) extending product lifespans, (3) recycling, and (4) disposal [3]. Notably, similar priorities are observed in Europe [4] and the United States [5]. In legal terms, Korea classifies material recycling and energy recovery under the broader category of “recycling” [6]. Material recycling takes precedence over energy recovery. Energy recovery encompasses various methods, such as thermal energy recovery through incineration, gas and liquid fuel conversion through pyrolysis, and solid fuel recovery from combustible waste [7]. Landfill disposal, which is the final phase, follows this recycling process.
Waste incineration is the last step in recycling, just before landfill disposal. Its placement in the waste management hierarchy implies two key performance expectations [8,9]. First, incineration aims to achieve a marked reduction in waste before it reaches the landfill. It plays a vital role in reducing the volume of non-recyclable wastes, thereby conserving valuable landfill space [10]. Notably, in Korea, a substantial portion of waste undergoes direct landfilling without prior recycling or incineration, an example being the Seoul Metropolitan Area (SMA) landfill site. In 2020, 25% (0.75 Mt/y) of the total municipal waste generated, amounting to 3 Mt/y, was directly landfilled [11]. The Korean government has implemented a comprehensive plan to maximize landfill capacity and promote recycling, prohibiting direct landfilling of municipal waste in standard trash bags. This policy, which will be implemented in 2026 in the SMA and 2030 in other regions [11], emphasizes the urgent need to increase recycling rates. As a critical step in this process, non-recyclable waste must undergo incineration before being transferred to the landfill. The incineration process is expected to substantially reduce waste volume, leading to substantial conservation of space in landfill sites. Although many studies have focused on reducing the total amount of waste, only limited studies have conducted quantitative evaluations of the potential of incineration in reducing the volume required for landfill disposal. This measure is expected to require additional incineration capacity. For example, Seoul plans to install a new incineration facility (1.0 kt/d) in three administrative districts located in SMA in addition to the five incineration facilities that are currently in operation (2.9 kt/d), and Incheon plans to install two new incineration facilities (0.5 kt/d), in addition to the two currently operational facilities (1.0 kt/d, excluding island areas). Gyeonggi-do, which currently operates seven incineration facilities (1.4 kt/d), plans to install five new facilities (1.6 kt/d) and expand three facilities (plus 0.7 kt/d, existing facilities to be replaced) [12]. Along with installing new facilities, inspections, and evaluations are required to maintain the effectiveness of existing facilities.
Second, incineration involves energy recovery. This process effectively harnesses the thermal energy generated during incineration, typically achieved through equipment such as waste heat boilers. The recovered energy can be utilized in various forms, such as thermal energy in the form of steam and hot water or as electrical energy by directing steam to turbines. Incineration facilities offer two important economic benefits through energy recovery [13,14]. The first involves the use of the recovered energy or selling it externally. The second incentive is government-driven. As of 31 December 2008, incineration facilities that process municipal solid waste in the European Union and have an energy recovery efficiency equal to or greater than 0.65 are designated as recovery (R1) facilities rather than disposal (D10) facilities [4]. The Ministry of Environment of Korea (ME) has reduced the incineration tax for facilities with an energy recovery efficiency equal to or greater than 50%, as calculated using the locally modified R1 formula (Equation (2)) [15] (S1 in Supplementary Information). Because the recovery efficiency value is an important criterion for calculating the reduced amount, ME has implemented an official certification system for verifying recovery efficiency results. However, the Korean government’s incentives do not encourage incineration activities.
Korea has clear waste treatment priorities, and related policies have been implemented based on these priorities [3]. Providing incentives to incineration facilities with high energy recovery efficiency does not encourage incineration activities. The purpose of these incentives is to compensate for the energy recovery efforts in the incineration process, which are necessary to support a circular economy society. From a broader perspective, energy recovery offers various benefits. The recovered energy can replace other sources of energy, such as coal, diesel, and natural gas, thereby conserving energy. This positive energy replacement effect also contributes to the reduction in greenhouse gas emissions on a national level [16,17,18]. However, many studies have indicated that greenhouse gas emissions will inevitably increase in the future owing to the changing properties of waste. Istrate et al. [19] have reported that carbon emissions from incineration will increase by 19–100% owing to potential changes in waste composition and the decarbonization process of the electrical matrix. Through a pilot-scale life cycle assessment, Han et al. [20] estimated that if all landfilled plastic waste in China were incinerated, the carbon footprint would have a projected increase of 100.47% by 2050 [20]. However, air pollutants emitted through incineration have a negative impact on the environment. Countries worldwide have implemented legal regulations to control air pollutants emitted from incineration facilities. In Korea, incineration facilities are required to monitor 39 parameters, including dioxin and nitrogen oxides (NOx) [21,22]. In areas with poor air quality, such as the SMA, stringent management has been implemented by setting separate emission limits. In addition, for emission facilities larger than a certain size, a tele-monitoring system (TMS) was installed at the outlet, and seven parameters (NOx, dust, sulfur dioxide, hydrogen chloride, hydrogen fluoride, atmospheric ammonia, and carbon monoxide) were continuously measured among the emitted pollutants. Real-time monitoring is conducted to evaluate compliance with the stipulated emission limits, and the results are promptly released [23].
Numerous studies have examined NOx emissions from incinerators [24,25,26]. NOx plays a vital role in Korea’s air quality management policies. In 2019, Korean incinerators emitted NOx at 30.5 ppm, which is 43.5% of the corresponding emission limit (70 ppm) [27]. From an administrative perspective, the emission-to-limit ratio represents the overall management level for that specific pollutant. This ratio is introduced to rank the relative importance of pollutants from a management perspective and is not intended to perform comparisons among the pollutants themselves. The emission-to-limit ratio of other pollutants was in the range of 5–14% (e.g., 5% for dioxins, 10% for particulate matter, and 14% for HCl). Furthermore, Korea has lowered the NOx emission limit from 70 to 50 ppm by 2020. Thus, it is crucial to evaluate how incineration facilities adapt to this reduction. Typical NOx reduction systems for incinerators are selective non-catalytic reduction (SNCR) and selective catalytic reduction (SCR) systems [24]. SNCR achieves 50% to 75% reductions in NOx, depending on the reagent dosing rate [28], while SCR achieves 60% to 85% [29] or up to 90% [30] reductions, which are generally higher than the reductions obtained by SNCR.
The aims of this study were to discern the three critical performance factors of incineration facilities: waste volume reduction characteristics, energy recovery characteristics, and NOx emission reduction characteristics, and analyze how these factors operate in Korea’s incineration facility management policy framework. Thus, we conducted a comprehensive analysis of the 5-year operational data from 44 municipal waste incineration facilities across Korea, with a detailed investigation of 14 of these facilities.

2. Materials and Methods

2.1. Target Waste and Facilities

The target waste was municipal waste discharged into standard trash bags. Industrial waste, such as construction waste, was excluded. According to the sixth national survey on waste in Korea [31], the amount of waste generated in Korea was 195.5 Mt/y in 2020, of which household-type waste (HTW) was 17.3 Mt/y, and industrial-type waste, which is generated from non-residential purposes (e.g., workplaces and demolition), was 178.2 Mt/y. HTW included recyclable resources (HTWR) and food resources (HTWF), which were 4.6 Mt/y (26.5%) and 4.7 Mt/y (27.0%), respectively. The recycling rates of these two types of waste were as high as 80.0 and 73.9%, respectively. Meanwhile, the amount of waste discharged in standard trash bags (HTWB) was 8.0 Mt/y (46.5%). HTWB can be considered waste after separating the HTWR and HTWF from the HTW. Therefore, the recycling rate of the HTWB was low. However, its direct landfilling and incineration rates were high at 31.3% (2.5 Mt/y) and 56.3% (4.5 Mt/y), respectively. In this study, the target waste was HTWB. Considering its combustible composition of 90.6%, HTWB provides opportunities for refining waste classification while emphasizing the significance of waste-to-energy incineration.
The target facilities were 44 facilities that received energy recovery efficiency certificates for 5 consecutive years, from 2019 to 2023 (Table 1). They incinerated HTWB, and the incineration capacity of each facility ranges from 80 to 400 (t/d). All the facilities have stoker-type incinerators, which have been widely used because of their excellent ability to handle various types of waste [32]. All the target facilities were equipped with steam boilers to recover heat energy, and the boilers were integrated with incinerators. The steam produced is used in the form of thermal energy, such as steam and hot water, or is converted into electrical energy using a steam turbine. SCR and SNCR are applied to reduce NOx emissions from air pollutants, and bag filters and electrostatic precipitation are used to reduce particulate matter.
Incineration facilities situated at the same site were referred to as plants. The plants were classified into three groups based on the incineration capacity of the facilities: p100, p200, and p300. Within each group, serial numbers, such as -01, -02... etc., were assigned to each site according to the recovery efficiency. If there is only one facility at a site, number 0 is recorded after the serial number, and if there are multiple facilities at a site, lowercase letters (a, b, or c) are used after the serial number (S2 in Supplementary Information).
For 14 facilities (hereafter, “focus target facilities”), NOx emissions, before and after emission control measures, were measured, and the moisture, combustible, and ash contents of the incineration residues were analyzed. The 14 facilities belonged to 1 of 3 incineration capacity groups (p100, p200, or p300) that exhibited an R1 recovery efficiency of 60 to 80% (Table 2). For facilities equipped with both SNCR and SCR (three facilities), located in areas close to residential areas, the prevention facilities operated simultaneously to meet the strengthened NOx emission limit.

2.2. Determination of Waste Mass, Volume, and Components through Incineration

The waste input, bottom ash, fly ash emissions, and other solid matter emissions over 5 years from 2018 to 2022 were investigated for the 44 facilities. The waste mass reduction rate was examined for 199 out of 220 cases, excluding 21 cases where data acquisition posed challenges.
To determine the contribution of incineration on preserving landfill capacity, it is necessary to quantify both the reduction in mass and volume. The densities and specific volumes of waste and bottom ash were investigated to quantify the volume reduction. HTWB had a density of 0.171 t/m3 and specific volume of 5.848 m3/t, which were determined as follows: (1) HTWB contained in standard trash bags was collected; (2) the bags were torn, and the contents were evenly mixed; (3) they were then placed in a 200 L container; (4) the container was dropped thrice from a 30 cm height, and samples were added in reduced quantities; (5) this process was repeated until there was no further reduction; and (6) the volume and mass were measured [31]. After incineration, the density and specific volume of the bottom ash were 1.387 t/m3 and 0.721 m3/t, respectively [33]. The density of the fly ash was assumed to be the same as that of the bottom ash.
During the landfilling process of HTWB, its volume undergoes immediate reduction through compaction or compression under its own weight. After landfilling, the volume of HTWB also decreases over time owing to biological changes [34,35]. However, the qualitative assessment of the effects of these factors on the volume change in HTWB is beyond the scope of this study. Therefore, to determine the landfill capacity required for incineration, the hypothetical volume change in HTWB expected to occur at landfill sites was considered as a simple ratio before and after compaction (Equation (1)). Notably, our study did not consider various causes of the volume change. In addition, the incineration ash was assumed to be incompressible.
O v e r a l l   v o l u m e   c o m p a c t i o n   r a t i o   ( % ) = 1 V o l u m e   a t   l a n d f i l l   s i t e V o l u m e   a t   t h e   s p e c i f i c   v o l u m e   m e a s u r e m e n t × 100
The combustible, moisture, and ash contents of the waste before and after incineration were compared using the SigmaPlot 8.0 graphical software. The bottom ash was designated as waste after incineration. The bottom ash samples collected from the 14 focus target facilities were placed on evaporating dishes and dried for 4 h at 105–110 °C. Subsequently, they were cooled in a desiccator, and their mass was measured to determine the moisture content by calculating the mass difference before and after heating [36]. The dried samples were then mixed with ammonium nitrate solution (25%) and heated in an electric furnace at 600 ± 25 °C for 3 h. They were then cooled in a desiccator, and their mass was measured to obtain the combustible content by calculating the mass difference before and after heating [37]. The portion that remained after excluding moisture and combustible matter was regarded as ash.
As for the outcomes pertaining to the three waste components before the incineration process, data on the properties were collected from 40 HTWB. The data correspond to each combination of urban scale (size) groups (four types) and residential and lifestyle groups (ten types) in Korea [31]. This analysis only focused on combustible waste after dividing HTWB into combustion waste (waste paper, waste wood, and waste plastics, accounting for 90.6% of HTWB by mass) and incombustible waste (waste glass and waste metals, accounting for 9.4% of HTWB). The measurement methods for moisture and combustible matter were the same as those used for the bottom ash analysis.

2.3. Energy Recovery Efficiency Measurement

The recovery efficiency was calculated using Equation (2), widely known as the R1 formula [4]. This equation is used to determine recovery efficiency by employing four calculation factors: annual produced and utilized energy from waste (total of heat/steam plus electricity as equivalents) (GJ/y) (Ep), annual energy input to the system by waste (GJ/y) (Ew), annual energy input to the system by imported energy (fuels) with steam production (GJ/y) (Ef), and annual imported energy without steam production (GJ/y) (energy from the treated waste Ew is not included) (Ei). The constant 0.97 in the denominator is a factor used to account for energy losses that are generally not applicable in incinerators because of factors such as bottom ash and radiation. The climate correction factor (CCF) [4] was not considered in this research in accordance with the Korean recovery efficiency protocol.
R e c o v e r y   e f f i c i e n c y   % = E p E f + E i 0.97 × E w + E f × 100
The same methods used in Europe were applied to obtain each calculation factor. For calculating the coefficient of the low-heating value in the formula employed to obtain the amount of heat from waste, which is required for Ew calculation, a value different from that used in European research [38] was used. This value was based on the incineration facilities in Korea (S3 in the Supplementary Information).
The R1 formula assigns different weights to Ep, depending on the type of recovered energy. The weights applied for electrical and steam energy are 2.6 and 1.1, respectively, as shown in Equation (3). These values represent the average production efficiency of electrical and thermal energy produced by conventional power plants. Grosso et al. [39] explained that the R1 formula encompasses the concept of comparing the energy recovery efficiency of an incinerator with that of a traditional power plant. The R1 formula is different from conventional thermodynamic efficiency equations owing to its inclusion of weighting factors (1.1 and 2.6 for steam and electrical energy, respectively) and a constant (0.97).
Consequently, the structure of the R1 formula is different from that of the traditional efficiency calculation formula, which can be used to determine the ratio between the input and output energies of a system. For a quantitative assessment of the recovered energy itself, it is more appropriate to use Ep values that exclude the effect of weight, as shown in Equation (4).
E p = 1.1 × E p , H e a t + 2.6 × E p , E l e c t r i c i t y
E p , U n w e i g h t e d = E p , H e a t + E p , E l e c t r i c i t y
The recovered energy can replace fossil fuels, resulting in a reduction in CO2 emissions. This reduction effect can be calculated using the carbon emission factor for bituminous coal combustion (0.0253 carbon ton/GJ) provided by the IPCC [40].

2.4. NOx Concentration Measurement before and after Emission Control Measures

For the 14 focus target facilities, NOx concentrations were obtained by measuring nitric oxide (NO) and nitrogen dioxide (NO2) concentrations before and after the emission control measures. The numerical values of NO concentration, expressed in ppm, were added to the numerical values of NO2 concentration, also expressed in ppm, to determine the concentration of NOx, expressed in ppm.
NOx emissions before the emission control measures were measured every second for 30 min using a portable measuring instrument (MK 6000+, ecom GmbH, Iserlohn, Germany) equipped with an electrochemical sensor. Thirty measurements were obtained by averaging the results for 60 s. The measured NOx concentrations were adjusted based on the 12% oxygen concentration, which is a standard protocol under Clean Air Conservation Act [22]. The sample gas was inhaled at 2.7 L/min, and the moisture in the sample gas was removed using a condensate discharge system and thermal sampling tube.
For NOx emissions after emission control measures, the TMS measurements of the facilities were used. The NOx measurement of TMS was performed using an automated measurement method based on the infrared absorption principle [41]. NOx concentrations in the facilities were measured every second and averaged every 30 min by following TMS management regulations. The measured NOx concentrations were adjusted based on the 12% oxygen concentration [22]. This study utilized the average value corresponding to the measurements taken before the implementation of emission control measures in the facilities.

3. Results

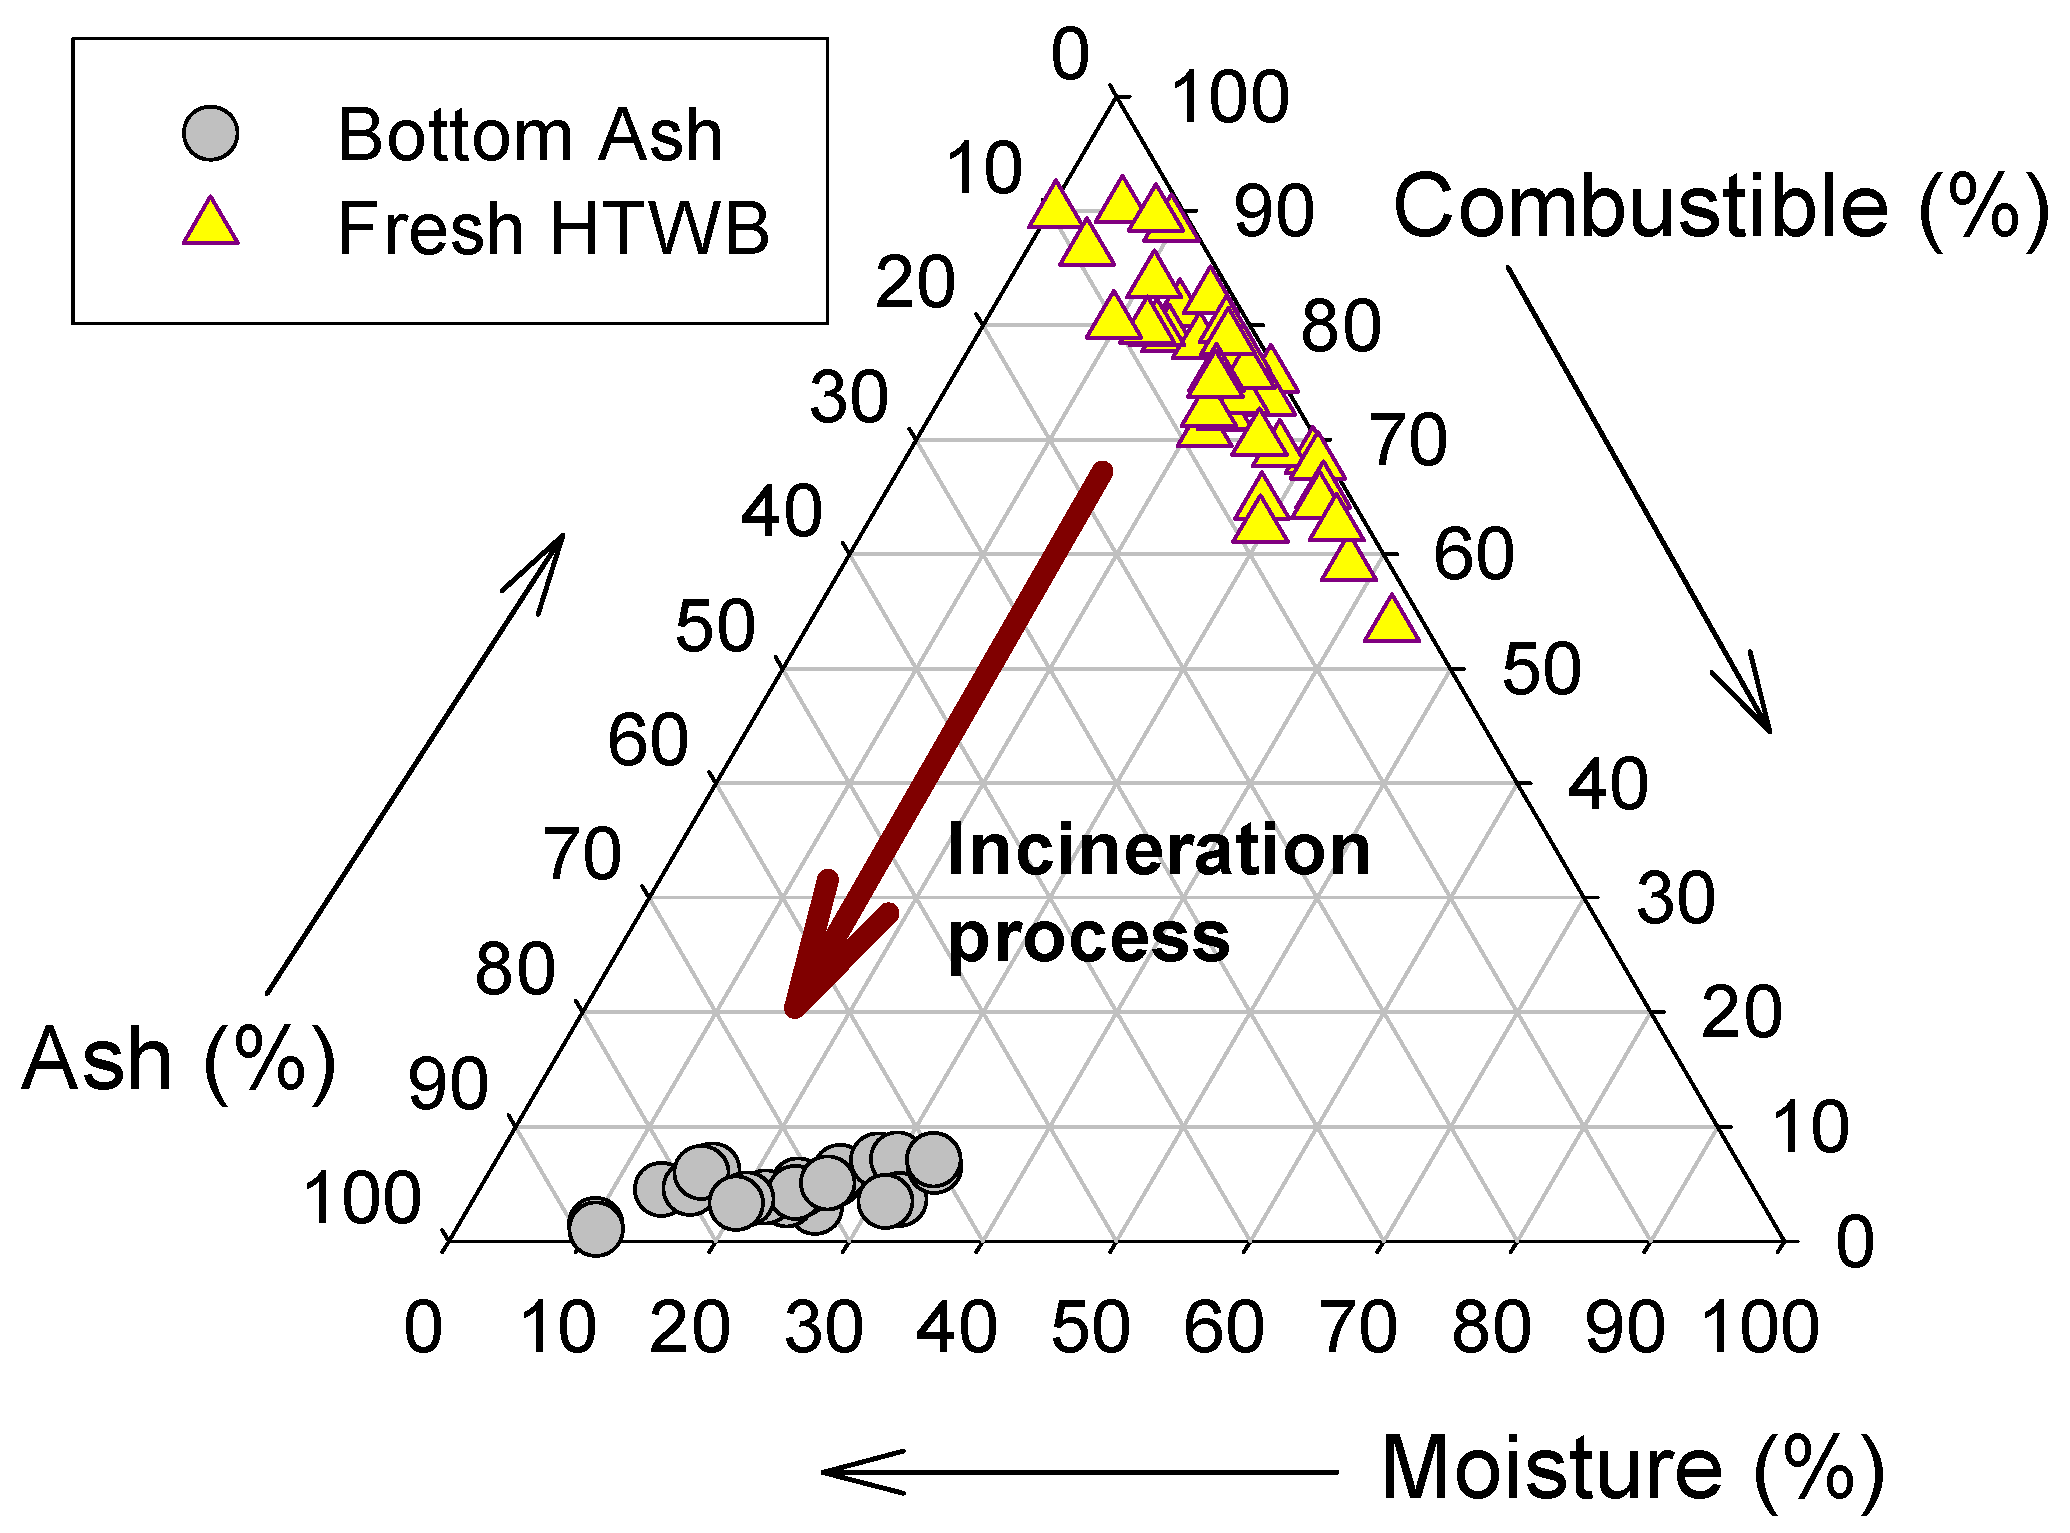
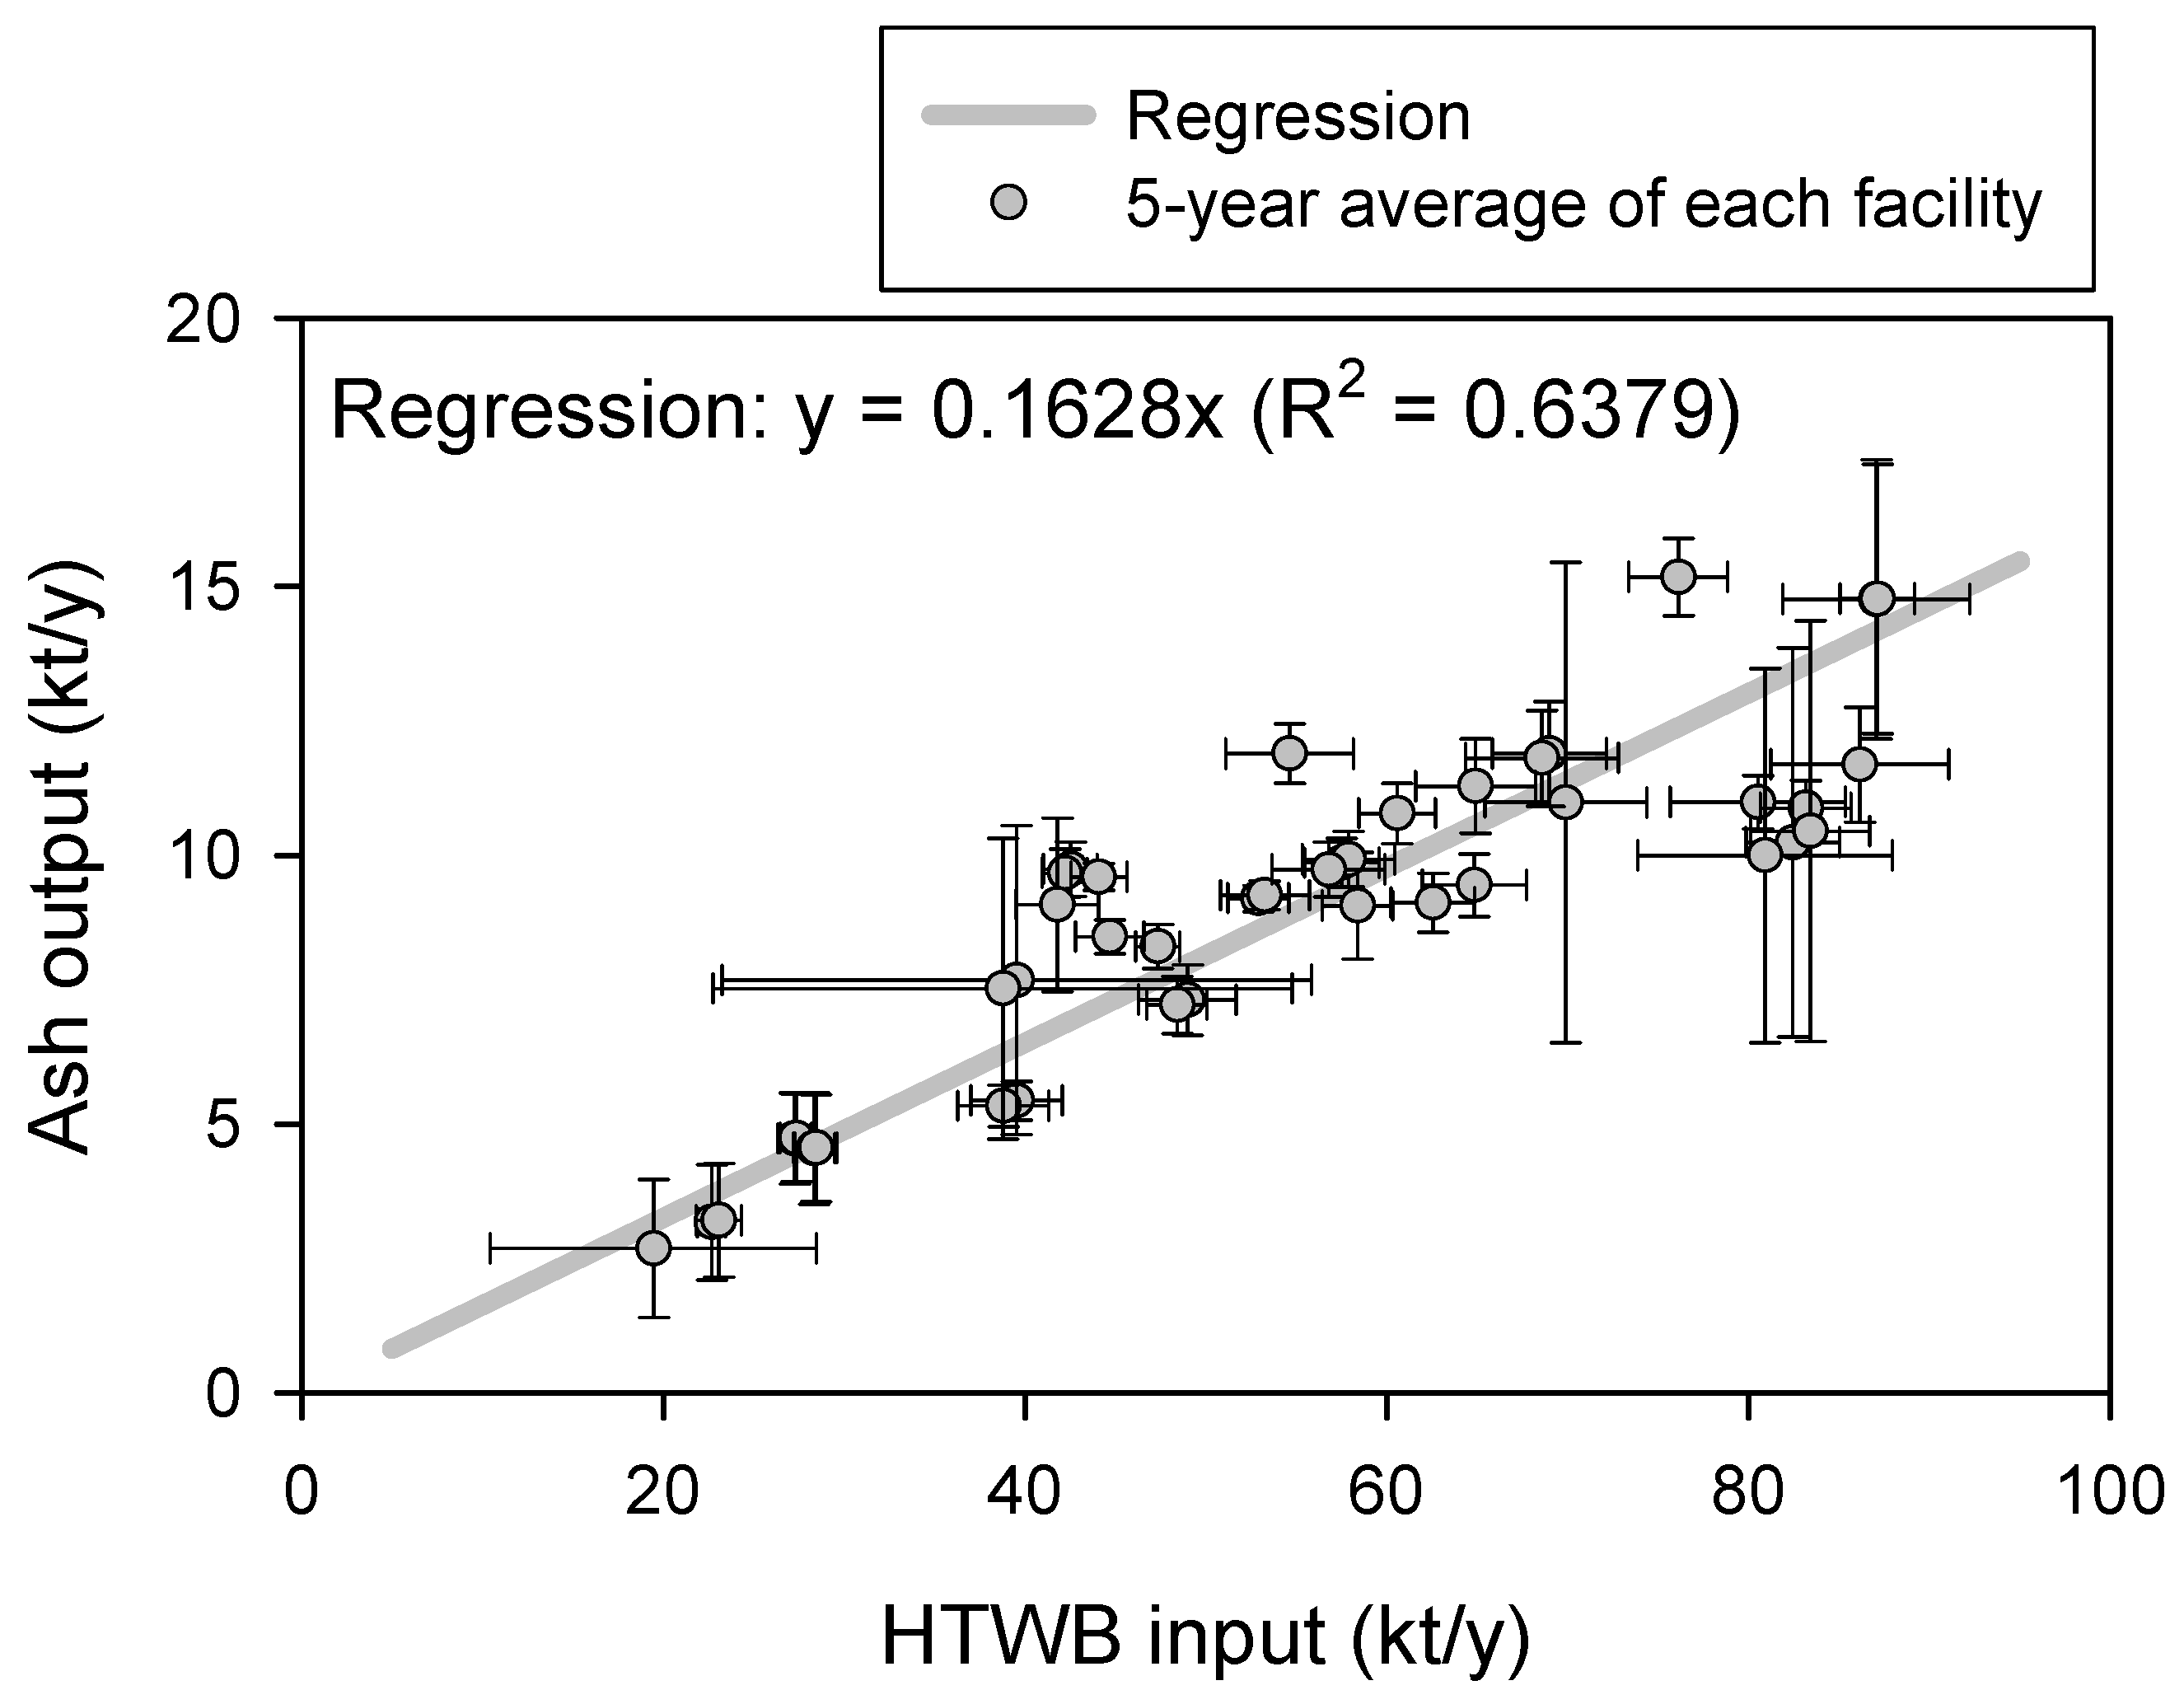
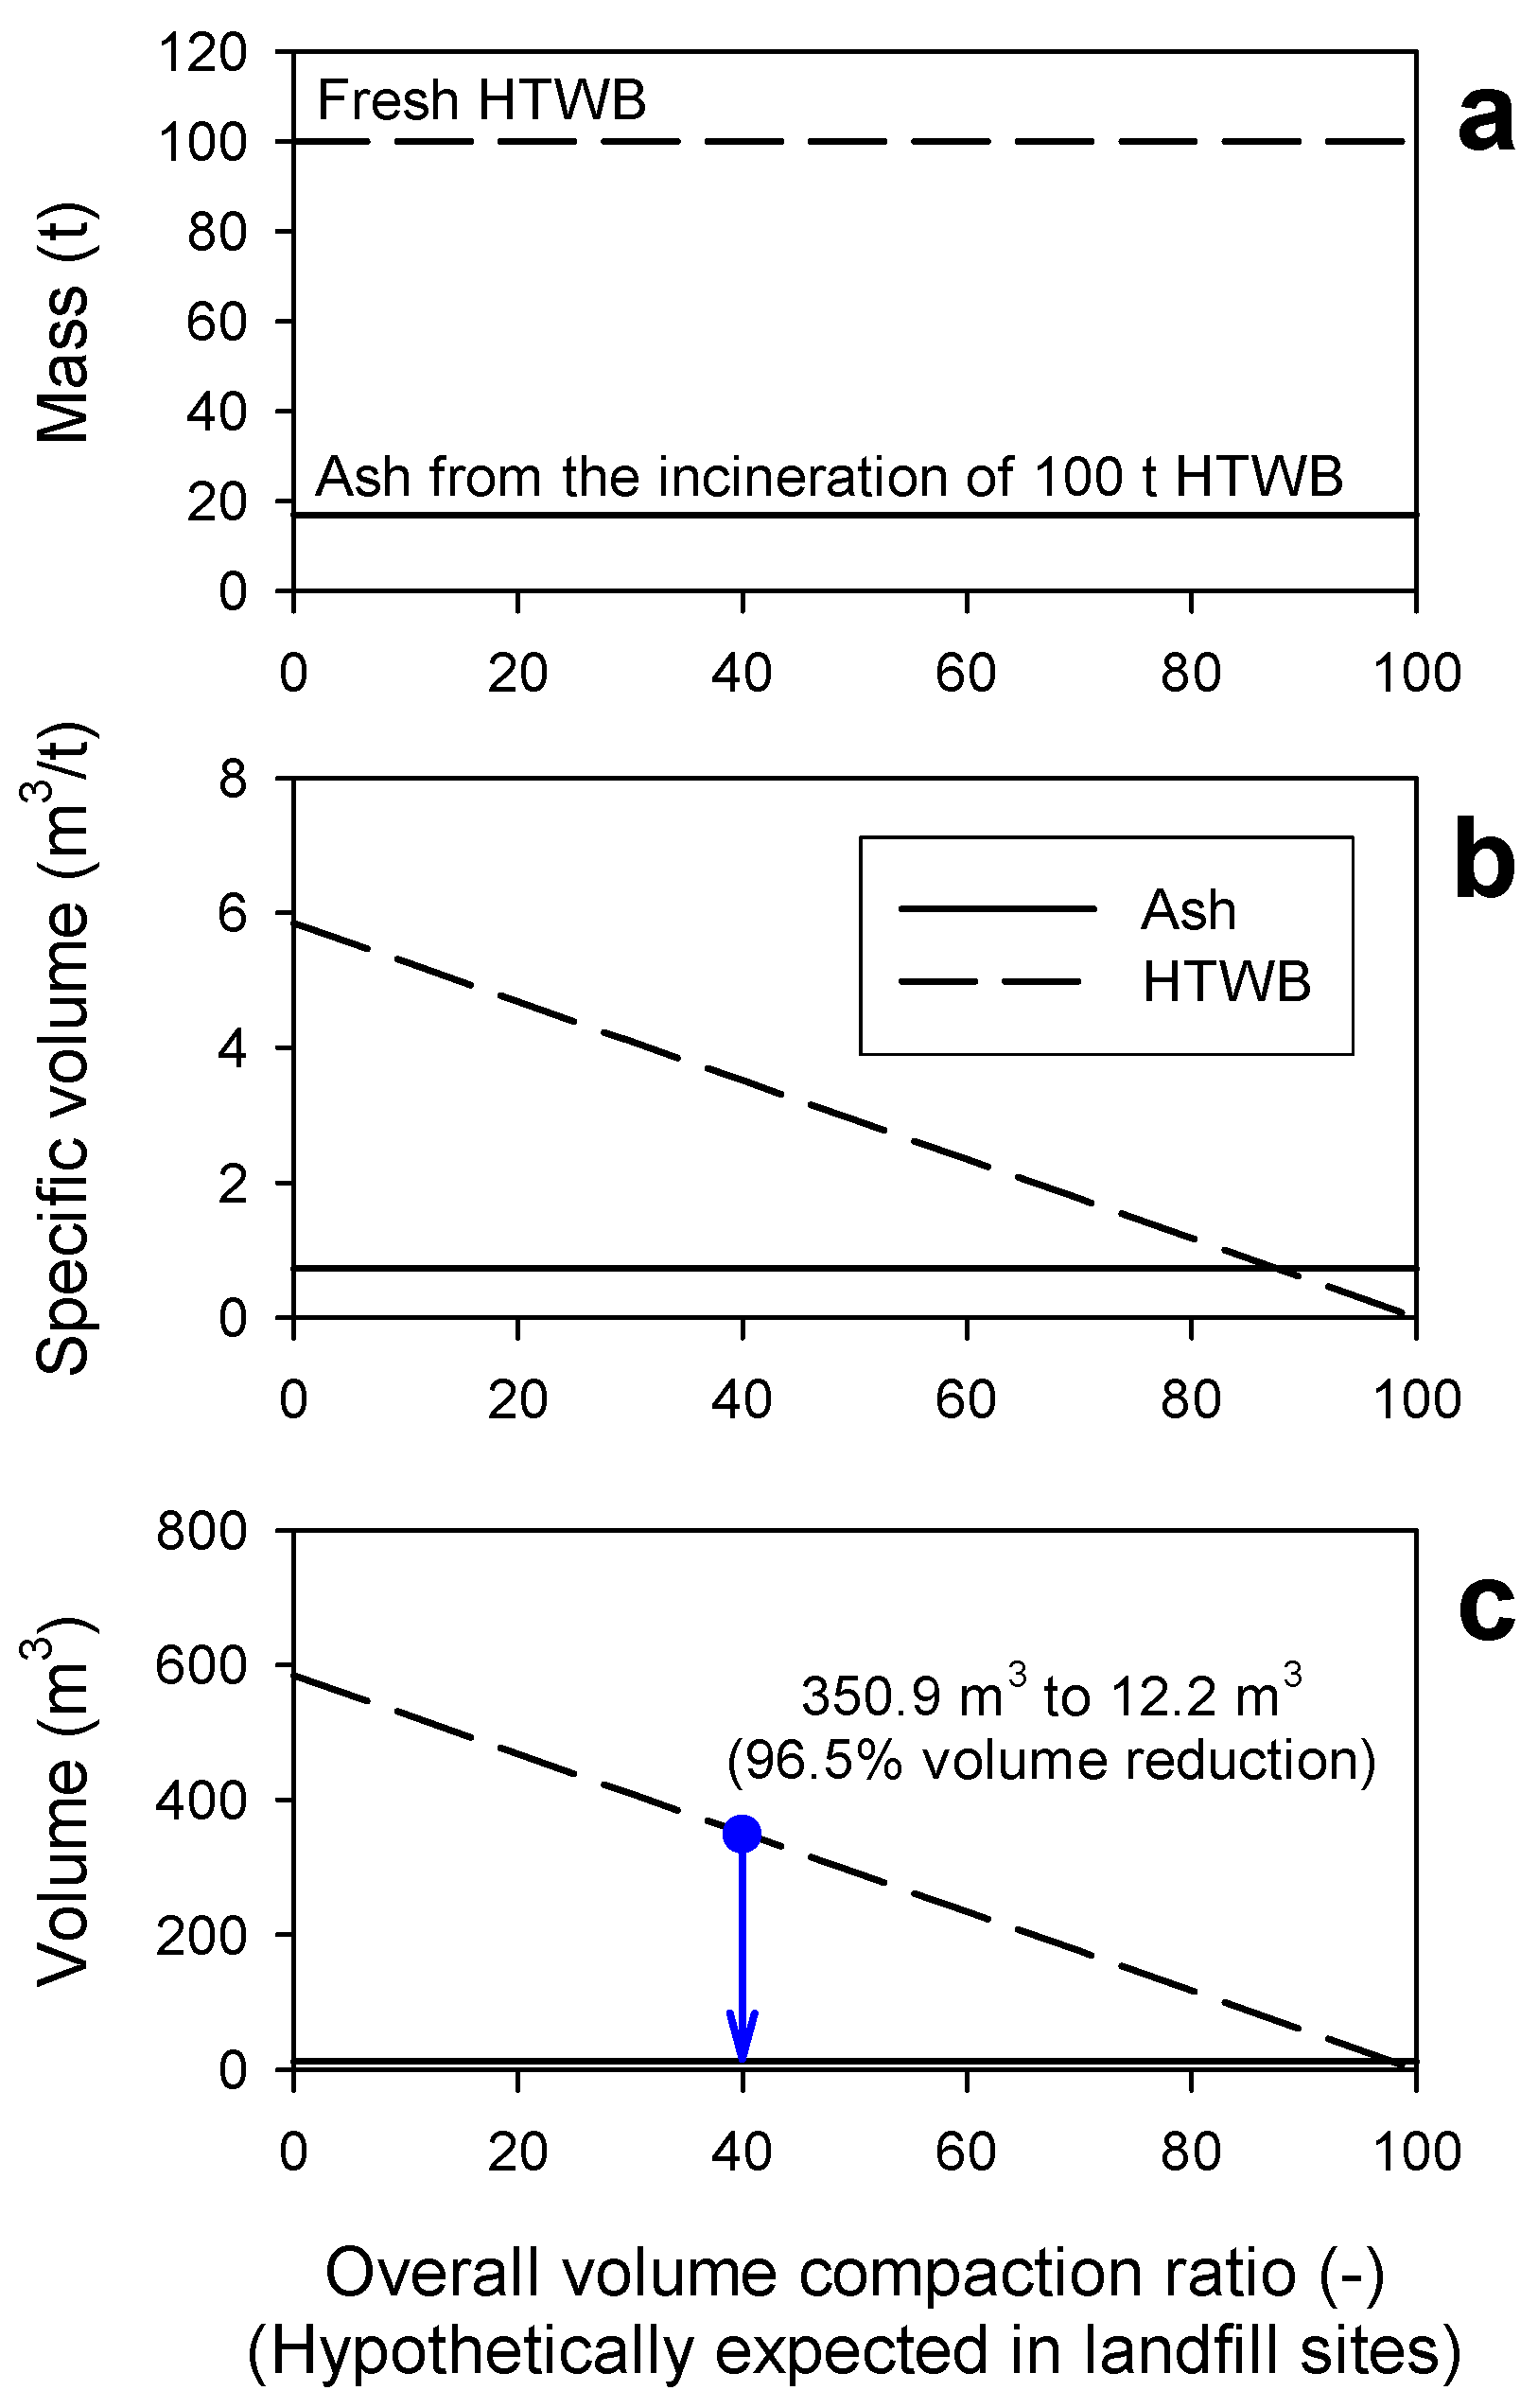
3.1. Changes in Waste Mass, Volume, and Components Due to Incineration

First, to verify the effectiveness of incineration, the combustible matter, moisture, and ash contents in the waste before incineration were compared with those of incineration ash (bottom ash) after incineration (Figure 1). The combustible content of bottom ash is a crucial parameter to evaluate the efficiency of incineration. In accordance with Korean regulations, it must be equal to or lower than 10% based on the established test procedures in [36,37].
The average proportions of combustible matter, moisture, and ash in the bottom ash were 4.7, 23.8, and 71.5%, respectively. The combustible content of the bottom ash ranged from 1.0 to 7.1%, reaching ≤ 10% in all cases. The average proportions of combustible matter, moisture, and ash in the HTWB before incineration were 72.4%, 22.8%, and 4.8%, respectively.
The mass of the HTWB was reduced by incineration. When the annual waste input was compared with the ash output for 199 cases, the ash output was 16.9 ± 3.6% (mean ± standard deviation) of the mass of waste before incineration. Accordingly, the reduction rate based on mass was 83.1 ± 3.6%. The mass ratio can also be expressed using the slope of the waste mass–residue mass graph. In this case, the slope of the regression line is 0.1628, which is similar to the average mass ratio previously mentioned (Figure 2). Meanwhile, it must be considered that metal components are selected before discharging bottom ash for material recycling in most facilities. The mass reduction resulting from the choice of metal components is not caused by incineration. However, in this study, it was attributed to incineration, considering that the recycled resources were obtained through incineration.
The volume reduction in the HTWB was 100 tons (Figure 3). Its mass was reduced to 16.9 tons through incineration. The specific volume of the HTWB and its final volume at the landfill site decreased as the compaction ratio at the landfill site increased. For illustration purposes, we hypothetically assumed a compaction ratio of 40% as an example. When the compaction ratio reached 40%, the specific volume decreased from 5.848 m3/t to 3.509 m3/t before compaction. In this case, the volume reduction rate obtained through incineration was 96.5%, and the secured landfill capacity was 338.7 m3. This calculation was based on 100 tons of HTWB; hence, the secured capacity can be expressed as “338.7 m3 for 100 t HTWB @ 40% landfill volume compaction”.

3.2. Energy Recovery Efficiency

The 5-year average recovery rate was 71.0%. The recovery efficiency distribution by year also showed an average recovery efficiency of approximately 70% each year, with no significant changes (Figure 4). Of the 220 cases, 205 (93.2%) received incentives for a reduction in waste disposal tax based on their recovery efficiency of 50% or higher. Specifically, 26, 96, and 83 cases received tax reduction rates of 50, 60, and 75%, representing 11.8, 43.6, and 37.7% of the total 220 cases, respectively.
In Korea, the incineration tax is reduced based on the recovery efficiency. The tax imposed for the disposal of waste through incineration in Korea is 10,000 KRW (approximately USD 7.5) per ton. The 5-year average recovery efficiency of 71.0% corresponds to a 60% reduction in the incineration tax. Therefore, the average tax reduction expected in Korea for incinerating 100 tons of waste can be expressed as “450 USD for 100 t HTWB”.
The ME directly certifies recovery efficiency to ensure the fairness of the reduction process. Currently, 34 (18.4%) out of 185 HTWB incineration facilities participate in this certification system, accounting for 57.2% of the total incineration quantity [42]. The high participation rate suggests that Korea’s recovery efficiency certification and associated tax reduction system effectively encourage incineration facility operators to recover energy consistently, aligning with the intended purpose of these policies.
Regarding the trend in the changes in recovery efficiency, the recovery efficiency by the incineration capacity group showed no significant increase or decrease (Table 1). The 5-year recovery efficiency change for each facility was approximately 11.8 ± 8.6% (S4 in Supplementary Information). A thorough examination of the facilities that exhibited recovery efficiency changes exceeding the average revealed that the causes of these changes were primarily attributed to the changes in the operation pattern of the facilities and changes in the utilization patterns for recovered energy. Among the changes in the operation patterns of the facilities, the most significant change was observed in auxiliary fuel consumption. During the operation of incineration facilities, the amount of heat generated from waste decreases owing to various factors, such as the low proportion of combustible components in the input waste and increased moisture content. Consequently, auxiliary fuel consumption increases to ensure proper combustion, which decreases the recovery efficiency by increasing the Ef term of the R1 formula. The facilities that experienced a reduction in recovery efficiency owing to this reason (in contrast, recovery efficiency increases when the auxiliary fuel consumption decreases) included p100-01a, b, p200-020, and p300-04a, b. Considering p300-04a and b as examples, the Ef term increased by 3.9 and 2.3 times, thereby decreasing the recovery efficiency by 19.2% and 18.5%, respectively.
Changes in the utilization pattern of the recovered energy can be evaluated based on both internal and external factors. For example, the recovery efficiency of facility p200-06a was projected to increase from 68.9% in 2022 to 81.3% in 2023. This improvement can be attributed to a reduction in externally supplied energy, which was achieved by meeting the power consumption of the facility through recovered electrical energy. This case highlights the impact of internal utilization. Conversely, the recovery efficiency of facility p200-080 rapidly decreased from 98.4% in 2020 to 55.0% in 2021. This was because the amount of heat supplied to district heating companies decreased by approximately 50%, indicating the impact of external utilization. The cases in which the utilization pattern for recovered energy affects the recovery efficiency demonstrate that the recovery efficiency value calculated based on the R1 formula encompasses both the concept of thermodynamic efficiency and the concept of “utilization efficiency”, as mentioned by Vakalis et al. [43].
For 25 of the 44 target facilities in this study, the produced energy was solely heat energy. There are 19 combined heat and power (CHP) facilities, and none is exclusively generating electricity. For the 19 CHP facilities, the proportion of Ep,Electricity in Ep,Unweighted was low, ranging from 0.1% to 18.3%, with an average of 6.0%. Therefore, the degree of increase in the Ep value by applying weighting factors 1.1 and 2.6 was not high. From a quantitative perspective, Ep is higher than Ep,unweighted by 19.0% on average and up to 37.5%. If these are expressed in the form of an integrated (or single) weight, they can be 1.19 and 1.375 (S5 in the Supplementary Information). Meanwhile, for 25 facilities that produce only thermal energy, the difference before and after applying the weighting factor was 10%, which is the same as the value of the weighting factor (1.1).
The average annual values of the thermal energy and electrical energy recovered and reused in the 44 facilities over a 5-year period were 953.7 and 20.0 TJ/y, respectively. The recovered energy per unit mass of the HTWB (sum of thermal and electrical energy) was 6.997 ± 1.426 GJ/t (mean ± standard deviation). A quantitative example for 100 tons of HTWB is presented above, and volume reduction is discussed. If the amount of thermal energy recovered/reused through incineration is expressed similarly, the average quantitative indicator of Korea can be expressed as “699.7 ± 142.6 GJ for 100 t HTWB” (applying the carbon emission factor of 0.0253 carbon ton/GJ). If the amount of carbon reduced by the replacement of fossil fuel with recovered energy is quantified for 100 tons of HTWB, it can be expressed as “17.64 ± 3.60 carbon ton for 100 t HTWB.” Policymakers and the general public may be more familiar with carbon dioxide emissions than with carbon emissions. If the above value is converted into carbon dioxide emissions, it can be multiplied by the conversion factor of 44/12 and expressed as “64.68 ± 13.20 CO2 ton for 100 t HTWB”. This displacement can be quantified as 0.0667 CO2 ton/GJ, based on the mean lower heating value of Korean HTWB of 969.2 GJ per 100 t HTWB. This is 71.9% of the CO2 emissions factor of bituminous coal.

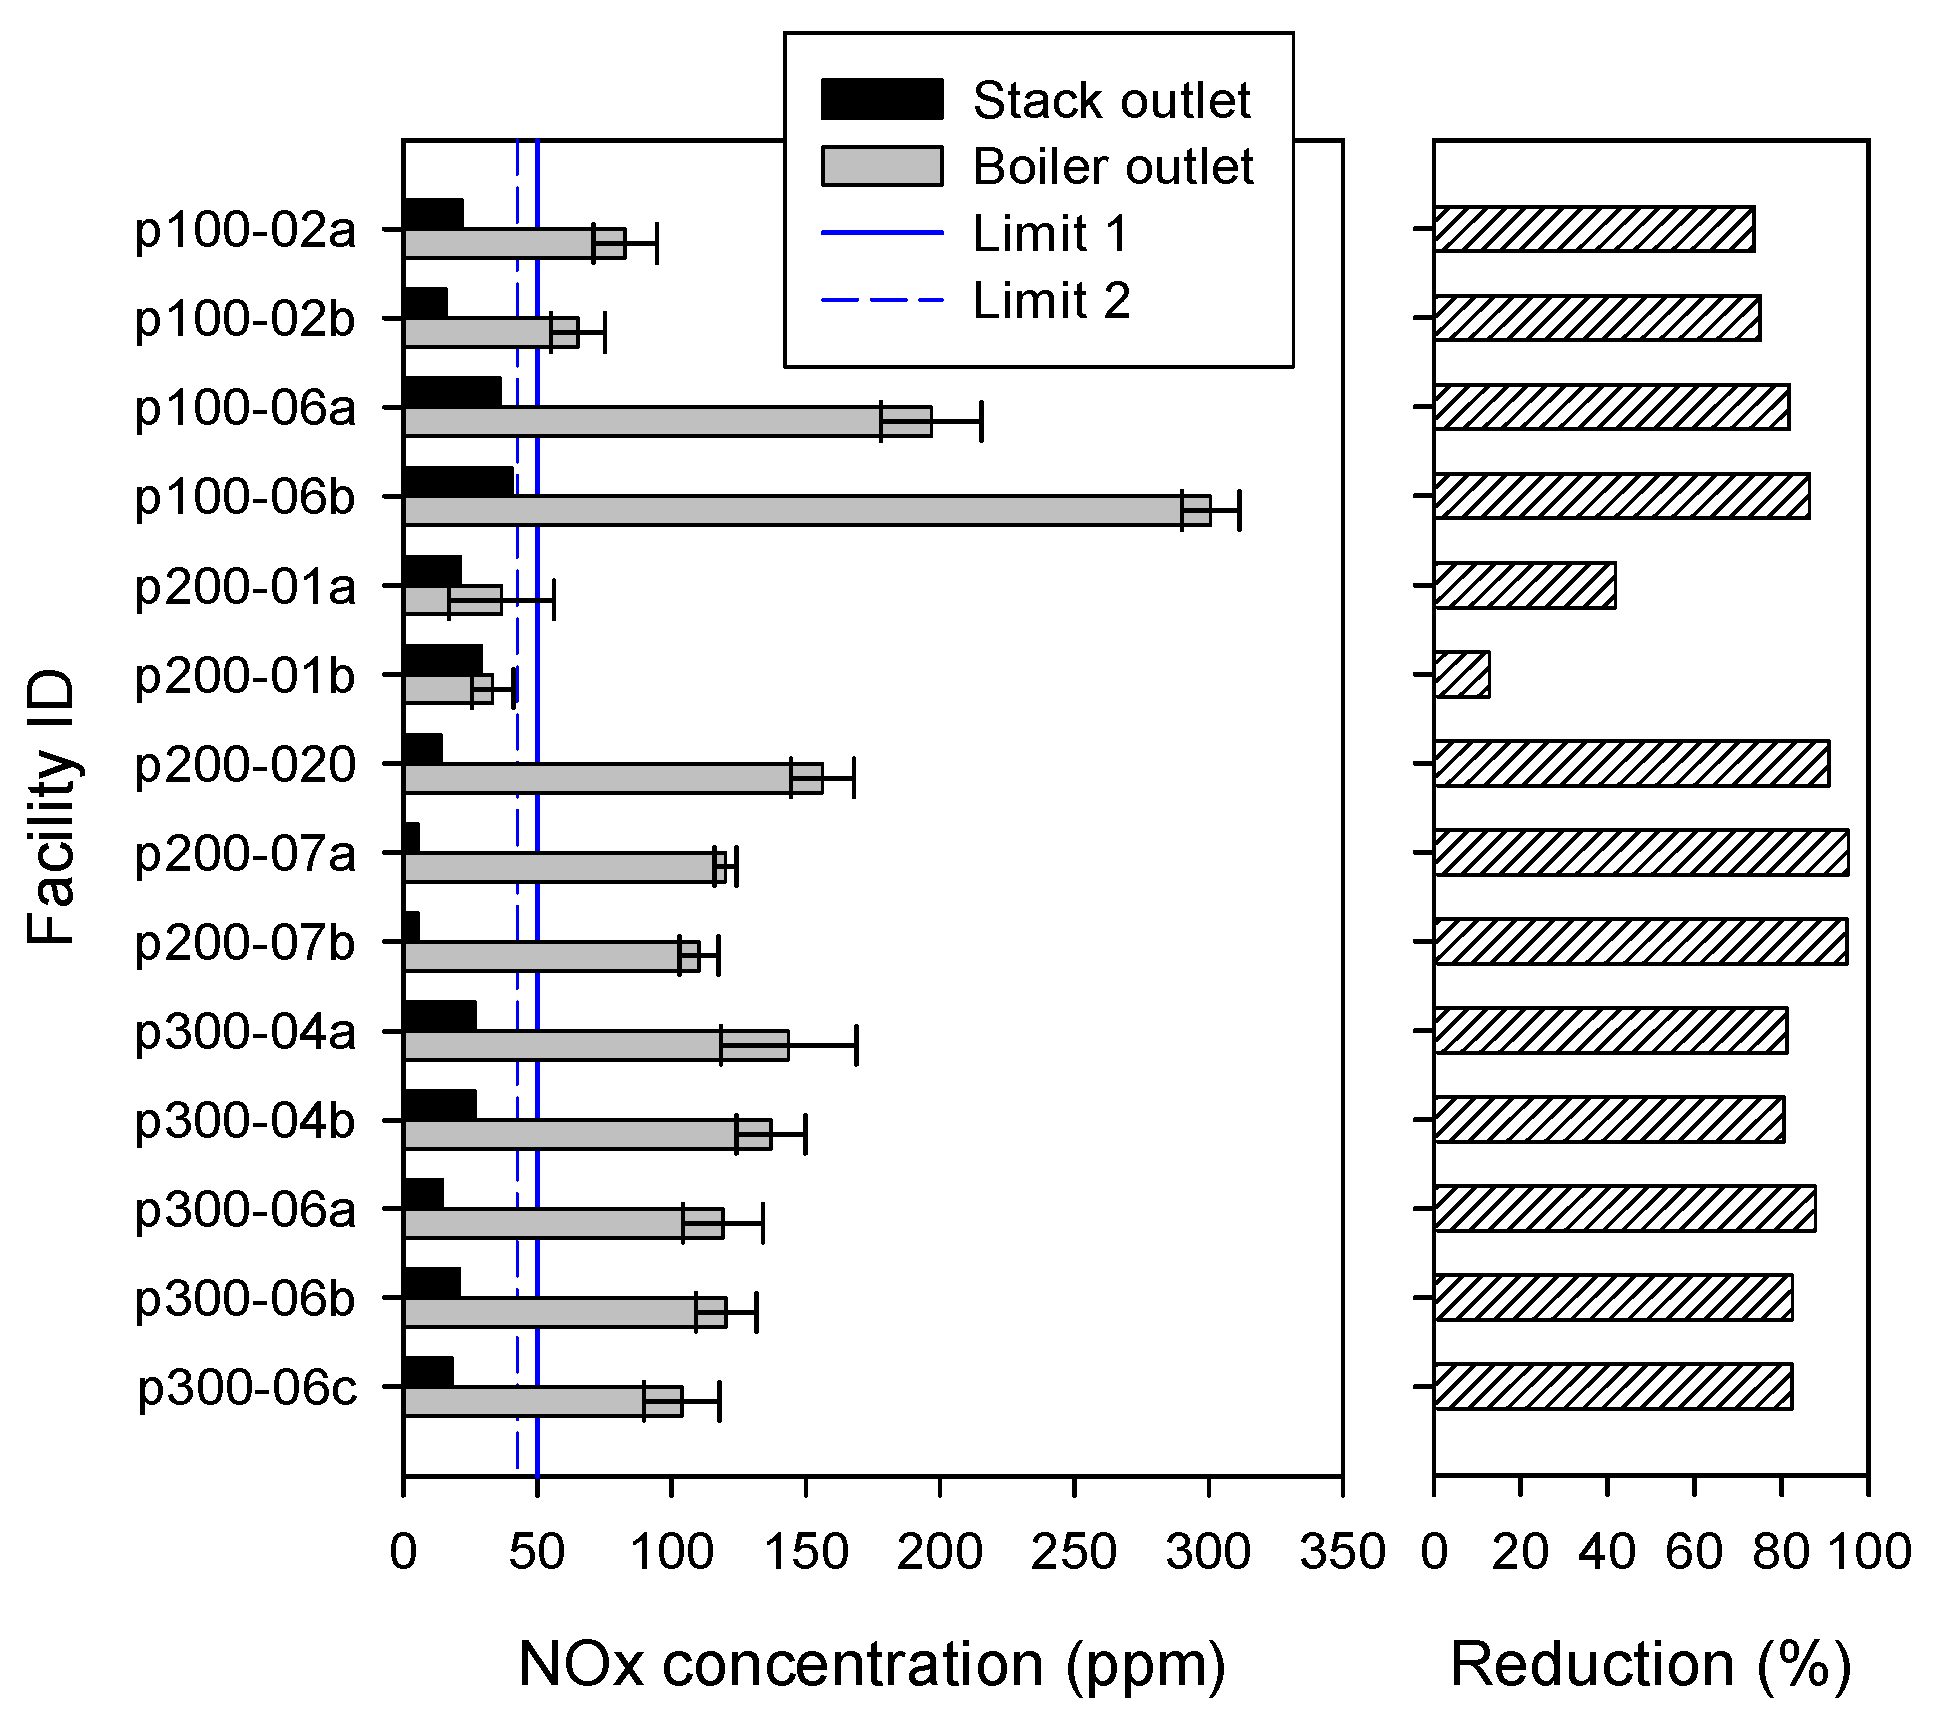
3.3. Thirty-Minute Averaged NOx Concentrations before and after Emission Control Measures

The 30-min averaged NOx concentrations of the selected 14 facilities at the boiler outlet ranged from 33.3 to 300.7 ppm (Figure 5). Facilities p200-01a and b showed the lowest values. This was because the SNCR facility was installed at a more upstream position than the point where the sampling probe could be inserted; thus, the impact of the emission control measure was on the NOx concentration at the boiler outlet. Except for these facilities, the 30-min averaged NOx concentrations of the 12 facilities at the boiler outlet were 138.0 ± 61.5 ppm (mean ± standard deviation), and all exceeded the emission limit of 50 ppm.
The 30-min averaged NOx concentration of the 12 facilities at the stack outlet measured using TMS was 20.6 ± 10.8 ppm. None of the cases exceeded an emission limit of 50 ppm, and none surpassed 42.5 ppm, which is the strengthened emission limit applied to facilities located around large cities, such as Seoul. In other words, among these selected examples, pollutant emissions were successfully managed below the emission limits through emission control measures.
The average reduction rate before and after the emission control measures (for 12 facilities, except for two facilities) was 84.4% (73.7% to 95.5%). When the effects of the type and configuration of NOx emission control measures were examined, the average NOx reduction rates of facilities equipped with SNCR + SCR (three facilities), facilities with only SCR (seven facilities), and facilities with only SNCR (two facilities) were 84.3% (82.4% to 87.8%), 81.4% (73.7% to 90.9%), and 95.2% (95.0% to 95.5%), respectively. These results indicate that SNCR has higher reduction efficiency than SCR, which is inconsistent with previous results [28,29,30]. This deviation is mainly because one 30 min measurement is insufficient to represent the overall reduction performance of each incinerator and reduction system. For example, SNCR facilities p200-07a and p200-07b showed annual average NOx concentrations in a stack-out exhaust of 12.2 ± 2.1 ppm and 13.1 ± 2.0 ppm, respectively. However, our measurements were 5.4 ppm and 5.5 ppm, which are lower than the usual case for NOx emissions. As the results demonstrate the NOx management capabilities of incineration facilities, determining the performance of each emission control measure based solely on these short-term results may be difficult. Long-term emission measurements and the acquisition of major operation data are required to comprehensively compare the reduction performances of the emission control measures.

4. Conclusions

Our research emphasizes the multifaceted advantages of waste incineration in South Korea, highlighting its pivotal role in waste reduction, energy recovery, and environmental compliance. These findings highlight the effectiveness of existing policies for advancing sustainable waste management practices within the nation.
South Korea actively aspires to build a resource-circulating society, as demonstrated by the Circular Economy Society Promotion Act. This legislation prioritizes material recycling over energy recovery through incineration. Nevertheless, owing to the current status of material recycling, incineration remains a fundamental component that upholds the principles of the circular economy.
The results of this study have substantial implications for policy formulation and assessment. By bridging the gap between policy frameworks and technical aspects, our research provides decision-makers with valuable insights into achieving a harmonious equilibrium between environmental sustainability and resource utilization. Our study significantly contributes to the continuous improvement of policies aimed to ensure that seamless incineration aligns with South Korea’s vision of a resource-circulating society. Furthermore, our study reaffirms the significance of policies, such as the “No More Direct Landfilling of Household Waste Policy” and the “Incineration Tax Reduction Policy,” in fostering sustainable waste management practices. Notably, incineration facilities achieve positive outcomes by diligently adhering to NOx emission limits, reinforcing the paramount importance of environmental compliance in waste management policies. While our study provides insights into the performance of waste incineration in South Korea, future research endeavors should aim to enhance our comprehension of this intricate process and contribute to the advancement of sustainable waste management practices. To achieve this, it is recommended that upcoming studies compare the performance of South Korean incineration facilities with those in other countries. Such comparative analyses would identify best practices in waste-to-energy conversion and NOx emission control, fostering a broader and more comprehensive understanding of effective approaches on a global scale.

Supplementary Materials

The following supporting information can be downloaded at https://www.mdpi.com/article/10.3390/su16010448/s1. S1: Tax Reduction Rate and R1 Recovery Efficiency Condition in South Korea. S2: List of Analyzed Incineration Facilities and their Capacities. S3: Coefficient Values for Estimating the Lower Heating Value (Adjusted for Korean context). S4: Five-Year Average R1 Recovery Efficiency with Yearly Variations. S5: Comparison between Ep and Ep,Unweighted.

Author Contributions

Conceptualization, T.L., Y.K. and J.K.; methodology, Y.K., S.L., J.B., S.P., H.M. and K.K.; software, Y.K., S.L., J.B., S.P. and H.M.; validation, Y.K., T.L. and J.K.; investigation, Y.K., S.L., J.B., S.P., H.M. and K.K.; data curation, T.L., S.L. and J.B.; writing—original draft preparation, Y.K. and T.L.; writing—review and editing, T.L., K.K., J.K. and T.J. All authors have read and agreed to the published version of the manuscript.

Funding

The funding source of this research is Ministry of Environment of the Republic of Korea.

Institutional Review Board Statement

Not applicable.

Informed Consent Statement

Not applicable.

Data Availability Statement

The data in this study are available upon written request.

Acknowledgments

This work was supported by a grant from the National Institute of Environmental Research funded by the Ministry of Environment of the Republic of Korea (NIER-2023-01-01-078).

Conflicts of Interest

The authors declare no conflict of interest.

References

  1. Circularity Gap Reporting Initiative, the Circularity Gap Report. 2023. Available online: https://www.circularity-gap.world/2023#download (accessed on 10 August 2023).
  2. Shin, S.K.; Um, N.; Kim, Y.J.; Cho, N.H.; Jeon, T.W. New Policy Framework with Plastic Waste Control Plan for Effective Plastic Waste Management. Sustainability 2020, 12, 6049. [Google Scholar] [CrossRef]
  3. Ministry of the Environment. Act on the Promotion of Transformation Toward Circular Economy Society. 2023. Available online: https://www.law.go.kr/LSW/lsInfoP.do?lsiSeq=254899&ancYd=&ancNo=&efYd=20240101&nwJoYnInfo=Y&ancYnChk=0&efGubun=Y&vSct=*#0000 (accessed on 10 August 2023). (In Korean).
  4. European Union. Directive 2008/98/EC of the European Parliament and of the Council of 19 November 2008 on Waste and Repealing Certain Directives. Off. J. Eur. Union 2018. Available online: http://data.europa.eu/eli/dir/2008/98/2018-07-05 (accessed on 10 August 2023).
  5. US Environmental Protection Agency. Sustainable Materials Management: Nonhazardous Materials and Waste Management Hierarchy; (Last Updated on 19 June 2023); US Environmental Protection Agency: Washington, DC, USA, 2023. [Google Scholar]
  6. Ministry of the Environment. Wastes Control Act. 2023. Available online: https://www.law.go.kr/LSW/lsInfoP.do?lsiSeq=254087&ancYd=&ancNo=&efYd=20240817&nwJoYnInfo=N&ancYnChk=0&efGubun=Y&vSct=*#0000 (accessed on 10 August 2023). (In Korean).
  7. Ministry of the Environment. Act on the Promotion of Saving and Recycling of Resources. 2023. Available online: https://www.law.go.kr/LSW/lsInfoP.do?lsiSeq=249347&ancYd=&ancNo=&efYd=20240329&nwJoYnInfo=N&ancYnChk=0&efGubun=Y&vSct=*#0000 (accessed on 10 August 2023). (In Korean).
  8. Arena, U. From Waste-to-Energy to Waste-to-Resources: The New Role of Thermal Treatments of Solid Waste in the Recycling Society. Waste Manag. 2015, 37, 1–2. [Google Scholar] [CrossRef]
  9. Brunner, P.H.; Rechberger, H. Waste to Energy–Key Element for Sustainable Waste Management. Waste Manag. 2015, 37, 3–12. [Google Scholar] [CrossRef] [PubMed]
  10. Lopes, E.J.; Queiroz, N.; Yamamoto, C.I.; da Costa Neto, P.R. Evaluating the Emissions from the Gasification Processing of Municipal Solid Waste Followed by Combustion. Waste Manag. 2018, 73, 504–510. [Google Scholar] [CrossRef] [PubMed]
  11. Ministry of the Environment. Press Release. Direct Disposal of Pay-as-You-Throw Trash in Metropolitan Landfills Will Be Banned Starting in 2026. 2021. Available online: https://me.go.kr/home/web/board/read.do?pagerOffset=0&maxPageItems=10&maxIndexPages=10&searchKey=title&searchValue=&menuId=10525&orgCd=&condition.fromDate=2021-07-05&condition.toDate=2021-07-05&boardId=1464280&boardMasterId=1&boardCategoryId=&decorator= (accessed on 10 August 2023). (In Korean).
  12. Ministry of the Environment. Press Release. The Mayors of 10 Cities in the Seoul Metropolitan Area Need to Expand Incineration Capacity Before Their Terms End. 2022. Available online: https://me.go.kr/home/web/board/read.do?pagerOffset=0&maxPageItems=10&maxIndexPages=10&searchKey=title&searchValue=&menuId=10525&orgCd=&condition.fromDate=2022-07-01&condition.toDate=2022-07-01&boardId=1534530&boardMasterId=1&boardCategoryId=&decorator= (accessed on 10 August 2023). (In Korean).
  13. Makarichi, L.; Jutidamrongphan, W.; Techato, K.A. The Evolution of Waste-to-Energy Incineration: A Review. Renew. Sustain. Energy Rev. 2018, 91, 812–821. [Google Scholar] [CrossRef]
  14. Zhao, X.-G.; Jiang, G.-W.; Li, A.; Li, Y. Technology, Cost, a Performance of Waste-to-Energy Incineration Industry in China. Renew. Sustain. Energy Rev. 2016, 55, 115–130. [Google Scholar] [CrossRef]
  15. Ministry of the Environment. Enforcement Decree of the Framework Act on Resources Circulation. 2023. Available online: https://www.law.go.kr/LSW/lsInfoP.do?lsiSeq=257037&ancYd=&ancNo=&efYd=20240101&nwJoYnInfo=Y&ancYnChk=0&efGubun=Y&vSct=*#0000 (accessed on 10 August 2023). (In Korean).
  16. Shah, H.H.; Amin, M.; Pepe, F. Maximizing Resource Efficiency: Opportunities for Energy Recovery from Municipal Solid Waste in Europe. J. Mater. Cycles Waste Manag. 2023, 25, 2766–2782. [Google Scholar] [CrossRef]
  17. Hwang, K.L.; Choi, S.M.; Kim, M.K.; Heo, J.B.; Zoh, K.D. Emission of Greenhouse Gases from Waste Incineration in Korea. J. Environ. Manag. 2017, 196, 710–718. [Google Scholar] [CrossRef]
  18. Wang, Y.; Yan, Y.; Chen, G.; Zuo, J.; Yan, B.; Yin, P. Effectiveness of Waste-to-Energy Approaches in China: From the Perspective of Greenhouse Gas Emission Reduction. J. Clean. Prod. 2017, 163, 99–105. [Google Scholar] [CrossRef]
  19. Istrate, I.R.; Galvez-Martos, J.L.; Vázquez, D.; Guillén-Gosálbez, G.; Dufour, J. Prospective Analysis of the Optimal Capacity, Economics and Carbon Footprint of Energy Recovery from Municipal Solid Waste Incineration. Resour. Conserv. Recycl. 2023, 193, 106943. [Google Scholar] [CrossRef]
  20. Han, M.; Wu, Y.; Sun, J.; Geng, X.; Gao, X.; Zhou, T.; Lu, J. Carbon feasibility of terminating plastic waste leakage by landfill mining: A case study based on practical projects in China. Sci. Total Environ. 2024, 906, 167461. [Google Scholar] [CrossRef] [PubMed]
  21. Ministry of the Environment. Persistent Organic Pollutants Control Act. 2022. Available online: https://www.law.go.kr/LSW/lsInfoP.do?lsiSeq=243003&ancYd=&ancNo=&efYd=20230611&nwJoYnInfo=Y&ancYnChk=0&efGubun=Y&vSct=*#0000 (accessed on 10 August 2023). (In Korean).
  22. Ministry of the Environment. Clean Air Conservation Act. 2022. Available online: https://www.law.go.kr/LSW/lsInfoP.do?lsiSeq=246843&ancYd=&ancNo=&efYd=20230628&nwJoYnInfo=Y&ancYnChk=0&efGubun=Y&vSct=*#0000 (accessed on 10 August 2023). (In Korean).
  23. Korean Environment Corporation. Clean Sys: Smokestack Tele-Monitoring System. 2023. Available online: https://cleansys.or.kr/introSystem.do (accessed on 10 August 2023).
  24. Gohlke, O.; Weber, T.; Seguin, P.; Laborel, Y. A New Process for NOx Reduction in Combustion Systems for the Generation of Energy from Waste. Waste Manag. 2010, 30, 1348–1354. [Google Scholar] [CrossRef] [PubMed]
  25. Wang, J.; Lou, H.H.; Yang, F.; Cheng, F. Numerical Simulation of a Decoupling and Re-burning Combinative Low-NOx Coal Grate Boiler. J. Clean. Prod. 2018, 188, 977–988. [Google Scholar] [CrossRef]
  26. Van Caneghem, J.; De Greef, J.; Block, C.; Vandecasteele, C. NOx Reduction in Waste Incinerators by Selective Catalytic Reduction (SCR) Instead of Selective Non Catalytic Reduction (SNCR) Compared from a Life Cycle Perspective: A Case Study. J. Clean. Prod. 2016, 112, 4452–4460. [Google Scholar] [CrossRef]
  27. Thanos Bourtsalas, A.C.; Seo, Y.; Tanvir Alam, M.; Seo, Y.C. The Status of Waste Management and Waste to Energy for District Heating in South Korea. Waste Manag. 2019, 85, 304–316. [Google Scholar] [CrossRef] [PubMed]
  28. Villani, K.; De Greef, J.; Goethals, J.; Montauban, I.; Van Langenhove, H. Exploring the performance limits of non-catalytic de-NOx in waste-to-energy plants. In Proceedings of the Fourth International Symposium on Energy from Biomass and Waste, Venice, Italy, 12–15 November 2012; CISA Publisher: Padova, Italy, 2012. [Google Scholar]
  29. Gómez-García, M.A.; Pitchon, V.; Kiennemann, A. Pollution by nitrogen oxides: An approach to NOx abatement by using sorbing catalytic materials. Environ. Int. 2005, 31, 445–467. [Google Scholar] [CrossRef] [PubMed]
  30. Goemans, M.; Clarysse, P.; Joannès, J.; De Clercq, P.; Lenaerts, S.; Matthys, K.; Boels, K. Catalytic NOx reduction with simultaneous dioxin and furan oxidation. Chemosphere 2004, 54, 1357–1365. [Google Scholar] [CrossRef]
  31. Ministry of the Environment. 6th Nationwide Statistical Survey on Waste. 2023. Available online: https://library.me.go.kr/#/search/detail/5883548?offset=1 (accessed on 10 August 2023). (In Korean).
  32. Martin, J.J.; Koralewska, R.; Wohlleben, A. Advanced Solutions in Combustion-Based WtE Technologies. Waste Manag. 2015, 37, 147–156. [Google Scholar] [CrossRef]
  33. Lynn, C.J.; Ghataora, G.S.; Obe, R.K. Municipal incinerated bottom ash (MIBA) characteristics and potential for use in road pavements. Int. J. Pavement Res. Technol. 2017, 10, 185–201. [Google Scholar] [CrossRef]
  34. Gourc, J.P.; Staub, M.J.; Conte, M. Decoupling MSW Settlement into Mechanical and Biochemical Processes–Modelling and Validation on Large-Scale Setups. Waste Manag. 2010, 30, 1556–1568. [Google Scholar] [CrossRef]
  35. Pi, X.; Fei, X.; Wang, Y.; Sun, X.; Guo, Y. Global Void Ratio of Municipal Solid Waste for Compression Indices Estimation. Waste Manag. 2023, 160, 69–79. [Google Scholar] [CrossRef] [PubMed]
  36. National Institute of Environmental Research. Method ES 06303.1a, Humidity and Total Solid-Gravimetry; National Institute of Environmental Research: Incheon, Republic of Korea, 2022. (In Korean) [Google Scholar]
  37. National Institute of Environmental Research. Method ES 06301.1d, Loss on Ignition and Total Organics-Gravimetry; National Institute of Environmental Research: Incheon, Republic of Korea, 2022. (In Korean) [Google Scholar]
  38. Confederation of European Waste-to-Energy Plants. CEWEP Energy Report (Status 2001–2004) Results of Specific Data for Energy, Efficiency Rates and Coefficients, Plant Efficiency Factors and NCV of 97 European W-t-E Plants and Determination of the Main Energy Results; Confederation of European Waste-to-Energy Plants: Brussels, Belgium, 2006. [Google Scholar]
  39. Grosso, M.; Motta, A.; Rigamonti, L. Efficiency of Energy Recovery from Waste Incineration, in the Light of the New Waste Framework Directive. Waste Manag. 2010, 30, 1238–1243. [Google Scholar] [CrossRef] [PubMed]
  40. IPCC. IPCC Guideline for National Greenhouse Gas Inventories; IPCC: Geneva, Switzerland, 2007; Volume 2006. [Google Scholar]
  41. National Institute of Environmental Research. Method ES 01308.1b, Nitrogen Oxides in Flue Gas–NOx–Automated Measuring Method; National Institute of Environmental Research: Incheon, Republic of Korea, 2021. (In Korean) [Google Scholar]
  42. National Institute of Environmental Research. A Study on Improvement of Energy Recovery Efficiency Factors for Waste Incineration Facilities in Korea; National Institute of Environmental Research: Incheon, Republic of Korea, 2022. (In Korean) [Google Scholar]
  43. Vakalis, S.; Moustakas, K.; Loizidou, M. Energy Efficiency of Waste-to-Energy Plants with a Focus on the Comparison and the Constraints of the 3T Method and the R1 Formula. Renew. Sustain. Energy Rev. 2019, 108, 323–329. [Google Scholar] [CrossRef]
Figure 1. Analysis results of the three components of HTWB before incineration and bottom ash after incineration. The results of the sixth national survey on waste in Korea [31] were cited for the analysis results before incineration. The bottom ash results after incineration are the analysis results for the 14 focus target facilities.
Sustainability 16 00448 g001
Figure 2. Comparison of annual HTWB input and ash output by incineration facility. The error bars indicate the standard deviation of five data points for 5-year results from 2018 to 2022 by incineration facility. The error bars of five facilities that did not provide the ash output for some years during the five years (p100-07a, p100-07b, p200-040, p300-02a, and p300-02b) indicate the range of data. Two facilities that did not provide ash output for the entire 5-year period (p200-06a and p200-06b) are not included in the figure.
Sustainability 16 00448 g002
Figure 3. (a) Mass, (b) specific volume, and (c) occupied volume of HTWB and ash, according to the overall volume compaction ratio at a landfill site, compared to the occupied space at the site between HTWB direct landfilling and ash landfilling after incineration. The range of the overall volume compaction ratio is the hypothetical range from 0 to 100, assumed for illustration purposes. The vertical arrow shows the volume reduction at an overall volume compaction ratio of 40%.
Sustainability 16 00448 g003
Figure 4. Recovery efficiency distribution of 44 incineration facilities by year (2018 to 2022). The numbers on the right side of the figure represent incineration tax reduction rates. The blue horizontal solid lines in the figure show the recovery efficiency ranges for applying reduction rates. The bottom and top of the box are the 25th and 75th percentiles of recovery efficiencies, respectively; the band near the center of the box is the 50th percentile; the upper and lower ends of the whiskers represent the 90th and 10th percentiles, respectively; and the solid diamonds near the center of the box are the mean values.
Sustainability 16 00448 g004
Figure 5. Snapshot comparison of the 30-min averaged NOx concentrations before and after emission control measures for the 14 focus target facilities. Limit 1 is 50 ppm, which is the nationwide emission limit for Korea. Limit 2 is 42.5 ppm, which is the strengthened emission limit applied to large cities, including Seoul. The results before emission control measures represent the average of the 60 s average results, and the error bar at the end of each bar indicates the standard deviation of the 60 s average results. The results after the emission control measures represent a 30- min averaged result measured through TMS.
Sustainability 16 00448 g005
Table 1. Forty-four target incineration facilities.
Plant
Group
Incineration
Capacity
(t/d)
NumbersPerformance Overview
SitesFacilitiesMass Reduction
(%, Mean ± Standard Deviation)
R1 Recovery Efficiency
(%, Mean ± Standard Deviation)
p10080–17091583.0 ± 4.068.2 ± 15.5
p200200–270101781.8 ± 2.575.6 ± 14.9
p300300–40061285.0 ± 3.468.0 ± 7.0
Overall254483.1 ± 3.671.0 ± 13.9
Table 2. Incineration capacities and emission control measures of the 14 focus target facilities.
Plant
Group
Facility
ID
Incineration Capacity
(t/d)
Emission Control Measures
p100p100-02a100SDR + BF + SCR
p100-02b100SDR + BF + SCR
p100-06a170AC + EP + WS + SCR
p100-06b170AC + EP + WS + SCR
p200p200-01a200SNCR + SDR + AC + BF
p200-01b200SNCR + SDR + AC + BF
p200-020200SDR + AC + BF + SCR
p200-07a270SNCR + SDR + BF + AC + BF
p200-07b270SNCR + SDR + BF + AC + BF
p300p300-04a300EP + WS + SCR
p300-04b300EP + WS + SCR
p300-06a300SNCR + WS + SDR + AC + BF + SCR
p300-06b300SNCR + WS + SDR + AC + BF + SCR
p300-06c300SNCR + WS + SDR + AC + BF + SCR
AC, activated carbon; BF, bag filter; EP, electrostatic precipitation; SCR, selective catalytic reduction; SDR, semi-dry reactor; SNCR, selective non-catalytic reduction; WS, wet scrubber.
Disclaimer/Publisher’s Note: The statements, opinions and data contained in all publications are solely those of the individual author(s) and contributor(s) and not of MDPI and/or the editor(s). MDPI and/or the editor(s) disclaim responsibility for any injury to people or property resulting from any ideas, methods, instructions or products referred to in the content.

