Article

Analysis of Agricultural Carbon Emissions and Carbon Sinks in the Yellow River Basin Based on LMDI and Tapio Decoupling Models

College of Resource and Environment, Henan Polytechnic University, Jiaozuo 454003, China
*
Author to whom correspondence should be addressed.
Sustainability 2024, 16(1), 468; https://doi.org/10.3390/su16010468
Submission received: 29 November 2023 / Revised: 25 December 2023 / Accepted: 28 December 2023 / Published: 4 January 2024

Abstract

:
In addition to creating economic value, crops also serve important ecological functions. Especially their carbon sink function, which plays a key role in mitigating climate change. In this study, the LMDI and the Tapio model were innovatively combined to quantitatively evaluate the carbon emissions and sinks in the Yellow River basin (YRB). It shows that the average annual growth rate of the YRB was −0.1344% during 2002–2020. Carbon emissions show a negative trend due to the transformation and upgrading of agriculture from traditional to modern and the implementation of policies related to China’s agricultural benefits. Agricultural production efficiency is a major factor in inhibiting agricultural carbon emissions, reducing carbon emissions by an average of approximately 8.07 million tons per year. High-carbon emission and high-sink areas in agriculture are mainly concentrated in the southeast of the YRB, where livestock and poultry farming is the principal source of carbon emissions, with rice, wheat, and corn being the principal contributors to the carbon sink. Moreover, there are significant differences in the carbon sink capacity of crops in the YRB. Optimizing crop selection and area distribution can enhance the carbon sink capacity in different regions, contributing to more effective carbon emission control. This study combines agricultural carbon emissions with the carbon sequestration capacity of crops, providing data support and a theoretical basis for the policy formulation and planning of low-carbon agriculture in China. It is of great significance for promoting sustainable agricultural development and mitigating climate change.

1. Introduction

Greenhouse gas (GHG) emissions are considered to be the root cause of environmental problems such as global warming [1], sea level rise, and frequent severe weather [2,3]. It is predicted that global CO2 emissions may increase the Earth’s temperature by 1.5 to 2 °C in the future [4], posing a serious threat to the survival and development of human beings [5]. The Paris Agreement, the first historic global climate change agreement, was signed by 178 countries around the world in 2016 [6], aiming to slow down climate warming and increase the capacity to tackle climate change by limiting global warming to 1.5 degrees Celsius. However, this topic is particularly important for the BRICS countries because of their speedy economic growth and contribution to worldwide economic expansion [7,8]. The BRICS countries rank high in energy usage in comparison to other emerging countries because of their large populations and promising economies. Due to this great economic expansion, the BRICS account for around 41% of Earth’s energy usage and are key contributors to CO2 emissions. Because of the higher economic expansion of the BRICS, the total CO2 emission per capita is 13.98 trillion tons, contributing to 41.7% of Earth’s CO2 emissions [9]. Moreover, China, India, Russia, and Brazil are among the top seven countries with the largest CO2 emissions, the leading cause of environmental damage [10]. Agriculture accounts for the largest shares of global anthropogenic carbon dioxide (CH4) and nitrogen dioxide (N2O) emissions among all sources of GHG emissions, about 52% and 84%, respectively [11]. GHG emissions from agriculture and food production have increased by 17% globally over the past three decades and agrifood systems accounted for up to 31% of global anthropogenic emissions of carbon dioxide (CO2) in 2019 [12].
China, as the most populous country in the BRICS nations and the world, faces the challenge of relatively underdeveloped agriculture due to its large population. China is one of the premier agricultural countries in the world, with an increase in crop production of 46.3% from 2000 to 2015, accounting for 19.9% of the global production [13]. China’s CO2 emissions reached 11.50 billion tons in 2014, accounting for 35.6% of the world total [14]. Moreover, China’s traditional agricultural production produces 17% of the world’s greenhouse gases [14]. Agricultural carbon emissions are usually mainly divided into crop production and livestock farming [15]. Fertilizers, with the highest CO2 emissions from agricultural land, are considered to be an important measure to alleviate the pressure on China’s agriculture in the context of limited resources, scarce arable land, and rapid population growth [16]. China consumes 40% of the world’s fertilizers and has become the largest fertilizer user [17,18], and the increase in CO2 emissions from agricultural production is a direct result of the overuse of fertilizers. China has ranked first in the world in the production of major livestock products since 1985, and its average annual CH4 emissions from animal husbandry grew by 2.2% annually from 2004 to 2013 [19]. China’s traditional agricultural production produces 17% of the country’s greenhouse gases [14]. In China, rice, corn, and wheat account for over half of the total grain production. Since 2000, China’s grain output per unit of area has increased by 26.38%, while the use of chemical fertilizers, pesticides, and agricultural film has increased by 45.25%, 41.23%, and 93.21%, respectively [5]. Frequent changes in land use, excessive resource use, and improper waste disposal also contribute to carbon emissions [20]. It is worth noting that these previous studies argue that China’s phosphorus footprint accounts for a large global proportion. Around 42% of the total phosphorus exceedance footprint in the world was argued to come from China [21], and it is expected to keep increasing in the future. According to a report released from a Chinese phosphorus company about the GHG emissions during phosphorus processing in 2019, the total GHG emissions were estimated to be about 0.777 million tons of CO2-equivalent during phosphorus fertilizer production from the phosphoric acid and ancillary production units [22]. In 2015, China’s production of phosphorus fertilizer was nearly twice that of developed countries [23]. The substantial greenhouse gas emissions associated solely with phosphorus fertilizer production prompt contemplation of the potential impact of agricultural fertilization on greenhouse gas emissions, the magnitude of which is immeasurable. Currently, greenhouse gas emissions from agricultural activities account for 16–17% of China’s total emissions, significantly higher than the global average of 13.5% [24]. To address the climate change risk, more than 100 countries worldwide pledged to become carbon-neutral by the end of 2020. China also proposed a “dual carbon” development target of a “carbon peak” and being “carbon-neutral” in 2020. Agriculture is a major contributor to global carbon emissions, and as a traditional agricultural country, carbon emissions reduction in China’s agricultural sector cannot be ignored [25].
The Yellow River, known as the mother river of the Chinese nation, is the cradle of Chinese civilization. The Yellow River basin (YRB) spans the three major economic zones in eastern, central, and western China, mainly involving agriculture and animal husbandry, playing a pivotal role in the national economic development. Serving as an essential ecological barrier and a typical region affected by global warming, its ecological protection and high-quality development have been elevated to a major national strategy [26]. The YRB is an important ecological barrier and economic development belt in China; however, the economic and social development mode, focused on agricultural production and energy development, does not match the environment carrying capacity of the YRB. In 2021, the China Central Committee of the Communist Party of China and the State Council issued an outline document on the ecological protection and high-quality development of the Yellow River basin, pointing out that efforts should be made to strengthen ecological protection and management, ensure the long-term stability of the Yellow River, promote high-quality development, and improve the lives of the people [27]. The YRB is one of the principal traditional farming areas in China, where intensive agricultural production methods have caused problems such as water resource reduction and environmental pollution, which have led to a bottleneck in the low-carbon development of agriculture. Moreover, a serious challenge was given to the national agricultural plan due to the long period of crude inputs of agricultural materials and the irrational structure of the agricultural industry in the early period [28]. Despite being only 15% arable land [29], the YRB has a grain output of 232.69 million tons, accounting for 35.37% of the national grain total. The unit area ratio of the grain production is far greater than the arable land, thus the GHG emissions from agriculture in the YRB should not be ignored.
There are two primary ways to reduce the concentrations of greenhouse gases in the atmosphere, through energy conservation and promoting the use of renewable energy sources, and the other way is to increase carbon sinks [30]. However, agricultural carbon emission sources differ from other emission sources. In addition to being an important source of carbon emissions, crops themselves have the function of being carbon sinks, fixing carbon in the soil, which is of great significance for carbon emission reduction. However, previous studies calculating [31,32,33] carbon emissions have tended to ignore the importance of carbon sequestration in the process of crop production, resulting in a large deviation between the results of the accounting and the actual situation, and giving policy recommendations that cannot address the root causes of carbon emissions. The accurate assessment of carbon emissions is an important prerequisite for formulating effective carbon reduction policies and ensuring their implementation, thus adding carbon sinks into the carbon emission system is of great significance.
Given the importance of reducing agricultural carbon emissions in mitigating climate change, strategies for mitigating agricultural carbon emissions have become a hot research topic among scholars. Accurate quantification of agricultural carbon emissions and carbon sequestration can facilitate the achievement of sustainable agriculture and climate change mitigation [34]. In order to reduce agricultural carbon emissions, it is essential to identify their sources. Some scholars argue that the major sources of agricultural carbon emissions come from inputs such as fertilizers, pesticides, and agricultural machinery [35]. On the other hand, Deng argues that agricultural soil use is the main driver of agricultural carbon emissions, accounting for about 70% or more of total carbon emissions from agricultural sources [36]. While other scholars have argued that carbon emissions from agriculture come mainly from livestock enteric fermentation, manure management, rice growth, and the arbitrary disposal of agricultural waste [37].
Research in the academic community on agricultural net carbon sinks primarily focuses on several aspects: Firstly, the calculation of agricultural net carbon sink amounts and the analysis of their distribution patterns in different times and spaces [38]. Secondly, attention is given to the study of agricultural carbon sink trading and compensation mechanisms [39], involving ecological compensation issues, compensation principles, compensation methods and standards, as well as the monitoring of forest carbon sink trading [40]. Additionally, research has been conducted on related systems, policies, and comparisons of carbon trading among different countries [41]. Overall, scholars have conducted extensive research on agricultural carbon sequestration measurement, factors influencing sequestration, carbon sequestration trading and compensation mechanisms, and the prospects for carbon sequestration development. Comparing this study to the research findings of other scholars, the existing studies mainly focus on forest carbon sequestration, with limited research on the role of cereal crops as a carbon sink. The author’s research approach aims to investigate the carbon sequestration capacity of the same crop in different regions and whether there are regional differences in the carbon sequestration capacity of these crops. If regional differences exist, strategically planting crops with higher carbon sequestration capacity can contribute to the reduction of carbon emissions.
In conclusion, China has relatively more research on agricultural carbon emissions, but there are still some shortcomings. These are mainly manifested in the following aspects: Firstly, the research on agricultural carbon emission sources is not specific and accurate enough. Secondly, the research time span is relatively short, and it cannot fully reflect the long-term trend in China’s agricultural carbon emissions. In addition, the research methods are relatively simple, as many scholars only estimate and analyze agricultural carbon emissions through the factor method, lacking the use of models to optimize the data results. At the same time, there is relatively less research on agricultural carbon sinks, as some scholars only focus on the quantity of agricultural carbon sinks, lacking studies on how to reduce carbon emissions from the perspective of carbon sinks.
Based on this, this paper combines agricultural carbon emissions and carbon sinks, considering agricultural inputs, livestock farming, rice cultivation, and farmland soil as four dimensions to assess the carbon sequestration capacity of crops in different regions. The IPCC standard accounting method is used to calculate and analyze agricultural carbon emissions and crop carbon sinks in the YRB from 2002 to 2020. We integrate the logarithmic mean Divisia index (LMDI) decomposition and Tapio decoupling model to conduct an in-depth investigation of the drivers of these emissions. Firstly, we quantitatively evaluate the contribution of individual driving factors to the changes in total CO2 emissions and examine the historical trend from 2002 to 2020 through retrospective analysis. This enables us to pinpoint key factors affecting the changes in overall CO2 emissions. Subsequently, we apply the Tapio decoupling model to correlate the value of China’s agricultural carbon emissions with the agricultural economy from 2002 to 2020, and verify the decoupling relationship. Finally, specific emission reduction measures are proposed based on the research conclusions, providing a theoretical basis for mitigating the impact of agriculture in the Yellow River basin on climate change in China.

2. Methodology and Data
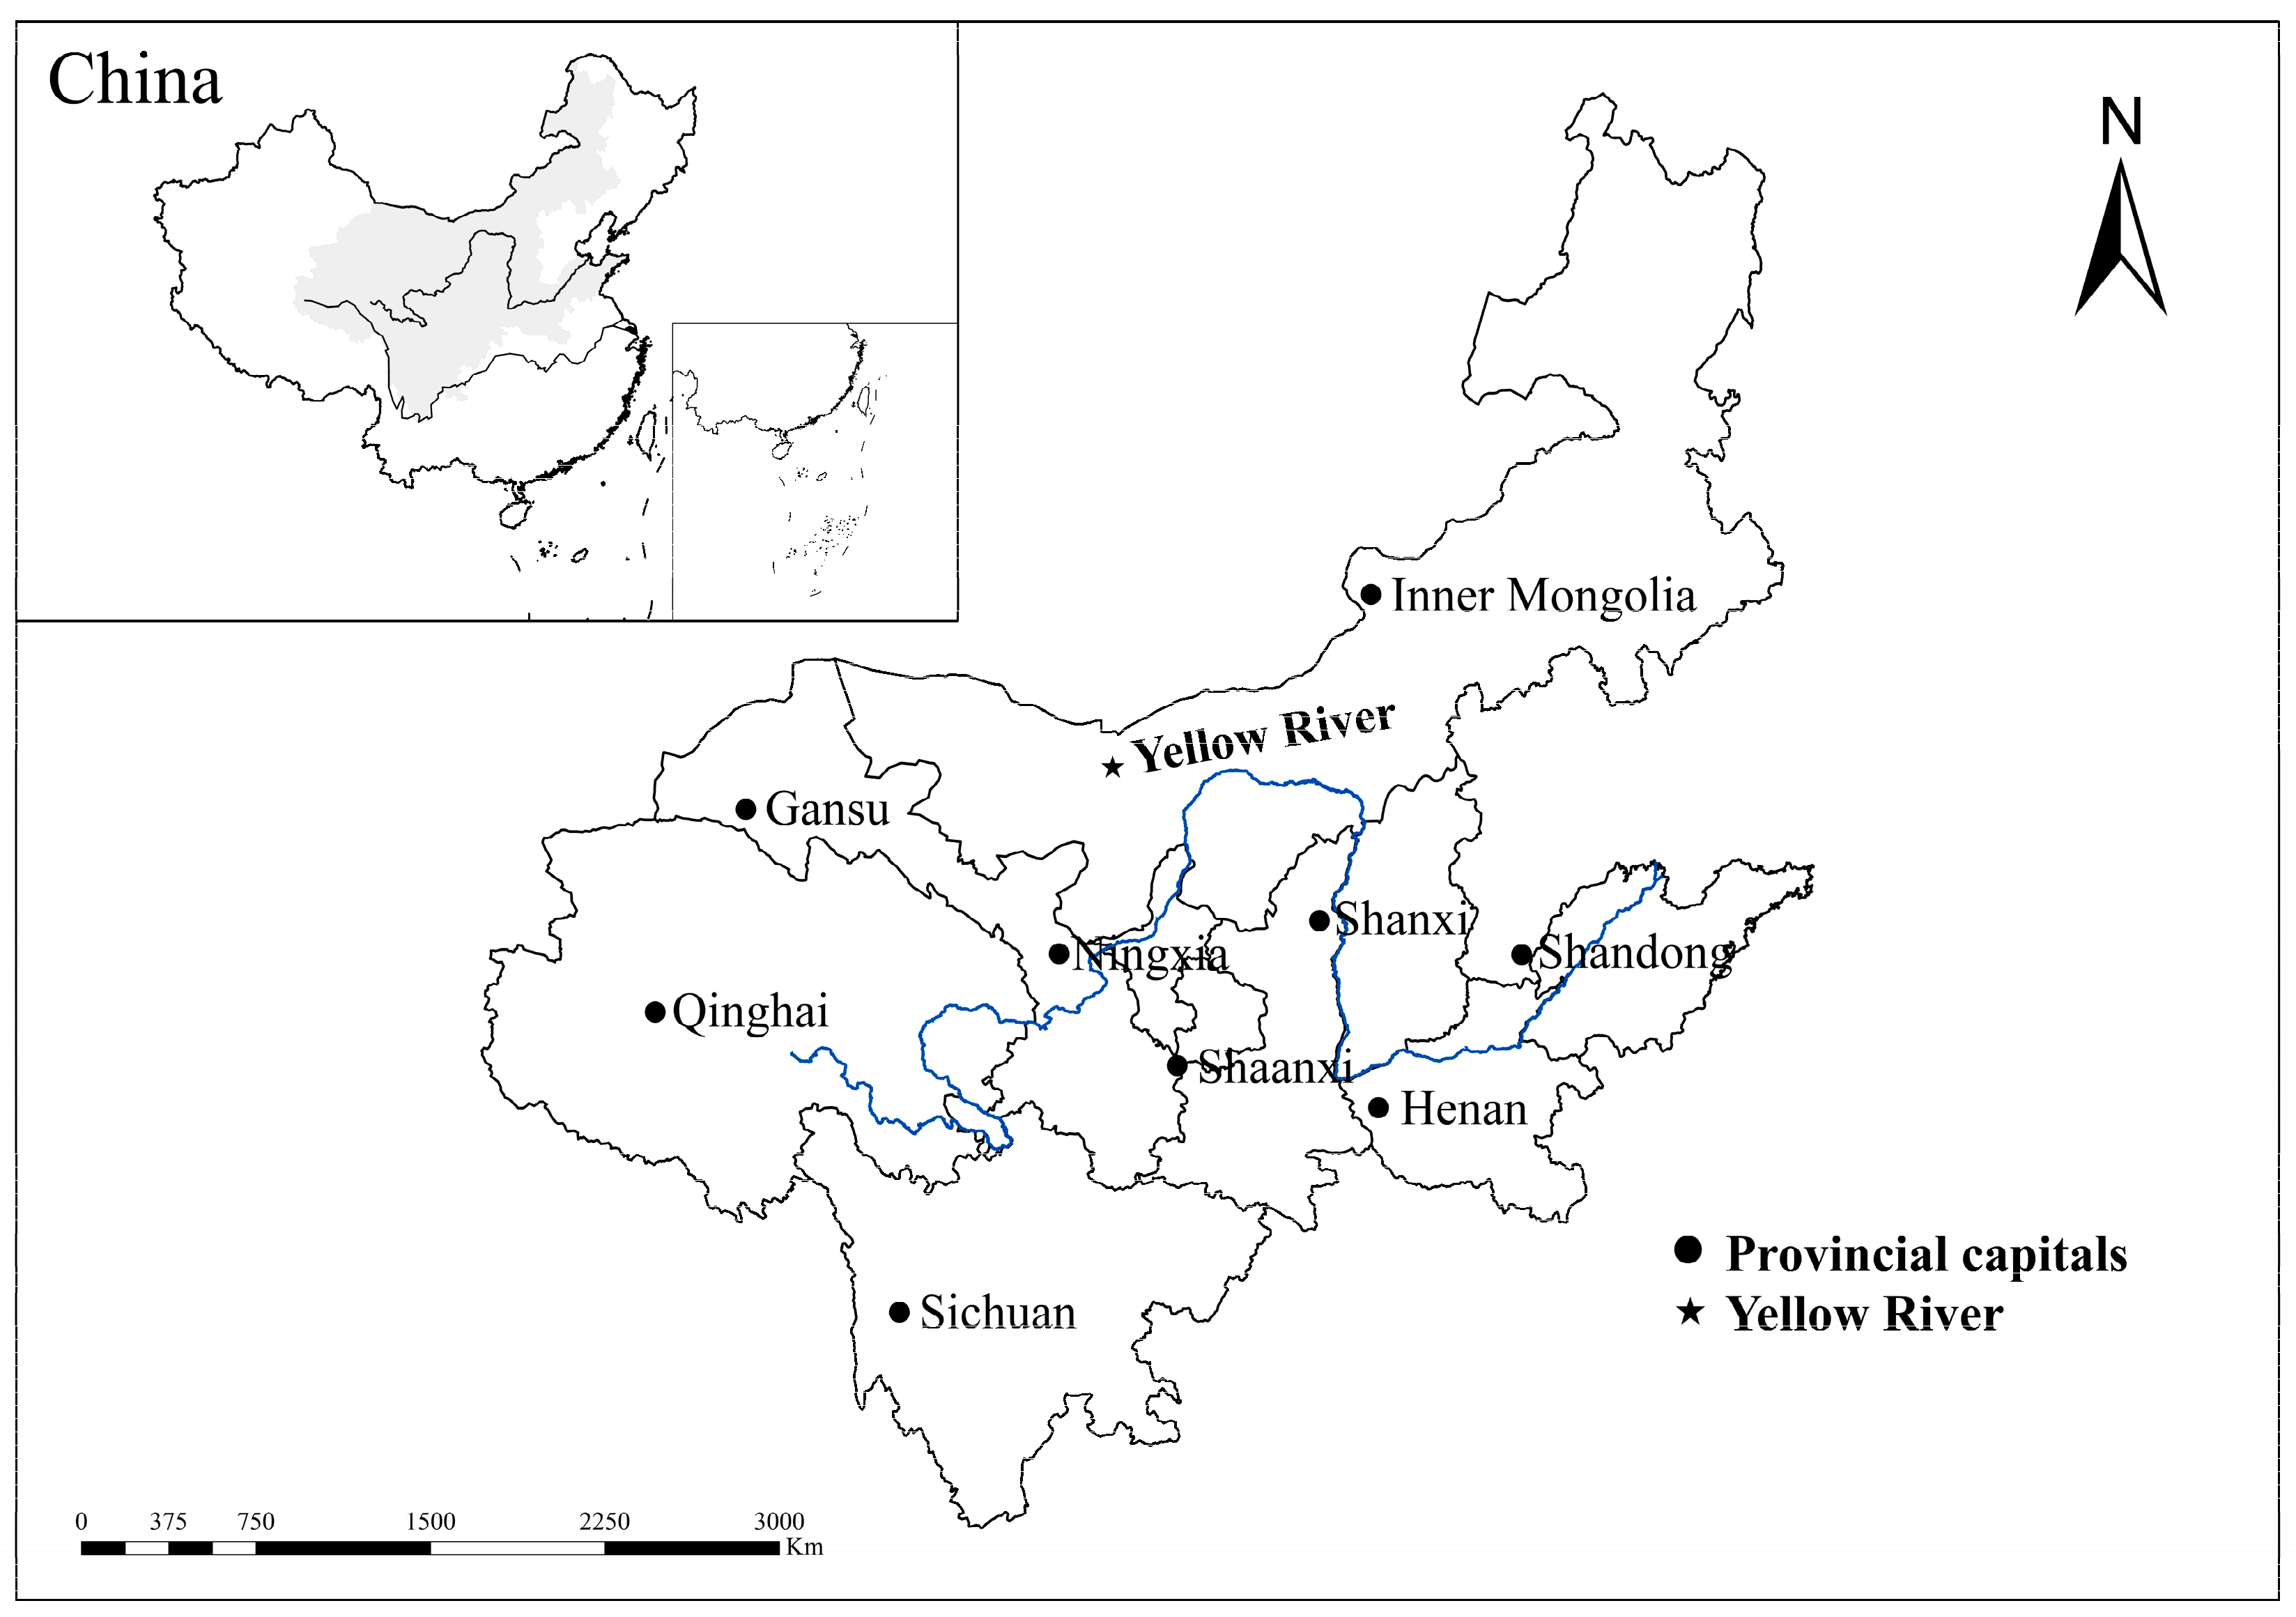
2.1. Study Area

The Yellow River is the second longest river in China, with a total length of about 5464 km and a basin area of about 750,000 km2. The Yellow River originates from the Qinghai-Tibet Plateau and flows from west to east through a total of nine provinces: Qinghai, Sichuan, Gansu, Ningxia, Inner Mongolia, Shaanxi, Shanxi, Henan, and Shandong. It finally flows into the Bohai Sea [42]. As shown in Figure 1.

2.2. Data Sources

According to national statistical data, agricultural material input, crop area, effective irrigated area, crop yield, and livestock data were obtained for 2002–2020. Data sources: China Statistical Yearbook, China Rural Statistical Yearbook, and Statistical Yearbooks of nine YRB provinces.

2.3. Calculation Method of Agricultural Carbon Emissions

Based on the IPCC’s published carbon emissions coefficient method, carbon emissions are calculated as follows [43,44]:
C = C i = N i × δ i
where C is the total carbon emissions, Ci is the carbon emissions of carbon source i; Ni is the amount of carbon source i, and δi is the carbon emission coefficient of carbon source i.

2.3.1. Carbon Emissions from the Planting Industry

Carbon emissions from agricultural inputs (chemical fertilizer, pesticides, agricultural films, agricultural diesel, agricultural irrigation) [45] and greenhouse gases such as CH4 and N2O from agrarian soils are the primary carbon emissions. The carbon sources and coefficients are shown in Tables S1–S3. According to the IPCC’s fifth assessment report, the greenhouse effect caused by one ton of CH4 is equivalent to 6.8182 t C, while that caused by one ton of N2O is equal to 81.2727 t C [46].

2.3.2. Carbon Emissions from Livestock Farming

Currently, the methodologies used to measure GHG emissions from the livestock sector are mainly based on the estimation methods provided by the IPCC [47]. GHG emissions from livestock mainly originate from CH4 from animal gastrointestinal fermentation, CH4 from livestock manure disposal, and N2O. Currently, the main varieties of livestock in the YRB city group are cows, horses, donkeys, mules, camels, pigs, and sheep. The discharge coefficient of animal husbandry is shown in Table S4.

2.4. Agricultural Carbon Sink

In the current paper, we referred to the study of [48,49] to estimate the agricultural carbon sink. The principle of this method is to estimate the net primary productivity [50], which has been extensively used to estimate the carbon sink of agriculture for decades at home and abroad. The measurement formula is as follows:
C x = C i Y i × K i × 1 F i / W i
where Cx is the carbon uptake of crops in the region (t); Ci is the carbon uptake of the i-type crops (t); Yi is the carbon conversion coefficient (%); Ki is the yield of the i-type crops (t); Fi is the moisture coefficient of i-type crops; and Wi is the economic coefficient of i-type crops. The carbon conversion, economic, and water coefficients of different crops are shown in Table S5.

2.5. Agricultural Carbon Emissions Intensity

Agricultural carbon intensity is a measure of the level of agrarian carbon emissions obtained from the ratio of regional agricultural carbon emissions to the gross agricultural product of the region [51]; the calculation formula is as follows.
C q t = C t G D P t
where Cqt is the carbon intensity of agricultural emissions in period t, Ct is the carbon emissions from agriculture in period t, and GDPt is the gross domestic product of agriculture and livestock in period t.

2.6. Factors Influencing Agricultural Carbon Emissions and Decomposition Models

Index decomposition analysis (IDA) has been extensively utilized to investigate better the trends in the driving factors of CO2 emissions and energy consumption [52]. Since there are no residual variables in the Divisia index method, it has become the predominant empirical research method in the research field. Moreover, the logarithmic mean Divisia index (LMDI) is a typical way of calculating the Divisia index that is compelling in both practice and theory [53]. Subsequently, the well-known LMDI decomposition analysis approach was proposed. The LMDI model was derived from further research on the basis of Kaya’s constant equation and this approach can be decomposed in both additive and multiplicative ways. The additive decomposition analysis determines absolute change, while the multiplicative decomposition analysis assesses relative change [53,54].
In this paper, we use addition decomposition to decompose CO2 emissions levels between a reference year and an end year into additive components, called factors, from the YRB’s carbon emissions. Equations (4) and (5), through the use of an analysis of LMDI and an explanation of six decomposed factors, are summarized as follows:
C = i C i = i C i N × N Q × Q Z × Z P z × P z P × P = i α × β × γ × δ × ε × P
C i N = α , N Q = β , Q Z = γ , Z P z = δ , P z P = ε
In Equation (3), C is total agricultural carbon emissions, Ci is the i-th category of agricultural carbon emissions, N is the total output value of farming and animal husbandry, Q is the total output value of agriculture, forestry, animal husbandry, and fishery, Z is GDP, Pz is the total regional population, and P is the size of the agricultural labor force. α is agricultural production efficiency, β is the structure of the agricultural industry, γ is the regional industrial structure, δ is the level of regional economic development, and ε is the level of urbanization.
The above equation was further decomposed using LMDI summation decomposition to quantify the magnitude of the effect of each factor on carbon emissions.
C = α × β × γ × δ × ε × P
Taking the logarithm of Equation (6) yields
l n C = l n α + l n β + l n γ + l n δ + l n ε + l n P
A summation decomposition of Equation (7) yields that the difference is decomposed as
C T = C t C 0
The contribution values of the different decomposition factors are
α = C t C 0 l n C t l n C 0 ( l n α t l n α 0 )
β = C t C 0 l n C t l n C 0 ( l n β t l n β 0 )
γ = C t C 0 l n C t l n C 0 ( l n γ t l n γ 0 )
δ = C t C 0 l n C t l n C 0 ( l n δ t l n δ 0 )
ε = C t C 0 l n C t l n C 0 ( l n ε t l n ε 0 )
P = C t C 0 l n C t l n C 0 ( l n P t l n P 0 )
T represents the total change; t is the target year and 0 is the base year; depending on the actual situation, Ct − C0 ≠ 0, and the individual parameters introduced are not 0. The total effect is then
C T = α + β + γ + δ + ε + P
This study has extended the LMDI model and decomposed total agricultural carbon emissions into six factors. ∆α, ∆β, ∆γ, ∆δ, ∆ε, and ∆P, respectively, stand for the contribution values of the agricultural production efficiency, agricultural industry structure, regional industry structure, regional economic development level, urbanization rate, and agricultural labor force to carbon emission variation. The LMDI model, through the aforementioned decomposition, allows for the quantification of the impacts and interactions of each factor on changes in agricultural carbon emissions.

2.7. Economic Models

Decoupling, which describes the connection between forces that influence the economy and those that put pressure on the environment [55], was first proposed by the Organisation for Economic Co-operation and Development (OECD, Paris, France) and was further divided by OECD into absolute decoupling and relative decoupling [56]. Carbon decoupling presents the ideal process whereby the relationship between economic growth and GHGs emission will weaken until it vanishes [57]. Since the OECD decoupling model has shortcomings, such as that the results are easily affected by time and the general classification of decoupling types, Tapio integrates relative and absolute quantities and redefines decoupling indicators by the ratio of the growth change rate, which can compensate for these shortcomings [58]. In line with the Tapio framework, the relationship between CO2 emissions and economic growth can be classified into eight decoupling states following the decoupling index and the growth direction of CO2 emissions and economic growth (for details, see Table 1) [59]. Therefore, the Tapio decoupling model is used in this paper to study the agricultural carbon emissions in the YRB from 2002 to 2020, and to explore the relationship between them and the economy. It is calculated as follows:
T = C / C t 1 G / G t 1 = C t C t 1 C t 1 G t G t 1 G t 1
where T denotes the decoupling elasticity of agricultural economic growth and carbon emissions; ∆C is the change in carbon emissions in the current year relative to the base year, million/t; Ct1 is the base year agricultural carbon emissions; ∆G is the change in regional gross agricultural and livestock product in the current year relative to the base year, t denotes the current period, and t−1 denotes the previous period.
Based on the specific values of T, ∆C, and ∆G, the decoupling resilience was classified into eight Tapio decoupling types, as shown in Table 1, namely, weak decoupling, strong decoupling, declining decoupling, weak negative decoupling, strong negative decoupling, expansive negative decoupling, growth connection, and recessional connection [59].

3. Results and Discussion

3.1. Characteristics of Agricultural Carbon Emissions

3.1.1. Time-Series Changes in Agricultural Carbon Emissions

The results of the study show that carbon emissions from animal husbandry in the urban agglomeration of the YRB are the top source of agricultural carbon emissions (Figure 2), with livestock and poultry breeding, agricultural material inputs, and farmland soil accounting for 56.8%, 30.5%, and 12.7% of the total. The total agricultural carbon emissions of the urban agglomeration in the YRB showed an overall decreasing trend from 2002 to 2020. The total agricultural carbon emissions of the YRB urban agglomeration in 2002 were 85.498 million tons, and reached 82.51 million tons in 2020. Total agricultural carbon emissions decreased by 2.982 million tons, with an overall negative trend and an average annual growth rate of −0.134%. Peak emissions for the past 18 years of 95.163 million tons occurred in 2006.
During the study period, the urban agglomeration of the YRB showed two trends of growth followed by decline. The first growth phase was from 58.498 million tons in 2002 to 95.163 million tons in 2006, with an average annual growth rate of 2.721%. Then, carbon emissions in the YRB dropped to 85.51 million tons in 2007, with a growth rate of −10.143%, showing the first significant downward trend. This is the same as the trend in livestock and poultry breeding emissions. In the second growth phase, emissions grew from 85.51 million tons in 2007 to 91.465 million tons in 2015, with an annual growth rate of 0.846%. China was in a phase of dual transition, with its economy maintaining a steady momentum of relatively rapid development, and regional economies were also developing rapidly. This led to an expansion in the overall size of the population and an increase in the frequency of economic activities, which in turn led to a sustained increase in agricultural carbon emissions. However, from the beginning of 2015 to 2019, carbon emissions from agriculture showed a significant decline, from 79.577 million tons to a lower level. This indicates that under the guidance of national environmental protection policies and green development policies, agricultural production in the urban agglomeration of the YRB has gradually shifted to low-carbon agriculture and has achieved initial results. This shift means that more environmentally friendly and sustainable practices have been adopted in the agricultural production process, resulting in a reduction in greenhouse gas emissions, including more efficient agricultural management, energy-saving and emission reduction measures, promotion of green planting techniques, and scientific fertilization. This trend shows that the YRB urban agglomeration has made important progress in reducing carbon emissions and reflects China’s concern and efforts for environmental protection and sustainable development. However, continued efforts are still needed to sustainably promote the green transformation of agriculture in order to further reduce agricultural carbon emissions and achieve more sustainable and low-carbon agricultural development.
With the improving standard of living of the people, the demand for livestock and poultry farming products has been gradually increasing, and thus, the scale of farming has been expanding, resulting in relatively high carbon emissions from livestock and poultry breeding in the urban agglomeration of the YRB, which mainly come from the intestinal fermentation of pigs, cows, and sheep, as well as from fecal emissions. According to Figure 3, it can be observed that among the seven livestock species, camels have the smallest scale of breeding, but their carbon emissions show an upward trend, while the overall trends of the other six species are decreasing. This situation may be influenced by multiple factors. Firstly, the increasing demand for camel products has led to the expansion of camel breeding. Secondly, climate change and drought in some regions may have prompted people to choose camels as a relatively adaptable option for livestock breeding. Additionally, improvements in feed technology and management practices may have enhanced the efficiency and sustainability of camel breeding, thereby encouraging more farmers to participate. The carbon emissions from population-based animal husbandry in the urban agglomeration of the YRB declined significantly during the period from 2002 to 2020 (Figure 3), with a total decline of 7.92 million tons. The average annual decline was about 0.044 million tons, with an average annual growth rate of −0.813%. This downward trend can be attributed to a series of policy measures formulated by the China government for the development of the livestock industry. In 2006, China issued a policy document entitled “China’s Livestock Husbandry is Transforming from Traditional Livestock Husbandry to Modern Livestock Husbandry”, with the aim of improving the level and quality of livestock production and promoting the development of modernized livestock husbandry. The growth rate of carbon emissions during this period was −0.906%, and even reached −18.01% in 2007, with a total decline of 11.34 million tons in two years. Since then, the State Council of China issued the “Opinions of the State Council on Promoting the Sustainable and Healthy Development of the Animal Husbandry Industry” in 2007. The construction of a modern animal husbandry industry and the promotion of the healthy development of animal husbandry are clearly stated as the main objectives. From 2007 to 2020, carbon emissions from animal husbandry in the urban agglomeration of the YRB further decreased by 4.813 million tons, with an average annual growth rate of −9.8%. The implementation of this series of animal husbandry policies has had a positive impact on reducing carbon emissions from animal husbandry. The main goal of the policy is to build a modernized animal husbandry industry and promote the healthy development of animal husbandry. By improving the production level and quality of animal husbandry, optimizing breeding methods and management, and strengthening environmental protection measures, carbon emissions from livestock and poultry farming can be effectively controlled. The implementation of these policies can reduce carbon emissions by reducing the number of livestock and poultry raised, improving feeding management and manure treatment, and promoting the efficient use of feed and energy-saving and emission reduction technologies. In addition, the government encourages farmers to adopt green and environmentally friendly livestock and poultry farming methods, such as organic farming and grassland grazing, in order to minimize negative impacts on the environment. The implementation of these measures has resulted in a gradual reduction in carbon emissions from animal husbandry in the urban agglomerations of the YRB, making a positive contribution to the realization of low-carbon animal husbandry development and the reduction in carbon emissions. In conclusion, persistently strengthening policy measures is crucial for further reducing carbon emissions from livestock farming. Firstly, improving feed quality is key. Selecting more efficient and sustainable feed options can minimize greenhouse gas emissions during the farming process. Simultaneously, enhancing livestock management practices and implementing scientific management measures can make the farming process more efficient and sustainable. Additionally, optimizing the farming environment is an important aspect. Providing comfortable temperatures, humidity, and ventilation conditions not only helps reduce animals’ energy consumption and stress responses but also significantly decreases carbon emissions. Furthermore, effectively utilizing livestock manure for organic fertilizer production can reduce the use of chemical fertilizers in farmland, further lowering greenhouse gas emissions. These initiatives not only contribute to environmental conservation but also promote the development of a circular economy. Implementing this series of measures will drive the livestock farming industry towards a more environmentally friendly and sustainable direction, making a continuous and positive contribution to carbon emissions reductions.
The structure of farmland carbon emissions in the YRB urban agglomeration (Figure 4) shows that farmland contributed 30.5% of total emissions between 2002 and 2020. Furthermore, fertilizer application was identified as the main source, accounting for 61.25% of farmland carbon emissions. In the carbon emissions from agricultural land within the urban agglomeration of the YRB, fertilizers heavily dominate. The total carbon emissions from agricultural land in 2020 reached 26.428 million tons, an increase of 5.128 million tons compared to 2002, representing a growth rate of 24% according to the scientific standard. The carbon emissions from agricultural land showed an increasing trend from 2002 to 2015, which was consistent with the trend in fertilizer application emissions. The issuance of the Central Document No. 1 in 2004 and the cancellation of traditional agricultural taxes by the state in 2006, along with the implementation of the “reducing taxes, increasing incentives, and giving farmers more freedom” policy, significantly boosted the enthusiasm of farmers and led to the revival of the agricultural industry. These policies resulted in a substantial increase in the production scale of major crops such as wheat, corn, cotton, and peanuts in the YRB (Figure 5), which is a significant agricultural production base in China. Consequently, the carbon emissions from agricultural land continued to rise. In 2020, the carbon emissions from agricultural land decreased by 3.982 million tons compared to 2015, representing a decrease of 13.1% according to the scientific standard. In 2015, the Ministry of Agriculture of the country released the “Action Plan for Zero Growth in Fertilizer Use by 2020” and the “Action Plan for Zero Growth in Pesticide Use by 2020”. These policies not only enhanced the low-carbon awareness of farmers, actively responding to the call for green development in agriculture, but also optimized and adjusted the agricultural industry’s structure. The rationalization of the agricultural input structure effectively addressed issues such as the excessive use of fertilizers and pesticides, resulting in reduced usage of fertilizers and pesticides with a focus on green and efficient practices. This, in turn, indirectly contributed to the declining trend in carbon emissions.
We analyzed the carbon emissions structure of methane from rice cultivation during the growth cycle in the YRB urban agglomeration (Table S8). A comparison revealed that Sichuan Province is the major source of carbon emissions from rice cultivation in the region. Sichuan Province was among the first provinces in China to promote hybrid rice cultivation. Compared to the base period, carbon emissions in Sichuan Province decreased by 0.255 million tons, with a peak of 2.419 million tons in 2005. Carbon emissions from rice cultivation during the growth and development cycle show a stable increase, but generally declining trend. At the varietal level, it is possible to establish dedicated funds to support the cultivation of high-yield and low-emission rice varieties. Additionally, efforts can be made to strengthen the promotion and application of these new varieties. At the policy level, government departments can collaborate with research institutions and businesses to develop and improve industry standards and technical regulations related to methane reduction and carbon sequestration in rice fields. Furthermore, the monitoring and evaluation methods and systems can be enhanced, and innovative incentive measures and special initiatives can be established to promote methane reduction actions in rice fields.

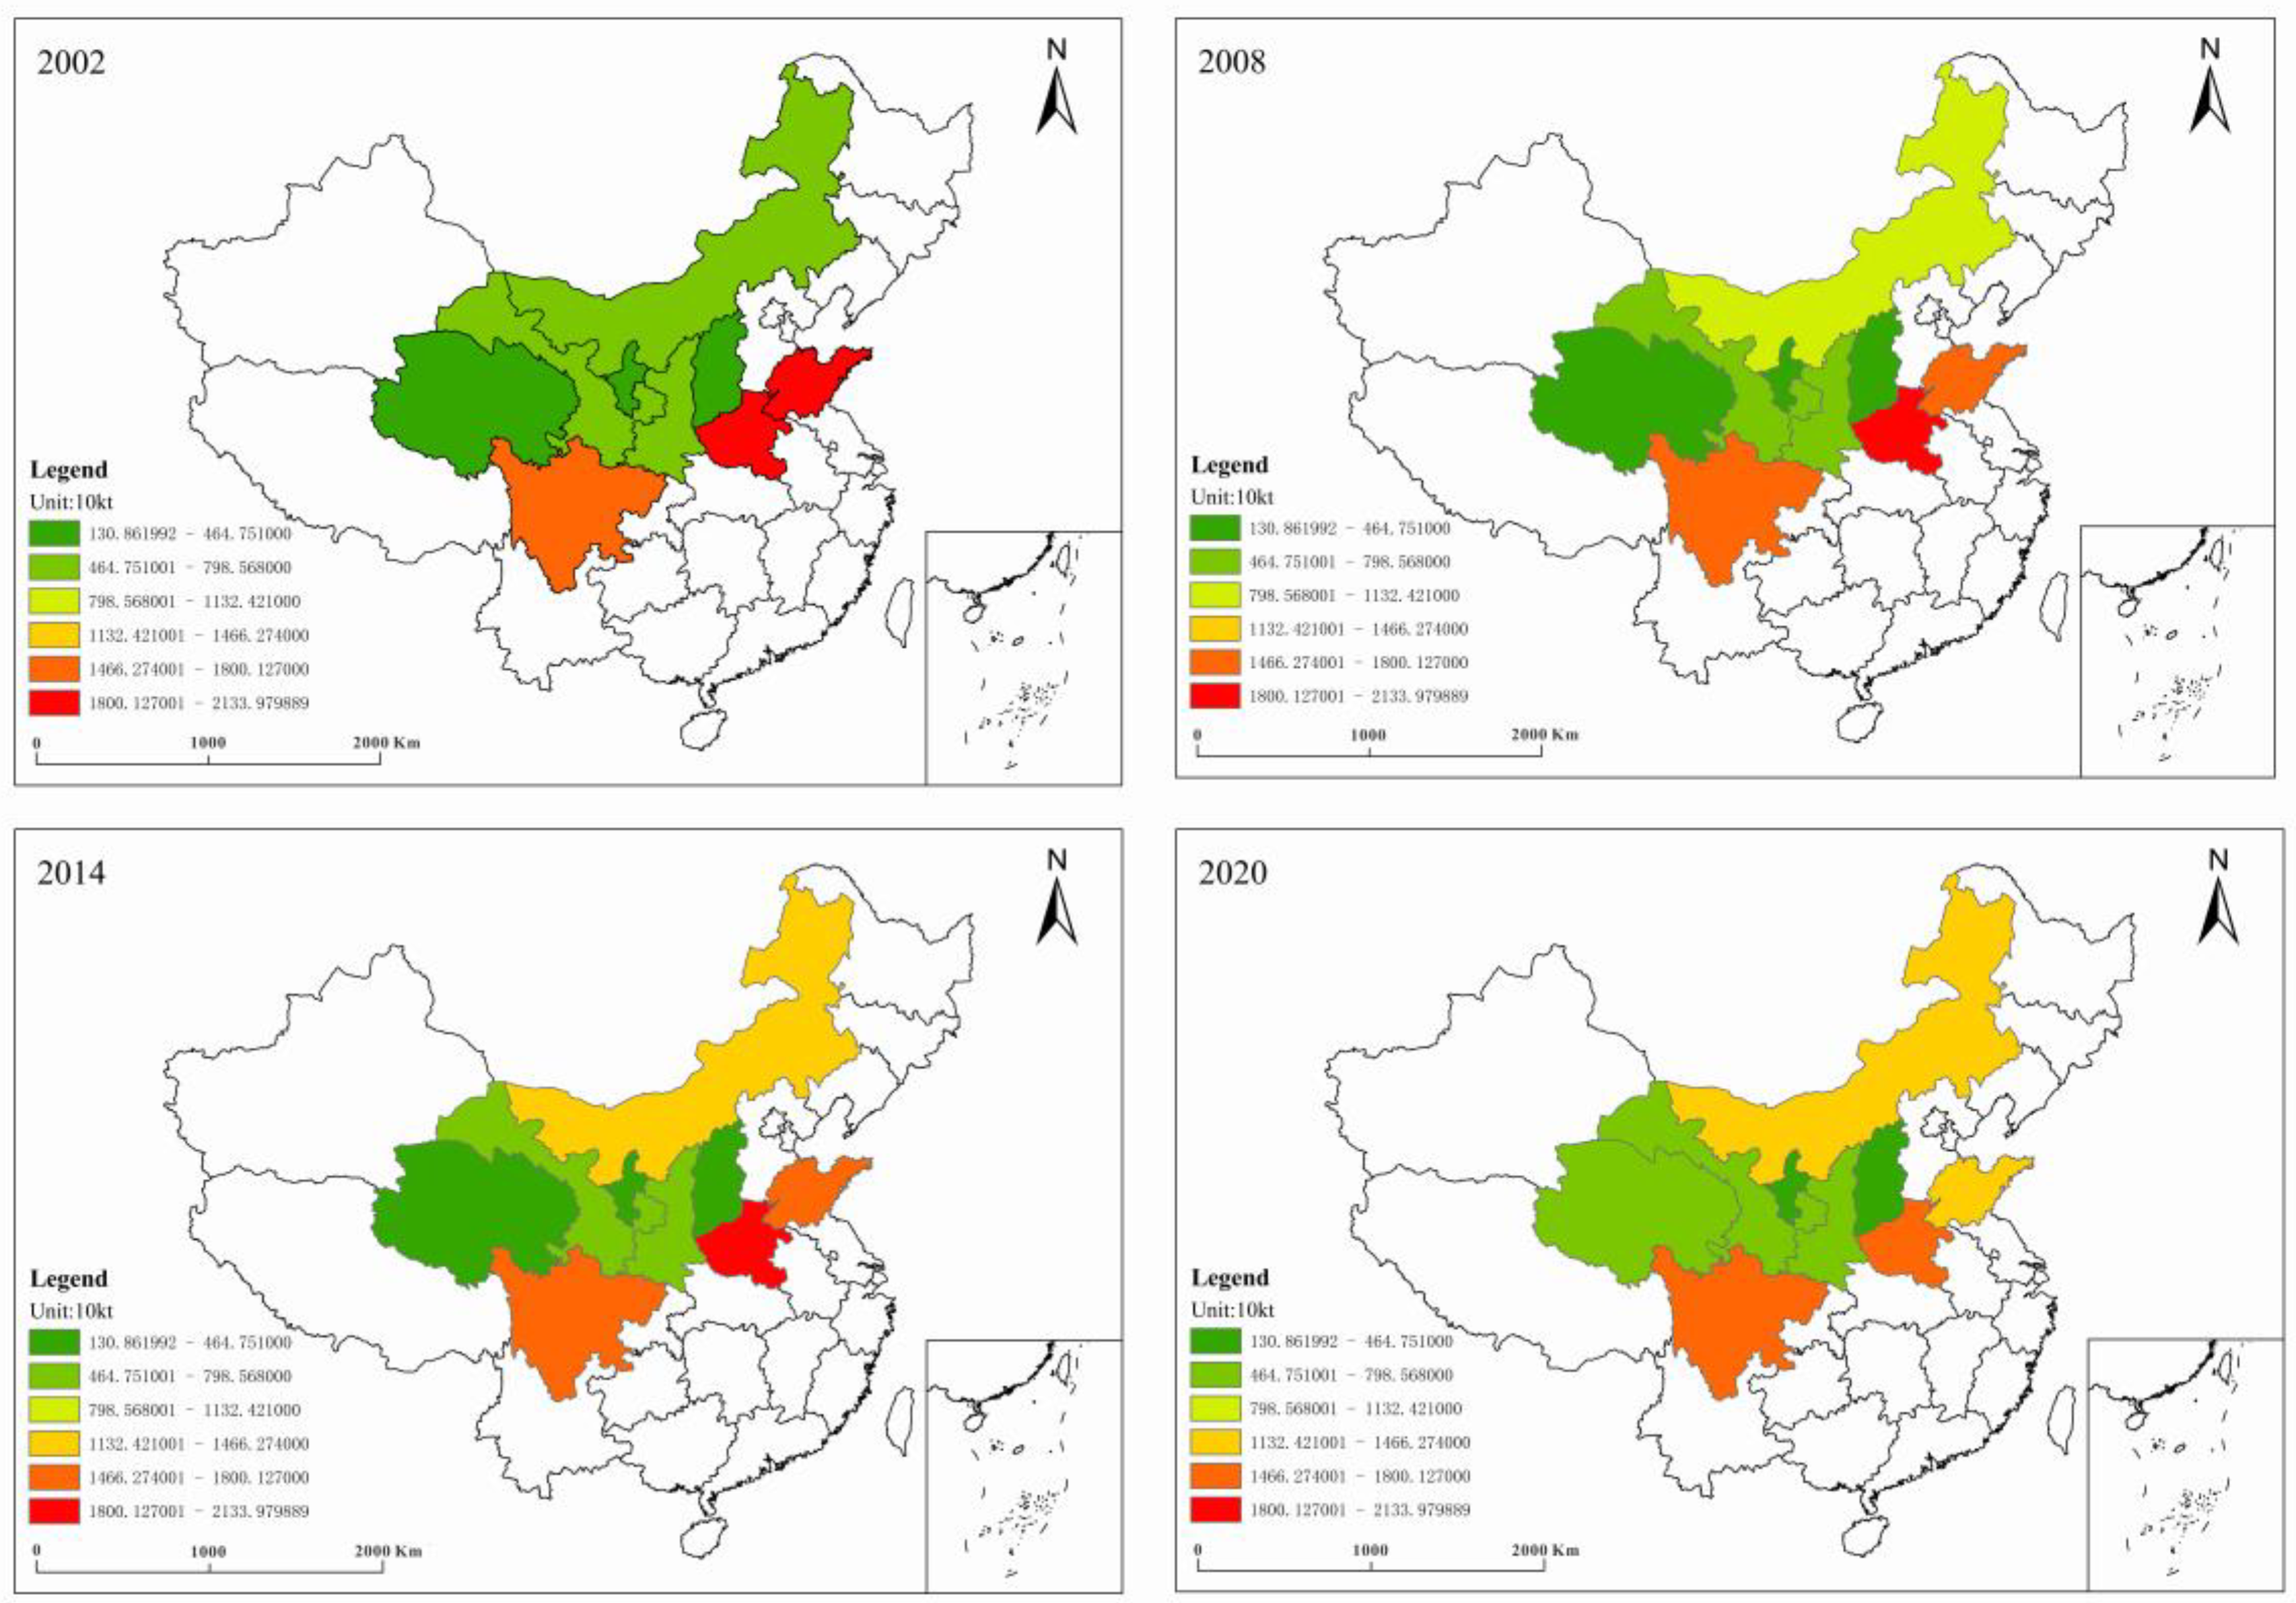
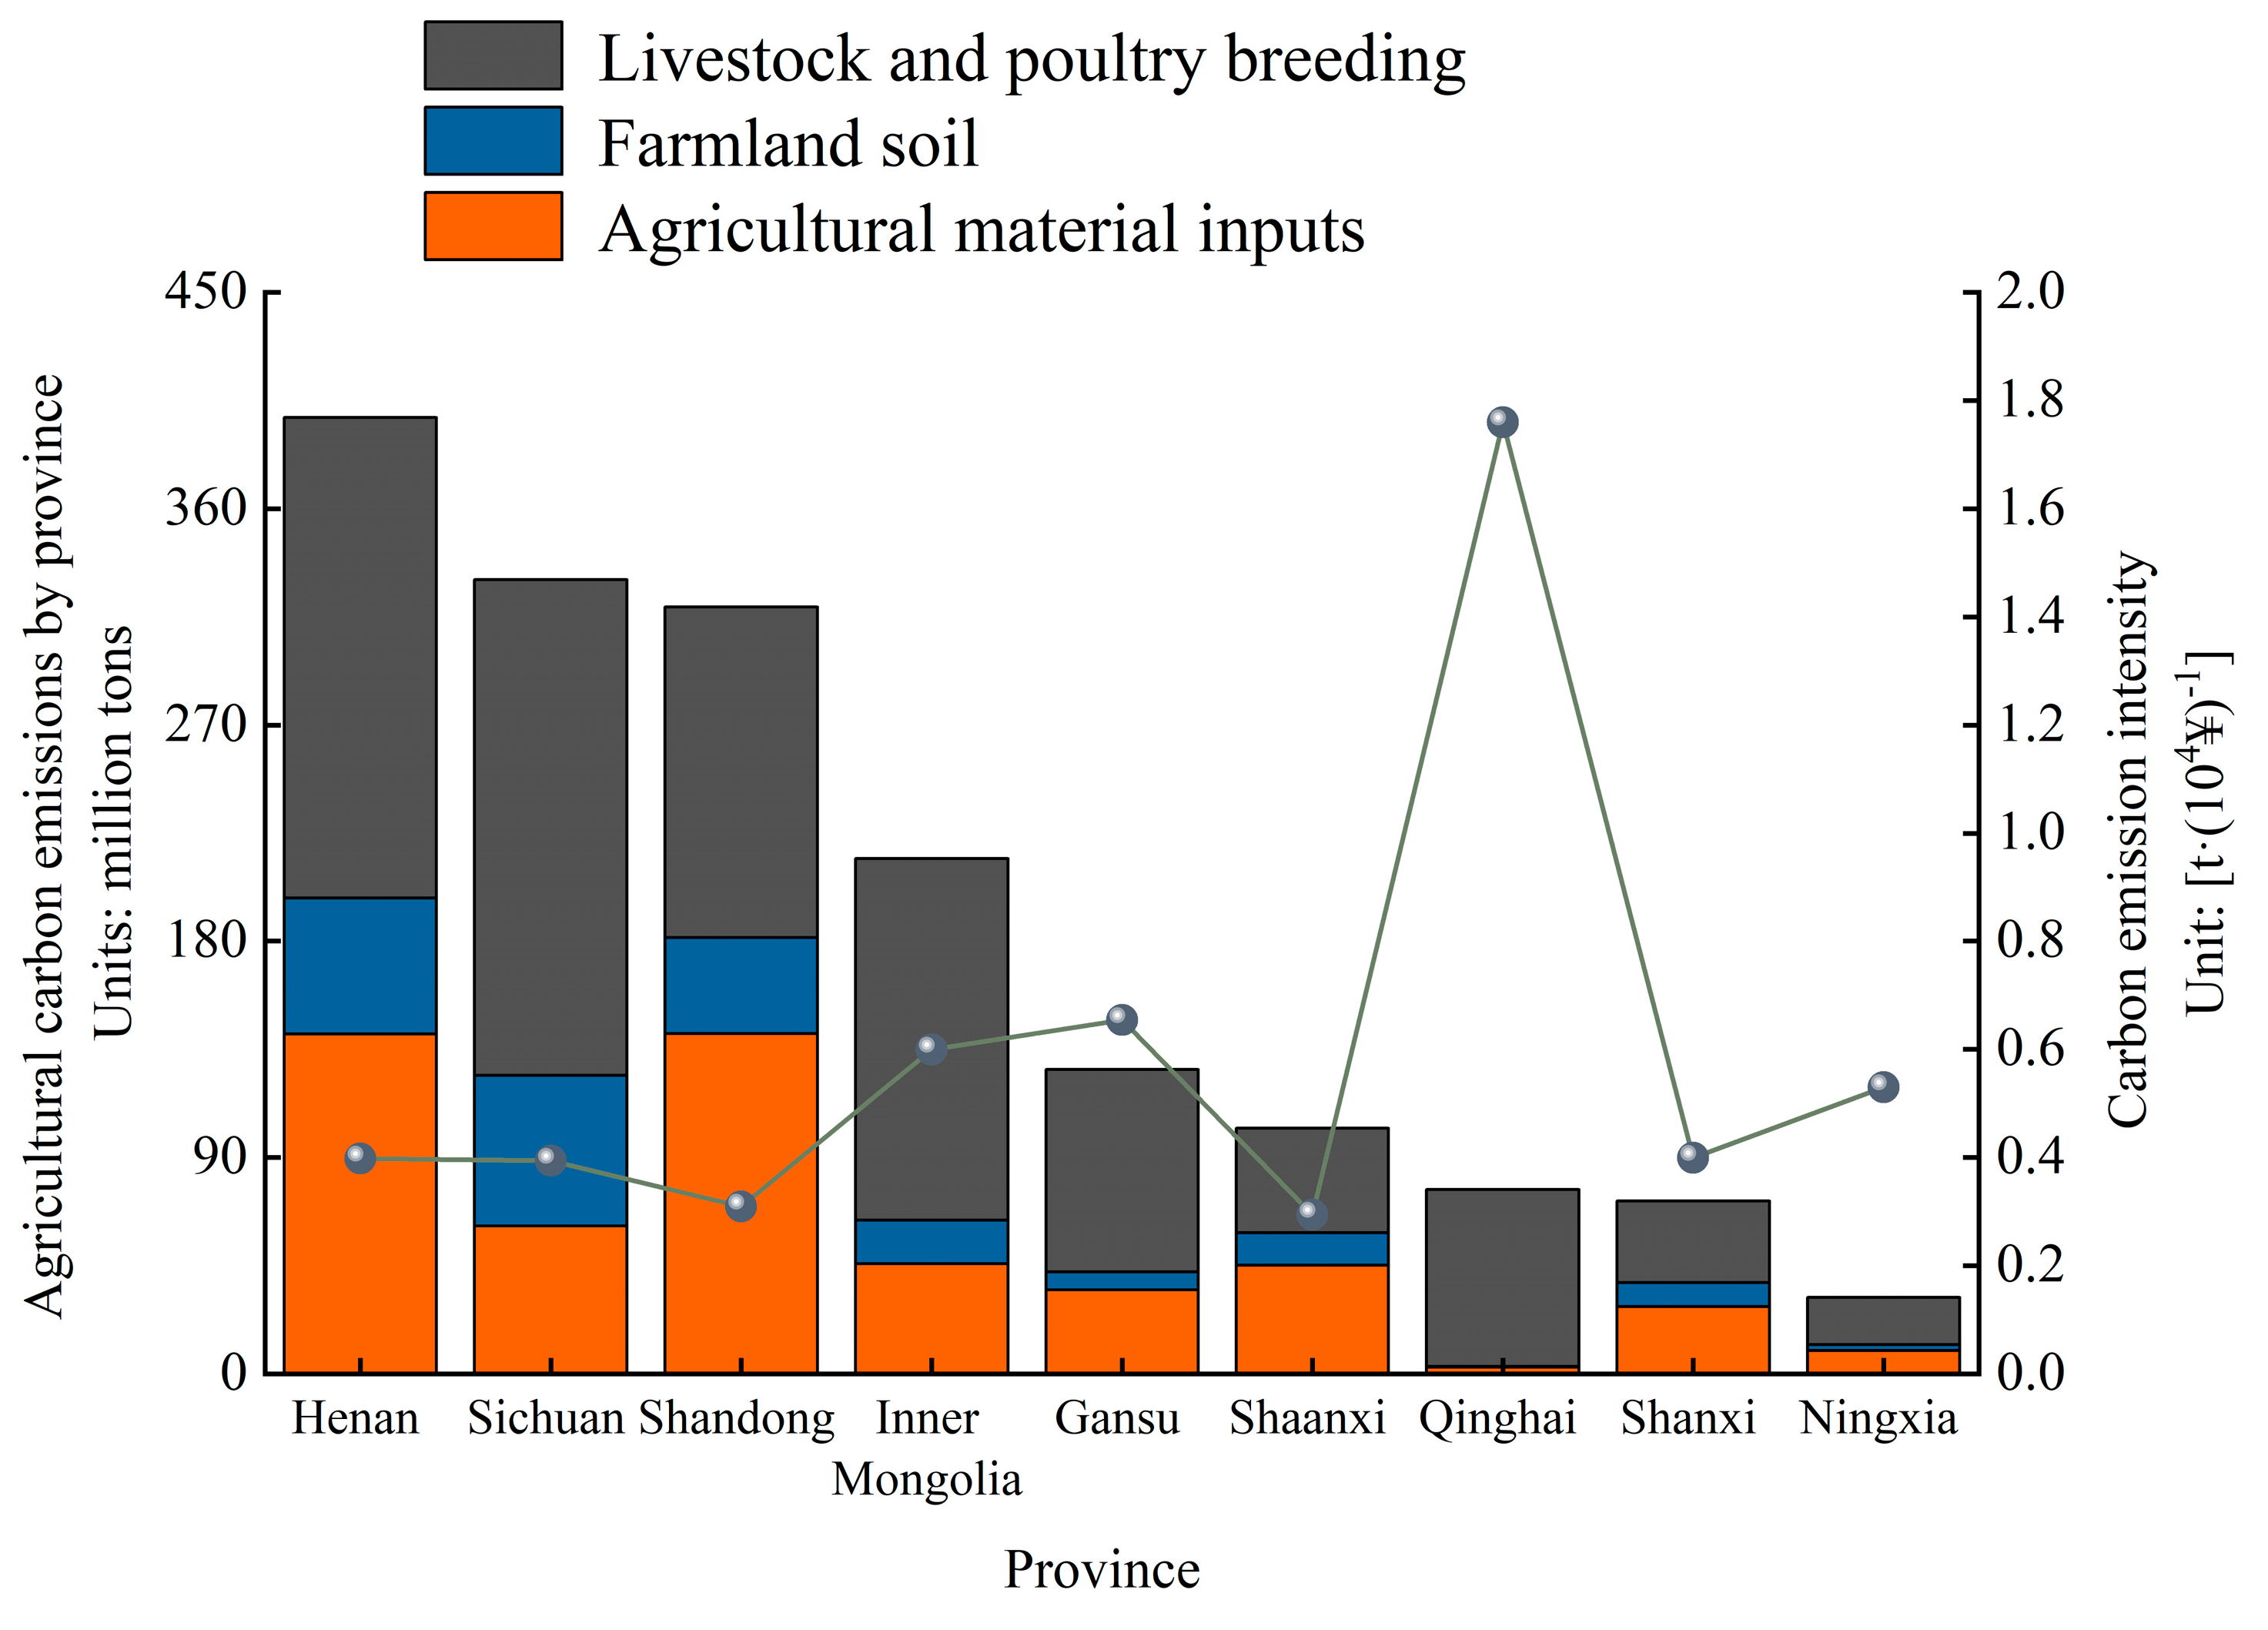
3.1.2. Regional Characteristics of Agricultural Carbon Emissions

The cumulative total agricultural carbon emissions in various provinces of the YRB urban agglomeration from 2002 to 2020 are shown in Table S10 and Figure 6. According to the results, Henan Province, Sichuan Province, and Shandong Province have accumulated over 30 million tons of carbon emissions, specifically 39.791 million tons, 33.046 million tons, and 31.903 million tons, respectively. The cumulative agricultural carbon emissions in Inner Mongolia Autonomous Region, Gansu Province, and Shaanxi Province range from 100 to 220 million tons. The cumulative agricultural carbon emissions in Qinghai Province, Shanxi Province, and Ningxia Hui Autonomous Region range from 30 to 80 million tons. Agricultural carbon emissions intensity is not influenced by the total resource base and can intuitively reflect the differences in the level of low-carbon agricultural development between regions. The carbon emission intensity in the urban agglomeration of the YRB from 2002 to 2020 ranged from 0.294 to 1.76 tons per ten thousand yuan (Table S9, Figure 7). Among them, Henan Province, Sichuan Province, Shandong Province, Shaanxi Province, and Shanxi Province were below 0.4 tons per ten thousand yuan. Inner Mongolia Autonomous Region and Ningxia Hui Autonomous Region were between 0.4 and 0.6 tons per ten thousand yuan. Gansu Province and Qinghai Province were above 0.6 tons per ten thousand yuan. The average carbon emissions intensity in the YRB urban agglomeration from 2002 to 2020 was 0.59 tons per ten thousand yuan. Inner Mongolia Autonomous Region, Gansu Province, and Qinghai Province had a higher carbon emissions intensity than the basin’s average level, while the other seven provinces had a lower intensity than the basin’s average level.
In general, provinces with large areas of grain crop cultivation and underdeveloped agricultural economies have a higher carbon emissions intensity. Provinces with a higher proportion of cash crop cultivation and relatively developed economies have a lower agricultural carbon emissions intensity. The average carbon emissions intensity in Qinghai Province is 1.76 tons per ten thousand yuan, which is 66.3% higher than the provincial average. With a relatively low proportion of agricultural carbon emissions, the high carbon emissions intensity in Qinghai Province indicates a significant disparity between input and output, as well as prominent issues of high pollution and unsustainable development.

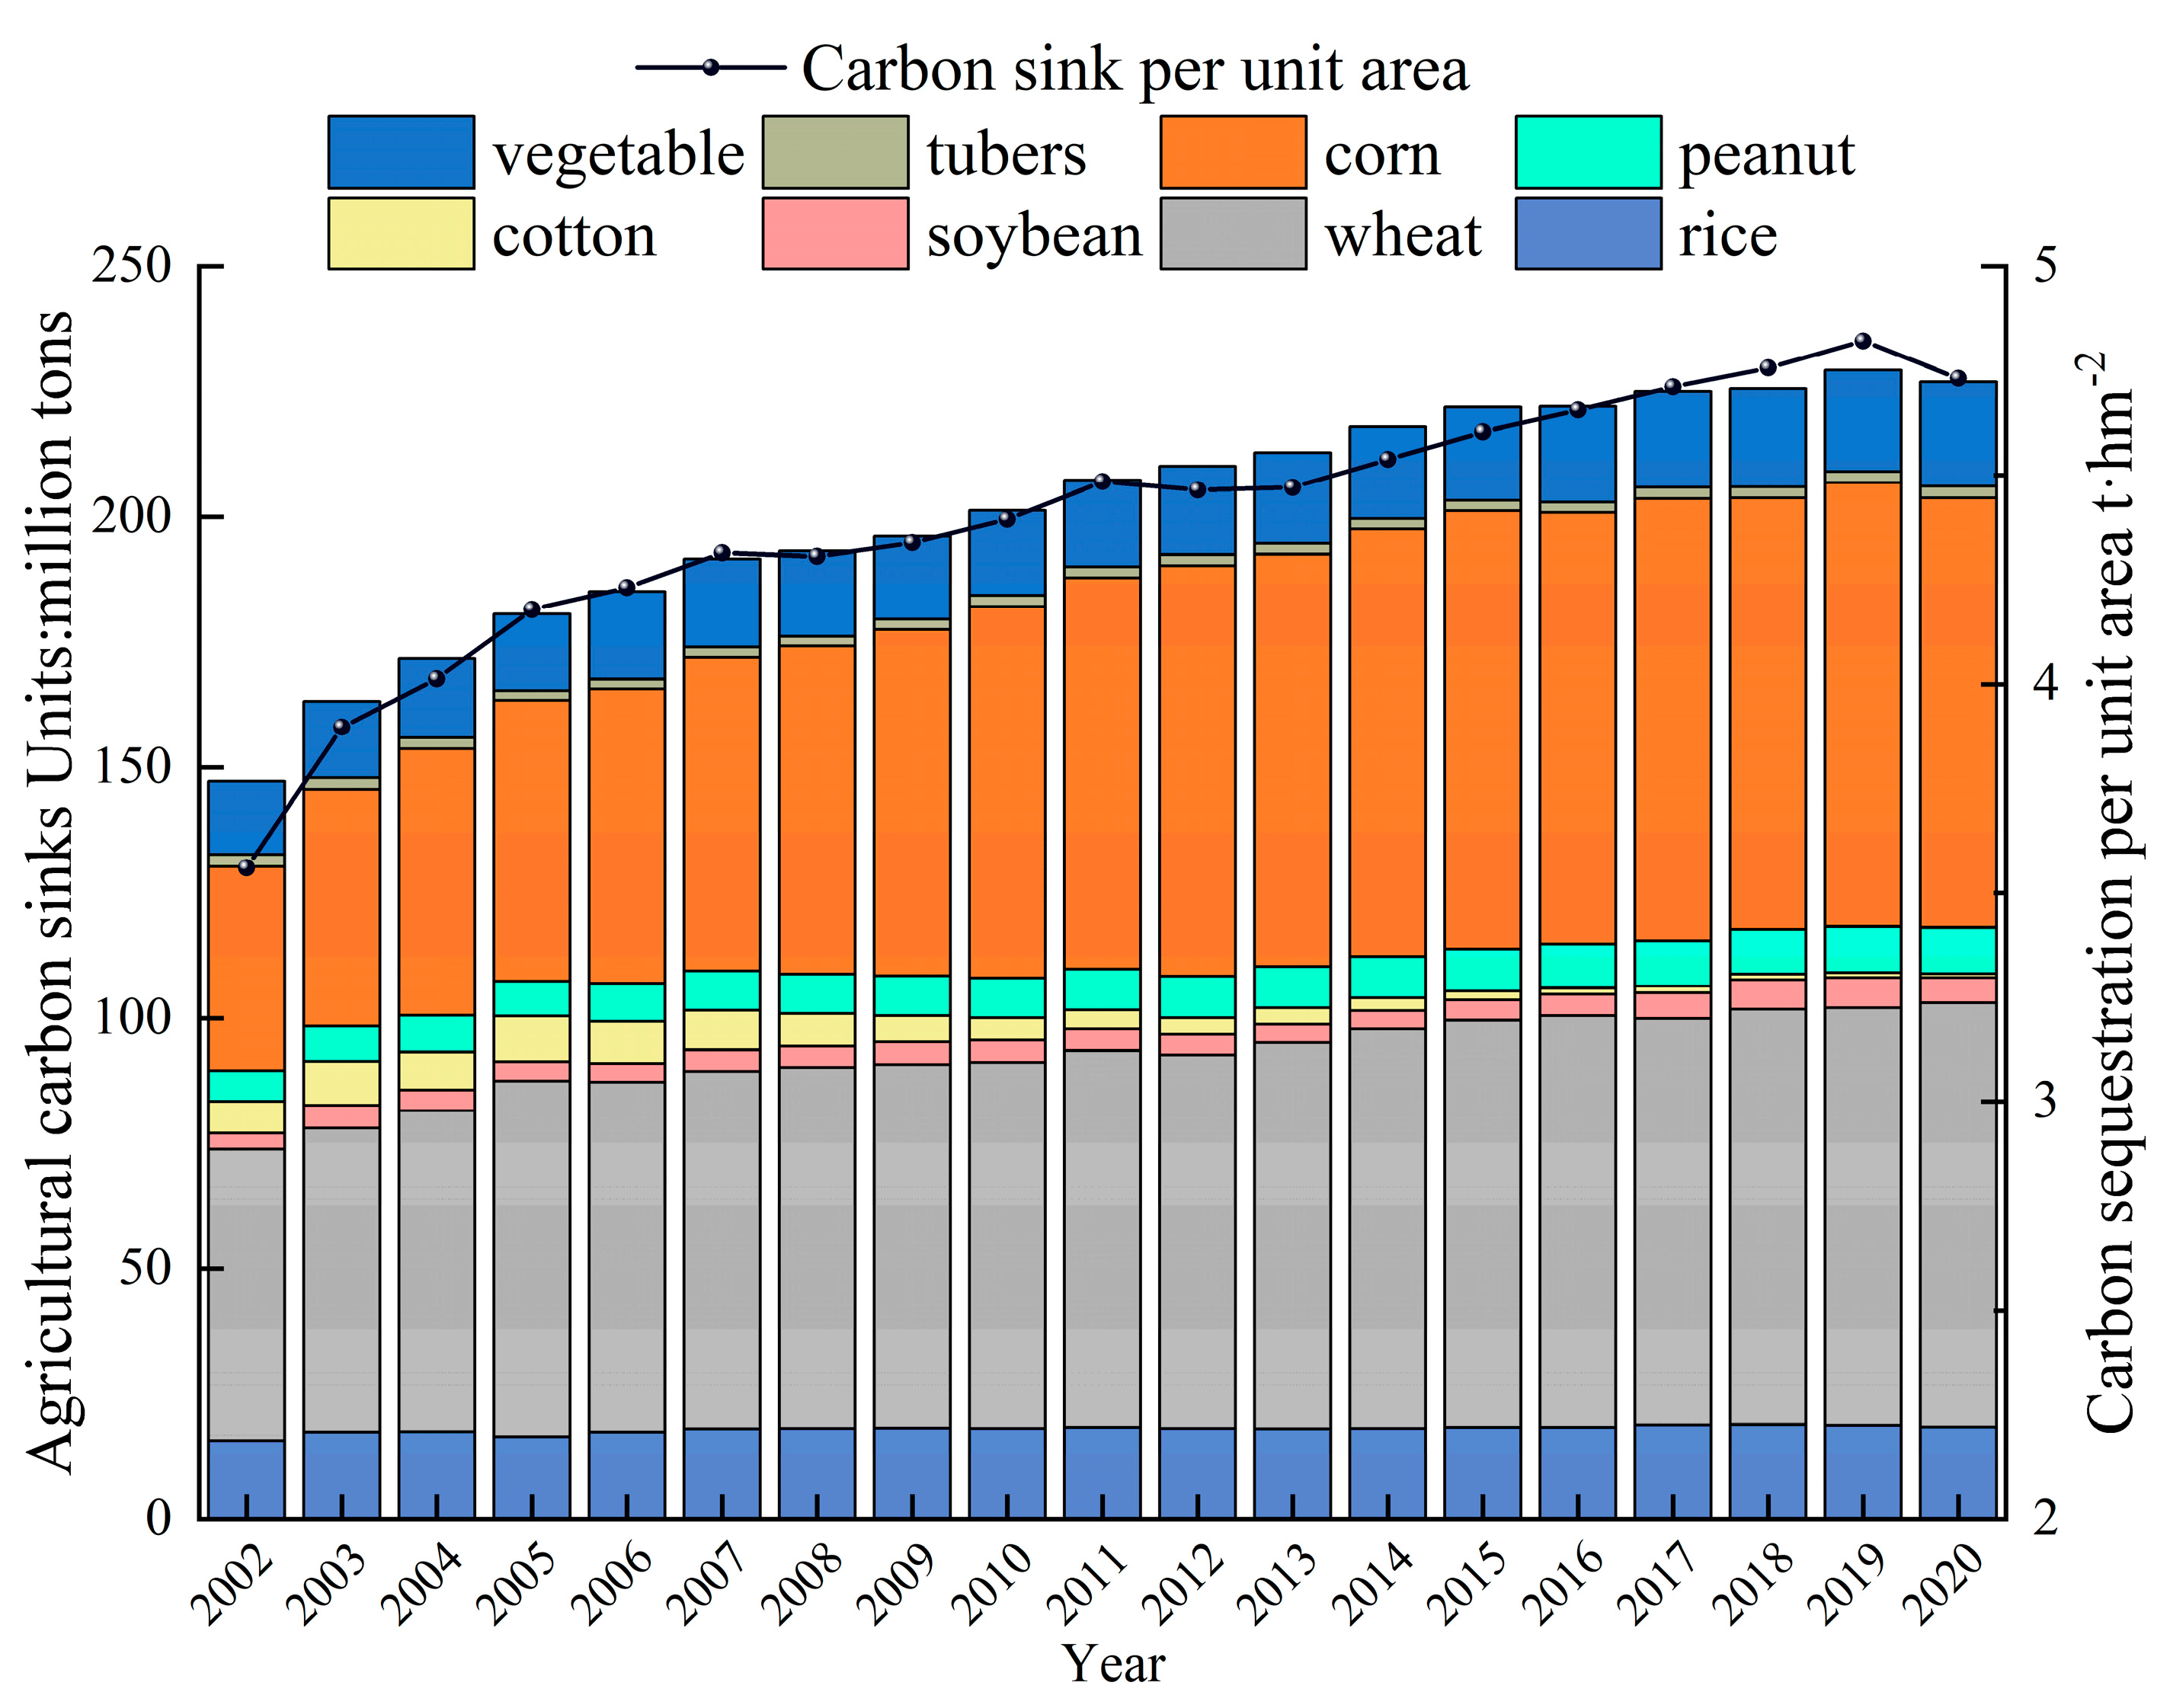
3.2. Temporal–Spatial Changes in Agricultural Carbon Sequestration

There were significant differences in carbon sequestration in the urban agglomeration of the YRB from 2002 to 2020 (Table S11, Figure 8). The high-carbon-sink areas in the southeast and southwest regions of the YRB, including Henan Province, Shandong Province, and Sichuan Province, accounted for 34.1%, 29.5%, and 14.3%, respectively, of the total carbon sequestration in the urban agglomeration of the YRB. The low-carbon-sink areas are mainly concentrated in the northwest region, including Qinghai Province, Inner Mongolia Autonomous Region, and Ningxia Hui Autonomous Region. During the period from 2002 to 2020, there was a significant increase in carbon sequestration in agriculture. Within this timeframe, the total agricultural carbon sink increased from 147.24 million tons to 226.92 million tons, with a growth rate of approximately 54.1%. The urban agglomeration of the YRB covers a vast area and has diverse climatic conditions, leading to variations in the predominant crops across different regions. In this study, crops accounting for more than 90% of the total were selected, and carbon sequestration was assessed for eight specific types of crop: rice, wheat, corn, soybean, cotton, peanuts, vegetables, and tubers. The results are shown in Figure 8. With the exception of cotton and potatoes, all carbon sequestration values for the selected crops increased. Corn and soybean showed the fastest growth, with average annual growth rates of 4.31% and 3.32%, respectively. In terms of carbon sequestration, wheat and corn are the main sources of agricultural carbon sequestration, accounting for 73% of the total carbon sequestration. Wheat and corn are the crops with the largest carbon sequestration in the urban agglomeration of the YRB, accounting for 37% and 36%, respectively. The carbon sequestration per unit has shown an increasing trend from 2002 to 2020, but slight decreases were observed in 2008, 2012, and 2020. However, the carbon emissions per unit area increased in 2008 and 2012, indicating a potentially higher level of agricultural inputs.
The carbon sink capacity of crops does vary in different regions (Table S12, Figure 9). In Qinghai Province, the cultivation of wheat (4.27 t/hm2) and corn (7.16 t/hm2) can better reduce carbon emissions; in Inner Mongolia, cotton (8.61 t/hm2) and rice (5.7 t/hm2) have higher crop carbon sink yields per unit of arable land, and the adjustment of the cultivation structure can help to increase the amount of carbon sinks. In Gansu Province, the carbon sink capacities of cotton (6.9 t/hm2), rice (5.58 t/hm2), and corn (5.61 t/hm2) are higher, while soybeans (1.9 t/hm2) and tubers (0.61 t/hm2) are lower. In the Ningxia region, corn (7.5 t/hm2) and rice (6.65 t/hm2) also have higher carbon sink yields, while tubers (0.47 t/hm2) and soybean (0.88 t/hm2) have lower carbon sink capacities. Sichuan Province has higher crop carbon sink yields per unit of arable land for rice (6.04 t/hm2) and corn (5.4 t/hm2). Shaanxi’s rice (5.47 t/hm2) has a high carbon sink capacity. In Henan province, rice (6.08 t/hm2), wheat (6.42 t/hm2), and corn (5.45 t/hm2) are the three crops with higher crop carbon sinks per unit of arable land, whereas tubers (0.02 t/hm2) and soybeans (1.94 t/hm2) have a lower capacity for carbon sinks. Shandong Province has a higher carbon sink for rice (6.62 t/hm2), wheat (6.37 t/hm2), and corn (6.58 t/hm2).
Based on these results, measures can be considered to adapt the carbon sink capacity of crops in different regions. For crops with a higher carbon sink capacity, their planting area can be appropriately increased to enhance carbon sequestration and reduce carbon emissions. On the other hand, for crops with a lower carbon sink capacity, reducing their planting area can help decrease their contribution to carbon emissions. Such adjustments would contribute to improving the carbon sink capacity of crops and effectively reducing carbon emissions. Additionally, corresponding technological and management measures should be taken into account to enhance crop productivity and carbon sink capacity, thereby achieving sustainable agricultural development.
There are significant regional differences in carbon sequestration in the urban agglomeration of the YRB from 2002 to 2020 (Figure 10). High-carbon-sink areas are mainly distributed in the southeastern region of the YRB, including Henan Province, Shandong Province, and Sichuan Province, accounting for 34.1%, 29.5%, and 14.3% of the total carbon sequestration in the urban agglomeration of the YRB, respectively. In contrast, low-carbon-sink areas are primarily concentrated in the northwestern region of the YRB, such as Qinghai Province, Inner Mongolia Autonomous Region, and Ningxia Hui Autonomous Region, which have a lower carbon sequestration capacity. To enhance the carbon sequestration capacity in low-carbon-sink areas, the following measures can be implemented. Firstly, it is important to encourage the cultivation of crops with a high carbon sink capacity, such as trees and other vegetation. These crops have stronger carbon absorption and storage capabilities. Secondly, the cultivation area of low-carbon-sink crops can be appropriately reduced to avoid excessive land utilization. Additionally, promoting agroforestry systems can be beneficial by combining the cultivation of crops with trees to enhance carbon sequestration effectiveness. At the same time, in high-carbon-sink areas, further encouragement and support can be provided for carbon fixation measures in agricultural production, such as increasing soil organic matter and protecting aquatic wetlands. These measures contribute to increasing carbon sequestration and reducing carbon emissions. By implementing these measures, a balance of carbon sequestration can be achieved among different regions in the urban agglomeration of the YRB, thus enhancing the overall carbon sink capacity and making contributions to climate change mitigation and sustainable development.

3.3. Analysis of Agricultural Carbon Emissions Factors in the YRB

We decomposed the change in carbon emissions from agriculture and livestock into the contribution of the changes in agricultural production efficiency, agrarian structure, regional industry structure, regional economic development level, urbanization rate, and rural population. The size of their carbon emissions reduction contribution is in the order of agricultural production efficiency > agricultural labor force > regional industry structure > agrarian structure, and the growth of regional economic development level and urbanization rate indirectly promotes the increase in agricultural carbon emissions.
The agricultural economic level in the urban agglomeration of the YRB had a positive impact on agricultural carbon emissions from 2002 to 2020 (Table 2, Figure 11), resulting in an accumulated increase of 188.061 million tons of carbon emissions. The average annual carbon emissions amounted to 10.448 million tons, serving as the main driving factor behind carbon emissions in the urban agglomeration of the YRB. Agricultural productivity efficiency is the primary inhibiting factor, with a cumulative reduction of 145.297 million tons of carbon compared to the base period. The contribution of agricultural carbon reduction to the YRB urban agglomeration accounts for 58.59%, with an average annual carbon reduction of 8.07 million tons. The agricultural industry structure has the least inhibiting effect on agricultural carbon emissions in the YRB urban agglomeration, with a cumulative reduction of 4.06 million tons of carbon compared to the base period. The contribution of agricultural industry structure to agricultural carbon reduction in the YRB urban agglomeration is 1.64%, with an average annual carbon reduction of 0.226 million tons. Overall, the agricultural industry structure has played a certain inhibiting role, but its inhibiting effect fluctuates greatly annually. The overall trend has gradually stabilized after 2018, possibly due to the deep implementation of the spirit of the 19th National Congress, vigorous implementation of the rural revitalization strategy, and accelerated agricultural transformation and upgrading. This was mainly achieved by promoting structural reforms on the supply side of agriculture, fostering the integrated development of the “production, processing, and technology” sectors in agriculture. As a result, an indirect reduction in agricultural carbon emissions was accomplished. The agricultural labor force is the second major inhibiting factor that suppresses agricultural carbon emissions in the YRB urban agglomeration. Compared to the base period, YRB has achieved a cumulative carbon reduction of 2.982 million tons. The contribution of agricultural labor factors to agricultural carbon reduction in the YRB urban agglomeration accounts for 21.2%, with an average annual carbon reduction of 2.92 million tons. Before 2005, cumulative carbon emissions contributed to 0.436 million tons. From 2005 onwards, carbon reduction in agricultural labor began. The main reason for this can be attributed to the issuance of the “Central Document No.1” in 2005, which introduced policies such as “encouraging less harvesting and more restraints” and increased “two reductions and three subsidies”, including the reduction or exemption of agricultural taxes. These policies further mobilized the enthusiasm of farmers and cultivated a large number of highly skilled farmers. The farmers became leaders in the adoption of new technologies and equipment, which subsequently reduced the use of traditional agricultural production resources and promoted the development of agricultural carbon reduction.

3.4. Decoupling Analysis of Carbon Emissions and Economic Growth

The level of agricultural economic development is one of the important influencing factors of carbon emissions in the YRB urban agglomeration. Further analysis of the decoupling relationship between carbon emissions and economic growth can assess whether economic growth is achieved at the expense of excessive carbon dioxide emissions [60]. From 2002 to 2016, the agricultural economy in the YRB urban agglomeration maintained continuous growth. The decoupling relationship between carbon emissions and economic growth can be characterized as weak decoupling and strong decoupling (Figure 12). This is attributed to the intensified implementation of sustainable development during the 12th Five-Year Plan in China, with proactive efforts in energy conservation and emission reduction across different regions. As a result, the YRB urban agglomeration achieved certain emission reduction outcomes. From 2016 to 2017, the economy of the YRB urban agglomeration experienced a decline, and the decoupling relationship exhibited a declining decoupling. Simultaneously, carbon emissions showed a downward trend during the same period. The declining decoupling indicates that carbon emissions tended to decrease along with the economic downturn. After 2018, the region exhibited a decoupling relationship that fluctuated between strong decoupling and weak decoupling. The relationship between the agricultural economy level and carbon emissions in the YRB urban agglomeration shows different patterns during different periods. This reflects the adjustment of the region’s economic growth mode and the improvement of environmental awareness. However, further measures are still needed to achieve genuine decoupling between economic growth and carbon emissions.

4. Discussion

4.1. The Spatio-Temporal Patterns of Agricultural Carbon Emissions in the YRB

During the research period, the livestock industry was identified as the primary source of carbon emissions in agriculture, which is consistent with the findings of Huang [61]. The urban agglomeration in the Yellow River basin has exhibited a trend of initially increasing and then decreasing, resembling an ‘M’ shape. The first phase of growth occurred from 2002 to 2006. The introduction of the No. 1 Central Document in 2004 [62] and the implementation of the “Two Reductions and Three Subsidies” policy in China [3] significantly boosted the motivation of farmers, leading to a revival in the agricultural sector. These policies stimulated the production of key agricultural crops such as wheat, corn, cotton, and peanuts in the Yellow River basin, which is an important agricultural production base for the country. As a result, there was a substantial increase in the scale of agricultural land carbon emissions. The first decline phase occurred from 2006 to 2007, consistent with the emission trend in the livestock industry. At that time, the State Council of China issued the “Opinions of the State Council on Promoting the Sustainable and Healthy Development of Animal Husbandry” in 2007, which explicitly outlined the main goal of promoting the healthy development of animal husbandry through the construction of modern animal husbandry. The second phase of growth occurred from 2007 to 2015, during which China was undergoing a dual transition phase, maintaining a steady and rapid economic development momentum, leading to rapid regional economic growth. This resulted in an overall expansion of the population and increased frequency of economic activities, thereby causing a continuous increase in agricultural carbon emissions. The second significant decline phase took place from 2015 to 2019, indicating that under the guidance of national environmental protection and green development policies, the agricultural production in the urban agglomeration of the Yellow River basin gradually transitioned towards low-carbon agriculture, achieving initial success.
Provinces in the YRB with large areas of grain crop cultivation and relatively underdeveloped agricultural economies exhibit higher carbon emission intensity, while regions with a higher proportion of economic crop cultivation and relatively developed economies show lower agricultural carbon emission intensity. Additionally, there is an increasing trend of carbon-emission-intensity disparity among different regions, highlighting the gradually emerging levels of sustainable agricultural development.

4.2. The Regional Differences in Agricultural Carbon Sinks in the YRB

From 2002 to 2020, there were evident disparities in the carbon sink within the urban agglomeration of the YRB. The southeastern and southwestern regions of the YRB were identified as high-carbon-sink areas, while the northwestern region was predominantly characterized as a low-carbon-sink area. Throughout the research period, the agricultural carbon sink demonstrated a notable upward trend. Wheat and corn emerged as the primary sources of the agricultural carbon sink, contributing 73% to the total sink.
The carbon sequestration capacity of the same crops varies across different regions of the YRB. For example, in Qinghai Province, the cultivation of wheat and corn demonstrates a relatively effective reduction in carbon emissions. Conversely, in the Inner Mongolia region, cotton and rice exhibit a higher carbon sink yield per unit cultivated land, leading to a more substantial reduction in carbon emissions. Based on these results, considerations can be made to adapt to the carbon sink capacity of different crops in distinct regions. For crops with a higher carbon sink capacity, increasing their planting area appropriately can elevate the carbon sink and reduce carbon emissions. Conversely, for crops with lower carbon sequestration capacity, reducing their planting area can mitigate their contribution to carbon emissions. This adjustment is expected to enhance the carbon sink capacity of crops, leading to a more effective reduction in carbon emissions.

4.3. Advantages and Limitations of This Study and Future Research Directions

Compared with previous studies, the research vision of this study is further expanded. We integrate the logarithmic mean Divisia index (LMDI) decomposition and Tapio decoupling model to conduct an in-depth investigation of the drivers of these emissions. This paper combines agricultural carbon emissions and carbon sinks, considering agricultural inputs, livestock farming, rice cultivation, and farmland soil as four dimensions to assess the carbon sequestration capacity of crops in different regions.
However, there are also some limitations in this study. Factors such as population growth, the industrialization rate, and other influencing factors also have an impact on the carbon sequestration of food production. However, the existing methods for measuring carbon emissions and carbon sequestration of food crops mainly consider the internal factors related to the growth of food crops and do not consider the external factors such as population and industrialization rate. In future research we will conduct a more comprehensive study on the reasons for the significant differences in carbon sequestration among crops, and analyze in more detail the influencing factors of the carbon sequestration capacity of different crops in different regions. This will enhance the accuracy and comprehensiveness of our analysis and provide strong evidence for the development of more precise emission reduction measures.

5. Conclusions and Policy Implications

5.1. Conclusions

This study measures and analyzes carbon emissions and carbon sequestration in agriculture and livestock within the YRB urban agglomeration from 2002 to 2020. The study further employs the LMDI model and the Tapio decoupling model to analyze the drivers and economic relationships of carbon emissions from agriculture and livestock, while exploring the underlying causes and suggesting policy implications. Based on the analysis, the following fundamental conclusions can be drawn:
(1)
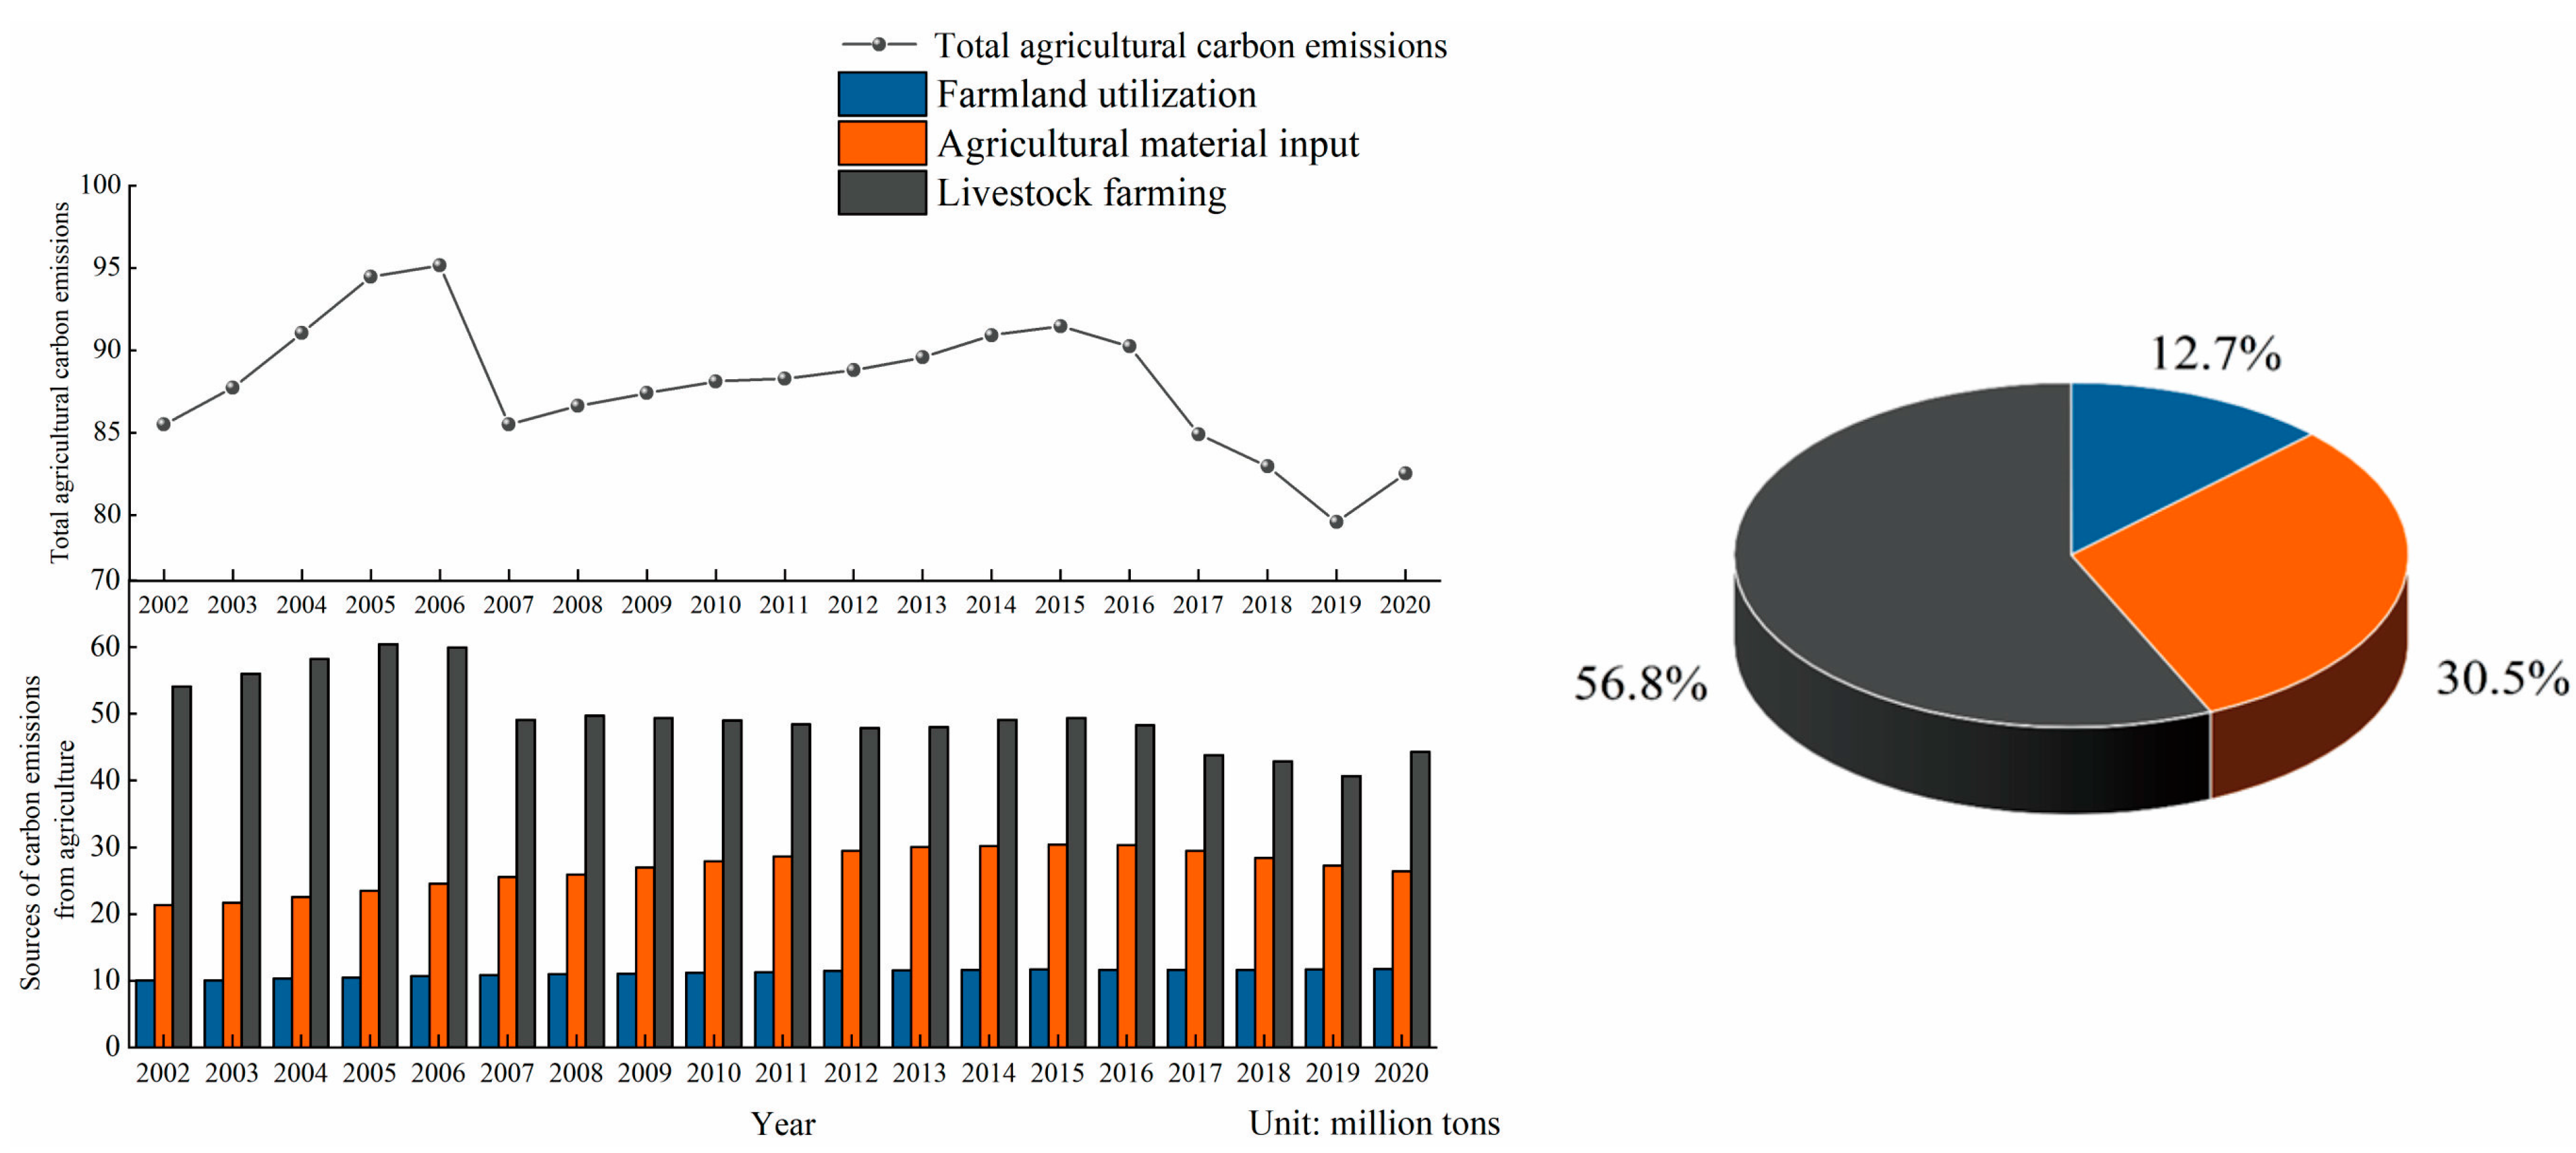
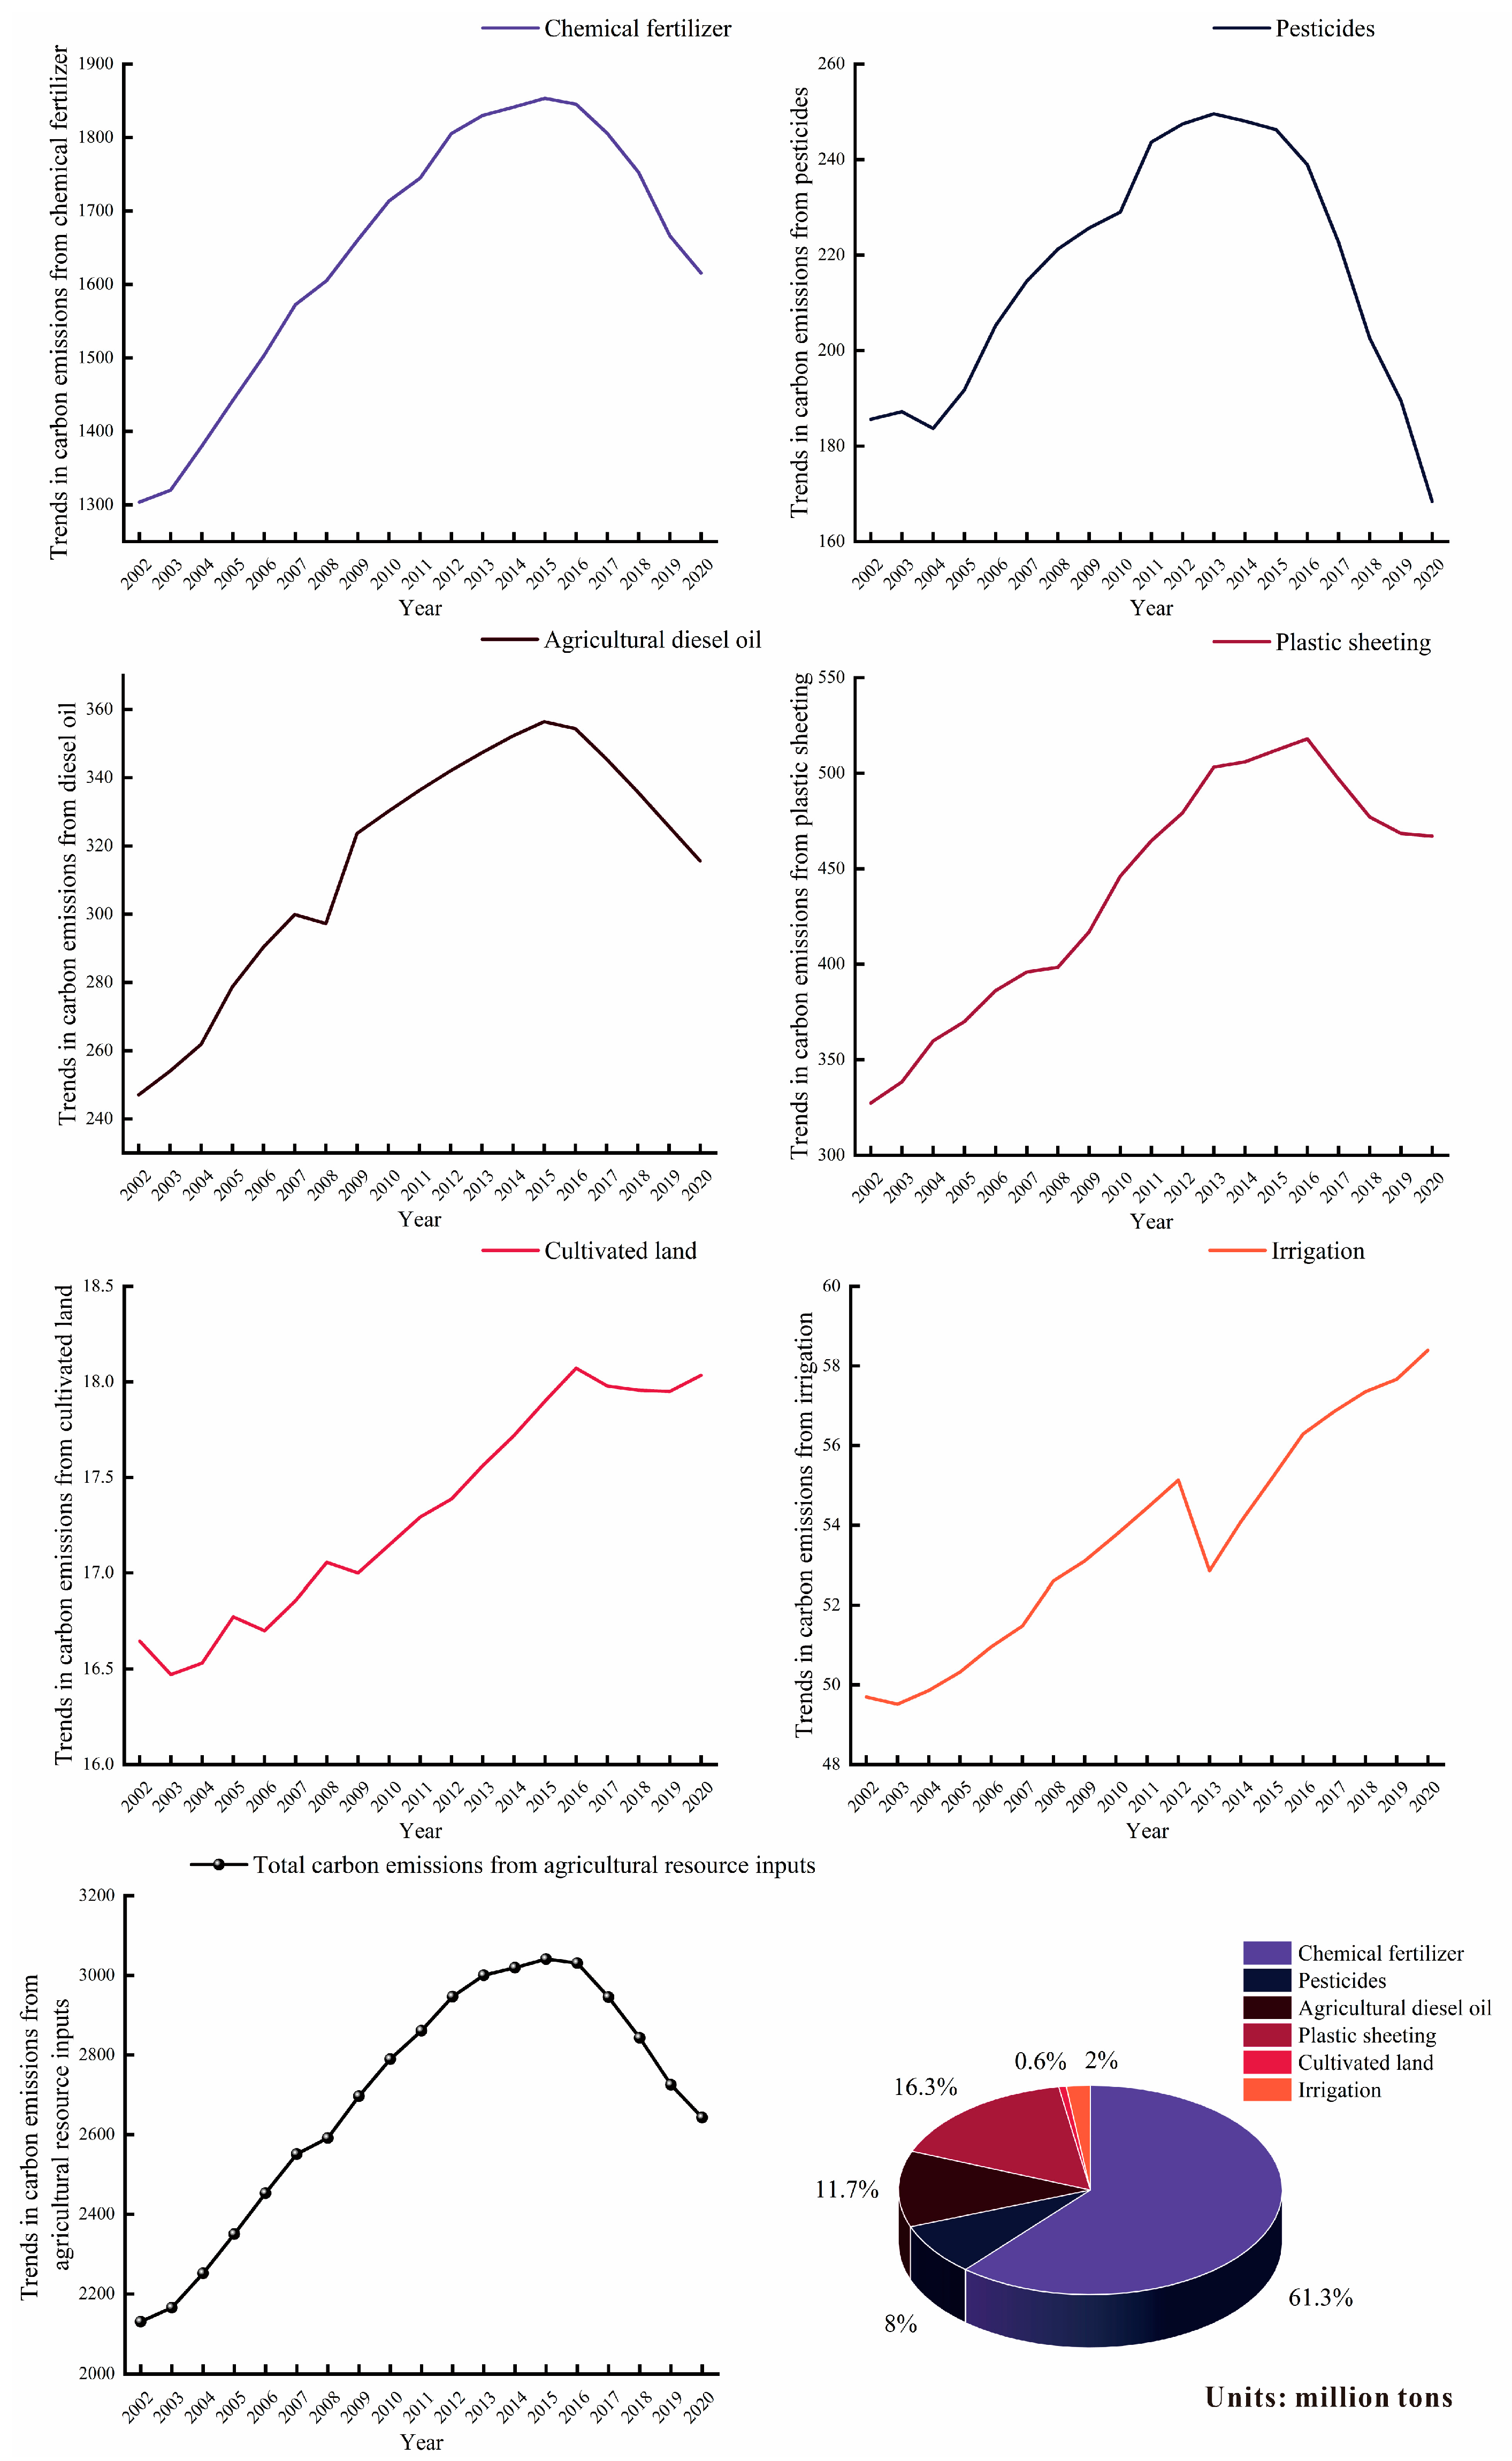
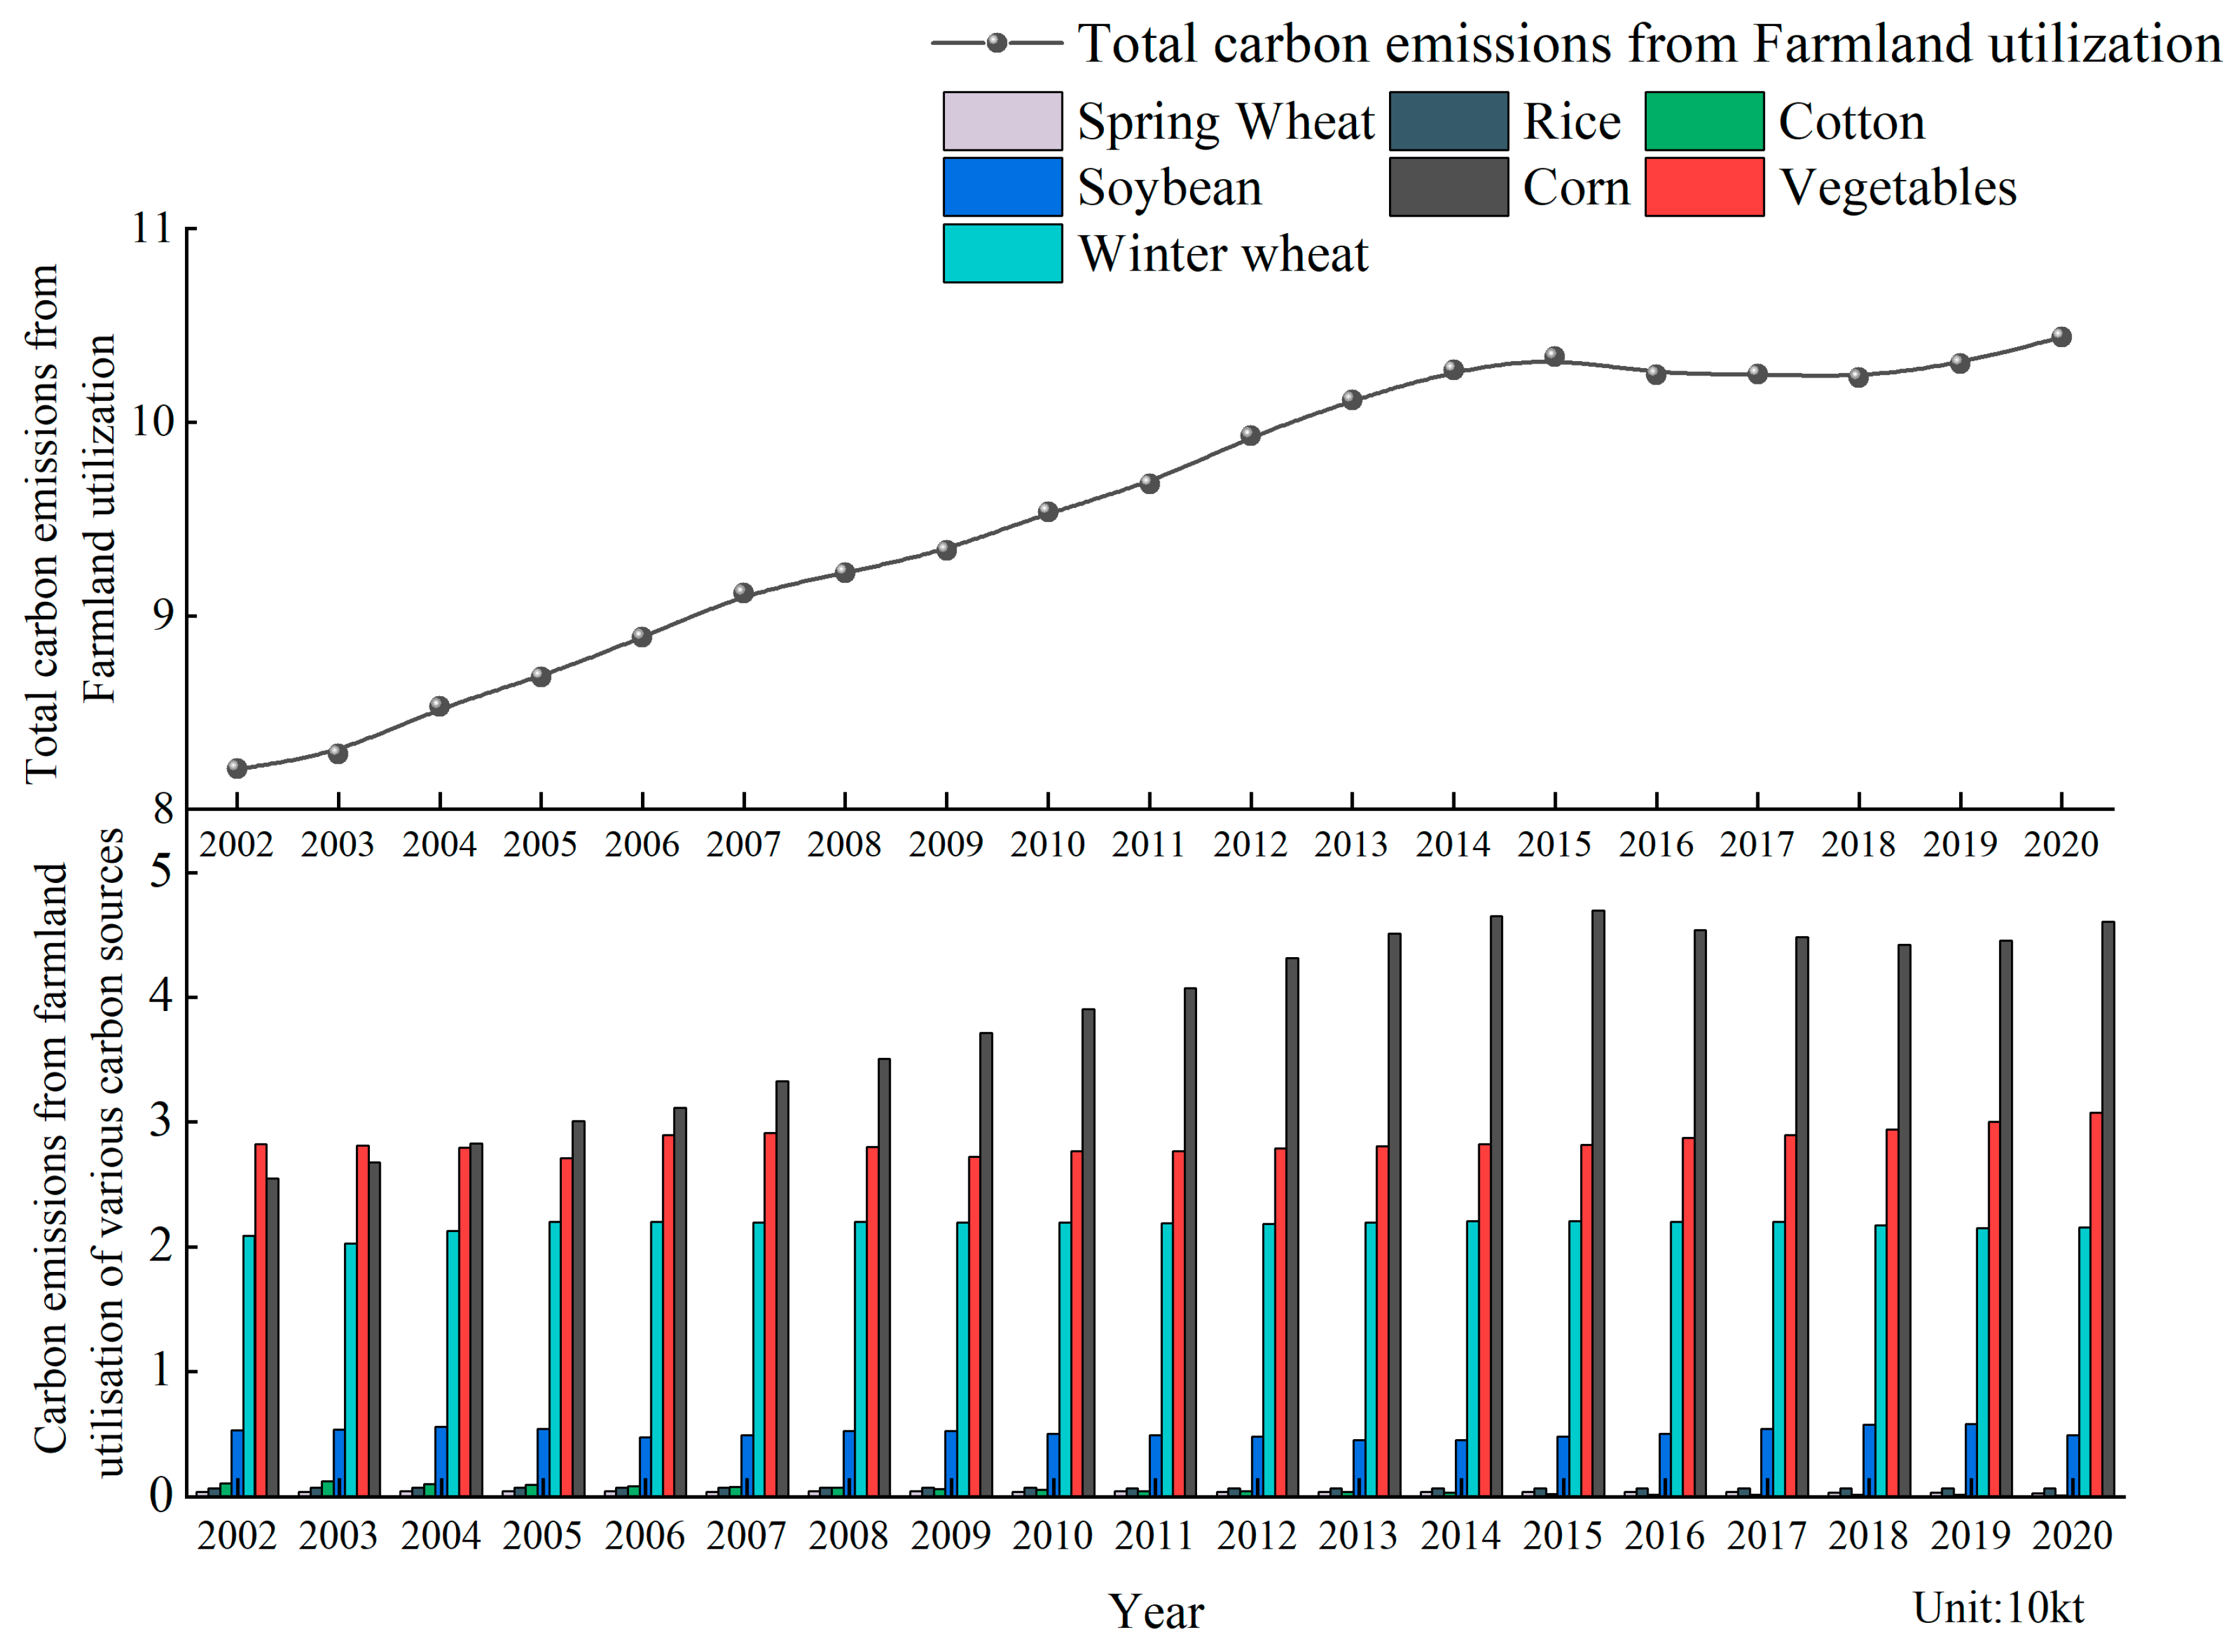
The order of their contribution to agricultural carbon emissions in the YRB urban agglomeration is livestock farming > agricultural material input > farmland utilization. Livestock farming is the major source of carbon emissions from agriculture but its emissions tend to be declining. Agricultural material input and emissions from farmland utilization show an increasing trend. In general, total agricultural carbon emissions showed a negative trend, with an overall decrease of 2.982 million tons. Fertilizer has the highest share of carbon emissions among agricultural material input at 61.25%. Sichuan Province is the main province for carbon emissions during the rice growing cycle, reaching a peak of 2.42 million tons in 2005. In addition, there is a noticeable spatial imbalance in the intensity of agricultural carbon emissions across different regions. Provinces with a larger area dedicated to grain crop cultivation and relatively underdeveloped economies exhibit a higher carbon emission intensity, while regions with a larger area dedicated to cash crop cultivation and relatively developed economies show a lower carbon emission intensity.
(2)
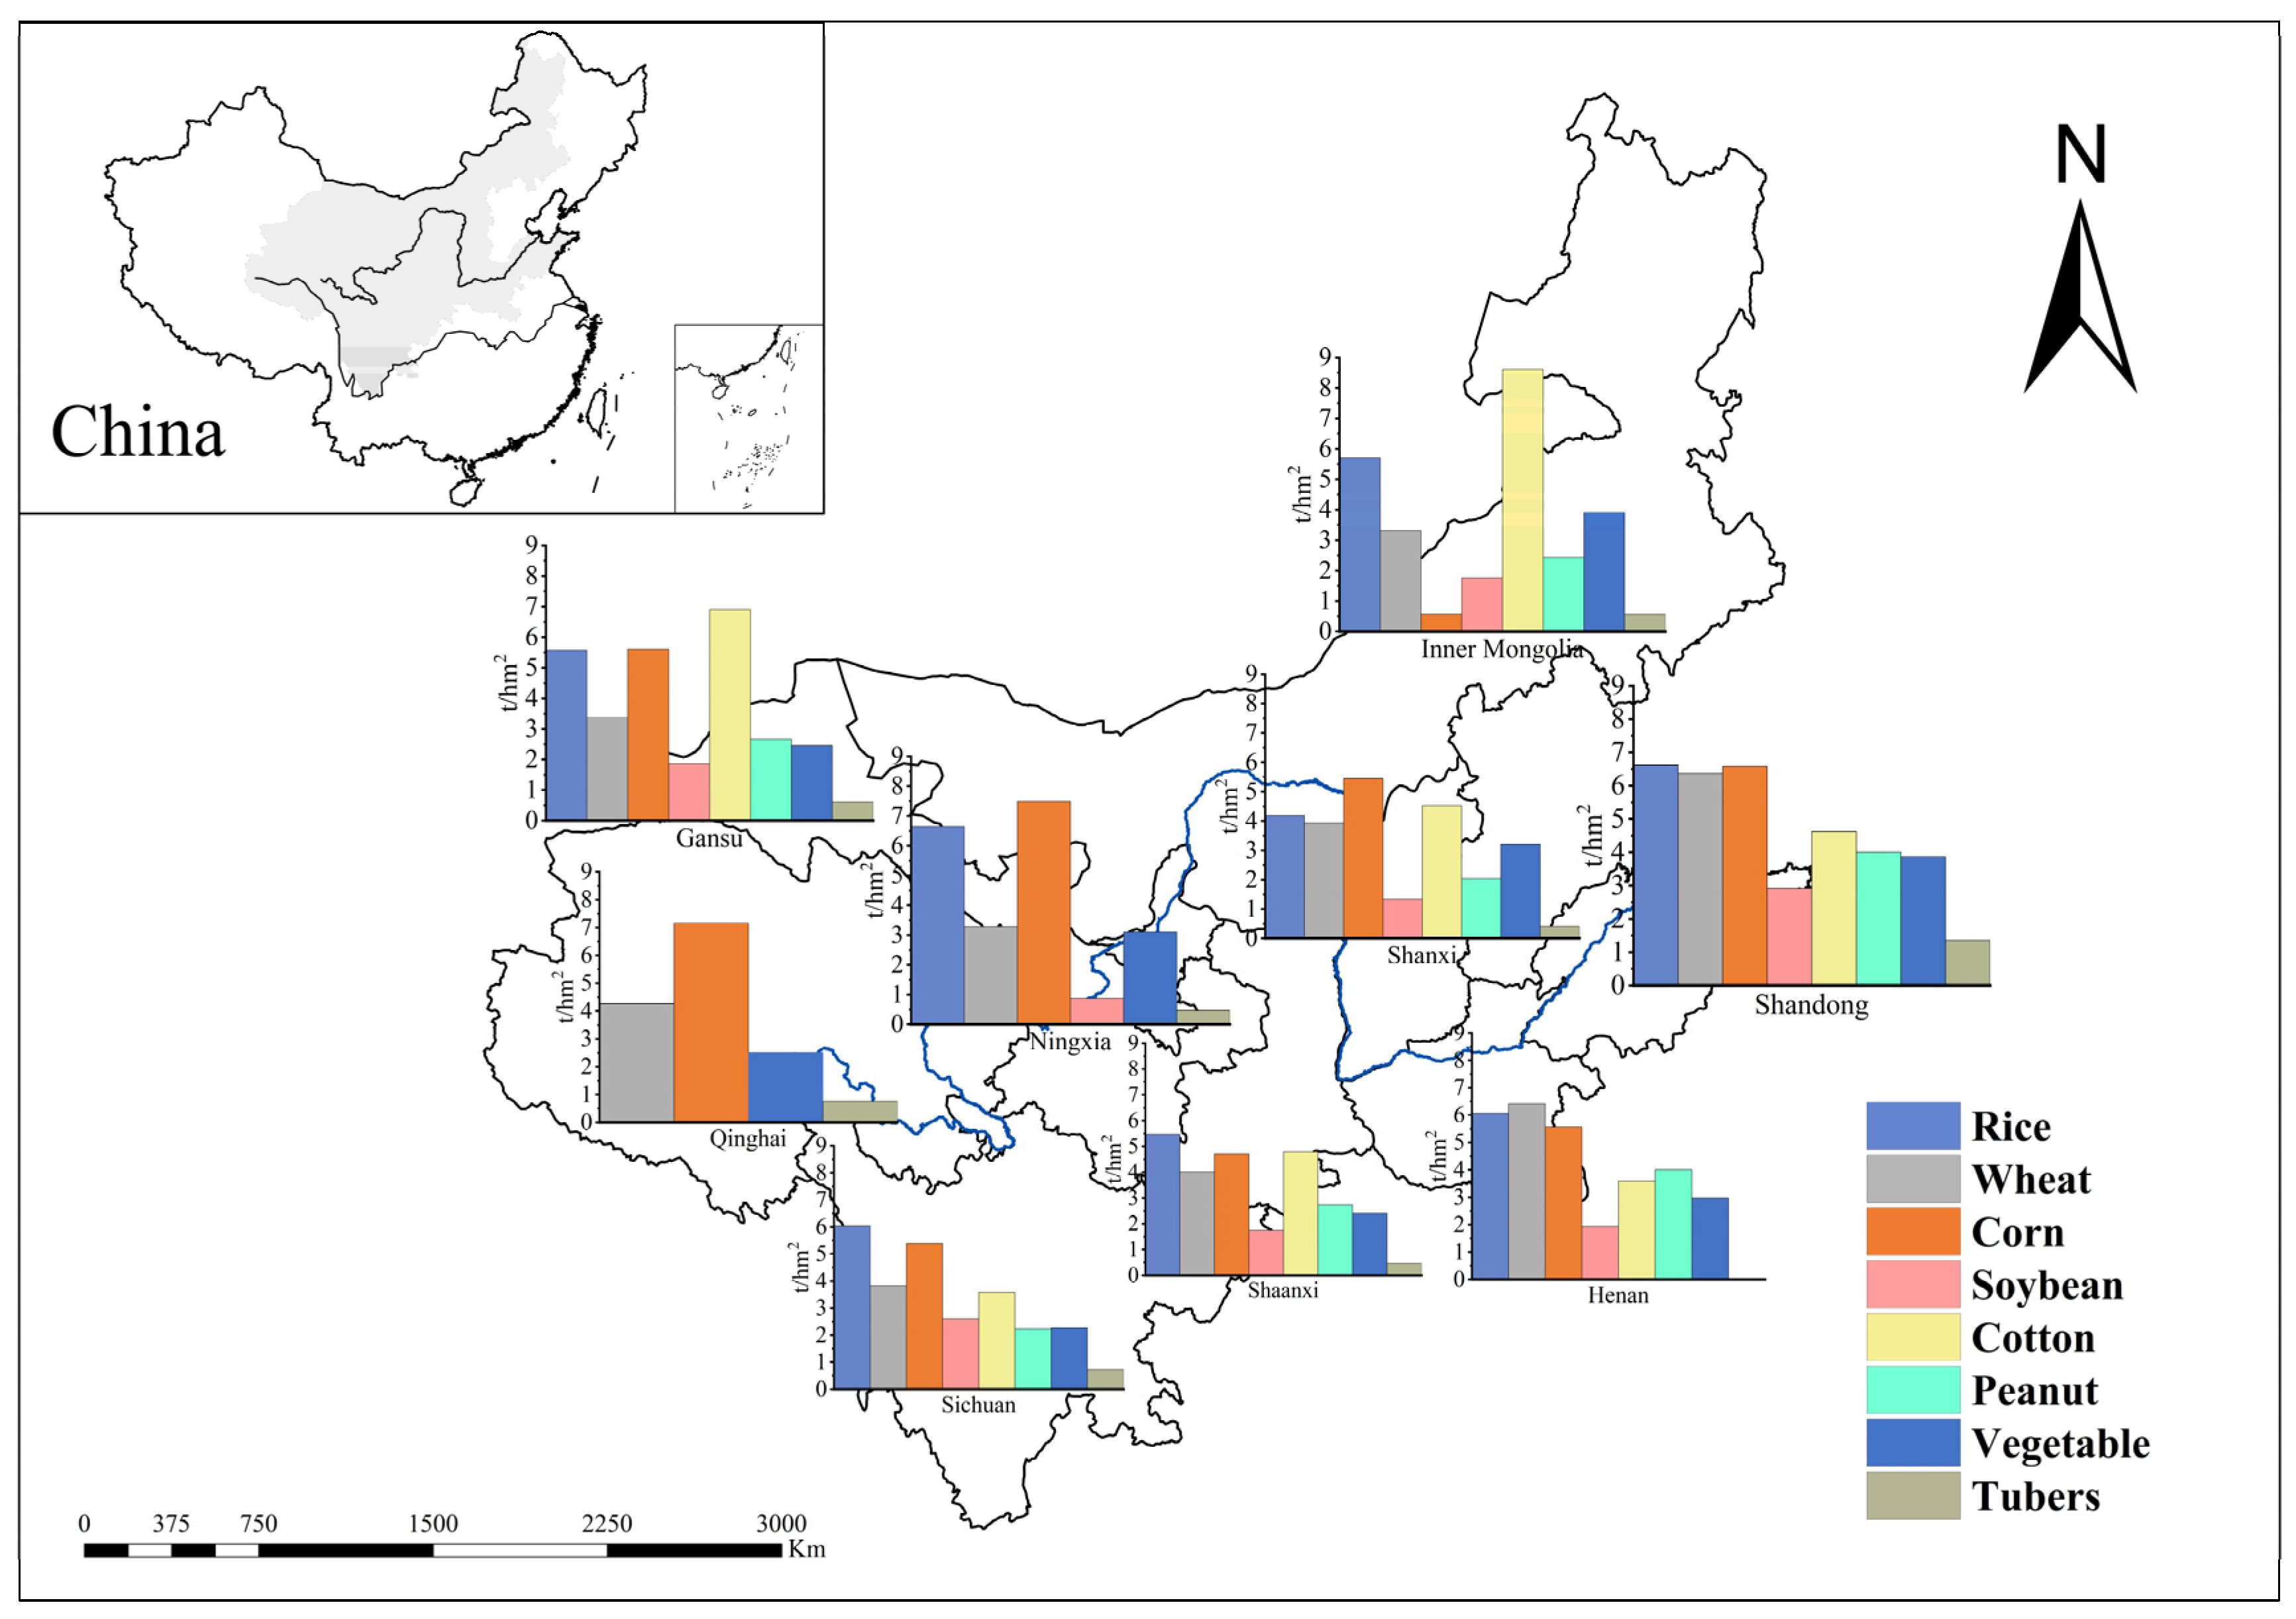
Agricultural carbon sinks in the urban agglomerations of the YRB show a clear growth trend. During this period, the total agricultural carbon sink increased from 147.24 to 226.92 million tons. With the exception of cotton and potatoes, the carbon sink of other crops has increased. In terms of carbon sink, wheat and corn are the main sources of the agricultural carbon sink, accounting for 73% of the total carbon sink. Furthermore, the carbon sink capacity of the same crop varies markedly in different regions.
(3)
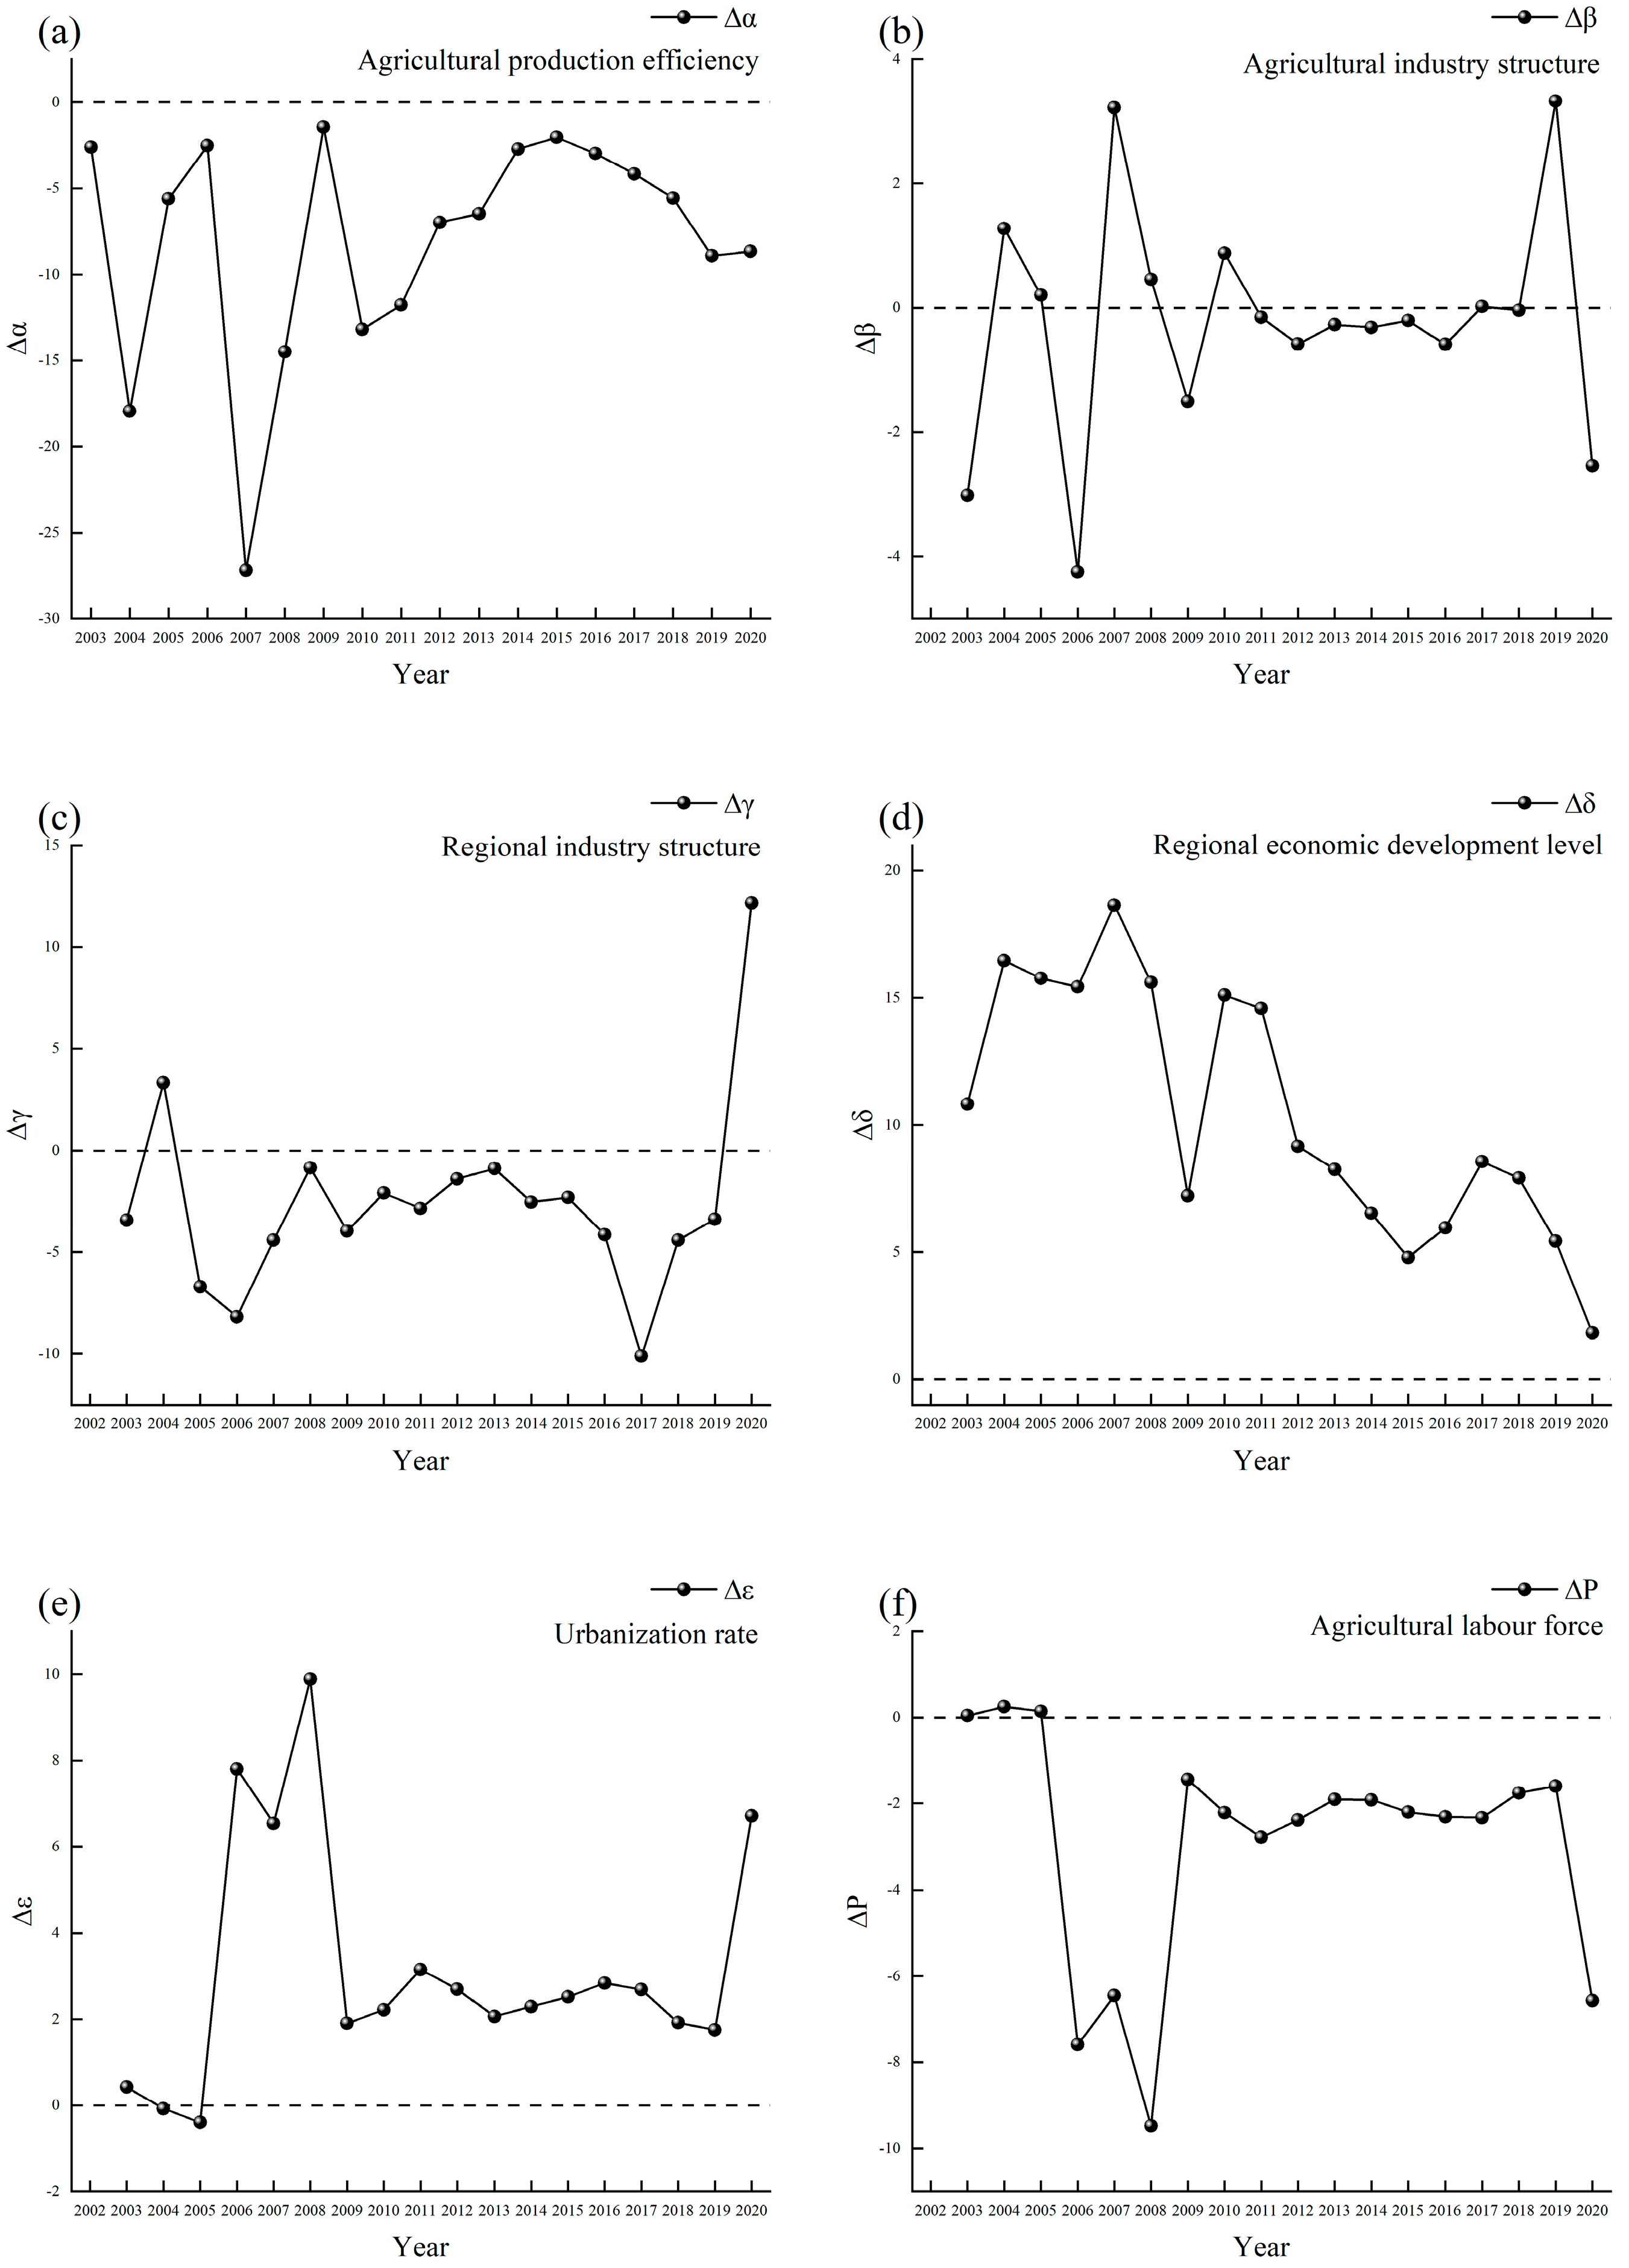
The LMDI factor decomposition analysis reveals that several factors contribute to agrarian carbon emissions reduction in the YRB urban agglomeration, including agricultural production efficiency, industry structure, regional industry structure, and labor force size. Among these factors, agricultural production efficiency plays a crucial role, resulting in an average annual carbon reduction of 8.07 million tons. On the other hand, the level of regional economic development and urbanization contribute to the increase in agricultural carbon emissions. Specifically, regional economic development is the primary driver; cumulative carbon emissions amounted to 188.061 million tons.
(4)
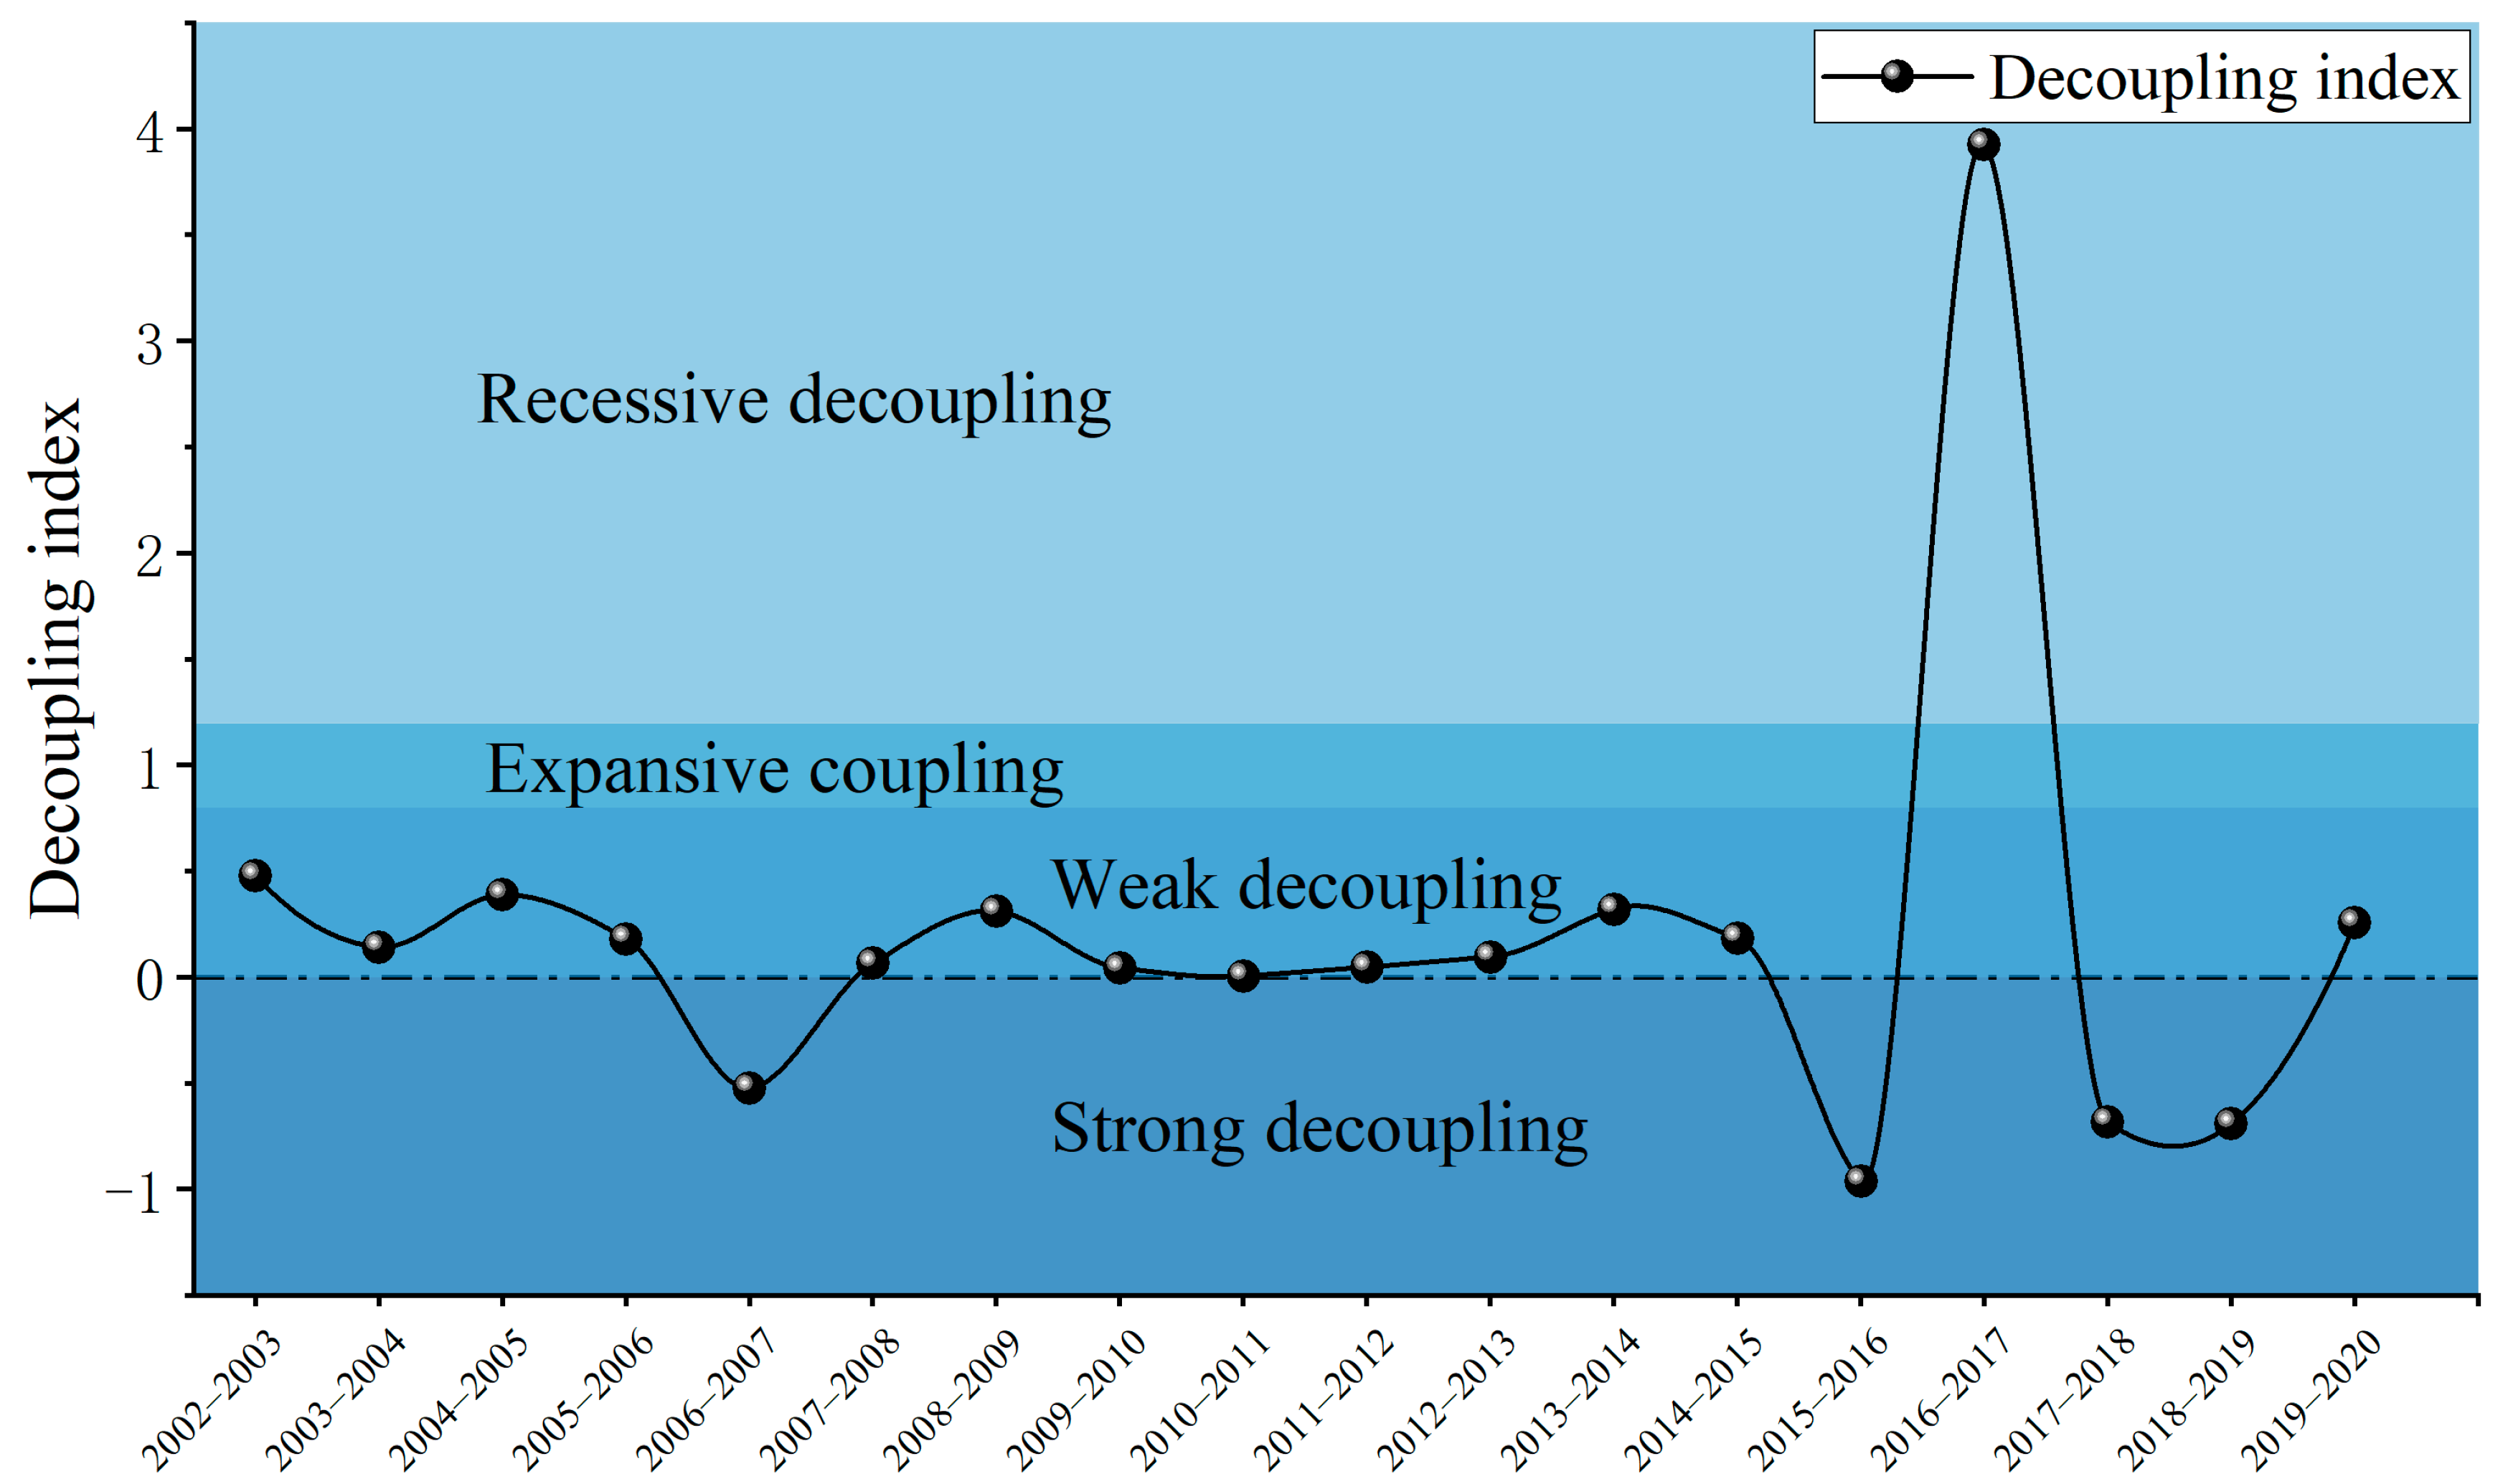
From the data analysis of the decoupling model, there are three decoupling states of agricultural carbon emissions in the YRB urban agglomeration: strong decoupling, weak decoupling, and declining decoupling. There were four strong decouplings, three of which occurred after 2015, indicating that the YRB urban agglomeration has achieved significant carbon emissions reductions.

5.2. Policy Implications

Based on the findings of this study, the following recommendations are proposed for the sustainable development of agriculture and animal husbandry in the YRB urban agglomeration:
(1)
We will promote low-carbon and sustainable agriculture and improve the efficiency of agricultural materials used to reduce carbon emissions from agricultural inputs. In this study, fertilizer is the primary source of carbon emissions from agricultural land. We must develop clean agrarian production technologies, improve fertilizer application efficiency, reduce fertilizer use frequency, and achieve rational and efficient fertilizer application. We are improving agricultural production techniques to develop efficient and clean agrarian production patterns.
(2)
Improving crop cultivation systems or patterns to increase the stability of crop production, restructuring the agricultural industry to reduce farmland depletion, and enhancing soil management. Selecting some high-yielding crops, such as wheat and corn, as growing crops with a high carbon sequestration capacity can enhance carbon sequestration. The internal structure of the farming industry should be adjusted to meet basic food needs, expand the area planted with cash crops, increase the comprehensive production capacity of agriculture, make preferential selection of crop species, and improve planting techniques to increase the productivity of crops and enhance their carbon sequestration capacity.
(3)
To reform livestock farming technology and management and improve livestock farming. The aim is to effectively control methane emissions from the intestinal tract of ruminant animals. Local governments can make appropriate adjustments to the structure of the livestock industry according to market conditions, optimize the breeds of livestock, improve the scientific degree of breeding techniques, and increase the advanced degree of livestock manure treatment, thereby reducing carbon emissions.
(4)
Increase publicity and training for farmers on low-carbon development and raise their awareness. A wide range of channels and methods should be fully utilized to publicize low-carbon agriculture and raise farmers’ awareness of the safety and superiority of low-carbon agricultural products so that low-carbon production and low-carbon living become the consensus of farmers and promote the transformation of agricultural production methods and the reduction of agricultural carbon emissions. Through technical training, farmers can grasp advanced production techniques better, thereby increasing farm productivity and reducing greenhouse gas emissions.

Supplementary Materials

The following supporting information can be downloaded at: https://www.mdpi.com/article/10.3390/su16010468/s1, Table S1: Parameters of carbon sources and emissions from agricultural inputs; Table S2: Parameters for crop N2O emissions; Table S3: Methane emission factors of rice growth cycle from all regions in YRB cities (g/m2); Table S4: Greenhouse gas emission coefficients of livestock and poultry (unit: kg/head/year); Table S5: Carbon conversion coefficients, economic coefficients, and moisture coefficients of different crops; Table S6: Classification criteria for decoupling status of Tapio decoupling model; Table S7: Results of LMDI model decomposition; Table S8: Carbon emissions from rice growth cycle in Yellow River basin urban agglomeration province; Table S9: Agricultural carbon emission intensity in the Yellow River basin (YRB) provinces; Table S10: Agricultural carbon emissions in the Yellow River basin (YRB) provinces; Table S11: Agricultural carbon sinks in the Yellow River basin (YRB) urban agglomeration; Table S12: Carbon sinks of major crops in the Yellow River basin (YRB). References [46,47,59,63,64,65,66] are cited in the supplementary materials.

Author Contributions

Conceptualization, L.J., M.W. (Mingya Wang), S.Y. and M.W. (Mingshi Wang); Methodology, L.J., M.W. (Mingya Wang) and M.W. (Mingshi Wang); Software, L.J. and M.W. (Mingshi Wang); Validation, L.J., M.W. (Mingya Wang), S.Y., F.Z., Y.W., P.L., M.W. (Wanqi Ma), S.S. and T.L.; Formal analysis, L.J. and M.W. (Mingya Wang); Investigation, F.Z., Y.W., P.L., M.W. (Wanqi Ma), S.S. and T.L.; Resources, S.Y. and M.W. (Mingshi Wang); Data curation, M.W. (Mingshi Wang); Writing—original draft, L.J.; Writing—review & editing, M.W. (Mingshi Wang); Visualization, F.Z.; Project administration, M.W. (Mingshi Wang). All authors have read and agreed to the published version of the manuscript.

Funding

This research was funded by [the National Natural Science Foundation of China] grant number [42177070].

Institutional Review Board Statement

Not applicable.

Informed Consent Statement

Not applicable.

Data Availability Statement

Data are contained within the article.

Conflicts of Interest

The authors declare no conflict of interest.

References

  1. Liu, M.; Dong, X.; Wang, X.; Zhao, B.; Fan, W.; Wei, H.; Zhang, P.; Liu, R. Evaluating the future terrestrial ecosystem contributions to carbon neutrality in Qinghai-Tibet Plateau. J. Clean. Prod. 2022, 374, 133914. [Google Scholar] [CrossRef]
  2. Ramanathan, V.; Feng, Y. Air pollution, greenhouse gases and climate change: Global and regional perspectives. Atmos. Environ. 2009, 43, 37–50. [Google Scholar] [CrossRef]
  3. Wang, R.; Zhang, Y.; Zou, C. How does agricultural specialization affect carbon emissions in China? J. Clean. Prod. 2022, 370, 133463. [Google Scholar] [CrossRef]
  4. Li, S.; Liu, L.; Suo, Y.; Li, X.; Zhou, J.; Jiang, Z.; Guan, H.; Sun, G.; Yu, L.; Liu, P.; et al. Carbon Tectonics: A new paradigm for Earth system science. Chin. Sci. Bull. 2023, 68, 309–338. [Google Scholar] [CrossRef]
  5. Du, Y.; Liu, H.; Huang, H.; Li, X. The carbon emission reduction effect of agricultural policy—Evidence from China. J. Clean. Prod. 2023, 406, 137005. [Google Scholar] [CrossRef]
  6. Liu, M.; Yang, L. Spatial pattern of China’s agricultural carbon emission performance. Ecol. Indic. 2021, 133, 108345. [Google Scholar] [CrossRef]
  7. Khattak, S.I.; Ahmad, M. The cyclical impact of green and sustainable technology research on carbon dioxide emissions in BRICS economies. Environ. Sci. Pollut. Res. 2022, 29, 22687–22707. [Google Scholar] [CrossRef]
  8. Gyamfi, B.A.; Agozie, D.Q.; Bekun, F.V. Can technological innovation, foreign direct investment and natural resources ease some burden for the BRICS economies within current industrial era? Technol. Soc. 2022, 70, 102037. [Google Scholar] [CrossRef]
  9. Khattak, S.I.; Ahmad, M.; Khan, Z.U.; Khan, A. Exploring the impact of innovation, renewable energy consumption, and income on CO2 emissions: New evidence from the BRICS economies. Environ. Sci. Pollut. Res. 2020, 27, 13866–13881. [Google Scholar] [CrossRef]
  10. Adebayo, T.S.; Ullah, S.; Kartal, M.T.; Ali, K.; Pata, U.K.; Aga, M. Endorsing sustainable development in BRICS: The role of technological innovation, renewable energy consumption, and natural resources in limiting carbon emission. Sci. Total Environ. 2023, 859, 160181. [Google Scholar] [CrossRef]
  11. Smith, P.; Martino, D.; Cai, Z.; Gwary, D.; Janzen, H.; Kumar, P.; McCarl, B.; Ogle, S.; O’Mara, F.; Rice, C.; et al. Greenhouse gas mitigation in agriculture. Philos. Trans. R. Soc. B Biol. Sci. 2008, 363, 789–813. [Google Scholar] [CrossRef] [PubMed]
  12. FAO. UNFCCC COP26[EB/OL]. Available online: http://www.fao.org/ (accessed on 22 December 2023).
  13. Chen, Z.; Xu, C.; Ji, L.; Feng, J.; Li, F.; Zhou, X.; Fang, F. Effects of multi-cropping system on temporal and spatial distribution of carbon and nitrogen footprint of major crops in China. Glob. Ecol. Conserv. 2020, 22, e895. [Google Scholar] [CrossRef]
  14. Xu, B.; Lin, B. Factors affecting CO2 emissions in China’s agriculture sector: Evidence from geographically weighted regression model. Energy Policy 2017, 104, 404–414. [Google Scholar] [CrossRef]
  15. Li, M.; Liu, S.; Sun, Y.; Liu, Y. Agriculture and animal husbandry increased carbon footprint on the Qinghai-Tibet Plateau during past three decades. J. Clean. Prod. 2021, 278, 123963. [Google Scholar] [CrossRef]
  16. Zheng, W.; Luo, B.; Hu, X. The determinants of farmers’ fertilizers and pesticides use behavior in China: An explanation based on label effect—ScienceDirect. J. Clean. Prod. 2020, 272, 123054. [Google Scholar] [CrossRef]
  17. Liu, J.; Diamond, J. China’s environment in a globalizing world. Nature 2005, 435, 1179. [Google Scholar] [CrossRef] [PubMed]
  18. Good, A.G.; Beatty, P.H. Fertilizing Nature: A Tragedy of Excess in the Commons. Work. Pap. 2011, 9, e1001124. [Google Scholar] [CrossRef]
  19. Xu, P.; Liao, Y.; Zheng, Y.; Zhao, C.; Zhang, X.; Zheng, Z.; Luan, S. Northward shift of historical methane emission hotspots from the livestock sector in China and assessment of potential mitigation options. Agric. For. Meteorol. 2019, 272–273, 1–11. [Google Scholar] [CrossRef]
  20. Yun, T.; Wu, H. Research on Fairness of Agricultural Carbon Emissions in China’s Major Grain Producing Areas from the Perspective of Industrial Structure. J. Agrotech. Econ. 2020, 45–55. [Google Scholar]
  21. Li, M.; Wiedmann, T.; Hadjikakou, M. Towards meaningful consumption-based planetary boundary indicators: The phosphorus exceedance footprint. Glob. Environ. Chang. 2019, 54, 227–238. [Google Scholar] [CrossRef]
  22. Li, B.; Danish; Khan, S.U.; Haneklaus, N. Ecological footprint analysis of the phosphorus industry in China. Environ. Sci. Pollut. Res. 2022, 29, 73461–73479. [Google Scholar] [CrossRef] [PubMed]
  23. Shun, C.; Fei, L.; Xiaoke, W. Estimation of greenhouse gases emission factors for China’s nitrogen, phosphate, and potash fertilizers. Acta Ecol. Sin. 2015, 35, 6371–6383. [Google Scholar]
  24. Tian, Y.; Zhang, J.B. Regional differentiation research on net carbon effect of agricultural production in China. J. Nat. Resour. 2013, 28, 1298–1309. [Google Scholar]
  25. Wei, S.; Yang, Y.; Xu, Y. Regional development, agricultural industrial upgrading and carbon emissions: What is the role of fiscal expenditure?—Evidence from Northeast China. Econ. Anal. Policy 2023, 80, 1858–1871. [Google Scholar] [CrossRef]
  26. Xu, L.; Dong, Z. Spatial-temporal Characteristics and Spatial Effects of Agricultural Carbon Emissions in the Yellow River Basin. J. North China Univ. Water Resour. Electr. Power Soc. Sci. Ed. 2023, 39, 9–18. [Google Scholar]
  27. Wang, H.; Xu, Y.; Li, C. Coupling coordination and spatio-temporal pattern evolution between ecological protection and high-quality development in the Yellow River Basin. Heliyon 2023, 9, e21089. [Google Scholar] [CrossRef]
  28. Zhao, X.; Ma, Q.; Yang, R. Factors influencing CO2 emissions in China’s power industry: Co-integration analysis. Energy Policy 2013, 57, 89–98. [Google Scholar] [CrossRef]
  29. Han, S.; Li, F.; Wang, S.; Li, H.; Yuan, L.; Liu, J.; Shen, H.; Zhang, X.; Li, C.; Wu, X.; et al. Groundwater resource and eco-environmental problem of the Yellow River Basin. Geol. China 2021, 48, 1001–1019. [Google Scholar]
  30. Zhao, N.; Wang, K.; Yuan, Y. Toward the carbon neutrality: Forest carbon sinks and its spatial spillover effect in China. Ecol. Econ. 2023, 209, 107837. [Google Scholar] [CrossRef]
  31. Zhu, Y.; Huo, C.J. The Impact of Agricultural Production Efficiency on Agricultural Carbon Emissions in China. Energies 2022, 15, 4464. [Google Scholar] [CrossRef]
  32. Liu, X.Q.; Ye, Y.M.; Ge, D.D.; Wang, Z.; Liu, B. Study on the Evolution and Trends of Agricultural Carbon Emission Intensity and Agricultural Economic Development Levels-Evidence from Jiangxi Province. Sustainability 2022, 14, 14265. [Google Scholar] [CrossRef]
  33. Huang, Q.Y.; Zhang, Y. Decoupling and Decomposition Analysis of Agricultural Carbon Emissions: Evidence from Heilongjiang Province, China. Int. J. Environ. Res. Public Health 2022, 19, 198. [Google Scholar] [CrossRef] [PubMed]
  34. Xu, X.; Lan, Y. Spatial and temporal patterns of carbon footprints of grain crops in China. J. Clean. Prod. 2017, 146, 218–227. [Google Scholar] [CrossRef]
  35. Li, B.; Zhang, J.B.; Li, H.P. Research on Spatial-temporal Characteristics and Affecting Factors Decomposition of Agricultural Carbon Emission in China. China Popul. Resour. Environ. 2011, 21, 80–86. [Google Scholar]
  36. Deng, W.; Xu, Z. Characteristics of agricultural carbon emissions and carbon peak analysis in Hunan Province. Chin. J. Eco-Agric. 2023, 1–14. [Google Scholar]
  37. Johnson, J.M.-F.; Franzluebbers, A.J.; Weyers, S.L.; Reicosky, D.C. Agricultural opportunities to mitigate greenhouse gas emissions. Environ. Pollut. 2007, 150, 107–124. [Google Scholar] [CrossRef]
  38. Zhao, L.P.; Li, X.C.; Li, X.M.; Ai, C. Dynamic Changes and Regional Differences of Net Carbon Sequestration of Food Crops in the Yangtze River Economic Belt of China. Int. J. Environ. Res. Public Health 2022, 19, 13229. [Google Scholar] [CrossRef]
  39. Song, H.; Zhang, X.; Zou, J.; Gu, L.; Li, Y.; Tang, J. A study on the value of carbon compensation in the Huai River basin based on land use from 2000 to 2020. Phys. Chem. Earth Parts A B C 2023, 132, 103490. [Google Scholar] [CrossRef]
  40. Cheng, J.; Huang, C.; Gan, X.; Peng, C.; Deng, L. Can forest carbon sequestration offset industrial CO2 emissions? A case study of Hubei Province, China. J. Clean. Prod. 2023, 426, 139147. [Google Scholar] [CrossRef]
  41. Demiral, M.; Demiral, Ö. Global value chains participation and trade-embodied net carbon exports in group of seven and emerging seven countries. J. Environ. Manag. 2023, 347, 119027. [Google Scholar] [CrossRef]
  42. Chen, F.; Zhang, J.; Ren, J.; Xiang, Y.; Li, Q. Spatiotemporal variations and influencing factors of carbon emissions in the Yellow River Basin based on LMDI model. J. Earth Environ. 2022, 13, 418–427. [Google Scholar]
  43. Kong, H.J.; Shi, L.F.; Da, D.; Li, Z.; Tang, D.; Xing, W. Simulation of China’s Carbon Emission based on Influencing Factors. Energies 2022, 15, 3272. [Google Scholar] [CrossRef]
  44. Yang, H.; Wang, X.; Bin, P. Agriculture carbon-emission reduction and changing factors behind agricultural eco-efficiency growth in China. J. Clean. Prod. 2022, 334, 130193. [Google Scholar] [CrossRef]
  45. Guoyong, W.; Jindan, L.; Ying, C. Analysis of Spatial Characteristics and Spillover Effects of Agricultural Carbon Emission Intensity in China. Environ. Sci. Technol. 2021, 44, 211–219. [Google Scholar]
  46. Min, J.; Hu, H. Calculation of Greenhouse Gases Emission from Agricultural Production in China. China Popul. Resour. Environ. 2012, 22, 21–27. [Google Scholar]
  47. Wang, H.; Qiao, J. Decoupling and predictive analysis of greenhouse gas emission from animal husbandry in China. Chin. J. Eco-Agric. 2019, 27, 793–802. [Google Scholar]
  48. Bhattacharyya, P.; Neogi, S.; Roy, K.S.; Dash, P.; Nayak, A.; Mohapatra, T. Tropical low land rice ecosystem is a net carbon sink. Agric. Ecosyst. Environ. 2014, 189, 127–135. [Google Scholar] [CrossRef]
  49. Chen, C.; Junwei, Z. Spatial-Temporal Evolution of Agricultural Carbon Effect in the Yellow River Basin and Its Fairness Research. Yellow River 2023, 45, 13–18. [Google Scholar]
  50. Cui, Y.; Khan, S.U.; Sauer, J.; Zhao, M. Exploring the spatiotemporal heterogeneity and influencing factors of agricultural carbon footprint and carbon footprint intensity: Embodying carbon sink effect. Sci. Total Environ. 2022, 846, 157507. [Google Scholar] [CrossRef]
  51. Zhang, S.; Ying, J.; He, Y.; Xiao, X. Spatial differentiation and dynamic evolution of agricultural carbon emission in China Empirical research based on spatial and non-parametric estimation methods. China Environ. Sci. 2020, 40, 1356–1363. [Google Scholar]
  52. Isik, M.; Sarica, K.; Ari, I. Driving forces of Turkey’s transportation sector CO2 emissions: An LMDI approach. Transp. Policy 2020, 97, 210–219. [Google Scholar] [CrossRef]
  53. Jain, S.; Rankavat, S. Analysing driving factors of India’s transportation sector CO2 emissions: Based on LMDI decomposition method. Heliyon 2023, 9, e19871. [Google Scholar] [CrossRef] [PubMed]
  54. Karakaya, E.; Bostan, A.; Özçağ, M. Decomposition and decoupling analysis of energy-related carbon emissions in Turkey. Environ. Sci. Pollut. Res. 2019, 26, 32080–32091. [Google Scholar] [CrossRef] [PubMed]
  55. Zhao, R.; Liu, Y.; Ding, M.; Jiao, S. Research on Carbon Source and Sink of Farmland Ecosystem in Henan Province. J. Henan Agric. Sci. 2010, 40–44. [Google Scholar]
  56. Xiao, P.; Zhang, Y.; Qian, P.; Lu, M.; Yu, Z.; Xu, J.; Zhao, C.; Qian, H. Spatiotemporal Characteristics, Decoupling Effect and Driving Factors of Carbon Emission from Cultivated Land Utilization in Hubei Province. Int. J. Environ. Res. Public Health 2022, 19, 9326. [Google Scholar] [CrossRef] [PubMed]
  57. Liu, H.; Zhang, Z. Probing the carbon emissions in 30 regions of China based on symbolic regression and Tapio decoupling. Environ. Sci. Pollut. Res. 2022, 29, 2650–2663. [Google Scholar] [CrossRef] [PubMed]
  58. Wu, Y.; Yuan, C.; Liu, Z.; Wu, H.; Wei, X. Decoupling relationship between the non-grain production and intensification of cultivated land in China based on Tapio decoupling model. J. Clean. Prod. 2023, 424, 138800. [Google Scholar] [CrossRef]
  59. Tapio, P. Towards a theory of decoupling: Degrees of decoupling in the EU and the case of road traffic in Finland between 1970 and 2001. Transp. Policy 2005, 12, 137–151. [Google Scholar] [CrossRef]
  60. Yang, F.; Shi, L.; Gao, L. Probing CO2 emission in Chengdu based on STRIPAT model and Tapio decoupling. Sustain. Cities Soc. 2023, 89, 104309. [Google Scholar] [CrossRef]
  61. Huang, X.; Xu, X.; Wang, Q.; Zhang, L.; Gao, X.; Chen, L. Assessment of Agricultural Carbon Emissions and Their Spatiotemporal Changes in China, 1997–2016. Int. J. Environ. Res. Public Health 2019, 16, 3105. [Google Scholar] [CrossRef]
  62. Yun, T.; Yanrong, C. EKC-based Test for Agricultural Carbon Emissions in Yangtze River Economic Belt and Analysis of Driving Factors. Resour. Environ. Yangtze Basin 2023, 32, 2403–2417. [Google Scholar]
  63. Liu, Y.; Liu, H. Characteristics, influence factors, and prediction of agricultural carbon emissions in Shandong Province. Chin. J. Eco-Agric. 2022, 30, 558–569. [Google Scholar]
  64. Hu, Y.; Zhang, K.; Hu, N.; Wu, L. Review on measurement of agricultural carbon emission in China. Chin. J. Eco-Agric. 2023, 31, 163–176. [Google Scholar]
  65. Ran, J.; Ma, H.; Su, Y. Study on Agricultural Carbon Emission and Its Influencing Factors in Five Provinces of Northwest China. Acta Agric. Univ. Jiangxiensis 2017, 39, 623–632. [Google Scholar]
  66. Li, M.; Zhou, D.; Zhu, X.; Qi, H.; Ma, J.; Zhang, J. Spatial-temporal characteristics of agricultural carbon emissions and influencing factors in the Hexi Corridor from 2000 to 2020. J. Agric. Resour. Environ. 2023, 40, 940–952. [Google Scholar]
Figure 1. Regional distribution map of urban agglomerations in the YRB.
Sustainability 16 00468 g001
Figure 2. Trends and share of carbon emissions from agriculture.
Sustainability 16 00468 g002
Figure 3. Trends and proportions of emissions from various types of poultry in the livestock industry.
Sustainability 16 00468 g003
Figure 4. Trends and proportions of emissions from various emission sources in agricultural inputs.
Sustainability 16 00468 g004
Figure 5. Trends in crop carbon emissions.
Sustainability 16 00468 g005
Figure 6. Regional concentration distribution map of agricultural carbon emissions in the YRB in 2002, 2008, 2014, and 2020.
Sustainability 16 00468 g006
Figure 7. Cumulative carbon emissions and carbon emissions intensity of provinces in the YRB urban agglomeration in 2002–2020.
Sustainability 16 00468 g007
Figure 8. Estimation of carbon sinks for different crops.
Sustainability 16 00468 g008
Figure 9. Carbon-sink-crop production per central unit of arable land in different regions of the YRB.
Sustainability 16 00468 g009
Figure 10. Regional concentration distribution map of agricultural carbon sinks in the YRB in 2002, 2008, 2014, and 2020.
Sustainability 16 00468 g010
Figure 11. Trends in various decomposition factors in the LMDI decomposition model. (a) Agricultural production efficiency; (b) Agricultural industry structure; (c) Regional industry structure; (d) Regional economic development level; (e) Urbanization rate; (f) Agricultural labor force.
Sustainability 16 00468 g011
Figure 12. The diagram for decoupling coefficients.
Sustainability 16 00468 g012
Table 1. Classification criteria for decoupling status of Tapio decoupling model.
Type of DecouplingDecoupling StatusΔC/CΔG/GT
DecouplingWeak decoupling>0>00 ≤ T < 0.8
Strong decoupling<0>0T < 0
Declining decoupling<0<0T > 1.2
Negative decouplingWeak negative decoupling<0<00 ≤ T < 0.8
Strong negative decoupling>0<0T < 0
Expansive negative decoupling>0>0T > 1.2
ConnectExpansion connection>0>00.8 ≤ T ≤ 1.2
Decay connection<0<00.8 ≤ T ≤ 1.2
Table 2. Results of the LMDI decomposition of agricultural carbon emissions in the YRB, 2002–2020.
YearContribution Value (Million Tons)
∆α∆β∆γ∆δ∆ε∆P∆C
2003−2.604−3.020−3.42510.8160.4260.0442.238
2004−17.9421.2773.34016.466−0.0760.2493.315
2005−5.6080.203−6.69315.762−0.4000.1433.407
2006−2.519−4.247−8.17415.4307.804−7.5900.705
2007−27.1953.219−4.41118.6536.536−6.454−9.652
2008−14.4950.461−0.85615.6019.886−9.4801.117
2009−1.448−1.501−3.9597.2161.909−1.4430.775
2010−13.1870.879−2.09015.1042.219−2.2130.712
2011−11.780−0.153−2.84614.5823.155−2.7830.175
2012−6.984−0.581−1.4009.1652.694−2.3840.510
2013−6.478−0.269−0.8908.2542.066−1.9080.774
2014−2.713−0.313−2.5366.5282.293−1.9181.341
2015−2.040−0.204−2.3104.7912.518−2.2040.551
2016−2.980−0.587−4.1405.9552.840−2.310−1.222
2017−4.1680.021−10.1148.5602.687−2.330−5.344
2018−5.569−0.038−4.4157.9111.923−1.758−1.946
2019−8.9233.328−3.3775.4351.758−1.597−3.376
2020−8.664−2.53812.1691.8326.710−6.5702.939
Total−145.297−4.062−46.128188.06156.949−52.505−2.982
∆α, ∆β, ∆γ, ∆δ, ∆ε, and ∆P, respectively, stand for the contribution values of agricultural production efficiency, agricultural industry structure, regional industry structure, regional economic development level, urbanization rate, and agricultural labor force to carbon emission variation. ΔC stands for carbon emission variation during the study period.
Disclaimer/Publisher’s Note: The statements, opinions and data contained in all publications are solely those of the individual author(s) and contributor(s) and not of MDPI and/or the editor(s). MDPI and/or the editor(s) disclaim responsibility for any injury to people or property resulting from any ideas, methods, instructions or products referred to in the content.

