Article

Study on Spatial-Temporal Disparities and Factors Influencing Electricity Consumption Carbon Emissions in China

1
College of Economics and Management, Shanghai University of Electric Power, Shanghai 201306, China
2
State Grid Hunan Provincial Electric Power Co., Ltd., Zhuzhou Power Supply Company, Zhuzhou 412011, China
3
Research Institute of Carbon Neutrality, Shanghai Jiao Tong University, Shanghai 200030, China
*
Author to whom correspondence should be addressed.
Sustainability 2024, 16(10), 4128; https://doi.org/10.3390/su16104128
Submission received: 4 March 2024 / Revised: 1 May 2024 / Accepted: 13 May 2024 / Published: 15 May 2024
(This article belongs to the Special Issue Energy Economy and Sustainable Energy)

Abstract

:
Investigating the factors influencing the spatial-temporal disparities in China’s electricity consumption carbon emissions (ECCEs) will be of great help to advancing the reduction in carbon emissions on the consumption side of electricity. Based on the measurement of the ECCEs in 30 Chinese provinces between 2005 and 2021, we utilized the natural breakpoint method and the Dagum Gini coefficient to analyze the spatial-temporal disparities in ECCEs at the provincial and regional levels, and then we used Geodetector to explore the factors influencing the spatial-temporal disparities in ECCEs. The results revealed the following: (1) There were obvious inter-provincial spatial disparities in ECCEs, with coastal provinces such as Jiangsu and Guangdong consistently ranking at the top of the country and inland provinces such as Qinghai and Yunnan having relatively low carbon emission values. (2) The overall disparities in China’s ECCEs fluctuated and rose, with inter-regional disparities being the primary source of the overall disparities. (3) Economic development, industrialization level, population density, and foreign direct investment all had strong explanations for the spatial-temporal disparities in China’s ECCEs. When all these influencing factors were spatially superimposed, their effects were enhanced.

Graphical Abstract

1. Introduction

Global warming has caused severe damage to the ecological environment and human life and has become one of the world’s most pressing challenges today [1]. Carbon dioxide emissions, as the most significant sources of greenhouse gas emissions [2,3], play a critical role in the global warming process. China is now the world’s most significant contributor to carbon emissions [4,5] and will play an even more critical role in promoting global climate governance [6]. China proposed a “dual carbon” target of carbon peak and carbon neutrality at the 75th session of the United Nations General Assembly in 2020 to address global climate change, reduce energy consumption, and control carbon dioxide emissions [7,8]. The proposal of the “dual carbon” target was of great significance in accelerating the green transformation of China’s economy and society [9].
Electricity, as an indispensable means of production and life for the development of modern society, plays a vital role in supporting economic growth and social stability [10]. China’s electricity consumption has proliferated over the past two decades, from 2.5 trillion kWh in 2005 to 8.5 trillion kWh in 2021. As China’s total electricity consumption continues to grow, carbon emissions from electricity generation in China’s power sector also continue to rise. Thermal power generation is currently China’s most important form of power generation [11]. Carbon emissions from thermal power generation account for more than 40% of China’s total carbon emissions [12,13]. Therefore, China must pay attention to the issue of carbon emissions from electricity, and the effect of reducing carbon emissions from electricity directly impacts the early realization of China’s “dual-carbon” goal.
There are differences in power resource endowment and power demand between different provinces in China, resulting in the need for a large amount of power transfer between provinces. For example, provinces such as Guangdong and Jiangsu, whose end-use power consumption is much higher than their generation capacity, need to transfer power from other provinces to meet their power demand. For those provinces which export electricity, accounting for their carbon emissions from electricity based on the producer responsibility principle could easily lead to the problem of carbon leakage [14]. In this context, accounting for electricity consumption carbon emissions (ECCEs) in China’s provinces, considering consumers’ responsibility, can help mitigate carbon leakage and strengthen the effect of reducing carbon emissions from electricity. In addition, China’s vast geographic expanse and the wide disparities in the economic development and technology levels among the regions will inevitably lead to differences in China’s ECCEs at the provincial and regional levels. Therefore, it is necessary to conduct an in-depth study on the spatial and temporal differences in China’s ECCEs and the factors influencing them to provide a reference for the government’s decision-making departments to formulate a more scientific and targeted policy to reduce carbon emissions from the consumption side of electricity.
Accounting for carbon emissions from electricity has always been a focus of attention in the academic community. Scholars have accounted for carbon emissions from electricity in recent years based on different perspectives and methodologies. Xie et al. [15] and Wang et al. [16] measured carbon emissions from electricity generation in China and Chinese provinces for consecutive years based on the production perspective using the IPCC inventory method. Li et al. [17] used a network approach based on a consumption perspective to estimate and analyze the transfer of carbon emissions from electricity trading among Chinese provinces in 2017. Zhang et al. [18] used an input–output model to quantify the carbon emissions associated with electricity consumption in Beijing over several years. Scarlat et al. [19] used a spreadsheet model to quantify the carbon emissions associated with electricity production and consumption in European countries. Chen et al. [20] calculated CO2 emissions from residential electricity consumption in China. Li et al. [21] provided a systematic introduction to the current application technology and research progress of power carbon accounting and outlined the future development prospects of power carbon accounting technology.
In studying the factors influencing electric power carbon emissions, the index decomposition method and the econometric method are two methods commonly used by scholars in China and abroad. Zhang et al. [18], He et al. [22], and Karmellos et al. [23] used the LMDI index decomposition model to investigate the contribution of different influencing factors to carbon emissions from electricity generation in Beijing, China, and the EU, respectively. Noorpoor and Kudahi [24] and Cui et al. [25] used the STIRPAT model to investigate how socio-economic and technological factors such as the GDP per capita affect carbon emissions from electricity in Iran and China, respectively. Wen and Yan [26] used a panel-data model to examine regional differences in the factors affecting carbon emissions from electricity. Wang and Li [27] and Sun et al. [28] used spatial econometric modeling to analyze the spatial spillover effects of each driving factor on the carbon emissions (intensity) of electricity in China.
Currently, the coefficient of variation, the Thiel index, and the Dagum Gini coefficient are the main methods used to measure regional disparities in carbon emissions. Scholars have used the above methodology to measure the regional disparities in different types of carbon emissions. Lian et al. [29] and Liu et al. [30] measured the regional disparities in carbon emissions from household consumption in China and the intensity of carbon emissions from the transportation sector in China using the Thiel index. Wang et al. [31] compared regional disparities in agricultural carbon emissions using a combination of the coefficient of variation method and the Thiel index. Ma et al. [32] and Wang et al. [33] used the Dagum Gini coefficient to examine regional disparities in carbon emissions from commercial buildings and manufacturing industries in China, respectively.
However, the existing studies still have the following shortcomings. First, few scholars have accounted for ECCEs in China’s provinces, taking into account consumer responsibility. Second, several scholars have measured and analyzed the regional disparities in different types of carbon emissions in China using statistical indicator measures. However, the research on measuring and analyzing the regional disparities in China’s electricity carbon emissions is relatively thin. Third, factors that affect carbon emissions are generally inter-related, and interactions between factors can affect carbon emissions [34]. However, most existing studies on the factors affecting carbon emissions from electricity have ignored this point, and the exponential decomposition and econometric models mentioned above, for example, have difficulty explaining the possible synergies or antagonisms between the various factors [35]. The Geodetector model studied by Wang and Xu [36], on the other hand, is a method used to detect spatial heterogeneity, which not only detects the main factors influencing spatial differentiation but also detects the interactions between the factors as well as the types of interactions. In addition, no linearity assumptions about the variables are required, and multicollinearity does not need to be considered when using this model. Given the above advantages, the model is now widely used in studying carbon emission’s influencing factors [37,38,39,40]. However, scholars have yet to use this model to study the factors influencing electric carbon emissions.
Given this, this paper accounts for the ECCEs in 30 provinces in China from 2005 to 2021 according to the principle of “sharing responsibility on both sides of production and consumption” and investigates the spatial and temporal disparities of ECCEs in the provinces and regions using the natural breakpoint method and the Dagum Gini coefficient, and it then investigates the influencing factors of ECCEs using the Geodetector model. The main innovations and potential marginal contributions of this paper are as follows: (1). Considering the responsibility of consumers, the shared responsibility method has been applied to measure the ECCE in each province in China. This helps the Chinese government clarify the current carbon emissions from each province’s electricity consumption situation. (2). By using the natural breakpoint method and the Dagum Gini coefficient method to analyze the spatial and temporal disparities in China’s ECCEs at the provincial and regional levels, respectively, it is possible to present the spatial pattern of China’s ECCEs more objectively and completely identify the contribution of the overall regional disparities in China’s ECCEs. (3). A Geodetector model was used to identify the influence of potential drivers on the spatial differentiation of carbon emissions from China’s electricity consumption and the interaction between drivers.

2. Methodology and Data

2.1. Calculation of ECCE

First, we used the IPCC Carbon Inventory Estimation Methodology to calculate the direct carbon emissions Pi from thermal power generation in 30 provinces in China; the specific equations are as follows:
P i = k A C i k × N V C k × C C k × O k × 44 / 12
In Equation (1), ACik represents the input of the kth fuel in the power generation process in province i, and NCVk, CCk, and Ok represent the calorific value, carbon content, and carbon oxidization rate of the kth fuel, respectively.
We then referred to Xie et al. [41] to measure the ECCEs in 30 Chinese provinces from 2005 to 2021 based on the principle of shared responsibility. The share of ECCEs in direct carbon emissions from electricity in each province in year n (θn) was determined by considering the efficiency of electricity generation and consumption in each province. The formula for θn is shown below:
θ n = 1 - 1 2 1 K n + 1 2 S n
where Kn and Sn are calculated as shown in Equations (3) and (4), respectively.
K n = E C V E E V n E E V = k F C k , n × R k T P n
S n = G D P n / Y P n B n
Table 1 shows the definitions of the variables in Equations (2)–(4).
Considering the existence of inward and outward electricity transfers between provinces, the carbon emission from electricity consumption in each province in year n (ECn) consisted of the following two components, as shown in Equation (5).
E C n = E C I n + E C O n
where ECIn and ECOn are the carbon emissions from consuming electricity produced in the province and the carbon emissions from consuming electricity produced in other provinces in year n, respectively. The specific formulas for ECIni and ECOni are shown below:
E C I n i = E F I C n i × G E n i E O n i E F I C n i = θ n i × P n i G E n i
E C O n i = g i θ n g × P n g g i G E n g × E R n i
Table 2 shows the definitions of the variables in Equations (6) and (7).

2.2. Natural Breakpoint Method

As a classic analytical tool for studying regional spatial differentiation characteristics, the natural breakpoint method was first proposed by Jenks [42] in 1967. The natural breakpoint method takes the minimization of the variance in the attribute values between subregions and the maximization of the variance in the attribute values between subregions as the basis for the establishment of breakpoints and the natural classification of subregions, and the breakpoints are chosen to appear at the places where the values change drastically [43].

2.3. Dagum Gini Coefficient

The Dagum Gini coefficient and its decomposition are an important method to study regional disparities; this method divides the sample disparities into three parts—between-group disparities, within-group disparities, and hypervariable density—to explore the regional disparities and their sources in depth [44]. The division of China into three major regions—eastern, central, and western—first appeared in the policy document known as the Seventh Five-Year Plan for National Economic and Social Development, which was designed to promote coordinated development among different regions, strengthen inter-regional economic cooperation, promote the development of lagging regions, and achieve balanced national economic growth. Given this, this paper uses the Dagum Gini coefficient to measure the regional disparities in the ECCEs in the three major regions of China in order to better understand and compare the development of ECCE in different regions and facilitate the government’s implementation of differentiated carbon emission reduction policies on the electricity consumption side. The specific formula for the Dagum Gini coefficient is as follows.
First, we calculated the overall Gini coefficient of the ECCEs in China. The larger the value of this indicator, the more significant the overall difference in ECCEs among the three major regions of China. The specific formula is as follows:
G = c = 1 3 d = 1 3 a = 1 n c b = 1 n d z c a z d b 2 Z ¯ n 2
In Equation (8), zca (zdb) represents the carbon emissions of the a (b) province of region c (d), n is the total number of provinces included in the three regions, nc and nd represent the number of provinces included in regions c and d, respectively, and Z ¯ is the mean value of the ECCE of each province in China.
Second, we calculated the intra-regional Gini coefficients and inter-regional Gini coefficients of the ECCEs in China, denoted as Gcc and Gcd, respectively. A higher value of Gcc implied a more significant difference in carbon emissions within region c. A higher value of Gcd implied a more significant difference in carbon emissions between regions c and d. The specific formulas for Gcc and Gcd are as follows:
G c c = 1 2 Z c ¯ n 2 a = 1 n c e = 1 n c z c a z c e
G c d = a = 1 n c b = 1 n d z c a z d b n c n d ( Z c ¯ + Z d ¯ )
In Equations (9) and (10), zce represents the carbon emissions of province e in region c, and Z c ¯ and Z d ¯ represent the mean value of the ECCEs of the provinces included in regions c and d.
Finally, we decomposed the overall Gini coefficient into three components—intra-regional disparity contribution Gw, inter-regional disparity contribution Gr, and hyperdisparity density contribution Gt—to measure the contribution of Gw, Gr, and Gt to the overall disparities. The specific formula is as follows:
G = G w + G r + G t
G w = c = 1 3 G c c p c s c
G r = c = 2 3 d = 1 c 1 G c d ( p c s d + p d s c ) D c d
G t = c = 2 3 d = 1 c 1 G c d ( p c s d + p d s c ) ( 1 D c d )
In Equations (12)–(14), p c = n c n , s c = n c Z c ¯ n Z ¯ , D c d = λ c d p c d λ c d + p c d , λcd, and pcd are the mathematical expectations of the sum of all the samples between regions c and d that satisfy zcazdb > 0 and zdbzca > 0, respectively.
λ c d = 0 d F c ( z ) 0 z ( z x ) d F h ( x )
p c d = 0 d F d ( z ) 0 z ( z x ) d F c ( x )

2.4. Geodetector

In this paper, we used factor detection and interaction detection in Geodetector to detect the strength of explaining the spatial differentiation of carbon emissions from China’s electricity consumption by each factor and the interaction of each factor in different study years.
The factor detector model is shown in Equation (17), and the q value ranges from 0 to 1. The higher the value of q, the greater the explanation of the factor on the spatial disparity in the ECCEs.
q = 1 i = 1 n N i σ i 2 N σ 2
In Equation (17), i is the classification number of the selected influence factor; Ni is the number of provinces in category i; N is the number of the study area, whose value in this paper is 30; σ i 2 is the variance in the ECCE of the whole study area; and σ 2 is the variance in the ECCE of all the provinces in category i.
The interaction detector was used to identify interactions between different influences, i.e., determine whether the combination of influences increased or decreased the explanation of the spatial disparities in the ECCEs compared to a single influence. The evaluation began with computing the q-values of the two effects X1 and X2 on carbon emissions q(X1) and q(X2), then calculating the q-value when they interacted (q(X1X2)), and then comparing q(X1), q(X2), and q(X1X2). The criteria for discriminating the results of interaction detection are shown in Table 3 below.

2.5. Selection of Impact Indicators

Based on previous studies and taking into account scientific nature and data availability, six indicators, namely, economic development (GDP), population density (PD), industrialization (IS), foreign direct investment (FDI), financial expenditure on science and technology (RD), and average years of education (AE), were selected as potential factors influencing the spatial pattern of China’s ECCEs in this study. Our theoretical basis for selecting the above variables as the influencing factors follows.
Economic Development (GDP): Since 2005, China’s economy has continued to proliferate, and China has become the second-largest economy in the world. Regional economic development consumes large amounts of energy, such as electricity, which causes an increase in carbon emissions [45]. Therefore, gross regional product was chosen to measure the GDP in this study.
Population Density (PD): People are the mainstay of all economic activity, and an increase in population size and density will lead to an increase in energy consumption, such as electricity, which will increase carbon emissions [46,47]. This paper measures PD as the ratio of permanent residents in each region to the administrative division’s area at the year’s end.
Industrialization (IS): Industry is a significant consumer of energy in the secondary sector and even in the national economy. China is in the process of industrialization, and industrial development relies heavily on energy sources such as electricity, which can increase carbon emissions [26]. This paper chooses the share of value added by the secondary industry in the regional GDP [48] to measure IS.
Foreign Direct Investment (FDI): Against the backdrop of economic globalization, China’s degree of openness to the outside world has been increasing, and the scale of foreign direct investment has been expanding year by year. While foreign direct investment has energized China’s economic development, it has also caused an increase in carbon emissions [49]. In this study, FDI is measured by the amount of foreign direct investment (ten thousand CNY).
Fiscal Expenditure on Science and Technology (RD): Increasing local fiscal expenditure on science and technology can increase the technological innovation capacity, which improves the efficiency of energy utilization, such as electricity, and promotes the use and development of clean energy, thereby improving carbon emissions [50]. This study uses the proportion of local fiscal science and technology expenditures to local fiscal general budget expenditures [51] to measure the RD.
Average Years of Education (AE): The increase in the average years of education of employed persons helps to improve efficiency in the use of resources, such as electricity, and moves the economy in a green direction, thus contributing to reducing carbon emissions [52]. This study uses the average number of years of schooling (in years) of workers at the end of the year in each province in China [53] to measure the AE.

2.6. Data Sources and Processing

Restricted to data availability, this study takes 30 provinces in China and sets the study period as 2005–2021. Most of the data used in measuring the ECCE came from the China Energy Statistical Yearbook and the China Statistical Yearbook, and the carbon emission coefficients for fuels came from Shan et al. [54]. Most of the data used to analyze the influencing factors came from the EPS data platform (http://www.epsnet.com.cn accessed on 3 March 2024), and the data used to calculate the average years of educationcame from the China Labor Force Survey. Using the Geodetector model required us to discretize the six influencing factors’ data using a natural breakpoint classification method.
In addition, because the natural breakpoint method and Geodetector model are based on cross-sectional data for analysis, in order to ensure the comprehensiveness of the research results as much as possible under the condition of limited space, this paper takes 2005 and 2021 as the initial and ending years, respectively. It ultimately selects the data of the four research years of 2005, 2010, 2015, and 2021 to conduct the spatial differentiation characterization and geodetection study of the carbon emissions from China’s electric power consumption. The years 2005 and 2021 are the starting and ending years of the study period, and 2010 and 2015 are the concluding years of the Eleventh and Twelfth Five-Year Plans for China’s national economic and social development, respectively, so it is of great practical significance to study China’s ECCEs in these four years.

3. Results and Analysis

3.1. Characteristics of Spatial Differentiation

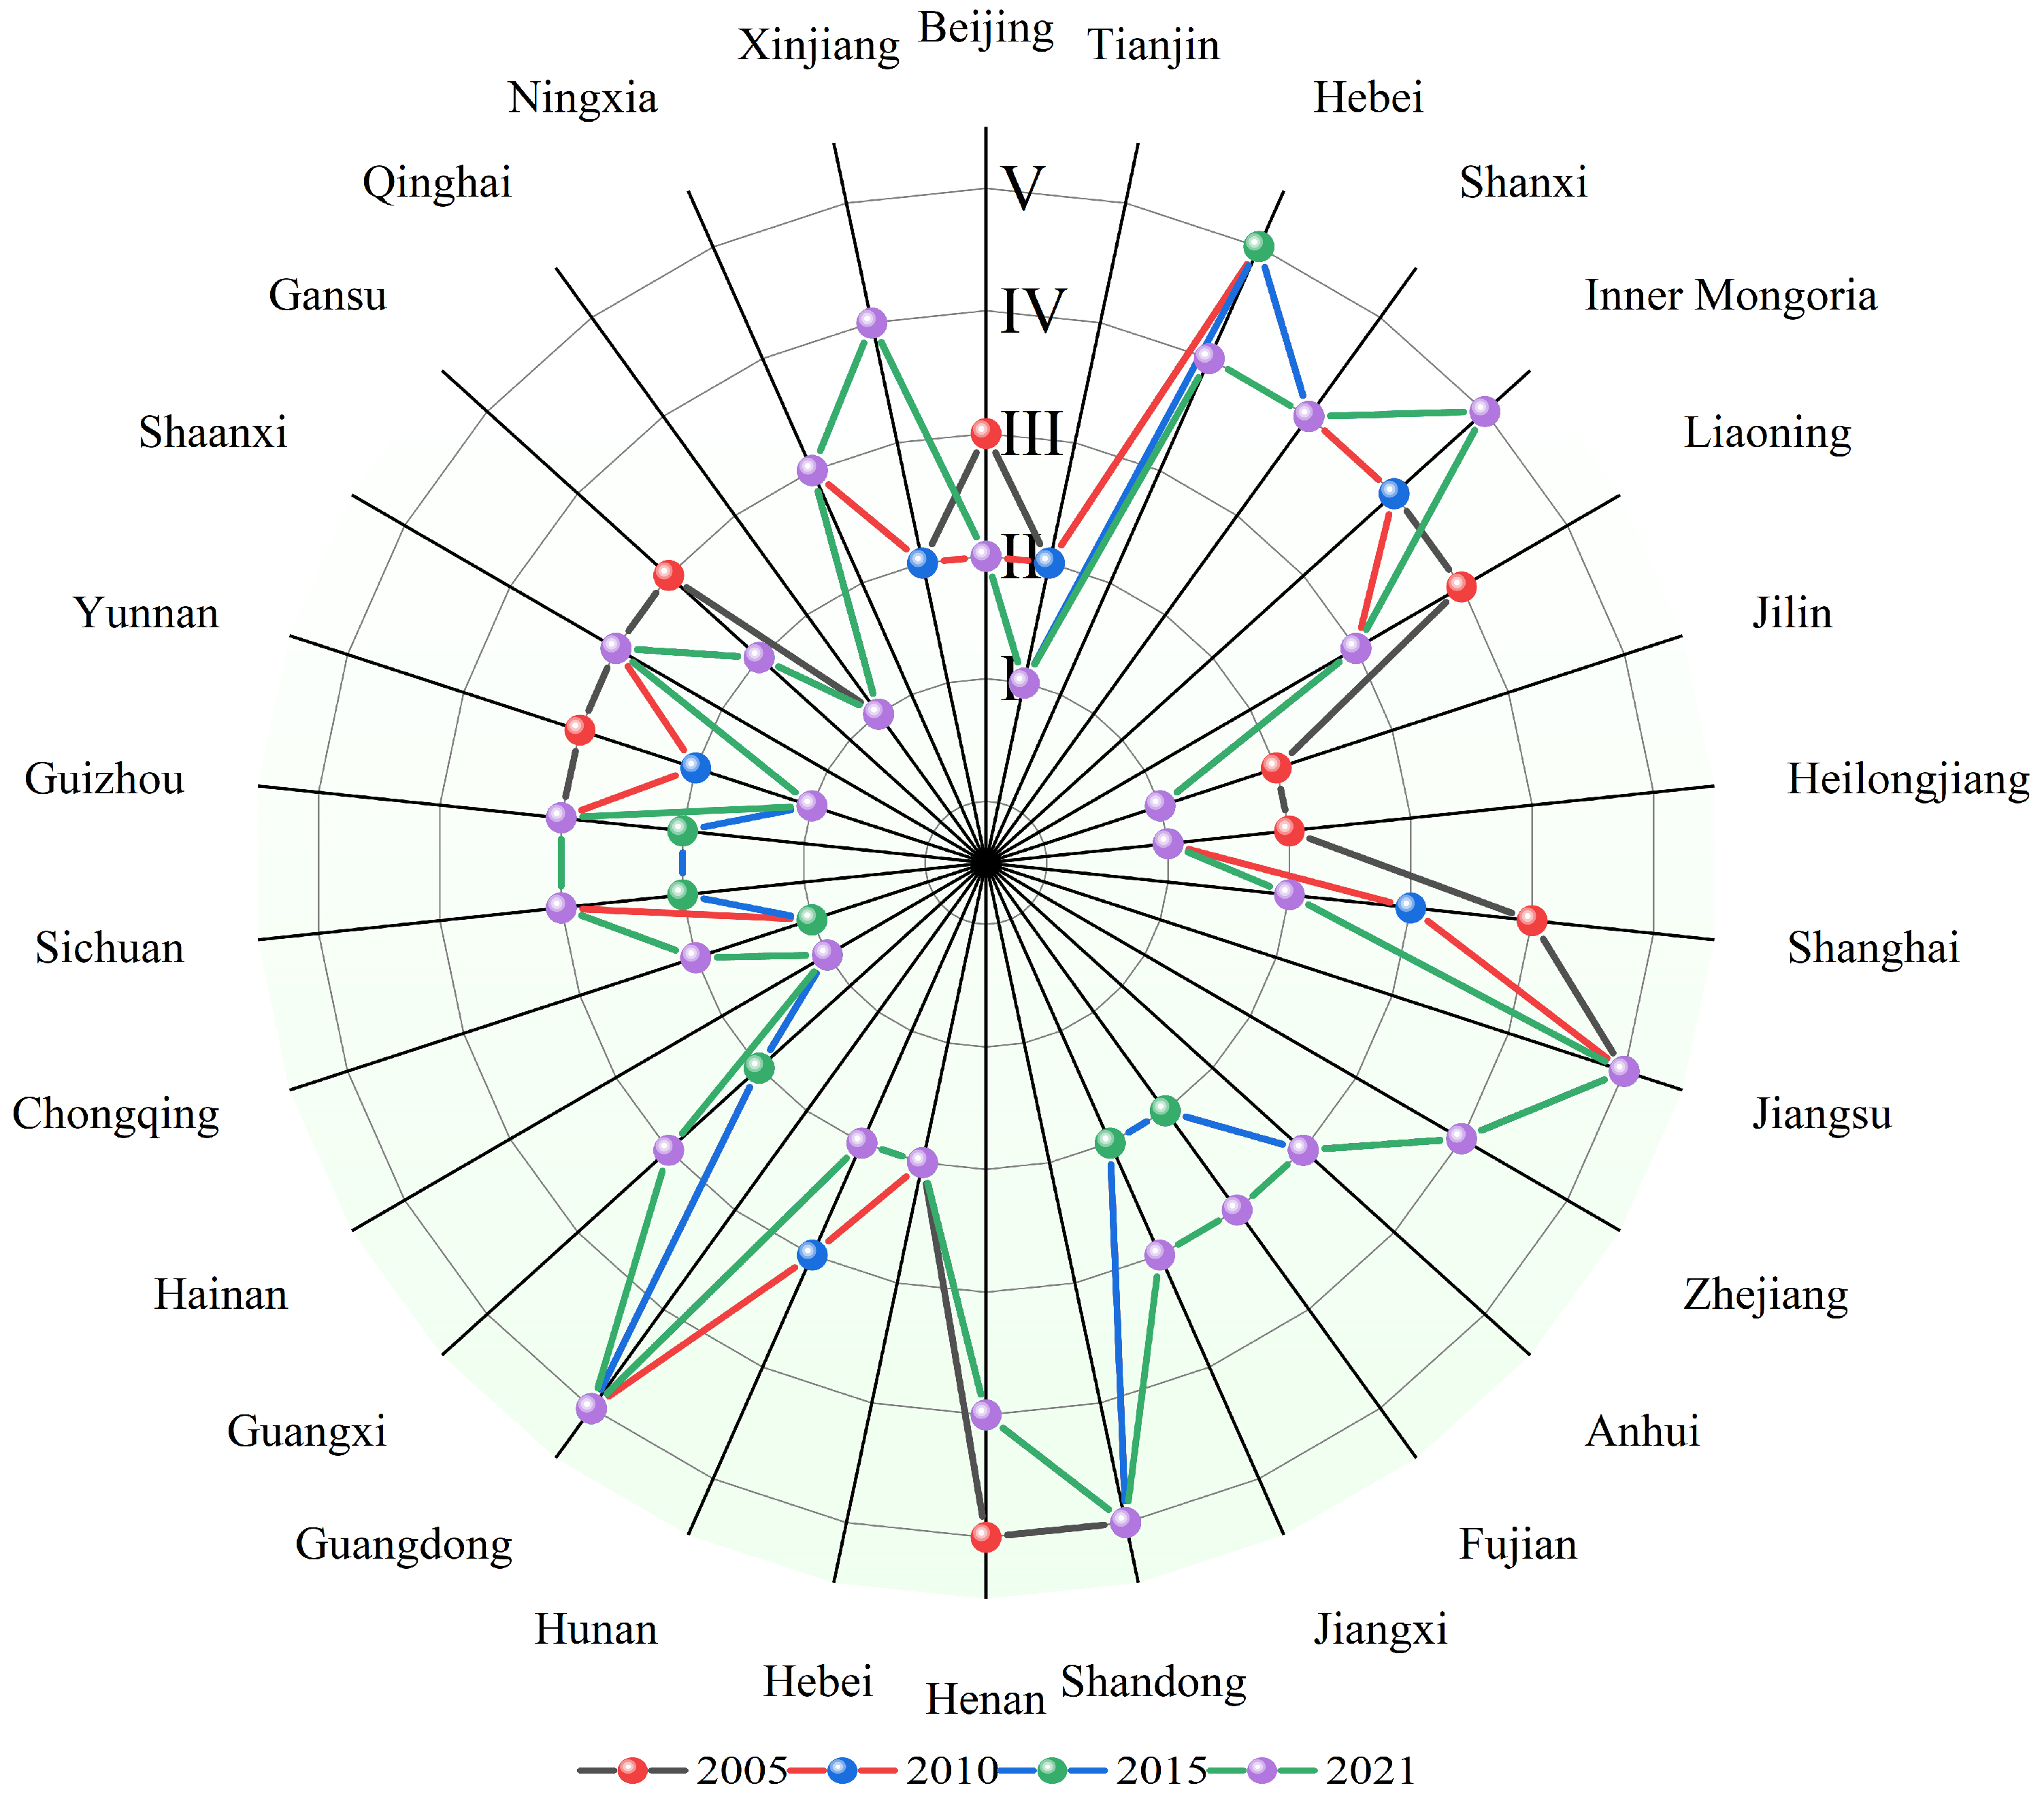
In this study, the ECCEs in 30 provinces of China were divided into five categories—namely, high-value area (V), higher-value area (Ⅳ), middle-value area (III), lower-value area (II), and low-value area (I)—by the natural breakpoint method in the ArcGIS 10.2 software. Then, the distribution of the ECCEs of China’s provinces for the four study years of 2005, 2010, 2015, and 2021 were plotted, as shown in Figure 1.
Since the ECCEs in China’s provinces are increasing yearly, the thresholds for the four study years differed, as did the provinces included in similar regions under the categorization of breakpoints. As it can be seen from Figure 1, China’s provincial-level ECCEs showed prominent spatial differentiation characteristics in all four study years. Shandong, Hebei, Shanxi, Henan, Inner Mongolia, Jiangsu, Zhejiang, and Guangdong belonged to zones with relatively high carbon emissions in the four study years. In particular, the provinces represented by Jiangsu, Shandong, and Guangdong were areas with high carbon emissions in the four study years mainly because these three provinces are among the top economic provinces in China, with well-developed industries, agriculture, and services, large populations, and a large total energy consumption, which directly or indirectly led to a massive increase in the ECCEs. Jilin, Heilongjiang, Fujian, Hainan, Hubei, Hunan, Jiangxi, Qinghai, Gansu, Chongqing, Yunnan, and Guangxi were zones with relatively low carbon emissions during the four study years. In particular, the provinces represented by Hainan and Qinghai were zones with low carbon emissions during the four study years mainly because of their underdeveloped economies, small populations, lack of industrial clusters, and low electricity consumption.
As shown in Figure 2, there are some fluctuations in the spatial differentiation characteristics of China’s ECCEs, and, in particular, the internal variability in the high-value and higher-value zones needs to be emphasized. The spatial differentiation pattern of the ECCE in 2005 included Hebei, Jiangsu, Shandong, and Guangdong in the high-value area and Shanxi, Inner Mongolia, Liaoning, Shanghai, and Zhejiang in the higher-value area. The range of high- and higher-value zones in 2010 remained mostly unchanged from the 2005 results, with Shanghai changing from a higher-value zone to a middle-value zone. In 2015, Xinjiang changed from a lower-value area to a higher-value area, and Inner Mongolia changed from a higher-value area to a high-value area. The pattern of spatial differentiation in 2021 remained broadly consistent with that of 2015. It is noteworthy that Xinjiang made a rapid leap from a relatively low-value area to a relatively high-value area during the study period, which was related to the rapid development of Xinjiang in the previous decade or so.

3.2. Regional Disparities and Their Decomposition

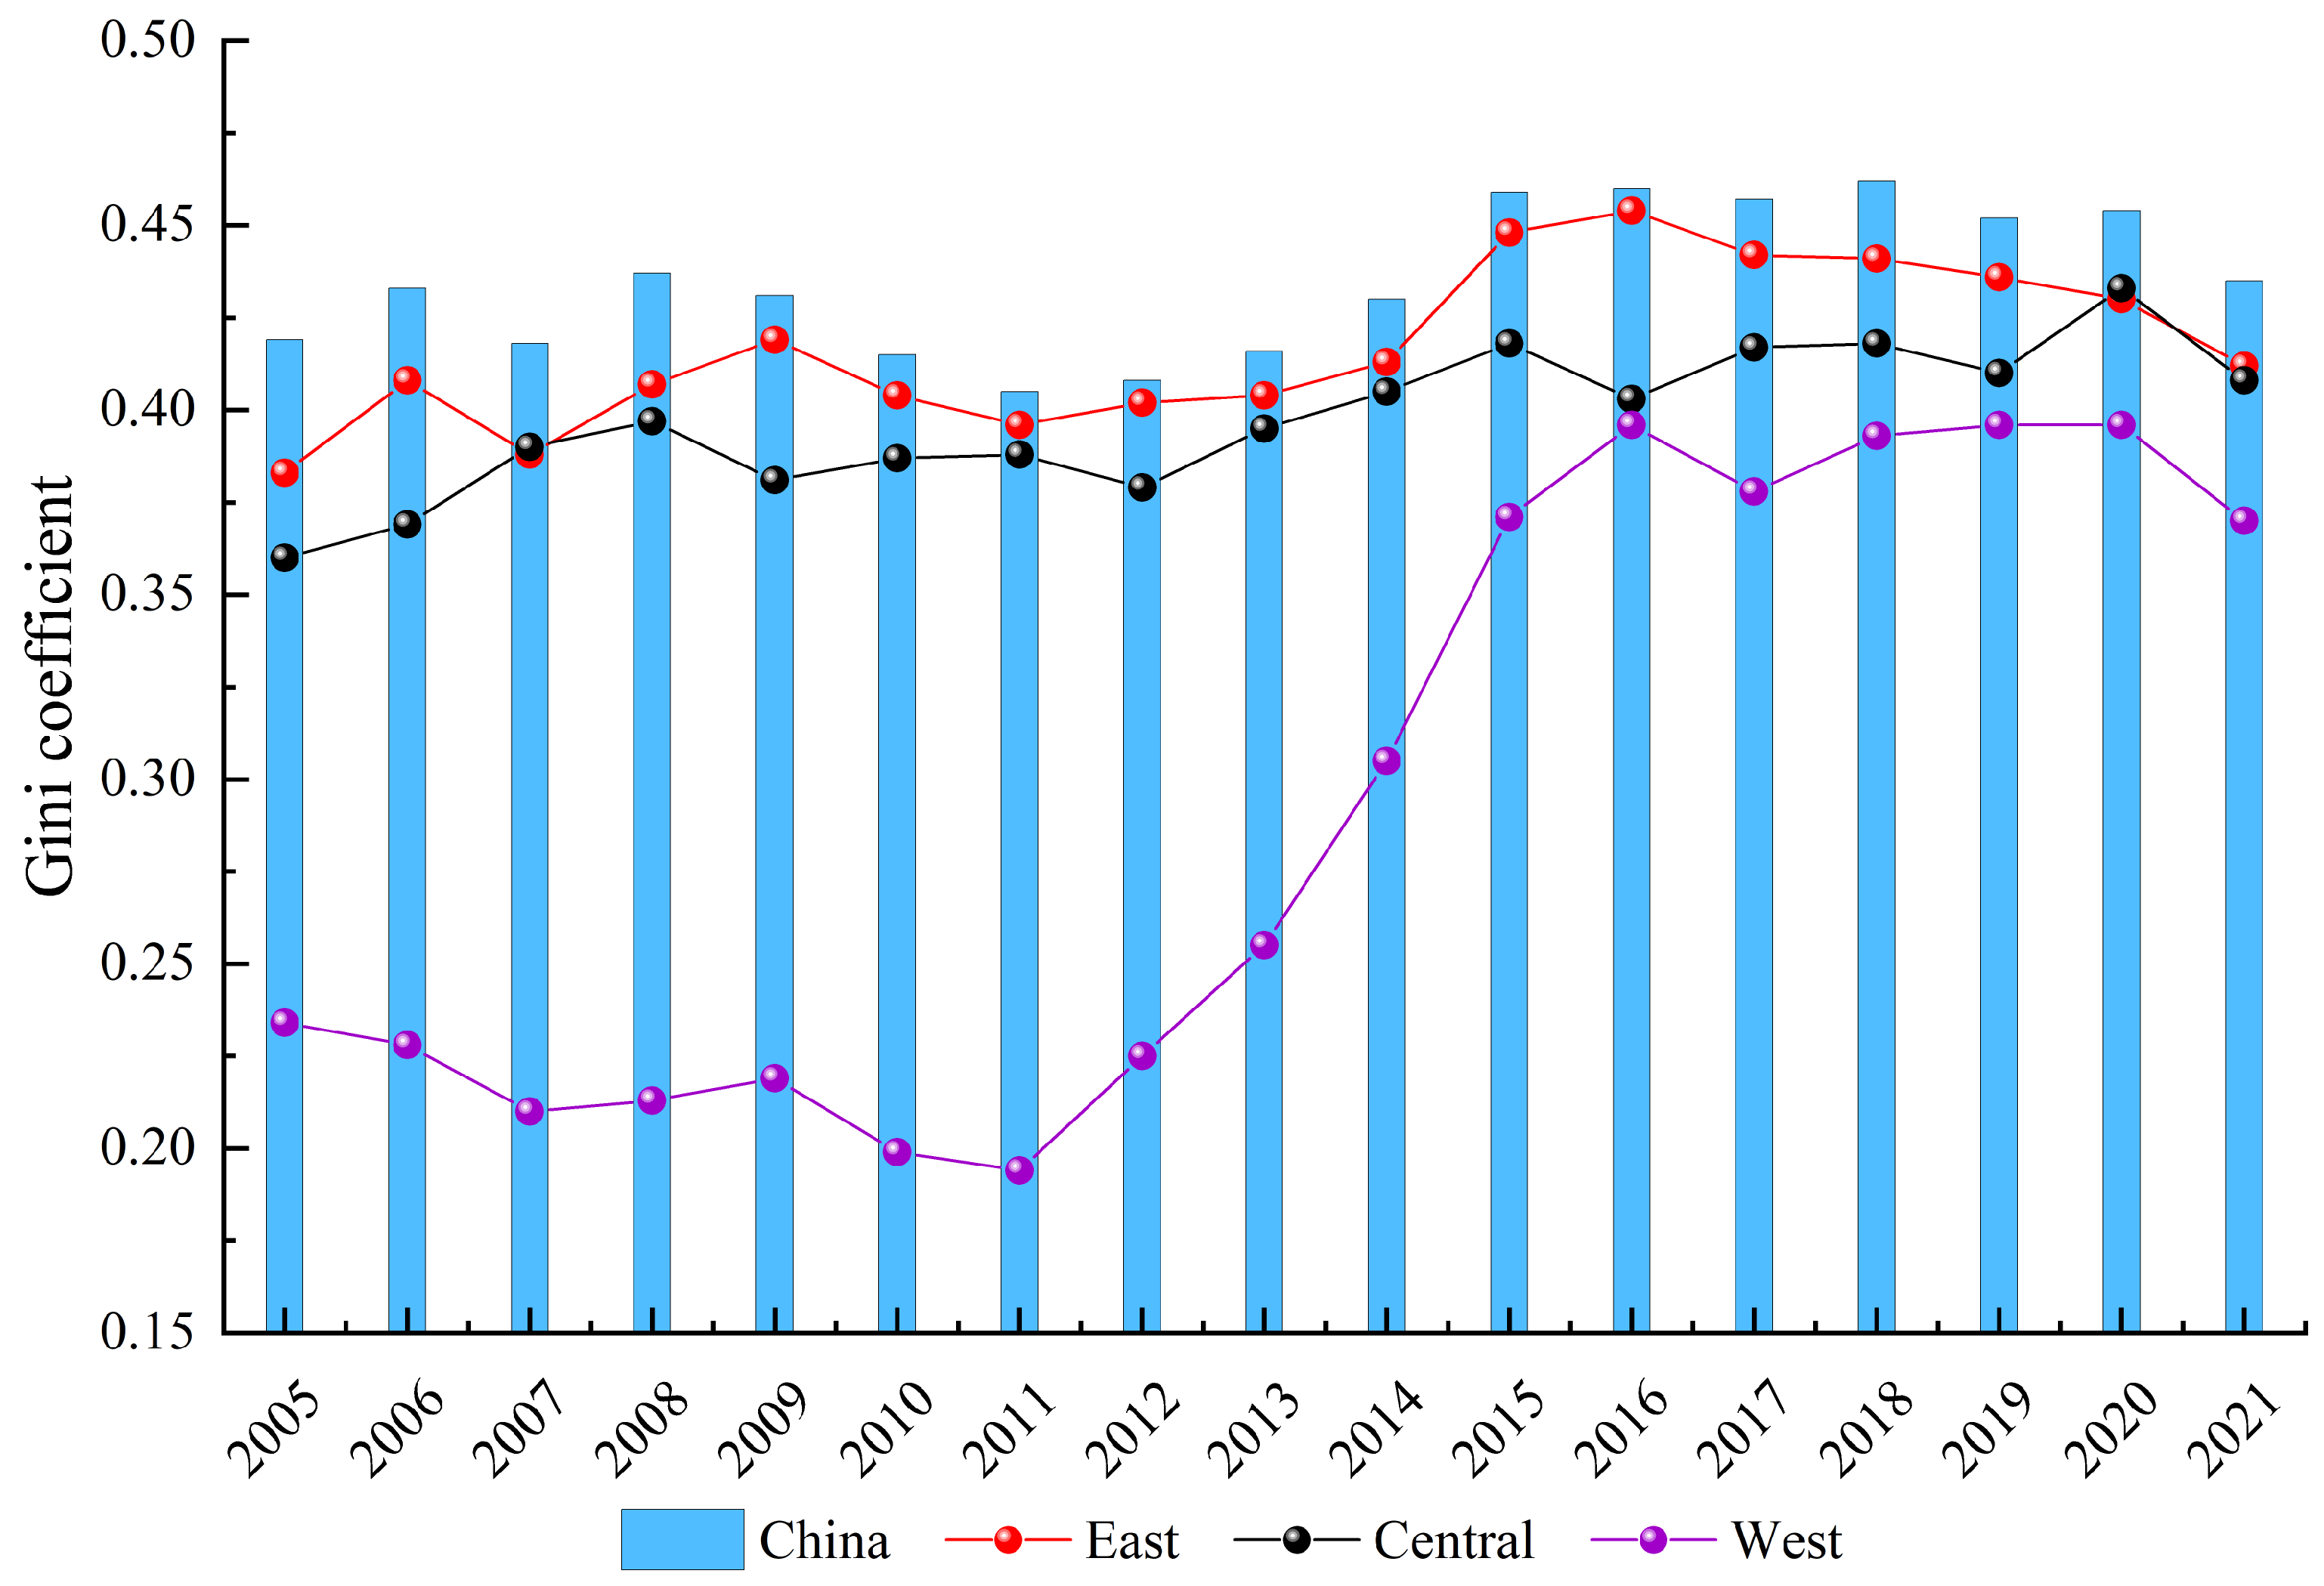
Figure 3 depicts the changes in the overall Gini coefficient and intra-regional Gini coefficients for the ECCEs in China from 2005 to 2021. The overall Gini coefficient shows a fluctuating upward trend, with an average annual growth rate of 0.28%. The overall Gini coefficient in 2021 (0.435) is higher than the overall Gini coefficient in 2005 (0.419), indicating that the overall difference in the ECCE in China is widening. For each specific region, the average values of the intra-regional Gini coefficients for the eastern, central, and western regions are 0.42, 0.40, and 0.29, respectively, implying that the eastern region has the most considerable intra-regional variation in ECCEs, followed by the central region, and the western region has the smallest variation. The intra-regional disparities in the three regions show different trends. The intra-regional disparities in the eastern region increased from 0.383 in 2005 to 0.412 in 2021, an overall increase of 7.57%, with an average annual increase of 0.53%. The intra-regional disparities in the central region increased from 0.360 in 2005 to 0.408 in 2021, with an overall increase of 13.33% and an average annual increase of 0.84%. The intra-regional variation in the western region increased from 0.234 in 2005 to 0.370 in 2021, with an overall increase of 58.12% and an average annual increase of 3.32%. It can be seen that the disparities in the ECCEs among the provinces within a region in the eastern, central, and western regions all showed an expanding trend, and the western region had the most significant magnitude and speed of expansion.
Figure 4 depicts the trend of the inter-regional Gini coefficient of the ECCEs in China. The most significant difference was between the eastern and western regions, with an inter-regional Gini coefficient mean of 0.50. The second-most-significant difference was between the eastern and western regions, with an inter-regional Gini coefficient mean of 0.434. The slightest difference was between the central and western regions, with an inter-regional Gini coefficient mean of 0.42. The disparities between the eastern and central regions and the central and western regions in 2005–2021 showed an overall widening trend, while the disparities between the eastern and western regions showed an overall narrowing trend.
Figure 5 illustrates the sources and contributions of regional disparities in the ECCEs in the three major regions of China. The average annual contributions of intra-regional variation (Gw), hypervariable density (Gt), and inter-regional variation (Gr) to the overall variation during the study period were 31.91%, 31.31%, and 36.78%, respectively, which implied that inter-regional variation was the largest source of overall variation. From the trends of the three, the contribution rate of Gw was relatively stable, essentially maintaining fluctuations within the range of 29.79–33.05%. The contribution rate of Gt showed a significant upward trend during the study period, rising from 24.17% in 2005 to 36.36% in 2021, with an average annual growth rate of 2.84%. The contribution rate of Gr showed a significant downward trend from 45.48% in 2005 to 30.98% in 2021, with an average annual decline rate of 2.19%. In summary, the overall disparities in the ECCEs in the three major regions of China were mainly attributed to inter-regional disparities. Therefore, narrowing the inter-regional gap should be a critical factor in promoting the carbon emission reduction process in terms of China’s power consumption.
Strengthening inter- and intra-regional mutual assistance regarding talent, technology, and resources and realizing synergistic low-carbon development in the region is crucial to effectively narrowing the gap in the ECCEs between regions. For example, Shanghai and other vital provinces in the eastern region should actively play the role of a central city, strengthen the economic and technological radiation to neighboring regions, and improve the economic level of neighboring provinces while reducing the disparities in the carbon emission levels within the region. The eastern region should give full play to its advantages in high technology and channel technical talents towards the central and western regions to provide the necessary support for the industrial development and upgrading of the central and western regions. The western region is rich in green power resources; therefore, as an important hub between the east and central regions, the western region can increase the transmission of green power to the central and eastern provinces in the case of new energy power transmission channels continuing to be broadened, having a significant positive effect on carbon emission reduction in the sender and recipient provinces.

3.3. Factors Influencing Spatial Differentiation in ECCEs in China

3.3.1. Analysis of Factor Detection Results

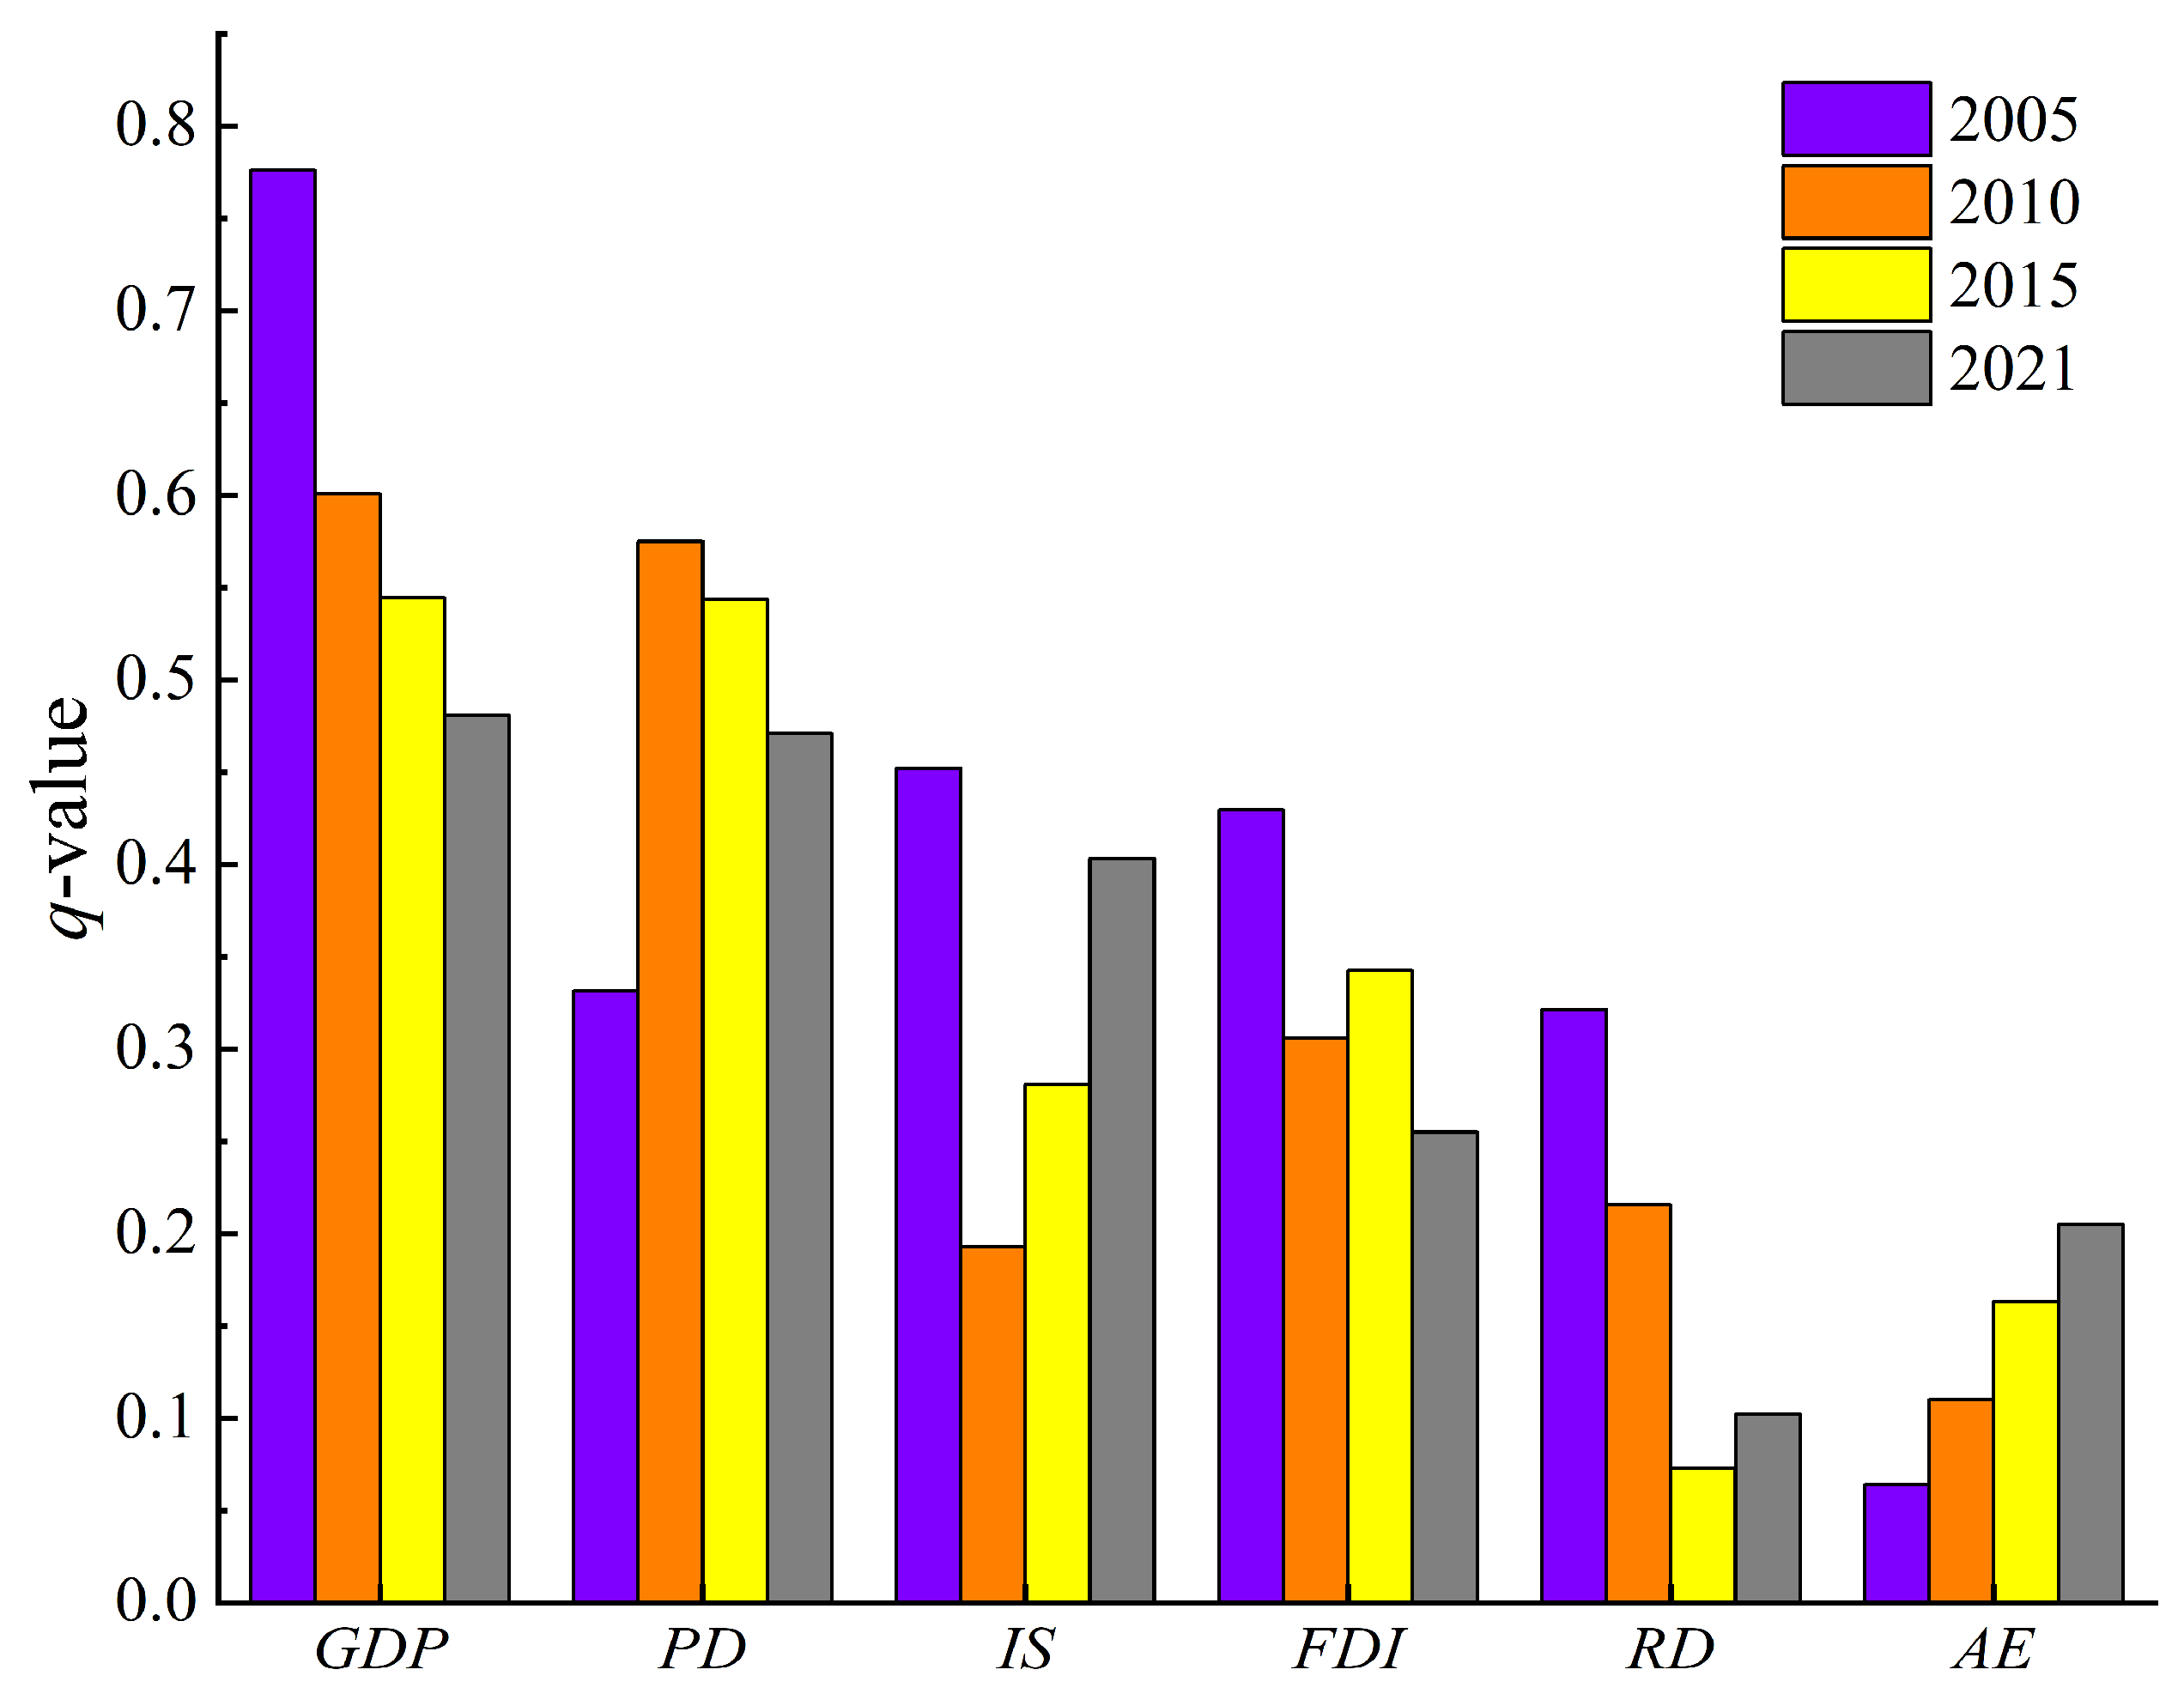
The results of factor detection for the four study years are shown in Figure 6. In 2005, among the six influencing factors, the GDP had the most significant influence on the spatial divergence in carbon emissions from China’s electricity consumption. Its q-value was as high as 0.776, followed closely by IS (0.452), FDI (0.430), PD (0.331), RD (0.322), and AE (0.064). The results of the factor probes in 2010 when compared with 2005 showed that the influence of the PD on the spatial differentiation in carbon emissions from China’s electricity consumption rose to second place that year. Its q-value was 0.575, second only to economic development (0.601). The influence of IS declined more significantly and ranked fifth that year, and the influence of the six influencing factors was ranked as follows: GDP > PD > FDI > RD > IS > AE. In 2015, the influence of AE on the spatial divergence in carbon emissions from China’s electricity consumption surpassed that of RD. It came in fifth place, with a q-value of 0.163, and the influence of the six influencing factors was ranked as GDP > PD > FDI > IS > AE > RD. In 2021, the influence of IS on the spatial differentiation in carbon emissions from China’s electricity consumption surpassed that of FDI and came in third place. The order of influence of the six influencing factors was GDP > PD > IS > FDI > AE > RD. The above analysis shows that the factors have had different impacts on the spatial differentiation in carbon emissions from China’s electricity consumption in different years.
(1) Economic Development (GDP). The q-value of the GDP was the largest in all four study years, indicating that the GDP had the most significant influence on the spatial differentiation in carbon emissions from China’s electricity consumption in all four study years. It is worth noting that the influence of economic development on the spatial differentiation in carbon emissions from China’s electricity consumption gradually decreased in the four study years. However, it was still the most critical factor influencing the spatial differentiation in carbon emissions from China’s electricity consumption. Since the reform and opening up, China’s GDP has been expanding at a high rate, while, at the same time, electricity consumption has been rising, and the ECCEs have also been increasing. However, since 2010, China’s economic development has entered a medium-to-high-speed growth phase, during which China’s economic transformation has intensified, and economic development has become more focused on high quality. High-quality economic development has led to intensive urban development and a gradual increase in residents’ awareness of environmental protection, which has played a role in slowing down the rate of carbon emissions. Taking Guangdong, Zhejiang, Jiangsu, Shandong, and other typical provinces with relatively high levels of economic development as examples, the growth rates in electricity consumption in these four provinces in 2005 were 15.48%, 15.66%, 21.10%, and 18.35%, respectively, and the growth rates in electricity consumption in the period from 2005 to 2021 showed a general downward trend, and fell to 13.76%, 14.26%, 11.44%, and 6.21%, respectively, by 2021. Although economic development maintains a certain degree of rigidity in terms of electricity demand, dependence on electricity gradually decreases.
(2) Population Density (PD). The mean value of the q-value of population density (0.480) ranked second among all the influencing factors, indicating that population density significantly influenced the spatial differentiation in the ECCEs in China. Provinces with high population densities, as represented by Beijing, Tianjin, and Shanghai, have high levels of urbanization and require large amounts of electricity consumption for industries such as industrial production and commercial services, which, coupled with the more intensive lifestyles and energy activities in these cities and the centralized supply of electricity and heating in high-rise buildings and public transport, have a high energy demand, in particular, electricity, which leads to high carbon emissions on the consumption side of the electricity spectrum. It is worth noting that the influence of population density jumped from fourth place in 2005 to second place in 2010 and remained in second place in the last three cross-sections of this study, indicating that the influence of population density on the spatial differentiation in the carbon emissions of China’s electric power consumption in the last three years of this study had become more significant than that in 2005.
(3) Industrialization (IS). The mean value of the q-value of industrialization (0.332) ranked fourth among all the influencing factors, indicating that industrialization had some influence on the spatial differentiation in ECCEs in China. The advancement of industrialization requires the consumption of large quantities of electricity and other energy sources, coupled with the fact that the consumption of electricity by the industry is at the top of the list of all industrial sectors; industrialization is, therefore, closely linked to the ECCE. The ECCEs in industrialized provinces, as represented by Shandong, Guangdong, Jiangsu, and Hebei, were consistently high. In contrast, carbon emissions in provinces with a weak industrial base, such as Qinghai, Gansu, and Hainan, were consistently low. It is worth noting that the order of influence of industrialization on the spatial divergence in ECCEs in China in the four study years was second, fifth, fourth, and third, respectively.
(4) Foreign Direct Investment (FDI). The mean value of the q-value of foreign direct investment (0.333) ranked third among all the influencing factors, indicating that foreign direct investment had some influence on the spatial differentiation in the carbon emissions from China’s electricity consumption. With the deepening of the reform and opening up, foreign-invested enterprises entered China’s market, and the amount of foreign investment continued to grow, including foreign investment in most industries in manufacturing, coupled with a lower threshold for entry, so foreign investment and this concurrent continuous expansion further exacerbated the consumption of electricity and other energy sources. The provinces in China with relatively high levels of foreign investment have long stabilized in the coastal regions of Guangdong, Zhejiang, Jiangsu, Shanghai, and Shandong, which also had relatively high ECCEs in our study periods. Notably, the impact of FDI was ranked third in the first three study years and fourth in 2021.
(5) Financial Science and Technology Expenditure (RD). The mean value of the q-value of financial science and technology expenditures (0.203) ranked fifth among all the influencing factors, indicating that financial science and technology expenditures had a weak influence on the spatial differentiation in carbon emissions from China’s electricity consumption. In recent years, the Chinese government has continued to increase its fiscal expenditure on science and technology, placing it among the highest in the world. In order to promote local innovation and scientific and technological development, the Chinese government has increased its support in terms of its fiscal expenditure on science and technology, encouraging localities to formulate and implement scientific and technological innovation policies and promoting the enhancement of local innovation capacity. Beijing, Shanghai, and other provinces have relatively high financial, scientific, and technological expenditures. Their electric energy utilization efficiency is relatively high. However, these provinces had relatively low carbon emissions from electric power consumption, and there was a mismatch between financial expenditures on science and technology and carbon emissions, so the influence of financial, scientific, and technological expenditures was weaker.
(6) Average Years of Education (AE). The mean of the q-value of average years of education (0.136) ranked last among all the factors, indicating that the average years of education weakly influenced the spatial differentiation in carbon emissions from China’s electricity consumption. As the people of China become increasingly affluent and the education level of employed people rises, the utilization rate of electricity and other resources will increase. In places such as Beijing and Shanghai, where the average years of education are relatively high but the carbon emissions from electricity are relatively low, there is a mismatch between the average years of education and carbon emissions. Hence, the influence of the average years of education in our study was weak.

3.3.2. Interaction of Factors

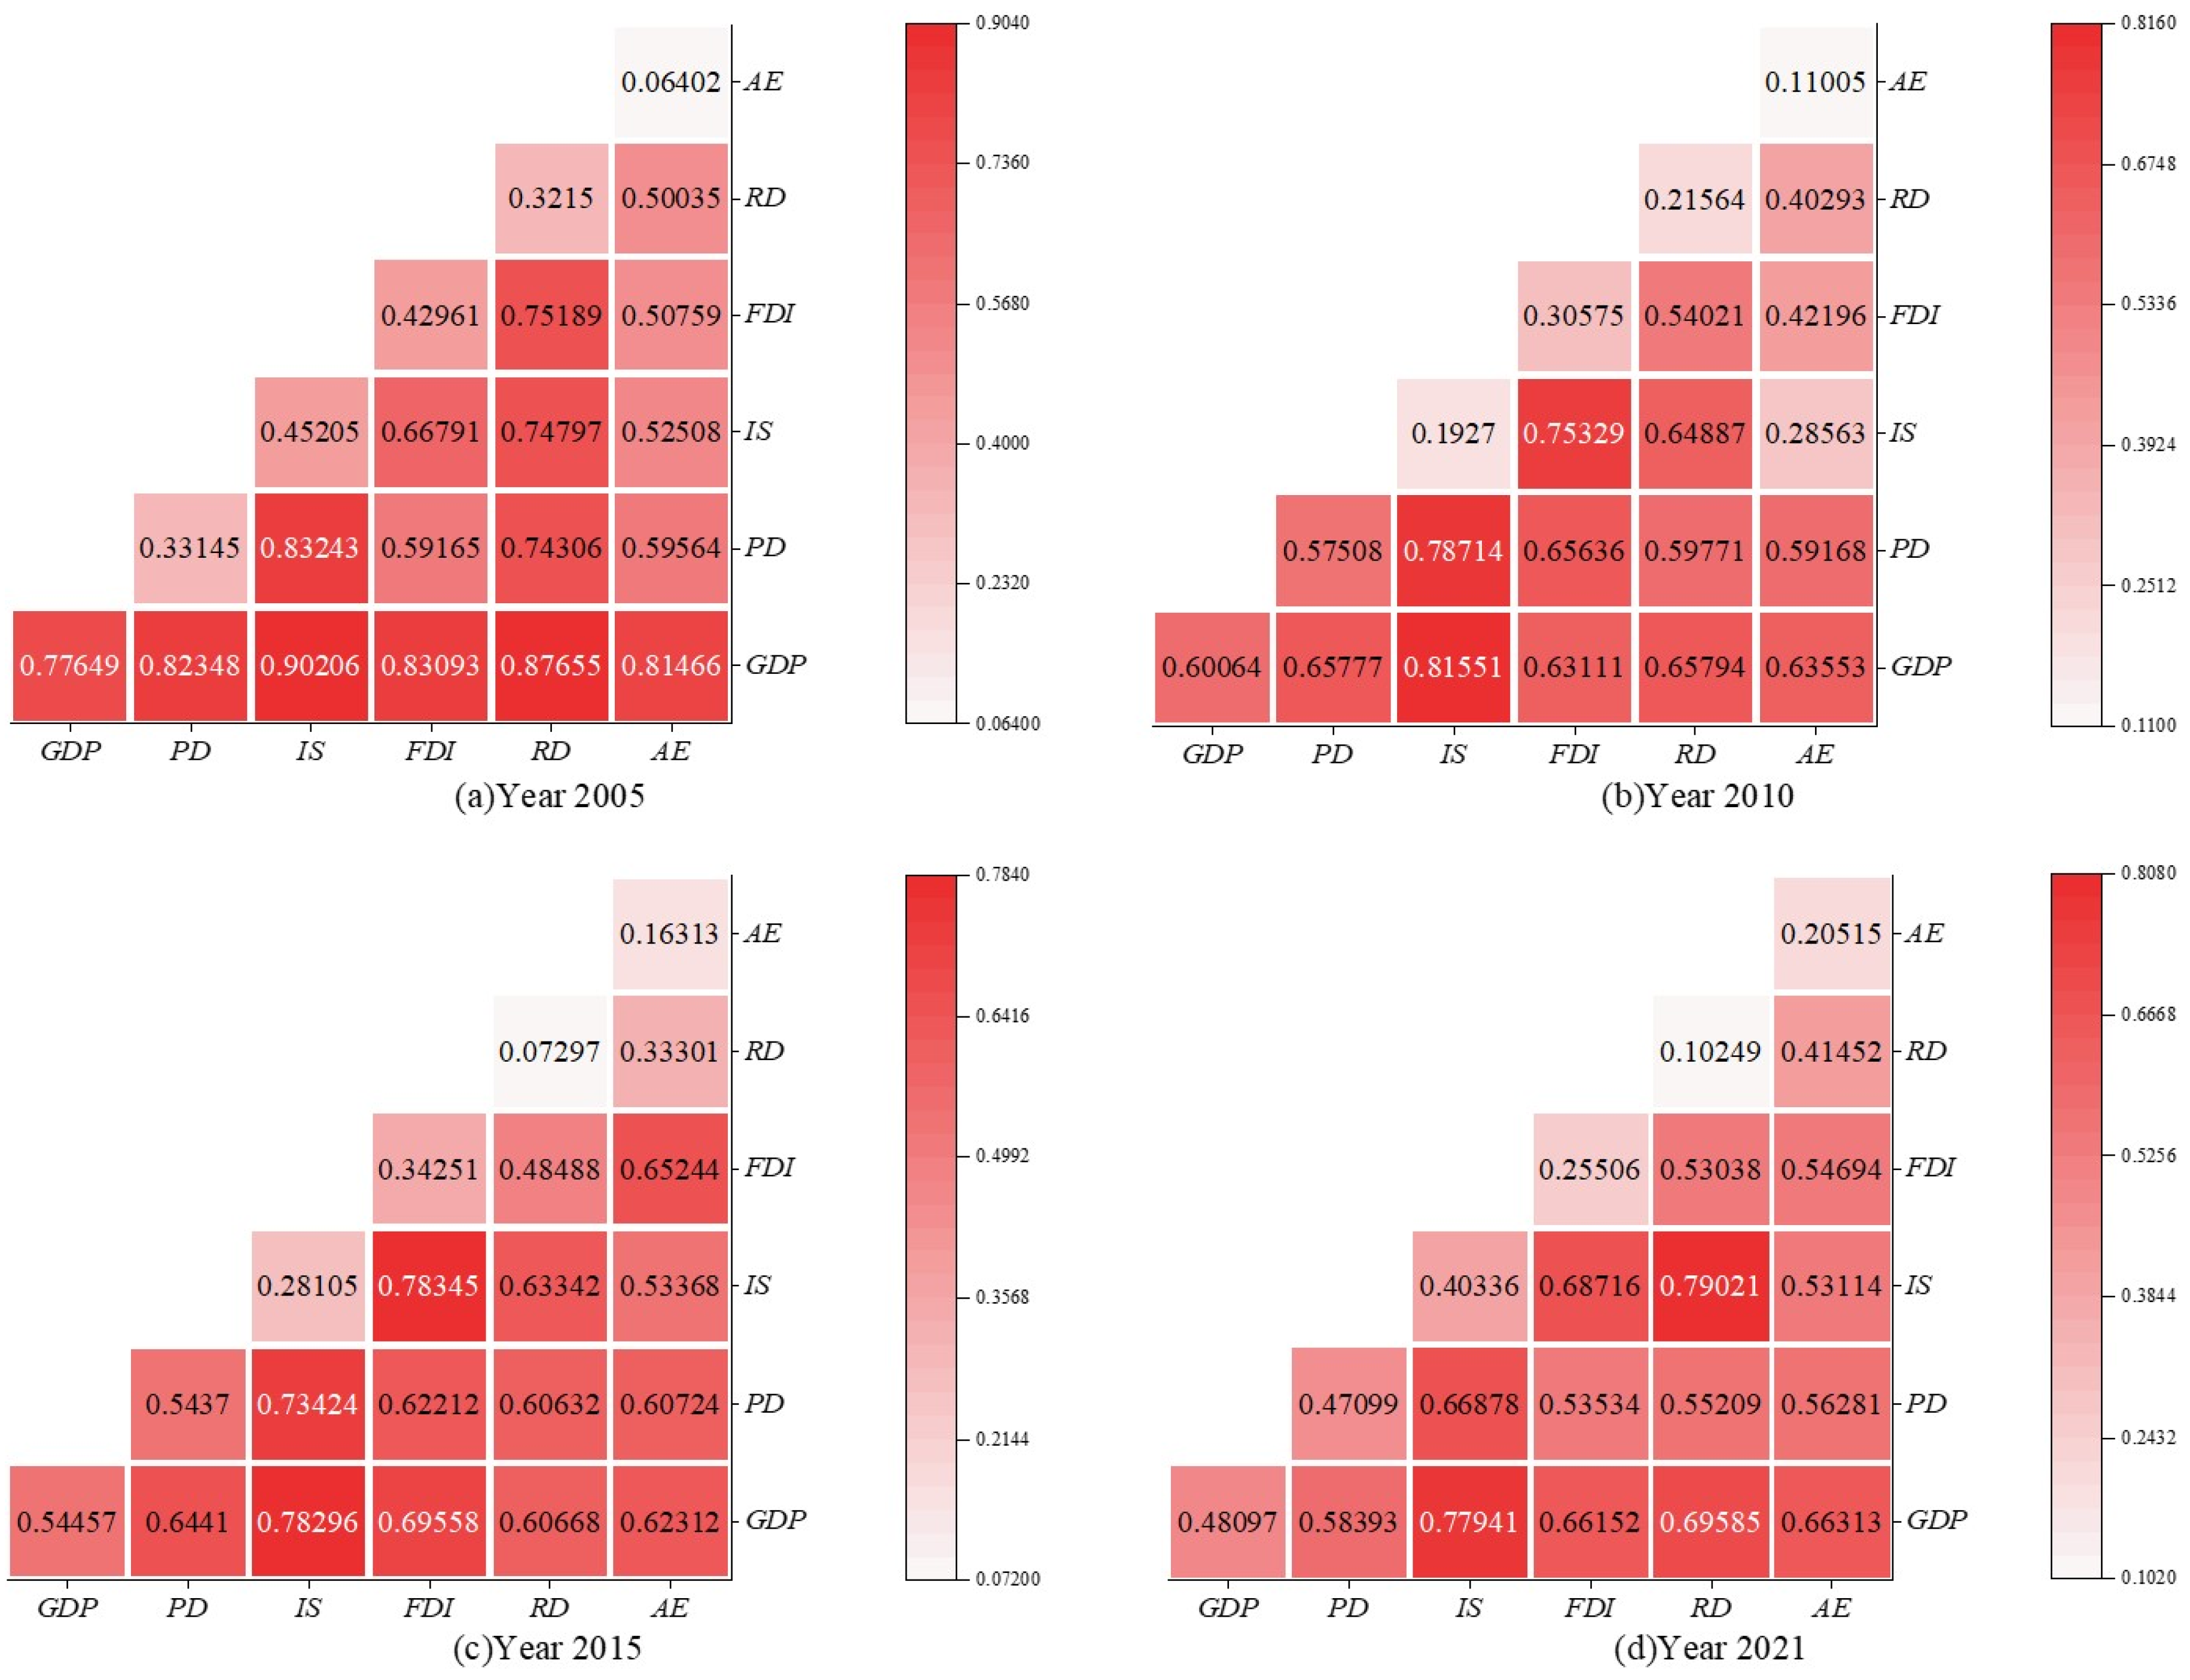
Figure 7 presents the q-values of the interaction factors formed by the superimposition of the six impact factors in a two-by-two space over the four study years. Taken together, the q-values of each pair of interaction factors are more significant than those of a single factor in all the sample cross-sections, and the interactions between the detected factors show a two-way enhancement or a nonlinear enhancement, indicating that the interaction of each influence factor has a more significant impact on the spatial differentiation in the carbon emissions of China’s electric power consumption than that of a single influence factor.
Specifically, the values of q(GDP∩IS), q(PD∩IS), q(IS∩FDI), and q(IS∩RD) were relatively high in all the studied years, which indicated that the four factors—namely, GDP, PD, FDI, and RD—had an essential influence on the spatial differentiation in the carbon emissions of China’s electric power consumption when they separately interacted with IS. Among the above key interaction factors, the values of q(GDP∩IS) and q(PD∩IS) were always at the top in the four study years, which indicated that these two pairs of interaction factors had a strong influence on the spatial differentiation in the ECCEs in China. The value of q(IS∩FDI) kept increasing in the first three study years, and IS∩FDI became the most influential interaction factor in 2015, but the influence of IS∩FDI decreased in 2021. q(IS∩RD) showed a fluctuating upward trend in the four study years, and IS∩RD became the most influential interaction factor in 2021. It is worth noting that the GDP, which had the most decisive influence, interacted with the other factors to enhance the influence on the spatial differentiation in the carbon emissions from China’s electricity consumption in all the study years. The influence of RD and AE was relatively weak in the four study years. However, RD and AE enhanced their influence on the spatial differentiation in the carbon emissions from China’s electricity consumption after interacting with other factors. This also illustrated that certain factors only have some influence on the ECCE when they are synergized with other factors.
To summarize, the spatial differentiation in China’s ECCEs in a specific study year was the result of the joint action of various factors in that year, and the influence of the interaction of various factors on the spatial differentiation in China’s ECCEs increased significantly and changed with time.

4. Discussion

This paper used a Geodetector model to study the factors influencing the spatial differentiation in the ECCE in China. The factor detection study found that economic development and population density significantly influenced the spatial differentiation in the ECCE in China. Industrialization and foreign direct investment had some influence on the spatial differentiation in the ECCE in China. The results of this study were generally consistent with the results of other scholars’ analyses [45,46,47,49,55,56]. Previous studies have been limited to discussing the effects of individual factors on electricity carbon emissions but have yet to consider the effects of interactions among the influencing factors on electricity carbon emissions. The interaction detector used in this study addressed the shortcomings of previous studies. The interaction detection study found that some factors with average or low influence enhanced their influence on the spatial differentiation in carbon emissions from China’s electricity consumption after interacting with other factors. Therefore, the combined influence of multiple factors must be considered when formulating carbon emission reduction policies on the consumption side of electricity.
Due to the limitations of space, data, and methodology, this study still needs to be optimized:
(1)
This paper measured ECCEs in provincial areas, which are relatively large in scale, and the conclusions and policy recommendations are weakly applicable in city and county areas. However, considering the availability of data, this paper still adopted provincial data for its study, and, in future studies, it could dig deeper into the data of cities and even counties to conduct more detailed research.
(2)
There are many factors affecting the spatial differentiation in the carbon emissions from China’s electric power consumption, and this paper only selected six influencing factors to analyze the factors influencing the carbon emissions from China’s electric power consumption. In future research, we can consider introducing more quantifiable and reliable potential influencing factors into the Geodetector model for research and analysis to provide more ideas for formulating China’s electric power low-carbon development policy.
(3)
This paper detected influencing factors such as economic development and population density in each province of China. However, the specific correlation between the ECCE and the influencing factors is not yet clear, and other models have to be applied to explore this in subsequent studies.

5. Conclusions

This study measured the ECCE at the provincial level in China considering consumer responsibility, analyzed the spatial and temporal disparities in the ECCE in China using the natural breakpoint method and the Dagum Gini coefficient, and analyzed the influencing factors and their interactions on the spatial differentiation in the ECCE in China through the Geodetector model. The main findings of this study are as follows:
(1)
The ECCEs at the provincial level in China showed significant spatial differentiation across the four study years. The Shandong, Hebei, Jiangsu, and Guangdong provinces were high-value carbon emission zones, and Qinghai and Hainan provinces were low-value carbon emission zones. Xinjiang and Inner Mongolia gradually became higher-value or high-value carbon emission areas.
(2)
The overall difference in the ECCEs among China’s three major regions increased during the study period. Disparities in the ECCEs were most significant among the provinces in the eastern region, followed by the central region, and they were smallest in the western region. The most significant disparities were found between the eastern and western regions, followed by those between the eastern and central regions, and the smallest were between the central and western regions. The inter-regional disparities in the carbon emissions from China’s electricity consumption were the largest source of overall disparities.
(3)
Economic development, population density, industrialization, and foreign direct investment (FDI) strongly influenced the spatial differentiation in the carbon emissions from China’s electricity consumption over the four study years. In addition, after the interaction of each influencing factor, the influence on the spatial differentiation in the carbon emissions from China’s electricity consumption was more significant than that of a single influencing factor. It is worth noting that economic development had the most significant impact as the key influencing factor in all four study years. Industrialization had an essential influence on the spatial differentiation in the ECCE in China after interacting with other influencing factors.

6. Policy Recommendations

Based on the above conclusions, this paper proposes the following policy recommendations, which aim to reduce the carbon emissions from China’s electricity consumption and contribute to the achievement of the “dual-carbon” goal:
(1)
In promoting the process of reducing carbon emissions from the consumption side of electricity, the Chinese government should adhere to the leading role of narrowing the gap in the ECCEs among provinces and regions, promoting coordination and cooperation among regional governments, promoting cross-regional technology exchange and experience sharing, and accelerating the popularization and application of renewable energy power generation and energy efficiency technologies throughout the country. Local governments can encourage local power companies to increase the share of renewable energy in power generation by formulating relevant energy policies, such as increasing renewable energy subsidies and carbon emission standards, to reduce carbon emissions at the source [57]. At the same time, each province should consider its carbon emission situation and regional development characteristics and choose a low-carbon emission reduction model that suits the development reality and reflects the regional characteristics according to local conditions.
(2)
Chinese provinces, especially Shandong, Jiangsu, Guangdong, and Hebei, that have high carbon emission levels from electricity consumption need to reconcile population density, industrialization, foreign direct investment, and economic development. If the existing energy consumption structure remains stable for a long time, we should gradually change the crude economic development mode of high energy consumption and high emission, improve energy efficiency and reduce energy consumption at the same time, promote the agglomeration of capital, talents, technology, and other factors by urbanization, promote the transformation and upgrading of industry from resource-intensive to technology-intensive, actively develop the tertiary industry, and increase the absorption capacity of high-quality, high-technology, low-pollution, low-energy consumption green FDI to promote the progress of energy-saving technology and the upgrading of our industrial structure. This would reduce the ECCE while systematically optimizing population density, industrialization, foreign direct investment, and economic development.

Author Contributions

P.X.: conceptualization, methodology, supervision, and writing—review and editing; S.W.: formal analysis, data curation, and writing—original draft; J.L.: methodology and writing—review and editing; F.S.: supervision and writing—review and editing. All authors have read and agreed to the published version of the manuscript.

Funding

This research was supported by the Shanghai Social Science Planning General Project (Grant No. 2018BGL019).

Institutional Review Board Statement

Not applicable.

Informed Consent Statement

Not applicable.

Data Availability Statement

The datasets used during the current study are available from the corresponding author upon reasonable request.

Conflicts of Interest

Author Jie Liao was employed by the company State Grid Hunan Provincial Electric Power Co., Ltd. Zhuzhou Power Supply Company. The remaining authors declare that the research was conducted in the absence of any commercial or financial relationships that could be construed as a potential conflict of interest.

References

  1. Mathew, M.D. Nuclear energy: A pathway towards mitigation of global warming. Prog. Nucl. Energy 2022, 143, 104080. [Google Scholar] [CrossRef]
  2. Raihan, A.; Ibrahim, S.; Muhtasim, D.A. Dynamic impacts of economic growth, energy use, tourism, and agricultural productivity on carbon dioxide emissions in Egypt. World Dev. Sustain. 2023, 2, 100059. [Google Scholar] [CrossRef]
  3. Raihan, A. An econometric evaluation of the effects of economic growth, energy use, and agricultural value added on carbon dioxide emissions in Vietnam. Asia-Pac. J. Reg. Sci. 2023, 7, 665–696. [Google Scholar] [CrossRef]
  4. Gao, P.; Yue, S.; Chen, H. Carbon emission efficiency of China’s industry sectors: From the perspective of embodied carbon emissions. J. Clean. Prod. 2021, 283, 124655. [Google Scholar] [CrossRef]
  5. Gür, T.M. Carbon dioxide emissions, capture, storage and utilization: Review of materials, processes and technologies. Prog. Energy Combust. Sci. 2022, 89, 100965. [Google Scholar]
  6. Teng, F.; Wang, P. The evolution of climate governance in China: Drivers, features, and effectiveness. Environ. Politics 2021, 30 (Suppl. S1), 141–161. [Google Scholar] [CrossRef]
  7. Yang, P.; Peng, S.; Benani, N.; Dong, L.; Li, X.; Liu, R.; Mao, G. An integrated evaluation on China’s provincial carbon peak and carbon neutrality. J. Clean. Prod. 2022, 377, 134497. [Google Scholar] [CrossRef]
  8. Wei, Y.M.; Chen, K.; Kang, J.N.; Chen, W.; Wang, X.Y.; Zhang, X. Policy and management of carbon peaking and carbon neutrality: A literature review. Engineering 2022, 14, 52–63. [Google Scholar] [CrossRef]
  9. Wang, Y.; Chen, H.; Long, R.; Sun, Q.; Jiang, S.; Liu, B. Has the sustainable development planning policy promoted the green transformation in China’s resource-based cities? Resour. Conserv. Recycl. 2022, 180, 106181. [Google Scholar] [CrossRef]
  10. Xie, P.; Shu, Y.; Sun, F.; Pan, X. Enhancing the accuracy of China’s electricity consumption forecasting through economic cycle division: An MSAR-OPLS scenario analysis. Energy 2024, 293, 130618. [Google Scholar] [CrossRef]
  11. Fang, T.; Fang, D.; Yu, B. Carbon emission efficiency of thermal power generation in China: Empirical evidence from the micro-perspective of power plants. Energy Policy 2022, 165, 112955. [Google Scholar] [CrossRef]
  12. Wei, W.; Zhang, P.; Yao, M.; Xue, M.; Miao, J.; Liu, B.; Wang, F. Multi-scope electricity-related carbon emissions accounting: A case study of Shanghai. J. Clean. Prod. 2020, 252, 119789. [Google Scholar] [CrossRef]
  13. Cai, L.; Duan, J.; Lu, X.; Luo, J.; Yi, B.; Wang, Y.; Wang, L. Pathways for electric power industry to achieve carbon emissions peak and carbon neutrality based on LEAP model: A case study of state-owned power generation enterprise in China. Comput. Ind. Eng. 2022, 170, 108334. [Google Scholar] [CrossRef]
  14. Fan, F.; Wang, Y.; Liu, Q. China’s carbon emissions from the electricity sector: Spatial characteristics and interregional transfer. Integr. Environ. Assess. Manag. 2022, 18, 258–273. [Google Scholar] [CrossRef] [PubMed]
  15. Xie, P.; Yang, F.; Mu, Z.; Gao, S. Influencing factors of the decoupling relationship between CO2 emission and economic development in China’s power industry. Energy 2020, 209, 118341. [Google Scholar] [CrossRef]
  16. Wang, J.; Li, Z.; Wu, T.; Wu, S.; Yin, T. The decoupling analysis of CO2 emissions from power generation in Chinese provincial power sector. Energy 2022, 255, 124488. [Google Scholar] [CrossRef]
  17. Li, W.; Long, R.; Zhang, L.; He, Z.; Chen, F.; Chen, H. Greenhouse gas emission transfer of inter-provincial electricity trade in china. Int. J. Environ. Res. Public Health 2020, 17, 8375. [Google Scholar] [CrossRef]
  18. Zhang, P.; Cai, W.; Yao, M.; Wang, Z.; Yang, L.; Wei, W. Urban carbon emissions associated with electricity consumption in Beijing and the driving factors. Appl. Energy 2020, 275, 115425. [Google Scholar] [CrossRef]
  19. Scarlat, N.; Prussi, M.; Padella, M. Quantification of the carbon intensity of electricity produced and used in Europe. Appl. Energy 2022, 305, 1179. [Google Scholar] [CrossRef]
  20. Chen, L.; Xu, L.; Xia, L.; Wang, Y.; Yang, Z. Decomposition of residential electricity-related CO2 emissions in China, a spatial-temporal study. J. Environ. Manag. 2022, 320, 115754. [Google Scholar] [CrossRef]
  21. Li, Y.; Yang, X.; Du, E.; Liu, Y.; Zhang, S.; Yang, C.; Liu, C. A review on carbon emission accounting approaches for the electricity power industry. Appl. Energy 2024, 359, 122681. [Google Scholar] [CrossRef]
  22. He, Y.; Xing, Y.; Zeng, X.; Ji, Y.; Hou, H.; Zhang, Y.; Zhu, Z. Factors influencing carbon emissions from China’s electricity industry: Analysis using the combination of LMDI and K-means clustering. Environ. Impact Assess. Rev. 2022, 93, 106724. [Google Scholar] [CrossRef]
  23. Karmellos, M.; Kosmadakis, V.; Dimas, P.; Tsakanikas, A.; Fylaktos, N.; Taliotis, C.; Zachariadis, T. A decomposition and decoupling analysis of carbon dioxide emissions from electricity generation: Evidence from the EU-27 and the UK. Energy 2021, 231, 120861. [Google Scholar] [CrossRef]
  24. Noorpoor, A.R.; Kudahi, S.N. CO2 emissions from Iran’s power sector and analysis of the influencing factors using the stochastic impacts by regression on population, affluence and technology (STIRPAT) model. Carbon Manag. 2015, 6, 101–116. [Google Scholar] [CrossRef]
  25. Cui, H.; Zhao, T.; Wu, R. CO2 emissions from China’s power industry: Policy implications from both macro and micro perspectives. J. Clean. Prod. 2018, 200, 746–755. [Google Scholar] [CrossRef]
  26. Wen, L.; Yan, F. Regional differences and influencing factors in the CO2 emissions of China’s power industry based on the panel data models considering power-consuming efficiency factor. Environ. Dev. Sustain. 2018, 20, 1987–2007. [Google Scholar] [CrossRef]
  27. Wang, X.; Li, M. The spatiotemporal characteristic of carbon emissions from China’s power sector and its determinants: A spatial econometric analysis. Pol. J. Environ. Stud. 2019, 28, 3919–3927. [Google Scholar] [CrossRef] [PubMed]
  28. Sun, X.; Lian, W.; Gao, T.; Chen, Z.; Duan, H. Spatial-temporal characteristics of carbon emission intensity in electricity generation and spatial spillover effects of driving factors across China’s provinces. J. Clean. Prod. 2023, 405, 136908. [Google Scholar] [CrossRef]
  29. Lian, Y.; Lin, X.; Luo, H.; Zhang, J.; Sun, X. Distribution characteristics and influencing factors of household consumption carbon emissions in China from a spatial perspective. J. Environ. Manag. 2024, 351, 119564. [Google Scholar] [CrossRef]
  30. Liu, J.; Li, S.; Ji, Q. Regional differences and driving factors analysis of carbon emission intensity from transport sector in China. Energy 2021, 224, 120178. [Google Scholar] [CrossRef]
  31. Wang, G.; Liao, M.; Jiang, J. Research on agricultural carbon emissions and regional carbon emissions reduction strategies in China. Sustainability 2020, 12, 2627. [Google Scholar] [CrossRef]
  32. Ma, T.; Liu, Y.; Yang, M. Spatial-temporal heterogeneity for commercial building carbon emissions in China: Based the Dagum Gini Coefficient. Sustainability 2022, 14, 5243. [Google Scholar] [CrossRef]
  33. Wang, L.; You, J. An integrated perspective on the spatial–temporal characteristics of China’s manufacturing carbon emissions at the regional and industry levels. Energy Rep. 2023, 10, 1688–1701. [Google Scholar] [CrossRef]
  34. Xu, L.; Du, H.; Zhang, X. Driving forces of carbon dioxide emissions in China’s cities: An empirical analysis based on the geodetector method. J. Clean. Prod. 2021, 287, 125169. [Google Scholar] [CrossRef]
  35. Zhu, C.; Dong, S.; Sun, Y.; Wang, M.; Dong, P.; Xu, L. Driving factors of spatial–temporal difference in China’s transportation sector carbon productivity: An empirical analysis based on Geodetector method. Environ. Sci. Pollut. Res. 2023, 30, 30656–30671. [Google Scholar] [CrossRef] [PubMed]
  36. Wang, J.F.; Xu, C.D. Geodetector: Principle and prospective. Acta Geogr. Sin. 2017, 72, 116–134. [Google Scholar]
  37. Chen, C.; Bi, L. Study on spatio-temporal changes and driving factors of carbon emissions at the building operation stage—A case study of China. Build. Environ. 2022, 219, 109147. [Google Scholar] [CrossRef]
  38. Guo, Q.; Lai, X.; Jia, Y.; Wei, F. Spatiotemporal Pattern and Driving Factors of Carbon Emissions in Guangxi Based on Geographic Detectors. Sustainability 2023, 15, 15477. [Google Scholar] [CrossRef]
  39. Wang, K.L.; Xu, R.Y.; Zhang, F.Q.; Cheng, Y.H. Reinvestigating the spatiotemporal differences and driving factors of urban carbon emission in China. Front. Environ. Sci. 2022, 10, 880527. [Google Scholar] [CrossRef]
  40. Xu, J. Study on spatiotemporal distribution characteristics and driving factors of carbon emission in Anhui Province. Sci. Rep. 2023, 13, 14400. [Google Scholar] [CrossRef]
  41. Xie, P.; Sun, B.; Liu, L.; Xie, Y.; Yang, F.; Zhang, R. China’s power industry’s carbon emission intensity in the context of carbon peaking and carbon neutrality: Measurement and regional difference. Int. J. Clim. Change Strateg. Manag. 2023, 15, 264–281. [Google Scholar] [CrossRef]
  42. Jenks, G.F. The data model concept in statistical mapping. Int. Yearb. Cartogr. 1967, 7, 186–190. [Google Scholar]
  43. Zhao, L.D.; Wu, D. Carbon emission accounting and spatial heterogeneity pattern of China’s energy supply side. China Popul. Resour. Environ. 2018, 28, 48–58. [Google Scholar]
  44. Zhang, L.; Ma, X.; Ock, Y.S.; Qing, L. Research on regional differences and influencing factors of Chinese industrial green technology innovation efficiency based on dagum gini coefficient decomposition. Land 2022, 11, 122. [Google Scholar] [CrossRef]
  45. Liao, C.; Wang, S.; Fang, J.; Zheng, H.; Liu, J.; Zhang, Y. Driving forces of provincial-level CO2 emissions in China’s power sector based on LMDI method. Energy Procedia 2019, 158, 3859–3864. [Google Scholar] [CrossRef]
  46. Yan, D.; Lei, Y.; Li, L. Driving factor analysis of carbon emissions in China’s power sector for low-carbon economy. Math. Probl. Eng. 2017, 2017, 4954217. [Google Scholar] [CrossRef]
  47. Wei, H.; Zhan, T.; Yi, Z.; Shuo, W.; Yan, L. A Study on the Drivers of Carbon Emissions in China’s Power Industry Based on an Improved PDA Method. Systems 2023, 11, 495. [Google Scholar] [CrossRef]
  48. Gao, S.; Zhang, X.; Chen, M. Spatiotemporal dynamics and driving forces of city-level CO2 emissions in China from 2000 to 2019. J. Clean. Prod. 2022, 377, 134358. [Google Scholar] [CrossRef]
  49. Wang, D.; Zhang, Y.; Zou, Z. How asymmetric is the response of CO2 emissions to economic restructuring in China? Evidence from NARDL approach. J. Clean. Prod. 2023, 423, 138836. [Google Scholar] [CrossRef]
  50. Zhu, Y.; Liu, Z.; Feng, S.; Lu, N. The role of fiscal expenditure on science and technology in carbon reduction: Evidence from provincial data in China. Environ. Sci. Pollut. Res. 2022, 29, 82030–82044. [Google Scholar] [CrossRef]
  51. Qi, S.; Lin, S. The influencing factors on the carbon emission of electric power industry: An empirical study based on Yangtze Economic Belt spatial dynamic panel. J. Environ. Econ. 2016, 1, 91–105. [Google Scholar]
  52. Cui, Y.; Wei, Z.; Xue, Q.; Sohail, S. Educational attainment and environmental Kuznets curve in China: An aggregate and disaggregate analysis. Environ. Sci. Pollut. Res. 2022, 29, 45612–45622. [Google Scholar] [CrossRef] [PubMed]
  53. Zhao, L.; Jia, B.; Hu, M. The Impact of Human Capital on Carbon Emission Density in Chinese Provincial Based on the Spatial Econometric Analysis. Popul. Dev. 2014, 20, 2–10. [Google Scholar]
  54. Shan, Y.; Guan, D.; Zheng, H.; Ou, J.; Li, Y.; Meng, J.; Zhang, Q. China CO2 emission accounts 1997–2015. Sci. Data 2018, 5, 170201. [Google Scholar] [CrossRef] [PubMed]
  55. Wu, X.; Xu, C.; Ma, T.; Xu, J.; Zhang, C. Carbon emission of China’s power industry: Driving factors and emission reduction path. Environ. Sci. Pollut. Res. 2022, 29, 78345–78360. [Google Scholar] [CrossRef] [PubMed]
  56. Yan, Q.; Wang, Y.; Baležentis, T.; Streimikiene, D. Analysis of China’s regional thermal electricity generation and CO2 emissions: Decomposition based on the generalized Divisia index. Sci. Total Environ. 2019, 682, 737–755. [Google Scholar] [CrossRef]
  57. Peng, Q.; Liu, W.; Zhang, Y.; Zeng, S.; Graham, B. Generation planning for power companies with hybrid production technologies under multiple renewable energy policies. Renew. Sustain. Energy Rev. 2023, 176, 113209. [Google Scholar] [CrossRef]
Figure 1. Spatial differentiation pattern of China’s ECCEs, 2005–2021.
Sustainability 16 04128 g001
Figure 2. Natural breakpoint partitioning of China’s ECCEs, 2005–2021.
Sustainability 16 04128 g002
Figure 3. Overall Gini coefficient and intra-regional Gini coefficient of China’s ECCEs, 2005–2021.
Sustainability 16 04128 g003
Figure 4. Variations in inter-regional Gini coefficient of China’s ECCEs.
Sustainability 16 04128 g004
Figure 5. Origins and contributions of regional disparities in China’s ECCEs.
Sustainability 16 04128 g005
Figure 6. Factor detection results.
Sustainability 16 04128 g006
Figure 7. Interaction detection results of years (a) 2005, (b) 2010, (c) 2015, and (d) 2021.
Sustainability 16 04128 g007
Table 1. Definition of variables in Equations (2)–(4).
VariableDefinition
KnElectricity generation efficiency by province in year n
SnEfficiency of electricity use in each province in year n
ECVEquivalent value of electricity, generally taken as 0.1229 kgcc/kWh
EEVnEquivalent value of electricity in each province in year n
FCk,nConsumption of fossil fuel k in thermal power generation by province in year n
RkConversion standard coal factor for fossil fuel k
TPnThermal power generation by province in year n
GDPnGross domestic product (GDP) of provinces in year n
YPnElectricity consumption by province in year n
BnMaximum value of GDPn/YPn among 30 provinces in year n
Table 2. Definition of the variables in Equations (6) and (7).
VariableDefinition
EFICniCarbon emission factor for electricity consumption in province i in year n
GEniTotal electricity generation in province i in year n
EOniTotal electricity transferred from province i for consumption in other provinces in year n
(GEniEOni)Total electricity consumption in province i in year n
θniShare of ECCEs in direct carbon emissions from electricity in province i in year n
PniDirect carbon emissions from electricity generation in province i in year n
g≠iGEngTotal electricity generation in provinces other than province i
ERniTotal electricity transferred from other provinces for consumption in province i in year n
Table 3. Interaction detection results’ discriminating criteria.
Basis of JudgmentInteraction
q(X1X2) < Min(q(X1), q(X2))Nonlinear weakening
Min(q(X1), q(X2)) < q(X1X2) < Max(q(X1), q(X2))One-factor nonlinear enhancement
q(X1X2) > Max(q(X1), q(X2))Two-factor enhancement
q(X1X2) = q(X1) + q(X2)Standalone
q(X1X2) > q(X1) + q(X)2Nonlinear enhancement
Disclaimer/Publisher’s Note: The statements, opinions and data contained in all publications are solely those of the individual author(s) and contributor(s) and not of MDPI and/or the editor(s). MDPI and/or the editor(s) disclaim responsibility for any injury to people or property resulting from any ideas, methods, instructions or products referred to in the content.