Article

Functional-Combination-Based Comprehensive Benefit Evaluation of Energy Storage Projects under Source-Grid-Load Scenarios via Super-Efficiency DEA

School of Economic and Management, Chang Sha University of Science and Technology, Changsha 410114, China
*
Author to whom correspondence should be addressed.
Sustainability 2024, 16(10), 4278; https://doi.org/10.3390/su16104278
Submission received: 11 March 2024 / Revised: 6 May 2024 / Accepted: 16 May 2024 / Published: 19 May 2024

Abstract

:
As an important support for power systems with high penetration of sustainable energy, the energy storage system (ESS) has changed the traditional model of simultaneous implementation of electricity production and consumption. Its installed capacity under the source-grid-load scenario is rising year by year, contributing to sustainable development, but it faces the problems of insufficient utilization and benefits. This study analyzes the functional combination of ESS under source-grid-load scenarios. A comprehensive benefit evaluation method of energy storage projects (ESPs), based on a fuzzy decision-making trial and evaluation laboratory (DEMATEL) and super-efficiency data envelopment analysis (DEA), is proposed. Firstly, the functional requirements of energy storage in source-grid-load scenarios are explored, and the characteristics of various functions are analyzed to form eight functional combination schemes. Secondly, index modeling is carried out from three aspects—the whole life cycle cost, functional combination benefits, and social and environmental benefits—and a comprehensive benefit evaluation index system of ESP is proposed. Then, the intuitionistic trapezoidal fuzzy number (ITFN) is combined with DEMATEL to form an effective analysis method for the input–output relationship of the indices, and the comprehensive evaluation is realized based on the SE-DEA model. Compared with other methods, this model can ensure the objectivity and stability of the evaluation results in ESP evaluation. Finally, the effectiveness of the proposed evaluation method and the rationality of the functional combination are verified under source-grid-load scenarios. The calculation results show that in the application scenario of source-grid-load, after adopting the functional combination scheme formulated in this article, the comprehensive investment benefits of ESPs have been improved. Moreover, the source side effect is at its best, with an efficiency value of 2.209.

1. Introduction

The ESS is becoming increasingly important to sustainable development. It can facilitate the integration and utilization of sustainable energy, enhance the reliability and stability of energy supply, conserve energy resources, and meet the energy needs of remote areas. Through the application of energy storage technology, the transition to sustainable energy in the energy sector can be promoted, reducing reliance on traditional non-renewable energy sources and achieving long-term development of sustainable energy [1]. These characteristics make it an important tool to improve the flexibility, economy, and safety of new power system. However, the current application scenario of energy storage technology is single and the utilization rate is low. In 2022, the China Electricity Council released the “Research Report on the Operation of Sustainable Energy Distribution and Energy Storage”, which shows that the average equivalent utilization coefficient of electrochemical ESPs in China in 2022 was 12.2%, while the utilization rate of sustainable energy distribution energy storage systems (ESS) was only 6.1% [2]. The data above indicate that the application and potential benefits of multiple functions of energy storage technology in different scenarios have not been excavated completely. Moreover, in the first half of 2023, the low utilization rate of the ESS still exists, as the average daily operation of the ESPs configured by sustainable energy power stations is 2.05 h, which only reaches 27% of the average design utilization hours of the power stations [3]. The current ESPs only consider some of the functions, or only focus on the application of the power grid side, which only renders individual or limited benefits, thus failing to fully consider the comprehensive benefits of the ESS in various application scenarios. Therefore, taking into account multiple functional combinations and considering multiple application scenarios of energy storage on source-grid-load sides for energy storage operation planning can be used as a way to make full use of energy storage and improve project benefits.
In order to verify the role of functional combination in the benefit improvement of ESPs, a scientific comprehensive benefit evaluation can be carried out with regard to the aspects of economy, society, and environment. In terms of economic benefits, the planning method was used to establish the cost calculation model of energy storage power stations and the income calculation model including source-grid-load sides in [4,5,6,7]. In terms of index system, a hierarchical evaluation system of battery energy storage technology was constructed from these three aspects of technology, economy, and environment in [8,9], but its economic analysis was relatively simple. In terms of evaluation algorithm, the intuitive trapezoidal fuzzy number was combined with TOPSIS to form a comprehensive evaluation method in [10]. A profit coefficient method and an equivalent cost method were proposed to carry out benefit–cost analysis of multifunctional indicators of hierarchical ESS for comprehensive evaluation in [11]. Data envelopment analysis (DEA) is a multivariate analysis tool used to evaluate the relative effectiveness of multiple decision-making units (DMUS) of the same type [12,13]. When there are multiple simultaneous effective DMUS, the SE-DEA model can be adopted to realize further ordering of effective DMUS [14]. A comprehensive evaluation model based on fuzzy DEMATEL and SE-DEA was established in [15], which realized the effective construction of input–output evaluation index system, but it still could be further optimized in the quantitative processing of expert fuzzy language.
To improve the utilization rate of the ESS and expand the benefits of ESPs, this study analyzes ESS schemes based on functional combination under source-grid-load scenarios. The comprehensive benefit evaluation model of ESPs based on intuitionistic trapezoidal fuzzy (ITF)-DEMATEL and SE-DEA for verification is established. The rest of this paper is arranged as follows: Section 2 presents the functional combination analysis of energy storage, while in Section 3, a comprehensive evaluation index system is established. Subsequently, Section 4 proposes a fuzzy DEMATEL method for dividing input–output indicators and an SE-DEA model for comprehensive benefit evaluation. Finally, the functional-combination-based comprehensive benefit evaluation method of ESPs under source-grid-load scenarios is validated through the case study in Section 5.
Compared with the existing research work, the innovations and contributions of this study are as follows:
(1)
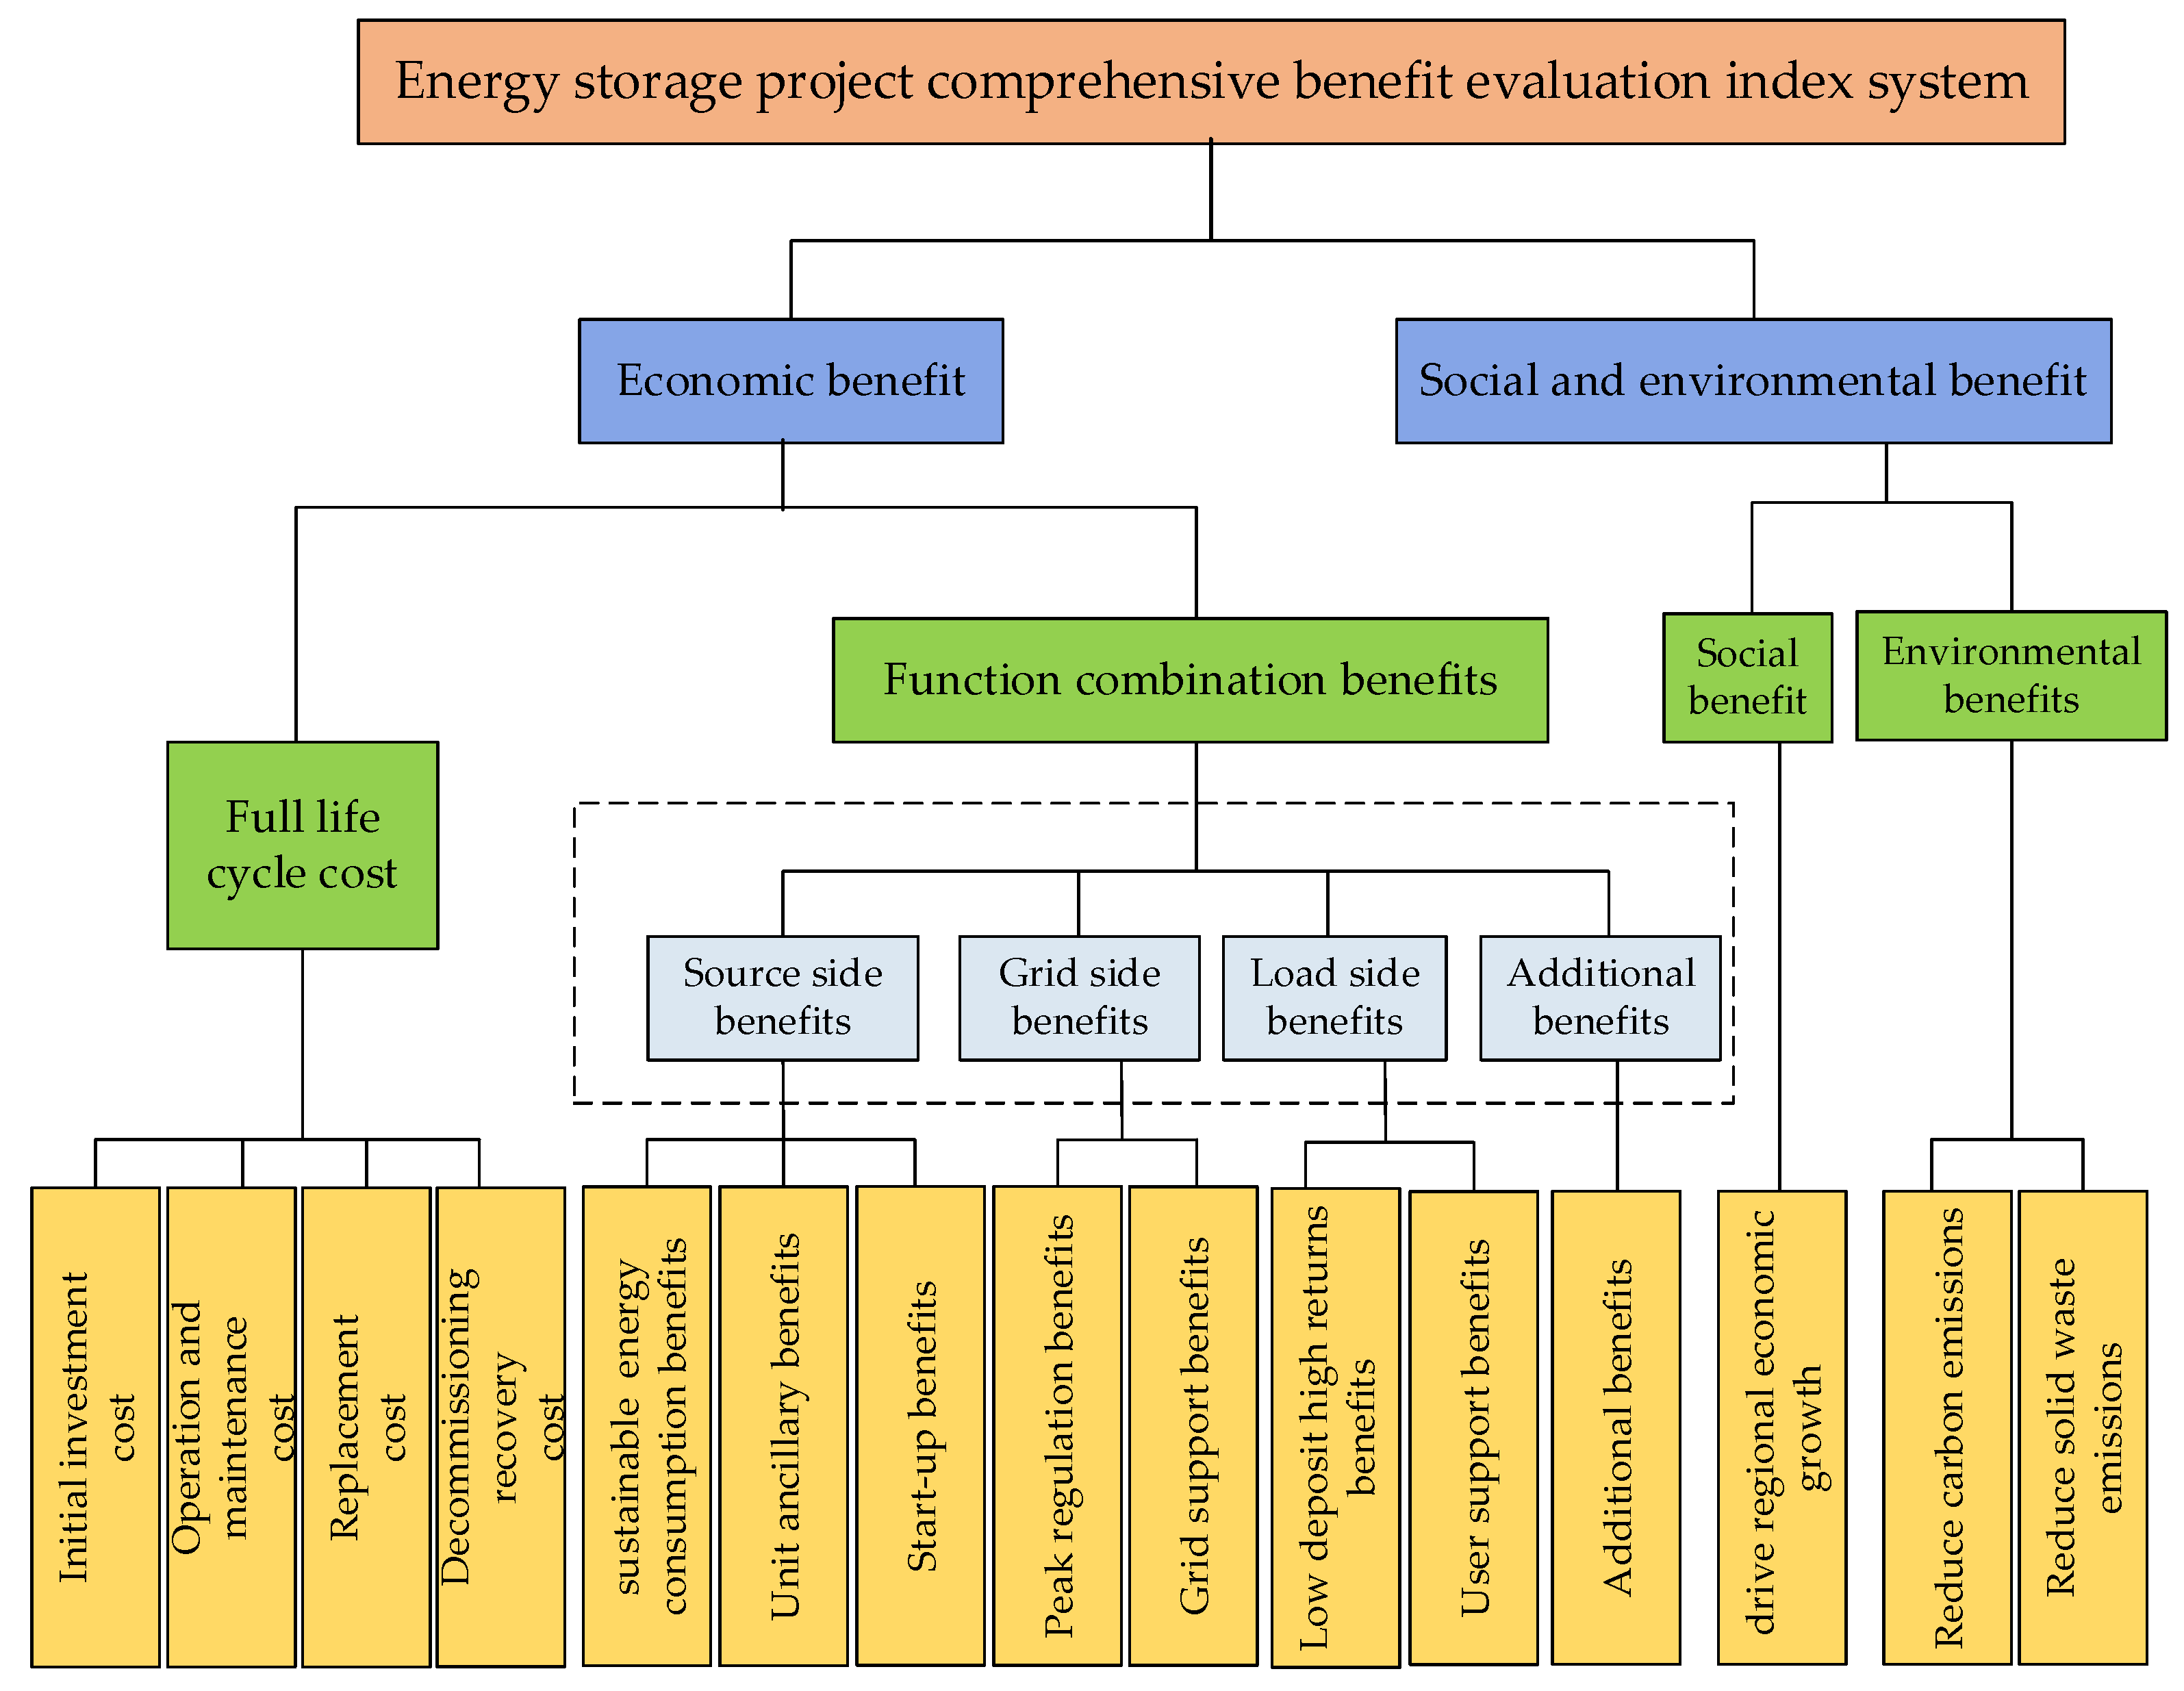
Various functional characteristics of source-grid-load sides are analyzed and eight functional combination schemes are formed. Based on the profit coefficient method and equivalent cost method, the functional combination benefit index is established, which is combined with the whole life cycle cost and social and environmental benefits to form the comprehensive benefit evaluation index system of ESPs.
(2)
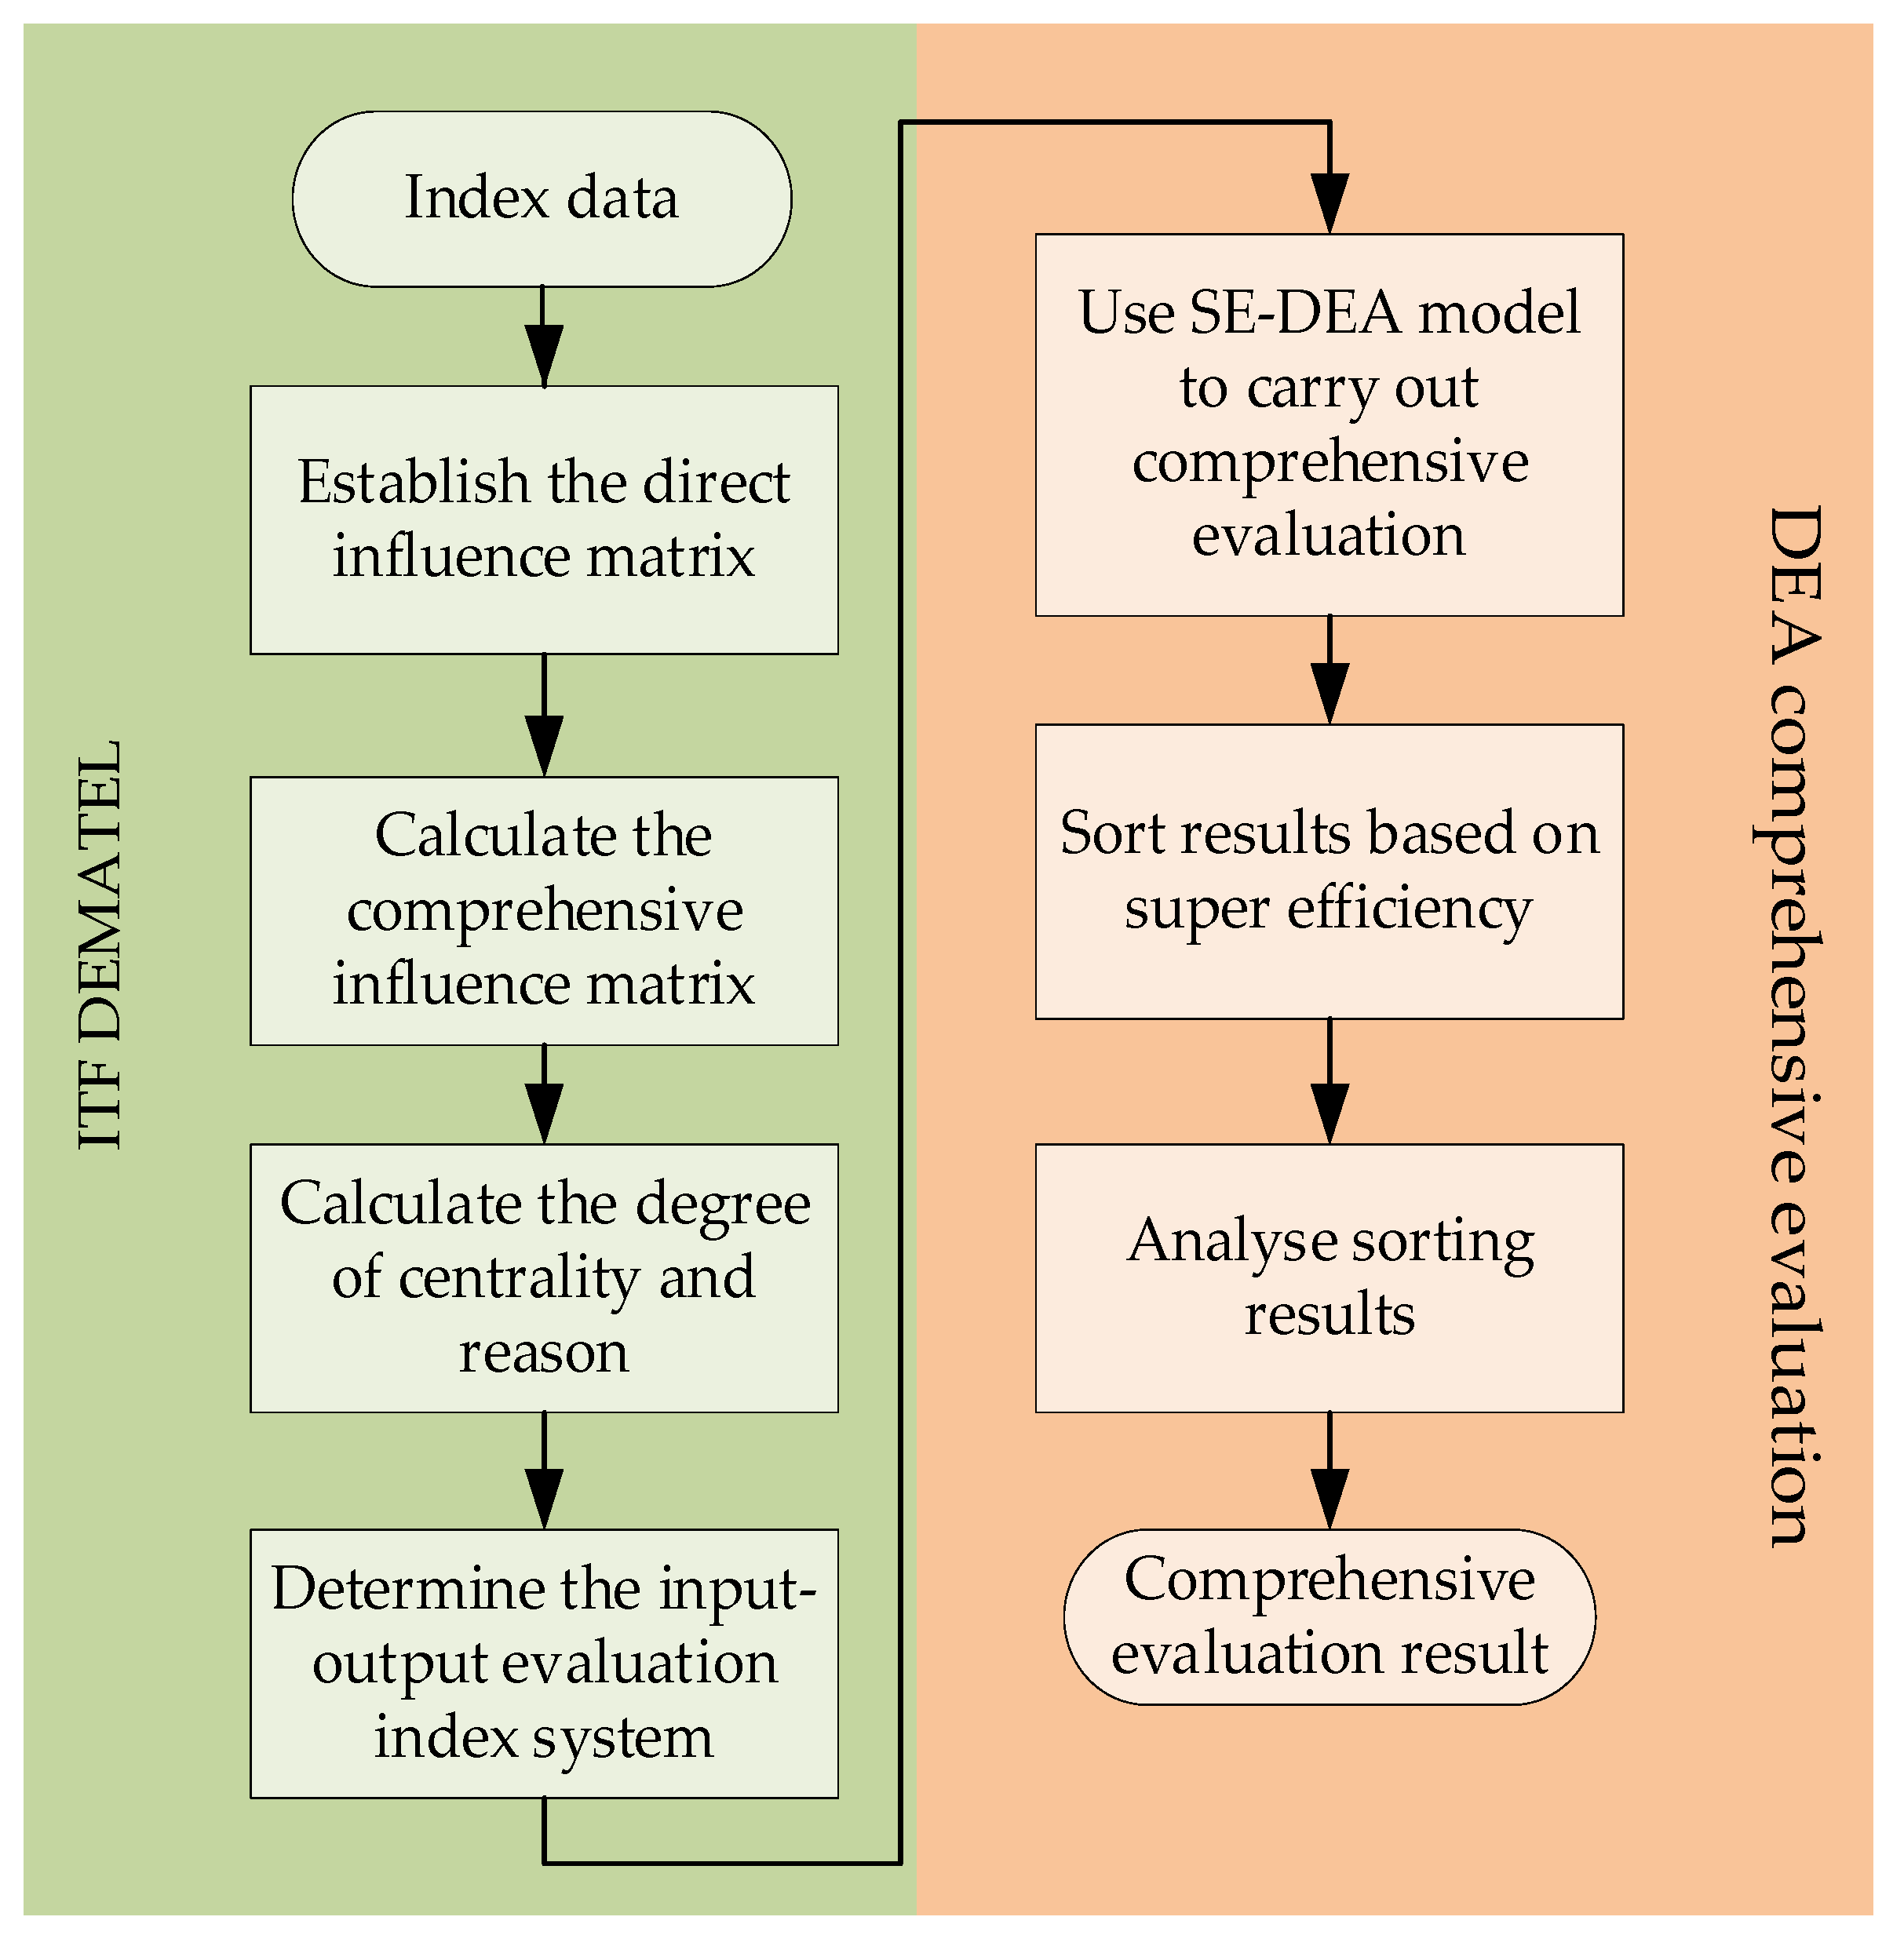
ITFN is combined with the traditional DEMATEL method to analyze the correlation and causality among the indices, and an input–output evaluation index system based on the analysis results of the indicators is built.
(3)
A comprehensive evaluation method based on fuzzy DEMATEL and SE-DEA is proposed. The rationality and effectiveness of the proposed method are verified through examples, which can provide reference for improving the operational planning of ESPs.

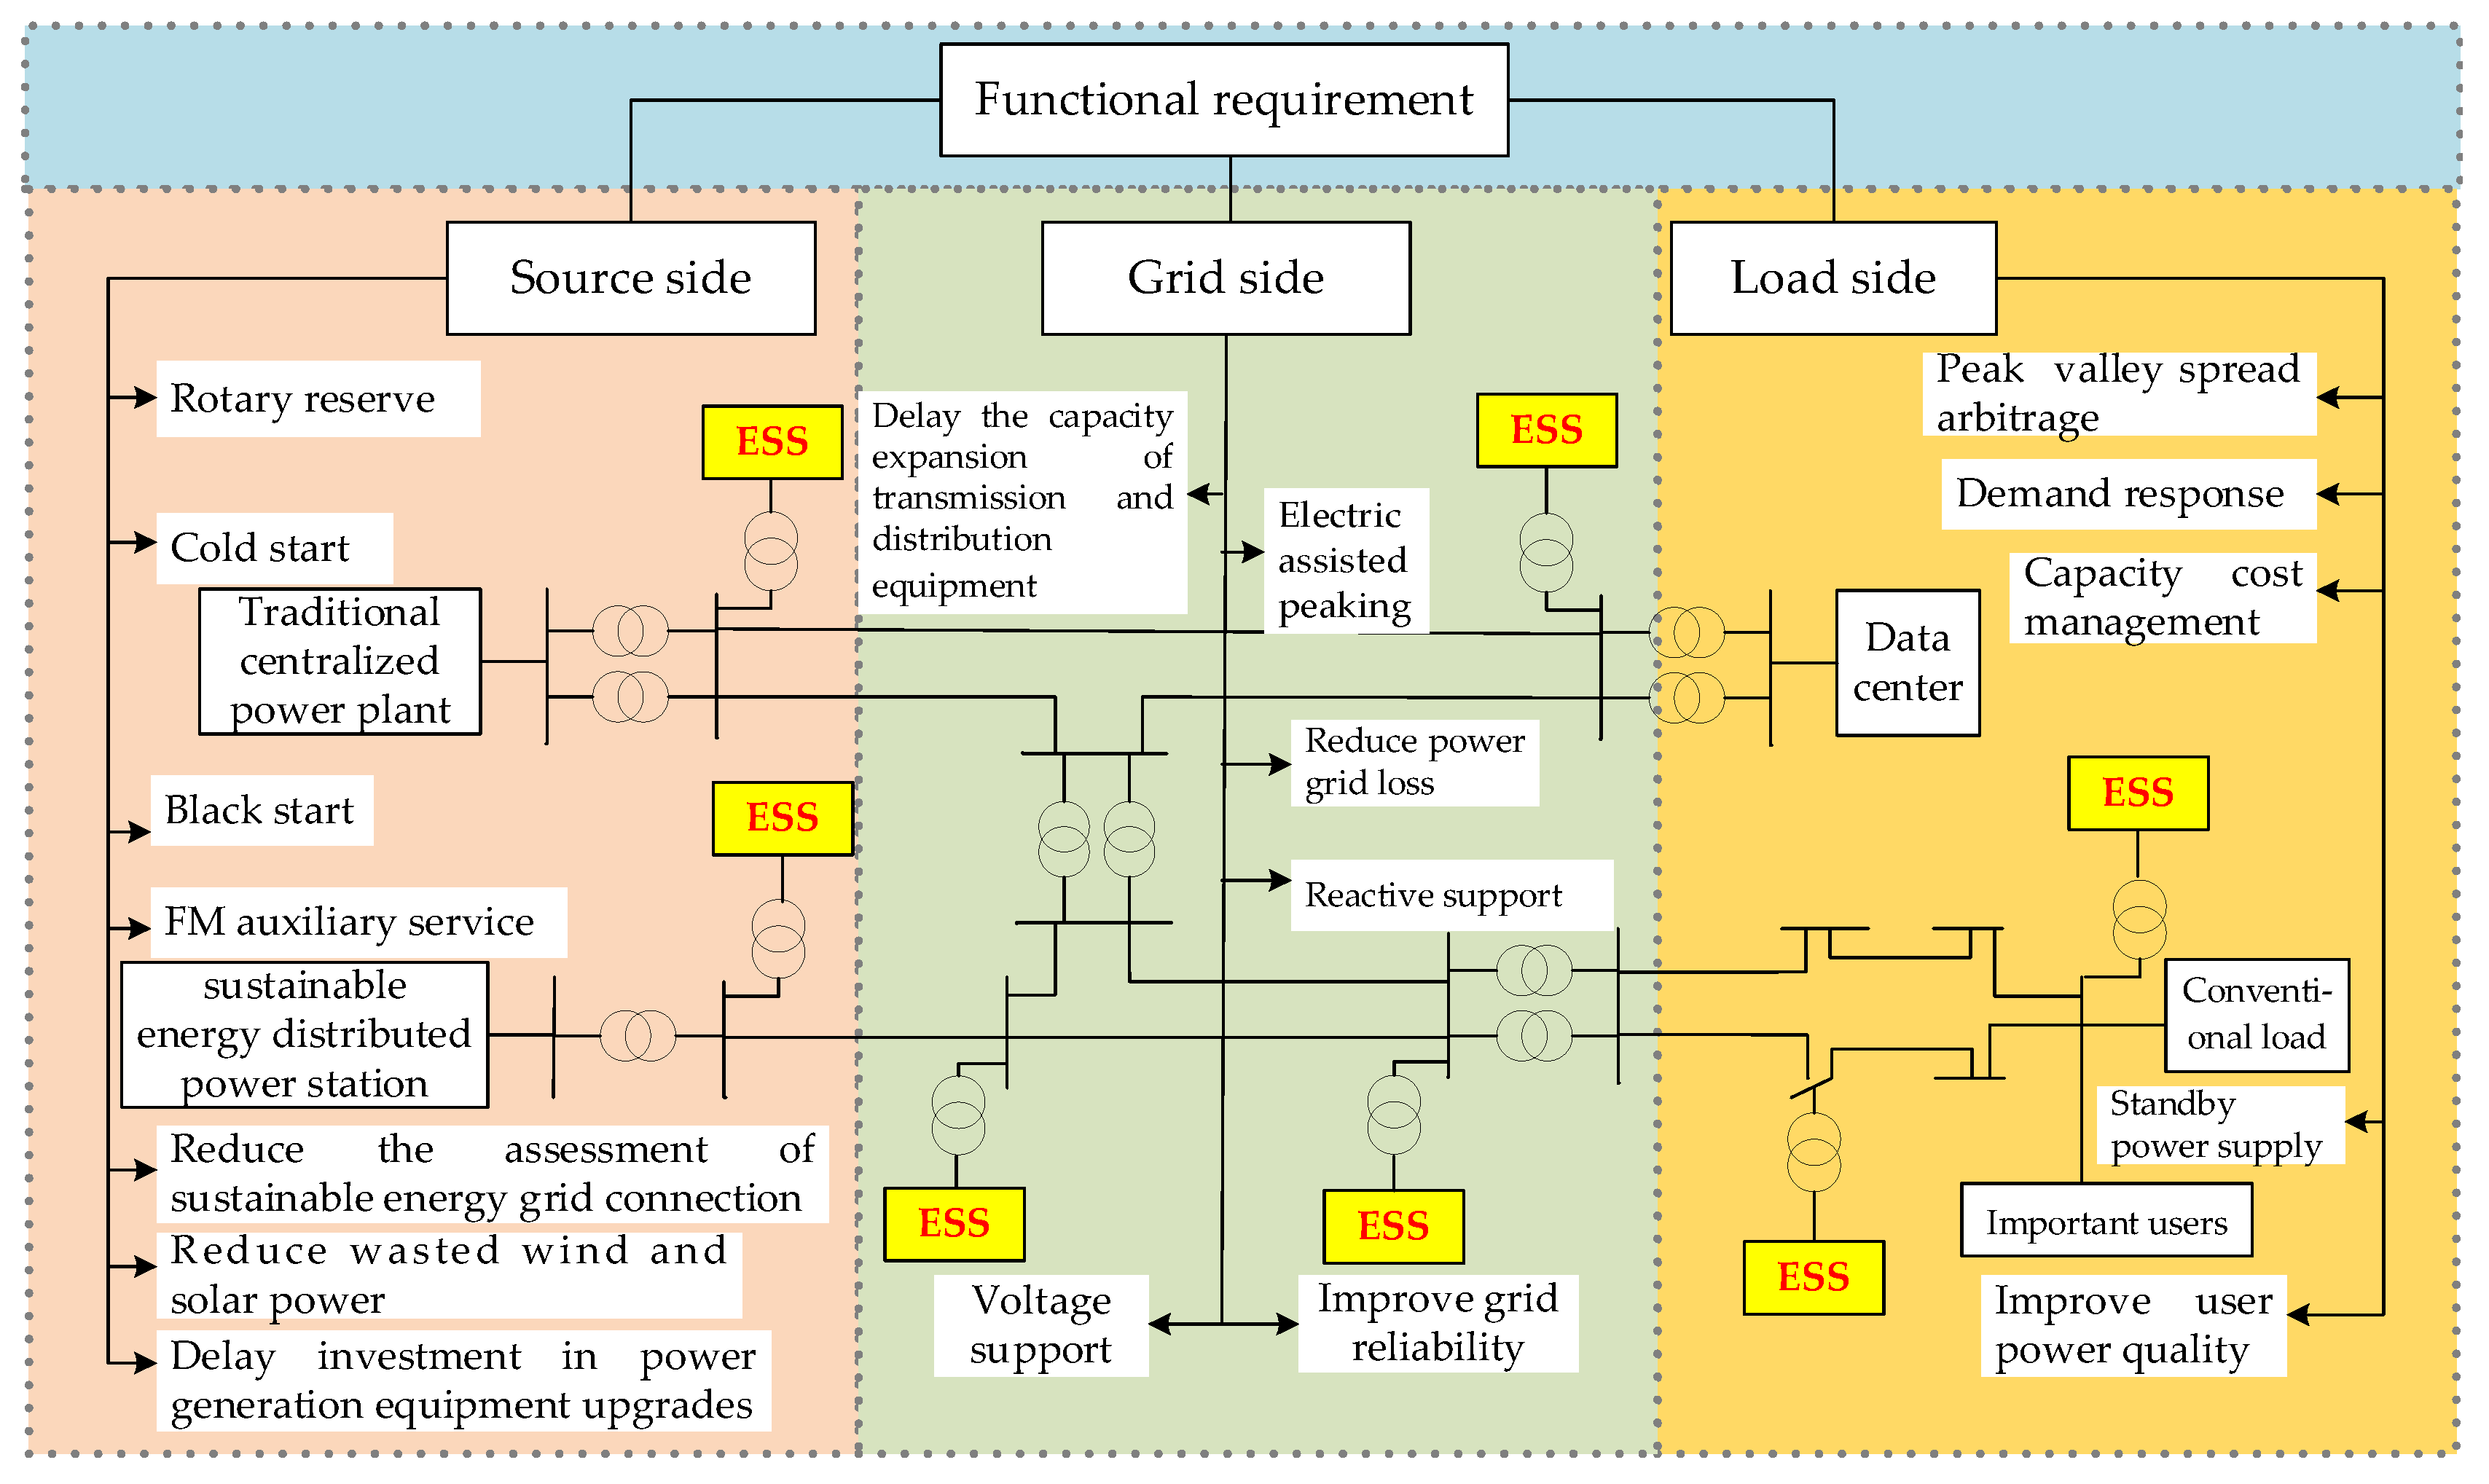
2. Functional Combination Analysis of Energy Storage

According to the installation position in a power system, the application scenario of energy storage can be divided into three categories: source, grid, and load side. This study firstly studies the various functions that energy storage can achieve in different application scenarios; hen, considering the mutual exclusion among different kinds of functions in charge and discharge state, working period and required capacity, the functional combination schemes of energy storage projects are proposed.

2.1. Functional Analysis

Figure 1 shows the main function of an ESS under a source-grid-load scenario. The following mainly summarize the ESS’s function under different scenarios, so as to find the functional combination scheme of the ESS in each scenario.

2.1.1. Source Side

(1)
Reduce sustainable energy grid-connected assessment: sustainable energy grid-connected consumption has an impact on the stable operation of the system, and an ESS can assist grid-connected function [16].
(2)
Reduce wind and light abandonment: abandoned power of sustainable energy is stored and transferred for grid connection at other times. The characteristics of sustainable energy generation make this function appear more frequently [17,18].
(3)
Black start: after the failure or power outage of the power system, the power system can be restarted by using the ESS as the backup power supply [19].
(4)
Cold start: an ESS can quickly release energy during cold start by storing a large amount of electrical energy, providing the high power output required for start-up [20].
(5)
Rotary backup: when an ESS is used as rotary backup, it can provide the rapid adjustment ability and stability support of the power system in the short term [21].
(6)
Delaying power generation equipment upgrade investment: through the adjustment capacity of an ESS and the absorption of sustainable energy, the additional load demand can be met, the frequency and voltage support can be involved, and the demand for new power generation equipment and upgrade investment can be delayed [1].
(7)
Frequency control and ancillary service: the response speed of an ESS for frequency modulation auxiliary service is high, which can be used as a frequency modulation resource [22].

2.1.2. Grid Side

(1)
Power auxiliary peak regulation: an ESS can absorb electric energy in the off-peak period of power load and release electric energy in the peak period of power load to alleviate the contradiction between unbalanced power supply and demand caused by the large difference between peak and valley [23].
(2)
Improve the reliability of the power grid: the ESS enhances the stability and reliability of the power grid by providing backup capacity and rapid adjustment ability [24].
(3)
Delay the capacity expansion of transmission and distribution equipment: the power load is less than or close to the rated load during most of the year, and energy storage is used to deal with the insufficient capacity of the grid during peak hours, so as to alleviate the investment pressure of expansion construction [25].
(4)
Reactive power support: when the reactive power in the power system is unbalanced, the ESS realizes reactive power compensation adjustment to the power grid by rapidly adjusting reactive power output [26].
(5)
Voltage support: by installing an ESS on the transmission and distribution lines, reactive power can be absorbed or injected to adjust the transmission voltage and maintain the stable operation of the transmission and distribution lines [27].
(6)
Reduce network loss: the ESS is used as the load to store electric energy during the valley, and as the power source to release electric energy during the peak, so as to reduce the current on the line during the peak load and reduce the network loss [28].

2.1.3. Load Side

(1)
Peak–valley spread arbitrage: in a period of low electricity price, electricity is purchased and stored by an ESS. In the peak period, the stored electricity is used and the price difference is used to obtain income [29].
(2)
Capacity cost management: an ESS is used to store electric energy during the valley period of power consumption, and discharge it during the peak period of power consumption, which can replace part of the power supply of the power grid, thereby reducing the cost of capacity management [29].
(3)
Improve user power quality: an ESS can reduce problems such as voltage rise and frequency fluctuation to reduce the loss caused by power quality events [30].
(4)
Demand response: the ESS responds to market price signals, incentive mechanisms, or instructions issued by operators to change its short- or long-term operation strategies [31].
(5)
Backup power supply: for some clients with high requirements for reliability, an ESS can provide continuous power supply in the event of power failure or failure [29].

2.1.4. Source-Grid-Load System

Whether on the power source side, the power grid side, or the load side, after the energy storage equipment participates in the system operation, it reduces the output of high-emission units such as coal-fired power stations and gas-fired power stations, thereby reducing pollution and carbon emissions and saving coal resources. On the other hand, due to the emerging nature of the ESS, the profit model and market mechanism are not mature enough, and for the purpose of incentive and protection, the construction and operation of ESPs at the regional level can receive the corresponding subsidies. The above technical and economic benefits presented in the overall system can be regarded as additional benefits to achieve scenario functions, including coal-saving benefits [32], carbon emission reduction benefits [33], and government subsidies [34].

2.2. Functional Combination Schemes

(1) Functional combination on the power source side:
With the promotion of the double-carbon policy and large-scale sustainable energy access to the power generation side, because of the randomness and intermittence of wind power and photovoltaic output, the absorption of sustainable energy in the power generation side has become a major problem and an important indicator of the power generation side assessment. While reducing wind and light abandonment, energy storage equipment also reduces the assessment cost of sustainable energy grid connection, so those two effects can be regarded as combined income generators in the process of promoting the consumption of sustainable energy. The ESS on the power source side often makes output adjustments due to the demand of the power grid side. The technical characteristics of charge and discharge give it great flexibility in the functional response of the power source side, and therefore good income prospects. While serving the functional demands of rotary backup and frequency modulation, the ESS can also slow down the pressure of the unit itself and delay the investment in power generation equipment upgrading. The complementarity of the three functions can be seen as the auxiliary income combination of the energy storage on the power source side. In the case of failure, in order to help the restart and normal operation of the generator set, the combination of the two functions of the energy storage black start and cold start can realize the combination of start-up benefits under the failure.
(2) Functional combination on the power grid side:
When an ESS on the power grid side responds to the grid dispatching demand instructions, it can realize the role of auxiliary peak load balancing, delaying the expansion of transmission and distribution equipment and reducing network loss. The complementarity of the three functions can be seen as the combination of auxiliary peak regulation benefits of energy storage on the power grid side. While responding to reactive power support, energy storage on the power grid side will also play a supporting role in node voltage, thereby improving the reliability of power transmission and distribution. The complementarity of the three functions can be regarded as the combination of grid support benefits of an ESS on the power grid side.
(3) Functional combination on the load side:
Under normal operation, the energy storage on the load side mainly uses the peak–valley price difference to make profits with the higher power grid operators. While realizing the arbitrage of the peak–valley price difference, it can realize the functional requirements of demand response and capacity cost management, and the three functions are used as a combination of low storage and high discharge functions. According to the scheduling needs of emergency situations, an ESS can be used as a backup power supply for continuous power supply of important loads, while improving the power quality of users. Those two functions can be combined as user auxiliary functions.
(4) Additional function combination:
After the energy storage equipment is configured in the system, whether it is on the power source side, power grid side, or load side, the ESS participates in the system operation, partially reducing the output of high-emission units such as coal-fired power stations and gas-fired power stations, thereby reducing pollution and carbon emissions, saving coal resources. On the other hand, due to its emerging technology, the ESS is not mature enough in terms of profit model and market mechanism. For the purpose of incentive and protection, the implementation and operation of ESP are subsidized at the regional level. Therefore, after the configuration of an ESP in the sustainable energy power system, it can receive government subsidies, carbon emission reduction benefits, and coal-saving benefits at the same time.
Based on the above analysis, eight functional combination schemes of ESS in different application scenarios are obtained, as shown in Table 1.

3. Establishment of Comprehensive Evaluation Index System

In order to realize the evaluation of ESPs based on functional combination, the comprehensive benefit evaluation index system is constructed from multiple levels including economy, society, and environment, as shown in Figure 2.
From the economic perspective, this study chooses the whole life cycle cost and functional combination benefits as constituent indicators [35]. The life cycle cost of an ESS includes the initial investment cost, operation and maintenance cost, replacement cost, and decommissioning recovery cost.
In the process of realizing various functional combinations, an ESS produces explicit or implicit economic benefits, but also needs to pay the initial investment, operation and maintenance costs, and other costs. Taking into account the mutual exclusion of different kinds of functions in charge and discharge status, working period, and required capacity, simply adding up the benefits brought by different functions in the combination will cause large errors in the technical and economic analysis of an ESP. In order to avoid the problem of repeated calculation of some components in the total revenue assessment, two methods are used to measure the benefits of an ESP in the power system: the profit coefficient method and the equivalent cost method [11].
Index calculation based on the profit coefficient method and the equivalent cost method can reflect the diversity of the functions and control objectives of the ESS and ensure the completeness of the benefit types. In addition, the classification and integration of the income of different functions also enable the relative values of various indicators to reflect the degree of functional requirements and the degree of demand satisfaction. The benefit evaluation indices of energy storage based on functional combination proposed in this study are as follows.
(1) Source side
① Sustainable energy consumption benefits
When an ESS on the power source side plays the function of reducing the abandonment of wind and light, it can also reduce the cost of sustainable energy grid connected assessment at the same time. The cost of reducing the construction of conventional power sources in other ways is used to represent the benefits of promoting sustainable energy consumption, which is calculated by the profit coefficient method and recorded as index P1.
P 1 = κ D E C B / C i ¯
where κ is the reduction coefficient of sustainable energy assessment cost compared with previous years; C B , C i ¯ are the ESS cost and the average cost of typical conventional power supply; and D E is the variance value of the wind power output obtained according to the Beta probability density distribution shown in Equations (2) and (3) [11]. According to [36], the wind and solar power output is viewed based on a typical output curve, without considering the influence of uncertainty.
f ( P ) = Γ ( α + β ) Γ ( α ) Γ ( β ) ( P P max ) α 1 ( 1 P P max ) β 1
D E = α β ( α + β ) 2 ( α + β + 1 ) P max 2
② Unit ancillary benefits
In this study, the ESS is compared with hydropower units, gas units, and coal-fired units commonly used as scheduling power supply. Considering the investment cost per unit capacity, scheduling response performance, and unit upgrade delay time, the response performance is expressed by T = {climbing ability, response time, response accuracy, adjustment amplitude}, which is calculated by equivalent substitution method and recorded as index P2.
P 2 = n c i = 1 4 T b i C B T ¯ i C ¯ i
where T b i , T ¯ i are the response performance indicators of the ESS and other power supplies, and n c is the delayed investment in upgrading power generation equipment.
③ Start-up benefits
Considering the small failure probability of the power source side unit, but the importance of the smooth start of the unit in the process of power grid, fault start-up benefit is calculated by the profit coefficient method and recorded as index P3.
P 3 = n b s I / C B
where nbs is the number of failed startups in a year and I is start-up income [37].
(2) Grid side
① Peak regulation benefits
Benefits such as power auxiliary peak regulating, delaying the expansion of transmission and distribution equipment, and reducing network loss are generated by the energy storage device transferring a certain amount of electricity within a specified period, which can be calculated by the profit coefficient method and recorded as index P4 [11]
P 4 = E i / [ ( c p + c w ) / ( L D O D ) + c m ]
where c p , c w , c m are the unit power cost, energy cost, and maintenance cost of the ESS; DOD and L are equivalent discharge depth and life span, respectively; and E i represents a collection of benefits such as reduced net loss.
② Grid support benefits
The three functions of reactive power support, voltage support, and reliability improvement of the grid are directly related, but the voltage support benefits are difficult to quantify. Considering the effect of voltage support, the profit coefficient method is used to establish the index P5 [11].
P 5 = η E i / [ ( c p + c w ) / ( L D O D ) + c m ]
where E i is a collection of benefits to support reactive power and improve grid reliability, and η is the improvement coefficient of voltage deviation.
(3) Load side
① Low-storage/high-discharge benefits
Peak–valley spread arbitrage, capacity cost management, and demand response use the time-of-use electricity price mechanism to obtain benefits while responding to grid scheduling, which can be calculated by the profit coefficient method and recorded as index P6 [11]. The processing method for load demand is based on the typical load demand curve, as summarized in Section 5.5 of [36].
P 6 = E i 2 / [ ( c p + c w ) / ( L D O D ) + c m ]
where E i 2 represents a collection of gains such as peak–valley spread arbitrage.
② User support benefits
All kinds of loads, especially important loads, often have less frequent but necessary targeted demand for power supply, and at these times, energy storage is generated to fulfill the functional requirements of backup power supply and power quality improvement. These user-assisted benefits are calculated by the equivalent substitution method and recorded as index P7.
P 7 = n z C B C ¯ i
where n z is the single-year frequency of participation in user assistance services.
(4) Additional benefits
The additional benefits of the system include coal-saving benefits, carbon emission reduction benefits, and government subsidies. Such benefits are related to the discharge capacity of energy storage equipment, which are calculated by the equivalent substitution method and recorded as index P8.
P 8 = P E C B P i C ¯ i
where P E and P i are the ESS annual discharge capacity and load value, respectively.
In terms of social and environmental benefits, investment in ESPs can promote the regional economy and stimulate regional economic growth, which can be expressed by the GDP growth rate. As for environmental benefits, traditional thermal power plants not only produce high carbon emissions but also release solid wastes such as dust particles, pulverized coal ash and slag. The operation of ESPs helps to reduce such environmental impacts. The efficiency of ESPs is expressed by reduced carbon emissions and solid waste emissions, which are calculated as follows:
(1) The growth rate of gross domestic product is expressed as in (11) [38]:
Δ α = α α 0
where Δα is the added value to the gross product growth rate; α is the gross product growth rate after the energy storage project; and α0 is the gross product growth rate without the energy storage project.
(2) Reduced carbon emissions
Carbon emissions can be calculated by (12), (13), and (14) [39].
D c = λ c C
λ c = α c γ c
C = k c b c Δ N 10 7
where Dc is the carbon emission that can be reduced (10,000 tons); λc is the carbon emission reduction coefficient; C is the coal consumption that can be reduced (10,000 tons); αc is the carbon content; γc is the carbon release rate; kc is the coefficient of converting standard coal into coal; bc is the coal consumption used to produce one degree of electricity (kg/kWh); and ΔN is the amount of electricity on the generating side that can be saved (kWh).
(3) Reduced solid waste emissions
Solid waste generated by thermal power plants mainly includes dust particles and pulverized coal ash. Both of them can cause environmental pollution and even damage human health in severe cases, which can be calculated by (15) and (16) [38].
D G = λ G C
λ G = α G γ G
where DG is the solid waste emission that can be reduced (10,000 tons); λG is the emission reduction coefficient of solid waste; αG is the solid waste content rate of coal consumed; and γG is the solid waste release rate.

4. Fuzzy DEMATEL and the SE-DEA Model

4.1. Intuitive Trapezoidal Fuzzy Number

It is supposed that A is an intuitive trapezoidal fuzzy number [40] on a real number set R, A = ( a 1 , a 2 , a 3 , a 4 ) , ( b 1 , b 2 , b 3 , b 4 ) ; μ A , ν A , the parameter range is b 1 a 1 b 2 a 2 a 3 b 3 a 4 b 4 , and its membership and non-membership functions can be expressed as in (17) and (18):
μ A ( x ) = { x a 1 a 2 a 1 μ A a 1 x < a 2 μ A a 2 x a 3 a 4 x a 4 a 3 μ A a 3 < x a 4 0 e l s e
ν A ( x ) = { b x + ν A ( x a 1 ) b a 1 a 1 x < b ν A b < x c x c + ν A ( d 1 x ) d 1 c c < x d 1 0 e l s e
defining the degree of hesitation as π A ( x ) = 1 μ A ( x ) ν A ( x ) .
Set A 1 = ( a 11 , a 12 , a 13 , a 14 ) , ( b 11 , b 12 , b 13 , b 14 ) , A 2 = ( a 21 , a 22 , a 23 , a 24 ) , ( b 21 , b 22 , b 23 , b 24 ) as two intuitive trapezoidal fuzzy numbers, and the distance between them as [40]:
d = { 1 12 ( i = 1 4 ( a 2 i a 1 i ) 2 + i = 1 4 ( a 2 i a 1 i ) 2 + ( a 21 a 11 ) ( a 22 a 12 ) + ( a 23 a 23 ) ( a 24 a 14 ) + ( b 21 b 11 ) ( b 22 b 12 ) + ( a 23 a 13 ) ( a 24 a 14 ) ) } 1 2
A new kind of trapezoidal fuzzy number [ a , b , c , d ] is added on the basis of the traditional intuitive fuzzy set. By extending its domain from discrete set to continuous set, membership and non-membership are not limited to uncertain information such as “good” or “bad”. Compared with traditional intuitionistic fuzzy numbers, they express different dimensions of evaluation information, but can truly reflect evaluation information.

4.2. Fuzzy DEMATEL Method

DEMATEL is a method to analyze the influential factors of complex systems. The important influential factors, the degree of influence, and the types of factors are clarified through the calculation of relevant indicators.
In this study, the hesitant fuzzy linguistic term set (HFLTs) [41] is used to collect the evaluation information of decision-makers, and a five-level evaluation semantic term is constructed. Table 2 is used to realize the conversion of the evaluation semantic term to ITFN.
It is supposed that there are m evaluation objects, and each object has n index attribute values. The language evaluation matrix of each index is obtained by the Delphi method, and then the language evaluation matrix is transformed into the intuitive trapezoid fuzzy number evaluation matrix by using the intuitive trapezoid fuzzy number.
(1) Establish the direct influence matrix. The expert evaluation group is composed of L experts and is denoted as D = ( D 1 , D 2 , , D L ) Each expert independently constructs a semantic direct-impact matrix based on the direction and degree of interaction between indicators. Combined with Table 1, it is converted into an intuitive trapezoidal fuzzy direct influence matrix Ak, and finally, the total direct influence matrix A is obtained by combining expert weights [15].
A k = [ 0 a 12 k a 1 n k a 21 k 0 a 2 n k a n 1 k a n 2 k 0 ]
a i j = k = 1 L ω k a i j k
A = [ 0 a 12 a 1 n a 21 0 a 2 n a n 1 a n 2 0 ]
where aijk represents the evaluation value of the kth expert on the degree of direct influence of index i on index j; n indicates the number of indicators; and ωk represents the weight of expert k.
(2) Calculation criteria direct-influence matrix. Firstly, the elements in the total direct influence matrix are de-fuzzified according to (17), and the de-fuzzified direct influence matrix E is obtained. Then the direct-influence matrix is normalized according to Formulas (18) and (19), and the standard direct-influence matrix X is obtained [15].
E = [ 0 a 12 a 1 n a 21 0 a 2 n a n 1 a n 2 0 ]
s = min { 1 max 1 j n i = 1 n a i j , 1 max 1 i n j = 1 n a i j }
X = [ x i j ] n × n = s E
(3) Calculate the comprehensive influence matrix.
T = lim k ( X + X 2 + X 3 + + X k ) = X ( I - X ) 1
where I is the identity matrix of order n.
(4) Calculate the influence degree and affected degree. The calculation formulas of influence degree P and affected degree Q are shown in (27) and (28) [15].
P = [ P i ] n × 1 = [ j = 1 n x i j ] n × 1
Q = [ Q j ] 1 × n = [ i = 1 n x i j ] 1 × n
(5) Calculate the centrality degree and cause degree [15].
M i = P i + Q i U i = P i Q i
where Mi is the centrality degree of the index and Ui is the cause degree of the index. The centrality of the index reflects the position and importance of the index in the index system, and the cause of the index reflects the influence of the index on the system. If the cause degree is greater than 0, it indicates that the influence of the index on other indicators is greater than that of other indicators on it, which is called the cause index. If the cause degree is less than 0, it indicates that the influence of this index on other indicators is less than that of other indicators on it, which is called the result index. A cause degree equal to 0 indicates that the influence of this index on other indicators is equal to the influence of other indicators on it, and this index can be eliminated. From the perspective of economic management of an input–output relationship, a cause index and result index can be understood as an input index and output index, respectively.
Label the overall benefit indicators in Figure 2 from left to right as R1, R2, R3, R4, R5, R6, R7, R8, R9, R10, R11, R12, R13, R14, R15. Five experts in related fields are invited to construct the semantic direct-influence matrix by pairwise comparison, assuming that the evaluation weights of each expert are the same. Combined with Table 2, it is converted into an ITF direct-impact matrix, and the comprehensive impact matrix is calculated. The influence degree, affected degree, centrality degree, and cause degree of each index are calculated from (27)–(29), as shown in Table A1 of the Appendix A, and the centrality–causality scatter plot is drawn, as shown in Figure 3.
In Figure 3, the indicators falling in the cause factor and result factor areas are classified as input and output indicators that affect the comprehensive benefit of an ESP based on functional combination. That is, the initial investment cost, operation and maintenance cost, replacement cost, and decommissioning recovery cost of the whole life cycle cost constitute the input index system, respectively marked as X1, X2, X3, and X4. Eleven items, including functional combination benefits, social benefits, and environmental benefits, constitute the output index system and are marked as Y1~Y8, Y9, Y10, and Y11; among them, Y1~Y8 does not include dimension in the comprehensive benefit evaluation.
The input–output relationship based on ITF-DEMATEL is analyzed. The input–output index is composed of the whole life cycle cost, and the power and capacity allocation values are represented by the power cost and capacity cost, which together constitute the initial cost. In the functional combination benefits, power source side, power grid side, and load side benefits are dimensionless output indicators based on the profit coefficient method and equivalent cost method, and the value reflects the function output degree of various functional combinations under a certain power and capacity. During the whole life cycle of construction, operation, maintenance, and decommissioning of an ESP, it will have a certain impact on the external society and environment. Driving regional economic growth and reducing carbon emissions and solid waste emissions are all output effects in the whole life cycle process.

4.3. Comprehensive Evaluation Process Based on the SE-DEA Method

The SE-DEA model can realize the objective ordering of effective DMUs and non-effective DMUs simultaneously. The realization method is to exclude a certain DMU from the set of DMUs when evaluating it, so that the efficiency of the effective decision-making unit under the original model is greater than 1 under the super-efficiency DEA model, while the estimated efficiency value of the DMU that is invalid under the original model remains unchanged under the SE-DEA model, as shown in (30) [14].
min ρ { j = 1 , j o n X j λ j + S ρ X o j = 1 , j o n Y j λ j S + Y o λ j 0 , j = 1 , 2 , , n ( j o ) S , S + 0
where ρ is the efficiency value; X j = ( x l j , x 2 j , , x m j ) , x i j is the ith input index of DMUj; Y j = ( y l j , y 2 j , , y r j ) , y s j is the sth output index of DMUj; output weight and input weight are α = ( α 1 , , α r ) T and β = ( β 1 , , β m ) T , respectively; λj is the weight coefficient; and S and S+ are relaxation variables of input and output, respectively.
The basic premise of the application of the SE-DEA model is to determine the input–output index system. The traditional input–output index system construction method does not analyze the internal logic and interaction between the indicators, so it is difficult to ensure that it is scientific and accurate. Therefore, this study introduces fuzzy DEMATEL to improve the SE-DEA method. The specific algorithm flow is shown in Figure 4.

5. Case Study

5.1. Example Setting

With reference to the energy storage parameters and calculation example configuration in [36] based on the MATLAB platform for simulation, some parameters are shown in Table A2. By a traditional particle swarm optimization algorithm, lithium battery configuration was carried out on the source side, grid side, and load side, with four schemes formed on each side. Schemes 1–3, 5–7, and 9–11 only consider a single functional combination in turn; among them, the additional benefit combination is only considered on a grid side or load side that is more affected. Schemes 4, 8, and 12 consider the configuration results of multiple functional combinations. The specific settings for each scheme are shown in Table A3.
Due to the different installation locations and limited coverage area of energy storage, the functional combination benefits that can be realized are different. In order to further compare the benefit differences in different scenarios, it is assumed that the energy storage operation in a single scenario can realize all the functional benefits of the three sides, but the functional combination benefits of the energy storage project on the non-installation side are close to 0, which is represented by 1e−4. The values of input–output indicators are shown in Table A4 and Table A5.

5.2. Result Analysis

Based on the input–output index system determined by fuzzy DEMATEL, the SE-DEA model is used to comprehensively evaluate 12 configuration schemes based on functional combination. The evaluation results of each system are shown in Figure 5.
In the efficiency value calculation of configuration schemes 1 to 12, the value of multi-functional combination scheme 4 on the power source side is the highest among the three typical scenarios, reaching 2.209. Based on multi-function combination, it will promote the power and capacity optimization of the three functional combinations of sustainable energy consumption benefits, unit ancillary benefits, and start-up benefits. It can realize the complementarity of multiple functions in time, so as to achieve the maximum benefit of the ESS. Due to the most diverse functional service requirements on the power source side, output benefits that can be quantified after the functional response are the greatest, exceeding the energy storage output on grid side and load side. Among the four configuration schemes on power grid side and load side, the comprehensive efficiency value of the schemes obtained by considering the multi-function combination are the highest, which are scheme 8 and scheme 12, respectively, and the efficiency values of the two schemes reach more than 1.5, which is consistent with the starting point of optimizing the configuration based on the multi-function combination. This can make full use of the state of energy storage SOC at different periods under the support of the operation strategy, meet more functional requirements, and maximize the comprehensive benefits including cost of the whole life cycle and social and environmental benefits.

5.3. Comparative Analysis of Different Evaluation Methods

In order to verify the effectiveness of the evaluation method presented in this study, it is compared with the SE-DEA based on the traditional input–index system [42], the SE-DEA based on the triangular fuzzy DEMATEL input–output index system [7], and TOPSIS based on the entropy weight method [43]. The first method is purely subjective division of input–output indicators, while the second method combines triangular fuzzy numbers different from ITFN with DEMATEL. The third method is the TOPSIS ranking method based solely on objective weighting, which can help verify the effectiveness of using the SE-DEA method in ESP evaluation. The sorting results of different evaluation methods for the comprehensive benefit of an ESP are shown in Appendix A, Table A6.
From the comparison of the comprehensive evaluation results of various methods in Table A6, it can be seen that when the ITF DEA (BCC model) is used for calculation, the efficiency values of schemes 3, 4, 6, 7, 8, 10, 11, and 12 are 1. The SE-DEA model can be used to further accurately evaluate those units that achieve the highest efficiency in the process of project investment and operation, that is, configuration scheme 4. Compared with the calculation results of ITF and SE-DEA and traditional SE-DEA, the efficiency of scheme 4 is still the highest. The power supply side has the most functional service requirements in the three typical scenarios, the number of functional responses that can be realized simultaneously in a single functional combination is greater, and the demand and response frequency of different functional combinations in continuous periods is higher. The quantifiable output benefit has a higher scope and breadth compared with the input cost. Under the multi-objective optimization configuration, the utilization rate of energy storage on the power source side is higher, and its multi-functional combination benefit is higher than that on the power grid side.
The ranking of efficiency values of scheme 1 is quite different, and the scheme ranks lower in the fuzziness evaluation, including triangular fuzzy DEA, but the traditional DEA method ranks it higher. Scheme 1 is the result of configuration with the goal of functional combination that promotes the maximum absorption benefit of sustainable energy. In actual operation, the utilization rate of energy storage equipment is often low due to the random characteristics of sustainable energy. When only the maximum benefit of the functional combination is considered, the evaluation opinions of experts through intuitive trapezoidal fuzzy processing can weaken the fuzziness of some experts in the consumption benefit of sustainable energy, so that it is closer to the reality. The results are similar to the TOPSIS evaluation results based on entropy weight, which further confirms the scientific nature of the intuitionistic trapezoid-fuzzy DEA method proposed in this paper.
In addition, the difference between the SE-DEA under ITF and triangular fuzzy is that when expert opinions are used to determine the DEMATEL input–output index system, the former can describe the distribution of fuzzy sets more flexibly and model the uncertainty of fuzzy sets more accurately, because it has two fuzzy values and two non-fuzzy values and can better describe the uncertainty situation in the reality. In the TOPSIS method calculation based on entropy weight, the weight value of the index determines the ranking result of the evaluation object to a large extent, and it is difficult to reflect the situation where the preference difference of decision-makers is large.
In the TOPSIS method based on entropy weight calculation, the weight value of indicators largely determines the ranking results of evaluation objects, which makes it difficult to reflect the situation where decision-makers have significant differences in preferences. The SE-DEA method proposed in this article is based on ITF-DEMATEL, which does not require manual determination of index weights. The evaluation results depend on the characteristics and patterns of the data themselves. Once the index data are determined, the evaluation results remain unchanged, ensuring the objectivity and stability of the evaluation results. For example, in the TOPSIS ranking based on entropy weight, scheme 8 scored the highest, while in the ranking by the method proposed in this study, scheme 4 scored the highest. The source side has the most functional service requirements among the three scenarios, and it can simultaneously achieve a larger number of functional responses in a single functional combination. The demand and response frequency of different functional combinations in continuous periods is higher, and the quantifiable output benefits have a higher range and breadth compared to input costs. Under multifunctional combination configuration, the utilization rate of the ESS on the source side is higher, and its multifunctional combination benefits are higher than those on the grid side.

6. Conclusions

The application of the ESS is becoming increasingly important for sustainable development. In this study, the SE-DEA evaluation method based on ITF DEMATEL is proposed to achieve comprehensive benefit evaluation of ESP, so as to achieve benefit analysis based on multi-scenario functional combination. The main conclusions are as follows:
(1)
The SE-DEA method based on ITF DEMATEL can flexibly describe the fuzziness of expert opinions and analyze the input–output relationship among indicators. Compared with conventional evaluation methods, the method proposed in this paper has certain advantages.
(2)
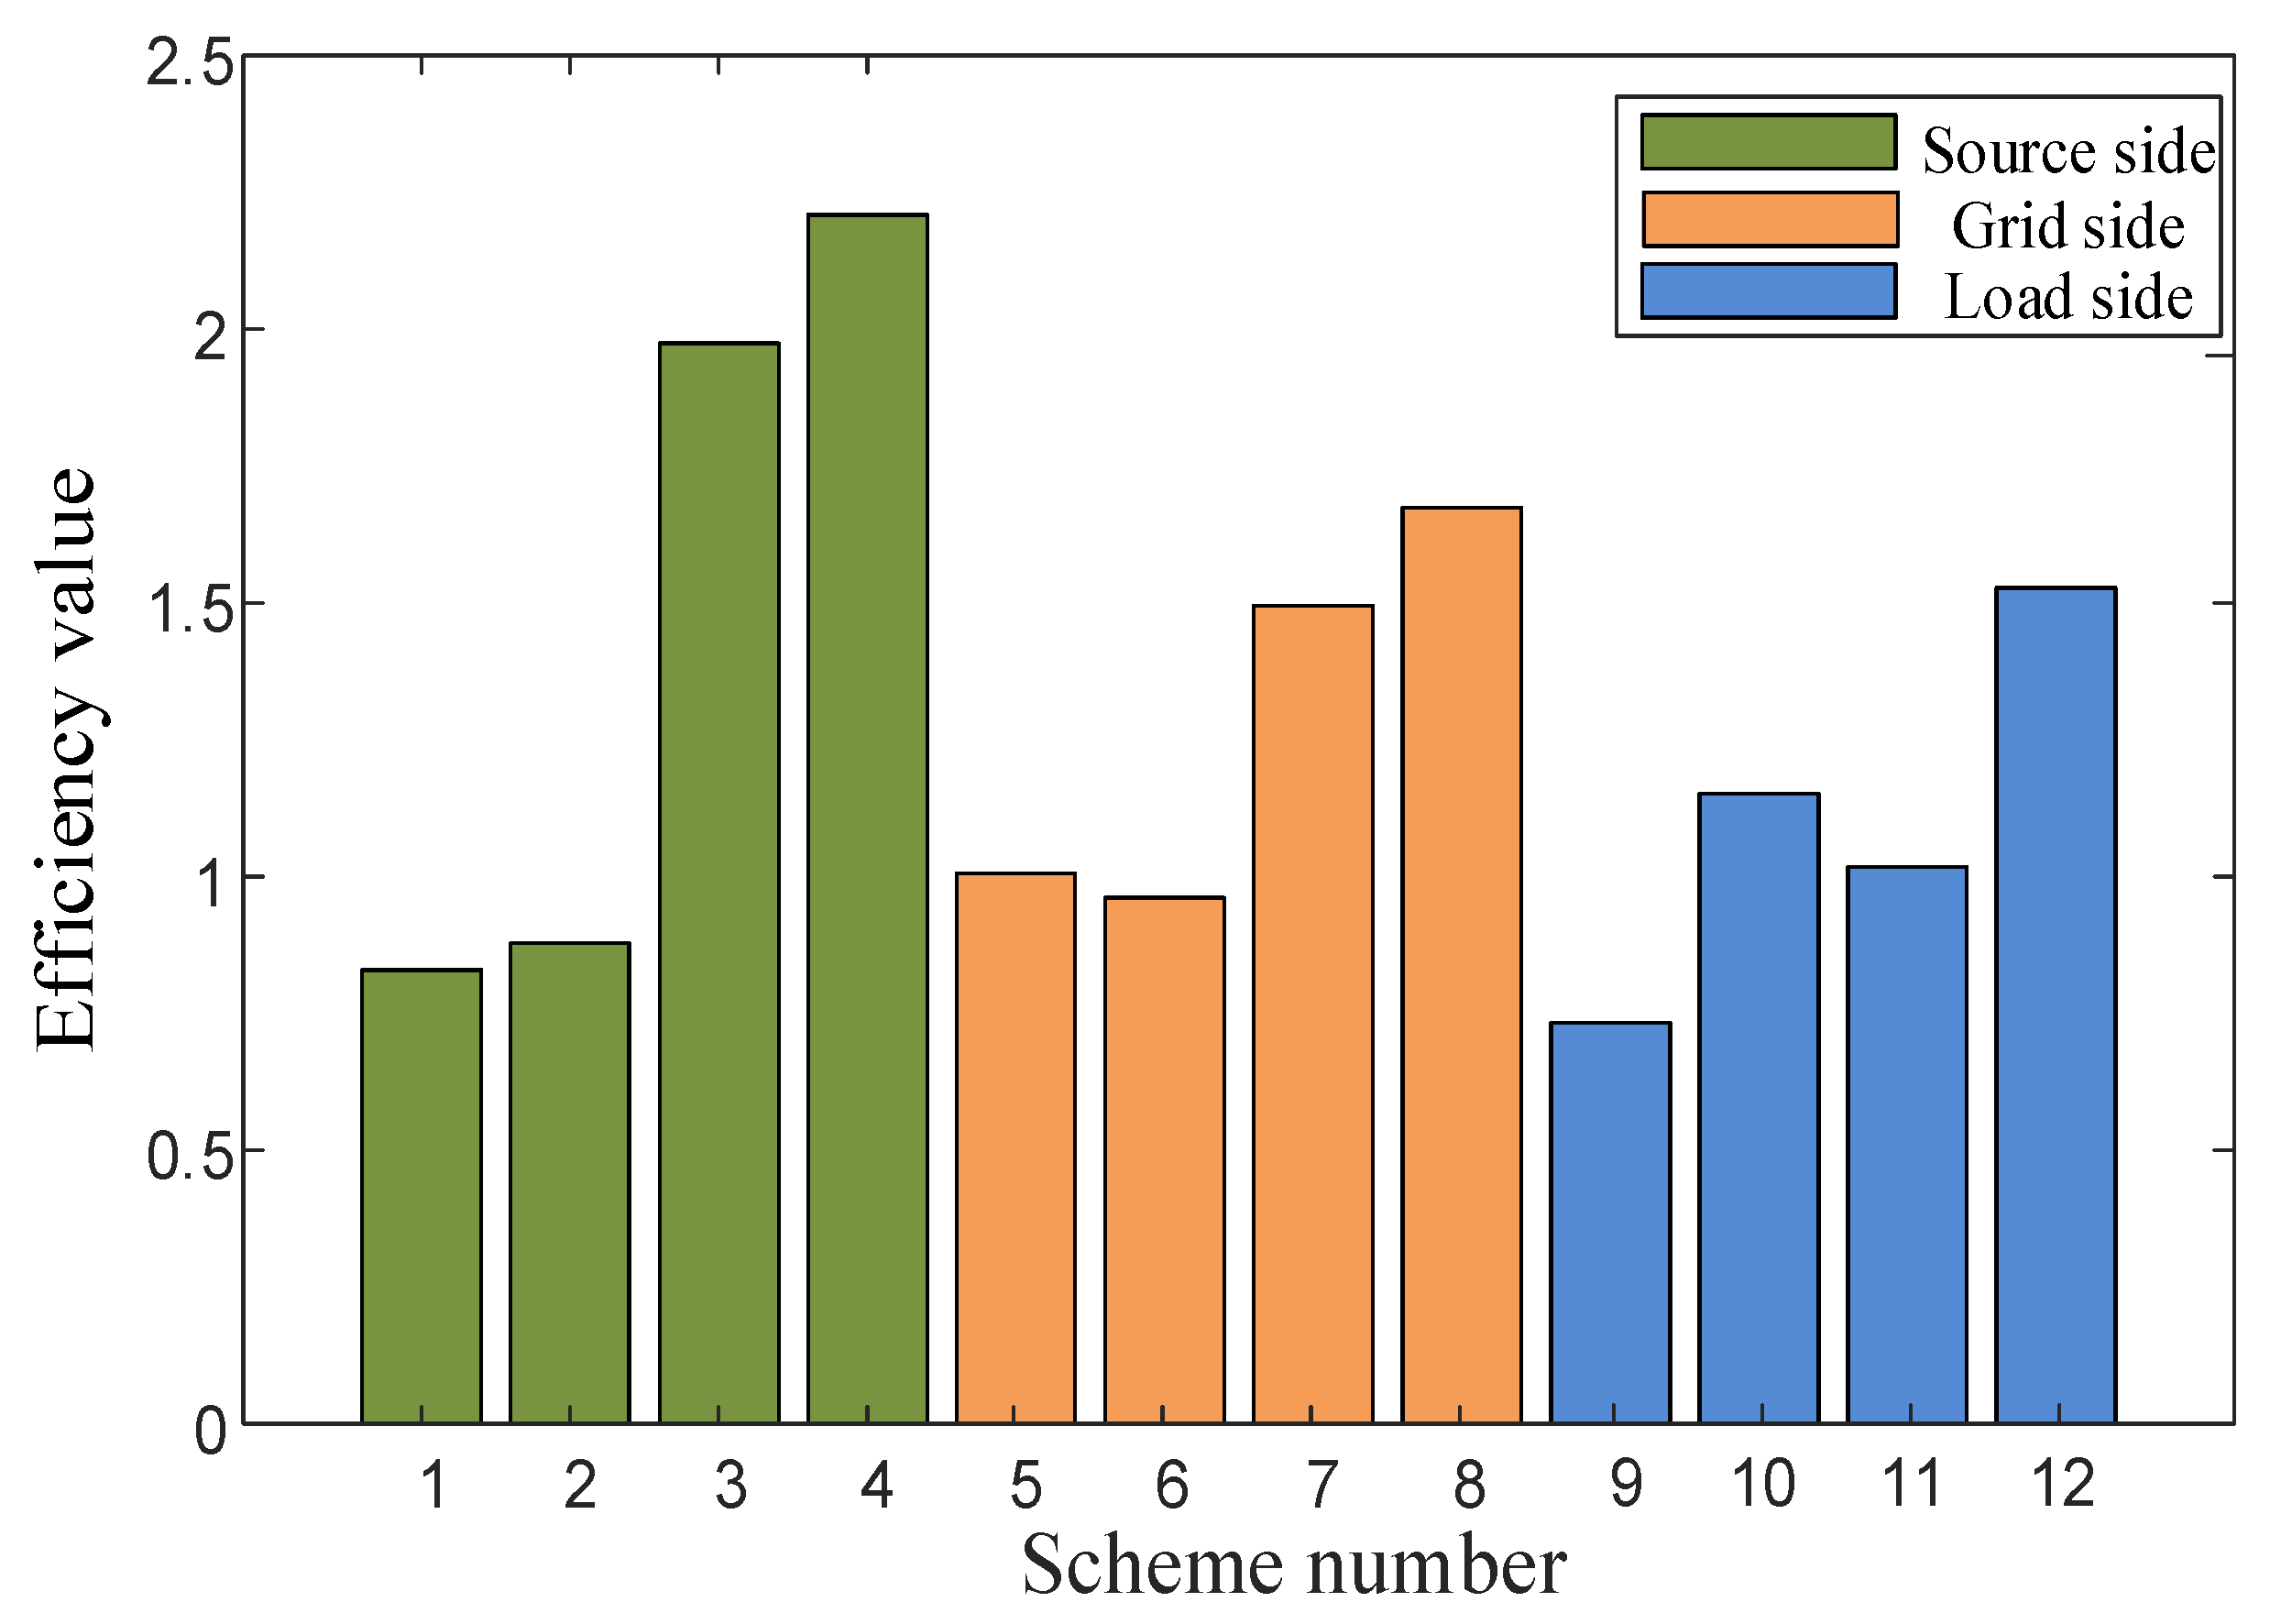
The functional combination can be leveraged to the fullest extent of the functionality of existing energy storage equipment and improve the efficiency of ESPs. This study can provide reference for the future operation planning of energy storage equipment. The results indicate that the multifunctional combination configuration scheme on the source side has the highest comprehensive benefit evaluation, with an efficiency value of 2.209.
In this study, the type of energy storage configured is not hybrid and the optimization configuration algorithm is traditional. Future studies should analyze the impact on the benefit improvement of functional combination in hybrids, such as an ESS of super capacitor and battery, and the comprehensive benefit evaluation of ESPs can be further improved with an advanced configuration algorithm.

Author Contributions

Methodology, H.Q.; Supervision, Z.Y. All authors have read and agreed to the published version of the manuscript.

Funding

This research received no external funding.

Institutional Review Board Statement

Not applicable.

Informed Consent Statement

Not applicable.

Data Availability Statement

No new data were created or analyzed in this study. Data sharing is not applicable to this article.

Conflicts of Interest

The authors declare no conflict of interest.

Appendix A

Table A1. Fuzzy DEMATEL analysis results.
IndexInfluence Degree pAffected Degree
q
Centrality Degree
m
Causality Degree
n
R15.71370.78216.49584.9316
R24.23511.22135.45643.0138
R32.42561.23333.65891.1923
R41.92551.02532.95080.9002
R50.85614.78625.6423−3.9301
R61.85444.22216.0765−2.3677
R70.56440.94211.5065−0.3777
R81.25464.87526.1298−3.6206
R92.12515.21567.3407−3.0905
R101.95424.26876.2229−2.3145
R111.01213.21024.2223−2.1981
R120.82921.52252.3517−0.6933
R132.52142.82735.3487−0.3059
R141.73242.52434.2567−0.7919
R151.68912.52254.2116−0.8334
Table A2. Partial parameters of ESP.
ParameterUnitValue
Power cost coefficient¥/kW1500
Capacity cost coefficient¥/kWh3000
Operation and maintenance cost coefficient¥/kW0.05
SOC range%20–80
Overall performanceAnnual decay rate0.4%
Personnel expenses10,000 ¥/year6
Carbon emission reduction coefficientton/a Ton of coal0.716
Carbon content%90
Coal conversion coefficient%92
Solid waste emission reduction coefficientKg/a Ton of coal30
Other expenses¥10,00056
Return and disposal10,000 ¥/MWh20
Battery lifeyear10
Table A3. ESP configuration schemes.
ScenariosScheme NumberMain FunctionsRated Power/kwRated Capacity/kwh
Source side1functional combination ①4651455
2functional combination ②3571267
3functional combination ③237643
4functional combinations ①, ②, ③8592674
Grid side5functional combination ④4691373
6functional combination ⑤2851008
7functional combination ⑧184519
8functional combinations ④, ⑤, ⑧6942238
Load side 9functional combination ⑥6552014
10functional combination ⑦276788
11functional combination ⑧177483
12functional combinations ⑥, ⑦, ⑧10452823
Table A4. Input index value.
Scheme X 1
/¥10,000
X 2
/¥10,000
X 3
/¥10,000
X 4
/¥10,000
1868.813.98.2681.5
2675.1910.796.3167.5
3385.167.363.1538.16
41605.5225.6215.889.2
5461.7547.854.5242.35
6372.2333.353.5635.52
7190.6220.71.9118.6
8787.0282.57.8676.3
9702.4532.756.9870.03
10277.813.82.7127.67
11171.458.851.6717.15
121003.6552.2510.0291.2
Table A5. Output index value.
Scheme Y 1 Y 2 Y 3 Y 4 Y 5 Y 6 Y 7 Y 8 Y 9
/%
Y 10
/Tons
Y 11
/Tons
131.212.53.61e−41e−41e−41e−410.16.17.92.7
223.611.93.51e−41e−41e−41e−49.66.47.62.2
316.510.83.21e−41e−41e−41e−410.26.57.72.5
485.226.83.81e−41e−41e−41e−411.26.98.22.8
51e−41e−41e−430.943.21e−41e−49.85.37.32.2
61e−41e−41e−420.226.71e−41e−49.55.77.42.1
71e−41e−41e−412.714.31e−41e−46.23.15.22.2
81e−41e−41e−485.392.61e−41e−419.920.219.84.2
91e−41e−41e−41e−41e−437.130.69.14.56.92.5
101e−41e−41e−41e−41e−422.516.95.22.643.5
111e−41e−41e−41e−41e−49.16.23.91.82.52.11
121e−41e−41e−41e−41e−492.985.112.58.19.64.12
Table A6. Comparative results of different evaluation methods.
Scheme ITFN
DEA
ITF
SE-DEA
SE-DEA Triangular Fuzzy
SE-DEA
Entropy-Based TOPSIS
EfficiencyNo.EfficiencyNo.EfficiencyNo.ClosenessNo.
10.82960.8296111.065880.7274100.300710
20.87840.8784100.8760120.6851110.30259
311.973821.189042.273820.44563
412.20912.117112.959110.48962
511.005881.054991.055580.35376
60.96090.960991.126470.843290.32848
711.494651.616131.374140.44164
811.673832.059621.253250.49931
90.73290.7329120.9808110.6384120.266312
1011.151261.189651.182560.42125
1111.017771.0459101.085970.35277
1211.527741.185361.924530.283111

References

  1. Li, J.; Jiang, Y.; Ma, S.; Cui, Y.; Guo, X. Application scenario and optimal configuration of distributed energy storage in new power system. High Volt. Technol. 2024, 50, 30–41. [Google Scholar] [CrossRef]
  2. China Electricity Council. New Energy Distribution and Energy Storage Operation Research Report; China Electricity Council: Beijiing, China, 2022; Available online: https://cec.org.cn/detail/index.html?3-315493 (accessed on 14 November 2022).
  3. China Electricity Council. Industry Statistics of Electrochemical Energy Storage Power Station in the First Half of 2023; China Electricity Council: Beijiing, China, 2023; Available online: https://cec.org.cn (accessed on 10 November 2023).
  4. Xiong, X.; Yang, R.; Ye, L.; Li, J. Economic evaluation of large-scale energy storage system on power demand side. Trans. China Electrotech. Soc. 2013, 28, 224–230. [Google Scholar] [CrossRef]
  5. Lou, S.; Yi, L.; Wu, Y.; Hou, T.; Yang, Y. Battery energy storage capacity optimization based on variable life model. Trans. China Electrotech. Soc. 2015, 30, 265–271. [Google Scholar] [CrossRef]
  6. Nejad, B.M.; Vahedi, M.; Hoseina, M. Economic model for coordinating large-scale energy storage power plant with demand response management options in smart grid energy management. IEEE Access 2023, 11, 16483–16492. [Google Scholar] [CrossRef]
  7. Zhao, M.; Zhao, H.; Huo, H. Comprehensive evaluation of user energy storage system configuration schemes based on the improved triangular fuzzy VIKOR method. Electr. Power 2022, 55, 185–191. [Google Scholar]
  8. Yi, C.; Qi, Q.; Long, Z. New energy storage technology of the Chinese patent layout analysis. Energy Storage Sci. Technol. 2024, 1–10. [Google Scholar] [CrossRef]
  9. Bie, Z.; Li, G.; Xie, H. Microgrid reliability assessment considering load and energy storage coordination optimization. Trans. China Electrotech. Soc. 2014, 29, 64–73. [Google Scholar] [CrossRef]
  10. Qi, F.; Wei, G.; Sun, J. Equipment in-service assessment based on intuitionistic trapezoidal fuzzy TOPSIS. Ordnance Ind. Autom. 2023, 42, 1–5+10. [Google Scholar] [CrossRef]
  11. Lei, Q.; Miao, S.; Guo, B.; Sun, Q.; Ye, C. Comprehensive evaluation of layered energy storage system based on hierarchical analysis and improved approach to ideal solution. Power Syst. Prot. Control. 2017, 45, 13–19. [Google Scholar]
  12. Goto, M.; Tomikawa, T.; Sueyoshi, T. Efficiency and Mergers and Acquisitions of Electric Utility Companies. Energies 2024, 17, 1972. [Google Scholar] [CrossRef]
  13. Hmamed, H.; Benghabrit, A.; Cherrafi, A. Achieving a sustainable transportation system via economic, environmental, and social optimization: A comprehensive AHP-DEA approach from the waste transportation sector. Sustainability 2023, 15, 15372. [Google Scholar] [CrossRef]
  14. Ishida, R.; Goto, M. Integrated efficiency of Japan’s 47 prefectures incorporating sustainability factors. Energies 2024, 17, 1910. [Google Scholar] [CrossRef]
  15. Peng, L.; Miao, W.; Cun, D. Comprehensive benefit evaluation method of renewable energy power generation technology based on fuzzy Dematel-Superefficiency DEA. Power Grid Technol. 2023, 1–12. [Google Scholar] [CrossRef]
  16. Li, S.; Ma, Y.; Zhang, C.; Yu, J. Static voltage stability prediction for PCCs of new energy power stations in the grid-connected system. J. Phys. Conf. Ser. 2022, 2369, 012037. [Google Scholar] [CrossRef]
  17. Zhao, J.; Su, J.; Pan, F.; Yang, Y.; Chen, M.; Zhang, Y. Dual-objective optimization planning of distributed energy storage in active distribution network considering photovoltaic fluctuations. Renew. Energy 2022, 40, 1546–1553. [Google Scholar] [CrossRef]
  18. Zhang, W.; Li, Z.; Chen, D.; Li, Y.; Di, W. Random optimal configuration and location method of distributed energy storage system on distribution network side. High Volt. Electr. Appar. 2023, 59, 125–135. [Google Scholar] [CrossRef]
  19. Heidari-Akhijahani, A.; Butler-Purry, K.L. A review on black-start service restoration of active distribution systems and microgrids. Energies 2024, 17, 100. [Google Scholar] [CrossRef]
  20. Lin, X.; Wang, W.; Zhao, J.; Li, Y. Temporally and distributionally robust optimization for cold-start recommendation. Proc. AAAI Conf. Artif. Intell. 2024, 38, 8750–8758. [Google Scholar] [CrossRef]
  21. Zhu, Z.; Wang, X.; Wu, X. Operation Strategy for composite energy storage participating in electric energy and ancillary service markets. Autom. Electr. Power Syst. 2023, 18, 80–90. [Google Scholar] [CrossRef]
  22. Guo, Y.; Li, A.; Sun, W. Frequency regulation bidding strategy of energy storage power station considering price prediction. Proc. CSEE 2024, 1–12. [Google Scholar] [CrossRef]
  23. Guan, Y.; Zhang, C.; Zhang, Z. Virtual power plant planning considering multi-dimensional generation-load correlation and peak shaving ability. Power Syst. Technol. 2024, 1–13. [Google Scholar] [CrossRef]
  24. Zhang, S.; Li, Y.; Liu, W. Economic, low-carbon and reliable multi-objective optimal configuration method of cloud energy storage for microgrid clusters. Autom. Electr. Power Syst. 2024, 48, 21–30. [Google Scholar] [CrossRef]
  25. Deng, S.; Liu, W.; Liu, C.; Liu, Q.; Li, S.; Liu, Z. Energy storage planning and decision-making method of distribution network considering double uncertainty and comprehensive efficiency. Energy Storage Sci. Technol. 2022, 11, 164–175. [Google Scholar] [CrossRef]
  26. Ruihuan, R. Research on optimal distribution of distributed energy storage in intelligent distribution network. Electr. Appl. 2021, 40, 31–35. (In Chinese) [Google Scholar]
  27. Wang, T.; Miao, S.; Yao, F. Multi-level energy storage collaborative optimization operation strategy for power systems considering frequency and voltage stability constraints. Trans. China Electrotech. Soc. 2024, 1–18. [Google Scholar] [CrossRef]
  28. Zhuang, Z.; Kong, Y.; Yang, S. Multi-objective optimization operation of distribution network virtual power plant based on AUGMECON2. Power Demand Side Manag. 2024, 26, 42–47. [Google Scholar] [CrossRef]
  29. Sun, B.; Zhang, Z.; Hu, J.; Meng, Z.; Huang, B.; Li, N. An energy storage capacity configuration method for a provincial power system considering flexible adjustment of the tie-line. Energies 2024, 17, 270. [Google Scholar] [CrossRef]
  30. Li, J.; Tan, Y.; Wang, H.; Huang, J. Optimization strategy of energy storage system configuration in distribution network and optical storage micro-network. High Volt. Technol. 2022, 48, 1893–1902. [Google Scholar] [CrossRef]
  31. Pan, T.; Xu, Y.; Wang, Y.; Cai, R.; Zeng, M. Integrated energy system scheduling optimization considering generalized integrated demand response. Mod. Power 2023, 1–10. [Google Scholar] [CrossRef]
  32. Yao, Y.; Wu, H.; Lin, D.; Wang, X. Multi-dimensional value evaluation and application of energy storage system in distribution network. Zhejiang Electr. Power 2022, 41, 36–45. [Google Scholar] [CrossRef]
  33. Xie, Y.; Li, Y.; Liu, Y.; Du, E.; Xu, Q.; Zhang, N. A preliminary study on a carbon-reducing user-side cloud energy storage model: Operation model and benefit analysis. Proc. CSEE 2023, 1–13. [Google Scholar] [CrossRef]
  34. Wu, Y.; Liu, Y.; Xu, L.; Li, J.; Hu, K. Energy trading model for community PV users based on multiple games with energy storage assistance. Electr. Power Constr. 2024, 1–14. (In Chinese) [Google Scholar]
  35. Xu, Z.; Zhang, H.; Zhang, W. Study on the whole life cycle cost of transmission line engineering with carbon price: An analysis from the perspective of new power system. Price Theory Pract. 2023, 166–169. [Google Scholar] [CrossRef]
  36. Li, C.; Wang, Y.; Li, J.; Zhang, Z.; Huang, J.; Cheng, P. Analysis of photovoltaic black-start energy storage configuration considering feasibility assessment. China South. Power Grid Technol. 2023, 17, 104–112. [Google Scholar] [CrossRef]
  37. Xiang, Q.; Cao, H. Forecast Analysis of probability distribution of China’s GDP growth rate based on quantile factor models. J. Cent. Univ. Financ. Econ. 2024, 04, 92–103. [Google Scholar] [CrossRef]
  38. Li, H.; Li, X.; Chen, S.; Li, S.; Kang, Y.; Ma, X. Low-carbon optimal scheduling of integrated energy system considering multiple uncertainties and electricity–heat integrated demand response. Energies 2024, 17, 245. [Google Scholar] [CrossRef]
  39. Zhao, Y.; Ding, Z.; Yang, C.; Cheng, Q.; Liu, Z. Reliability Allocation of Intuitive Trapezoidal Fuzzy Number and Entropy Weight-TOPSIS. Modul. Mach. Tool Autom. Process. Technol. 2022, 76–80+84. [Google Scholar] [CrossRef]
  40. Wu, Y.; Liao, M.; Hu, M.; Lin, J.; Zhou, J.; Zhang, B.; Xu, C. A decision framework of low-speed wind farm projects in hilly areas based on DEMATEL-entropy-TODIM method from the sustainability perspective: A case in China. Energy 2019, 213, 119014. [Google Scholar] [CrossRef]
  41. Zhang, T. Research on optimization and optimal configuration model of hybrid energy storage scheme for new power system. North China Electr. Power Univ. (Beijing) 2022. [Google Scholar] [CrossRef]
  42. Song, T.; Ye, Z.; Yao, Z. Optimal investment strategy of power grid enterprise technology transformation based on weighted DEA model. Microcomput. Appl. 2021, 37, 161–162+172. (In Chinese) [Google Scholar]
  43. Xiao, Y.; Xu, J. Risk assessment of battery safety operation of energy storage power station based on combination weighting and TOPSIS. Energy Storage Sci. Technol. 2022, 11, 2574–2584. [Google Scholar] [CrossRef]
Figure 1. Energy storage function under source-grid-load scenario.
Sustainability 16 04278 g001
Figure 2. Comprehensive benefit evaluation index system.
Sustainability 16 04278 g002
Figure 3. Centrality–causality scatter plot.
Sustainability 16 04278 g003
Figure 4. Evaluation process of ITF DEMATEL and SE-DEA.
Sustainability 16 04278 g004
Figure 5. Results calculated using SE-DEA.
Sustainability 16 04278 g005
Table 1. Functional combination schemes of energy storage in different application scenarios.
ScenesFunctional Combination NameThe Function Performed by the Combination
Source
side
① Sustainable energy consumption benefits① Reduce sustainable energy grid connection assessment;
② Reduce wasted wind and solar power.
② Unit ancillary benefits① Rotary backup; ② Frequency control and ancillary service;
③ Delay investment in power generation equipment upgrades.
③ Start-up benefits① Black start; ② Cold start.
Grid
Side
④ Peak regulation benefits① Power auxiliary peak load; ② Reduce network loss;
③ Delay the capacity expansion of transmission and distribution equipment.
⑤ Grid support benefits① Reactive support; ② Voltage support;
③ Improve grid reliability.
Load
side
⑥ Low storage high discharge benefits① Peak–valley spread arbitrage; ② Capacity cost management;
③ Demand response.
⑦ User support benefits① Standby power supply; ② Improve the power quality of users.
All sides⑧ Additional benefits① Government subsidies; ② Reduce carbon emissions;
③ Coal-saving benefits.
Table 2. Intuitive trapezoidal fuzzy number represents the transformation of language evaluation variables.
Language VariablesITFN
Extremely low ( 0.0 , 0.1 , 0.2 , 0.3 ) , ( 0.0 , 0.1 , 0.2 , 0.3 )
Low ( 0.1 , 0.2 , 0.3 , 0.4 ) , ( 0.0 , 0.2 , 0.3 , 0.5 )
Medium ( 0.3 , 0.4 , 0.5 , 0.6 ) , ( 0.2 , 0.4 , 0.5 , 0.7 )
High ( 0.5 , 0.6 , 0.7 , 0.8 ) , ( 0.4 , 0.6 , 0.7 , 0.9 )
Extremely high ( 0 .7 , 0.8 , 0.9 , 1.0 ) , ( 0.7 , 0.8 , 0.9 , 1.0 )
Disclaimer/Publisher’s Note: The statements, opinions and data contained in all publications are solely those of the individual author(s) and contributor(s) and not of MDPI and/or the editor(s). MDPI and/or the editor(s) disclaim responsibility for any injury to people or property resulting from any ideas, methods, instructions or products referred to in the content.

